Comparative Highway Bridge Design - web.wpi.edu · PDF fileSpecifications, a series of bridge...
236
1 Comparative Highway Bridge Design A Major Qualifying Project Report Submitted to the Faculty Of the WORCESTER POLYTECHNIC INSTITUTE By Adam Carmichael Nathan Desrosiers Date: 28 February 2008 Approved: Professor Leonard Albano, Advisor __________________________________________ Project Number: LDA0802
Transcript of Comparative Highway Bridge Design - web.wpi.edu · PDF fileSpecifications, a series of bridge...

1
Comparative Highway Bridge Design
A Major Qualifying Project Report
Submitted to the Faculty
Of the
WORCESTER POLYTECHNIC INSTITUTE
By
Adam Carmichael
Nathan Desrosiers
Date: 28 February 2008
Approved:
Professor Leonard Albano, Advisor
__________________________________________
Project Number: LDA0802

2
Abstract
This project outlines the design of both a steel and concrete girder system and their
respective components (piers, abutments, bearings, expansion joints, etc.) for a typical
highway overpass. Each system was compared on the premise of initial cost, life‐cycle cost
and constructability. The project was aided by the use of AASHTO LFRD Bridge Design
Specifications, a series of bridge engineering handbooks, and RISA’s structural engineering
software, in addition to many other sources. The goal of this project was to implement our
research though a hands on design and derive an analysis of construction and life‐cycle cost
to determine a cost effective solution for two common types of bridge designs.

3
Authorship
The Abstract, Authorship, Capstone Design, Introduction, Background, Methodology,
Evaluation of Alternatives, Related Issues for Costs, Funding, and Maintenance, and
Conclusion were equally contributed to by both Adam Carmichael and Nathan Desrosiers.
The following sections were completed by individuals:
4. Design
4.1 Deck ………………………………………..Adam Carmichael
4.2 Bearings…………………………………..Adam Carmichael
4.3 Stringers………………………………….Nathan Desrosiers
4.4 Piers………………………………………..Adam Carmichael
4.5 Abutments……………………………….Nathan Desrosiers
Adam Carmichael Nathan Desrosiers

4
Capstone Design
An important component of this project was to satisfy the ABET Capstone Design
requirements. Our project addressed the impact of several of the realistic constraints
including, economics, safety, reliability, manufacturability, aesthetics, and ethics within
bridge design. Safety and ethics are satisfied by the adherence to the AASHTO LFRD Bridge
Design Specifications. The safety of our design is ensured by abiding to the provisions
within AASHTO. As designers, ethics play a role in our responsibility to abide by all
governing standards and to conduct each design methodically, taking no shortcuts to save
time and in a real world application, money. On top of this, the analysis of life‐cycle cost
within our project ensures the fulfillment of both the economic and reliability aspects. As a
life‐cycle cost analysis includes an initial cost calculation, economical issues are heavily
considered in comparing the different designs. Also, the life‐cycle cost analysis deals with
variables such as future maintenance and ultimately the future value of each design, which
coincides with any reliability issues. In addition, the manufacturability or constructability
in this projects’ case was addressed and used to compare the three different designs. Lastly,
aesthetics were considered in the selection of each bridge component throughout our
design. With the combined effort of these elements, this project satisfies our Capstone
Design experience.

5
Table of Contents
Contents Abstract ......................................................................................................................................................... 2
Authorship .................................................................................................................................................... 3
Capstone Design ........................................................................................................................................... 4
Table of Contents .......................................................................................................................................... 5
List of Figures ................................................................................................................................................ 8
List of Tables ............................................................................................................................................... 10
1. Introduction ............................................................................................................................................ 11
2. Background ............................................................................................................................................. 12
2.1 Introduction ...................................................................................................................................... 12
2.2 The Superstructure ......................................................................................................................... 13
2.2.1 Wearing Course .......................................................................................................................... 14
2.2.2 Deck ............................................................................................................................................ 14
2.2.3 Cast‐in‐Place Concrete Slab ....................................................................................................... 14
2.2.4 Steel Orthotropic Plate .............................................................................................................. 15
2.2.5 Precast, Pre‐stressed Concrete Panels ....................................................................................... 15
2.2.6 Primary Members ...................................................................................................................... 15
2.2.7 Steel Stringers ............................................................................................................................ 16
2.2.8 Rolled Beam ............................................................................................................................... 16
2.2.9 Plate Girder ................................................................................................................................ 17
2.2.10 Concrete Stringers ................................................................................................................... 17
2.2.11 Pre‐stressed Concrete Girder ................................................................................................... 18
2.2.12 Concrete slab ........................................................................................................................... 18
2.2.13 Secondary Members ................................................................................................................ 19
2.2.14 Expansion Joints ....................................................................................................................... 19
2.3 The Substructure ............................................................................................................................... 20
2.3.1 Bearings ...................................................................................................................................... 20
2.3.2 Piers and Columns ...................................................................................................................... 22
2.3.3 Abutments ................................................................................................................................. 23
2.3.5 Retaining Structures ................................................................................................................... 25
6
2.3.6 Foundations ............................................................................................................................... 25
2.4 Highway Overpass Design ................................................................................................................. 26
2.5 Constructability Considerations ........................................................................................................ 27
2.6 Engineering Cost Estimate ................................................................................................................ 28
2.7 Life‐Cycle Cost Analysis ..................................................................................................................... 29
2. 8 Roles and Responsibilities of Transportation Agencies ................................................................... 31
2.9 Conclusion ......................................................................................................................................... 33
3. Methods .................................................................................................................................................. 34
3.1 Introduction ...................................................................................................................................... 34
3.2 Deck ................................................................................................................................................... 35
3.3 Girders ............................................................................................................................................... 36
3.4 Piers ................................................................................................................................................... 36
3.5 Abutments......................................................................................................................................... 37
3.6 RISA‐2D.............................................................................................................................................. 38
3.7 Engineering Cost Estimate ................................................................................................................ 40
3.8 Life‐Cycle Cost ................................................................................................................................... 41
3.9 Constructability ................................................................................................................................. 43
4. Design ...................................................................................................................................................... 45
4.1 Introduction ...................................................................................................................................... 45
4.2 Deck ................................................................................................................................................... 45
4.2.1 Design Process ........................................................................................................................... 45
4.2.2 Results ........................................................................................................................................ 46
4.3 Bearings ............................................................................................................................................. 51
4.3 Stringers ............................................................................................................................................ 52
4.3.1 Design Process ........................................................................................................................... 52
4.3.1.1 Rolled Steel Girder .................................................................................................................. 53
4.3.1.2 Steel Plate Girder .................................................................................................................... 53
4.3.1.3 Pre‐stressed Concrete Girder .................................................................................................. 54
4.3.2 Results ........................................................................................................................................ 54
4.5 Piers ................................................................................................................................................... 59
4.5.1 Design Process ........................................................................................................................... 59
4.5.2 Results ........................................................................................................................................ 61

7
4.5 Abutments......................................................................................................................................... 62
4.5.1 Design Process ........................................................................................................................... 62
4.5.2 Results ........................................................................................................................................ 65
5. Evaluation of Alternatives ....................................................................................................................... 67
5.1 Constructability ................................................................................................................................. 67
5.2 Initial Cost ......................................................................................................................................... 71
5.3 Life‐Cycle Results .............................................................................................................................. 73
6. Related Issues for Cost, Funding and Maintenance ................................................................................ 77
6.1 Impact of Constructing in Different Regions ..................................................................................... 77
6.2 State versus Federal Highway Funding ............................................................................................. 78
6.3 Impact of Nondestructive Testing on Bridge Inspecting ................................................................... 80
7. Project Conclusions ................................................................................................................................. 83
Sources ........................................................................................................................................................ 89
Appendix A: Proposal .................................................................................................................................. 92
Appendix B: Non‐ Composite Deck Hand Calculations ............................................................................. 129
Appendix C: Composite Deck Hand Calculations ...................................................................................... 144
Appendix D: Rolled Beam Hand Calculations ............................................................................................ 167
Appendix E: Plate Girder Hand Calculations ............................................................................................. 174
Appendix F: Prestressed Concrete Girder Hand Calculations ................................................................... 176
Appendix G: Pier Design Hand Calculations .............................................................................................. 195
Appendix H: Abutment Design Hand Calculations .................................................................................... 219
8
List of Figures Figure 1: Basic Bridge Components ........................................................................................................... 12 Figure 2: Superstructure components (Tonias, 1995) ................................................................................ 13 Figure 3: Steel Stringers .............................................................................................................................. 16 Figure 4: Beam Geometry and Designation (Tonias) .................................................................................. 17 Figure 5: Concrete Stringer ......................................................................................................................... 18 Figure 6: Typical roller bearing (Chen and Duan, 1999) Figure 7: Typical elastomeric bearing (Chen and Duan, 1999) ................................................................................................................................................. 21 Figure 8: Piers and Columns flow chart ...................................................................................................... 23 Figure 9: Open Ended Abutment ............................................................................................................... 24 Figure 10: Close Ended Abutment ............................................................................................................. 24 Figure 11: Cash Flow Diagram (NCHRP, 2007) ........................................................................................... 31 Figure 12: Factors Supporting Shift to a Quantitative Analysis (NCHRP, 2007) ......................................... 31 Figure 13: Methodology Organizational Chart........................................................................................... 34 Figure 14: Deck Design Process .................................................................................................................. 35 Figure 15: Girder Design Process ............................................................................................................... 36 Figure 16: Pier Design Process ................................................................................................................... 37 Figure 17: Abutment Design Procedure ..................................................................................................... 38 Figure 18: HS20‐44 Design Truck Loading .................................................................................................. 39 Figure 19: HS20‐44 Design Truck Loading With Load Factor of 1.6 ........................................................... 40 Figure 20: Sample Dead Load Configuration .............................................................................................. 40 Figure 21: Life‐Cycle Cost Analysis Procedure ........................................................................................... 43 Figure 22: Life‐Cycle Cost Value ................................................................................................................. 42 Figure 23: Performance Criteria Matrix ..................................................................................................... 44 Figure 24: Non Composite Deck Schematic ............................................................................................... 47 Figure 25: Composite Deck Reinforcement at Mid‐span of Girders .......................................................... 48 Figure 26: Composite Deck Reinforcement at Intermediate Pier .............................................................. 48 Figure 27: Screenshot of Excel Spreadsheet .............................................................................................. 49 Figure 28: Unfactored Moments ................................................................................................................ 50 Figure 29: Moments across Cross Section Composite Deck ...................................................................... 50 Figure 30: Bearing Schematics ................................................................................................................... 52 Figure 31: Reinforcement & Prestressing Strands for AASHTO Girders .................................................... 56 Figure 32: Dimensions for AASHTO Type Girders ...................................................................................... 56 Figure 33: Sample Spreadsheet Calculations .............................................................................................. 57 Figure 34: Plate Girder Schematic .............................................................................................................. 58 Figure 35: Pier Components ....................................................................................................................... 60 Figure 36: Pier Cap ..................................................................................................................................... 61 Figure 37: Pier Column ............................................................................................................................... 62 Figure 38: Pier Footing ............................................................................................................................... 62 Figure 39: Design Element & Corresponding Limit State ........................................................................... 63 Figure 40: Reinforcement for Abutment ................................................................................................... 65

9
Figure 41: Approach Slab Reinforcement .................................................................................................. 65 Figure 42: Wingwall Reinforcement ........................................................................................................... 66 Figure 43: Pile Cap & Backwall Reinforcement .......................................................................................... 66 Figure 44: Engineer's Cost per Square Foot ............................................................................................... 73 Figure 45: Example Life‐Cycle Cost Spreadsheet ....................................................................................... 75 Figure 46: Life‐Cycle Cost Analysis Results ................................................................................................. 76 Figure 47: Highway Funding Contributors (Federal Highway Funding and Legislation, 2007) ................... 80 Figure 48: Sample GPR Condition Map (Infrasense, 2007) ......................................................................... 81 Figure 49: Final Schematic of Deck ............................................................................................................ 85 Figure 50: Final Schematic of Girder .......................................................................................................... 86 Figure 51: Final Schematic of Pier .............................................................................................................. 87 Figure 52: Final Schematic of Abutment .................................................................................................... 88 Figure 53: Three Dimensional View of Design ........................................................................................... 88

10
List of Tables Table 1: Key Options for Secondary Members ........................................................................................... 19 Table 2: Expansion Joints ............................................................................................................................ 20 Table 3: Bearing Capacities (Chen and Duan, 1999) ................................................................................... 21 Table 4: Types of Retaining Structures ...................................................................................................... 25 Table 5: Limit States Considered in the Design of each Component (FHWA, 2007) ................................. 27 Table 6: Potential Constructability Variables .............................................................................................. 28 Table 7: Unit Prices for Construction Elements ......................................................................................... 29 Table 8: Deck Design Options .................................................................................................................... 46 Table 9: Non‐Composite Deck Results ........................................................................................................ 46 Table 10: Composite Deck Results .............................................................................................................. 47 Table 11: Prestressed Concrete Girder Results .......................................................................................... 54 Table 12: Rolled Steel Girder Results .......................................................................................................... 55 Table 13: Steel Plate Girder Results ........................................................................................................... 55 Table 14: RISA Dead/Live Load Outputs for Steel Plate Girder ................................................................... 58 Table 15: Governing Limit States for each Pier Component ...................................................................... 59 Table 16: Pier Reinforcement .................................................................................................................... 61 Table 17: Quantifying Construction Considerations .................................................................................. 67 Table 18: Data to Assign Constructability Ratings ..................................................................................... 68 Table 19: Constructability Scores for Girder Options ................................................................................. 69 Table 20: Construction Variable Weighting Matrix .................................................................................... 69 Table 21: Weighted Constructability Scores .............................................................................................. 70 Table 22: Engineering Cost Estimates for Each Bridge Design ................................................................... 72 Table 23: Inflation Rates ............................................................................................................................ 72

11
1. Introduction
The purpose of this project was to compare the designs of a steel and concrete girder
system and their components while fulfilling the Capstone Design experience. The designs
were compared on the premise of an engineer’s estimate of cost, life‐cycle cost analysis,
and constructability analysis. These analyses allow a municipality to make an informed
decision when many options are presented. The proper standards and limit states were
met through the use of AASHTO LFRD Bridge Design Specifications, a series of bridge
engineering handbooks, LRFD design examples from the Federal Highway Association, in
addition to many other sources.
The following report provides comprehensive analysis of the advantages and
disadvantages of two common types of bridge designs. The analyses include an engineer’s
estimate of cost, a life‐cycle cost analysis, and a constructability analysis. Using this
information we recommended the most advantageous design from the three options and
discussed the real world implications associated with our analysis. From the culmination
of this study we provided final schematics, design calculations, cost studies, and a
constructability study for each of the components looked at in depth. To achieve the
aforementioned deliverables we developed a background outlining the basic
considerations within each bridge component, a concise methodology to demonstrate both
our overall approach along with our approach for each component. We then give a more
focused discussion of the design process for each component which is accompanied by
results for component. An engineer’s estimate of cost is provided, along with a life‐cycle
cost analysis, and constructability analysis to bring conclusive results. Our conclusion
discusses our final recommendation and ties the different aspects of our report together to
address, our results correspondence with industry trends, the implications projects such as
this can have on infrastructure management practices, and the impact jurisdiction has on
funding and maintenance related issues.
12
2. Background
2.1 Introduction
“Planning and designing of bridges is part art and part compromise, the most
significant aspect of structural engineering.” (Chen & Duan, 1999) Along with this, comes
the substantial amount of specifications that must be abided by, a majority of which are
outlined in the AASHTO LFRD Bridge Design Specifications, 2nd Ed. 1998.
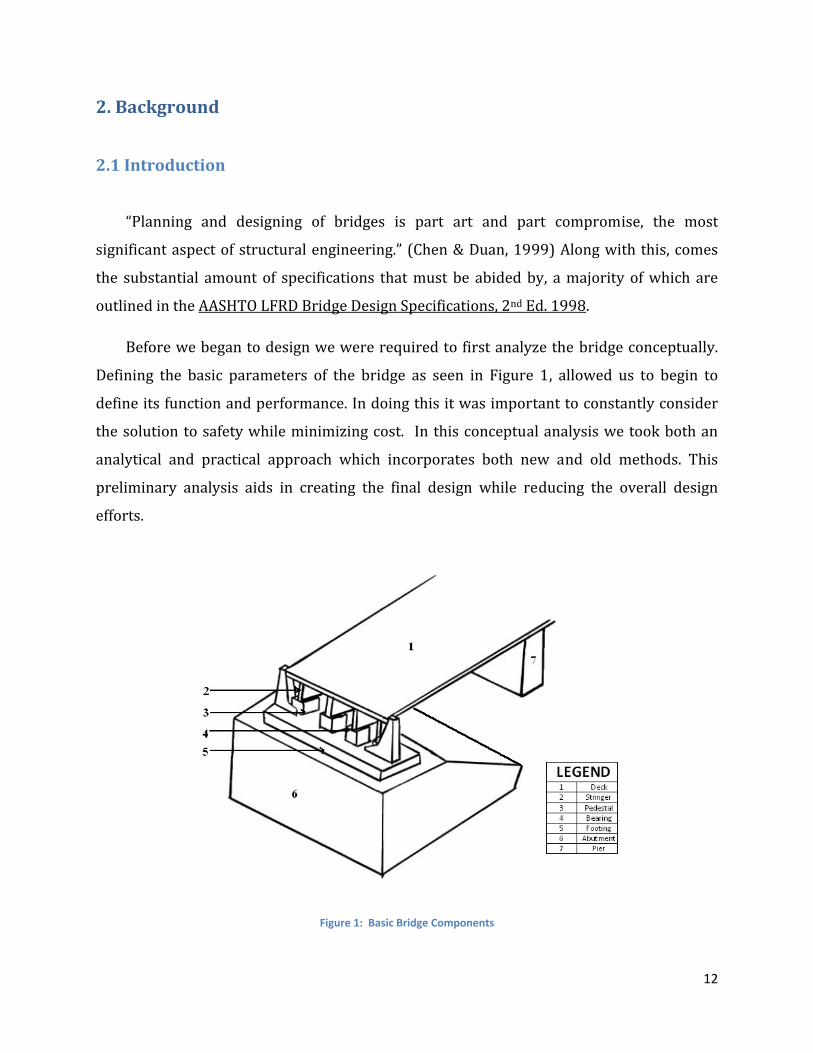
Before we began to design we were required to first analyze the bridge conceptually.
Defining the basic parameters of the bridge as seen in Figure 1, allowed us to begin to
define its function and performance. In doing this it was important to constantly consider
the solution to safety while minimizing cost. In this conceptual analysis we took both an
analytical and practical approach which incorporates both new and old methods. This
preliminary analysis aids in creating the final design while reducing the overall design
efforts.
Figure 1: Basic Bridge Components

13
To assist our preliminary analysis it was important to understand the basic
components of a bridge as well as gain a firm grasp on different design specifications. To
first understand the different components we divided the bridge into two sections:
superstructure and substructure. The superstructure of a bridge consists of the deck,
approach slabs, expansion joints and girders. Supporting the superstructure is the
substructure which includes: piers, columns, bearings, abutments and retaining structures.
Along with the superstructure and substructure components we researched foundations
and different commonly used options within concrete and steel bridge construction,
particularly in girder design. Expanding our knowledge of construction practices was
important when considering general constructability in our design. The following sections
give an overview of the different components of which an overpass consists, in a top‐down
manner. An overview of the considerations of construction and life‐cycle cost analysis is
discussed in addition to overall bridge design, pertaining to AASHTO specifications,
necessary analyses, and limit state concepts.
2.2 The Superstructure
The bridge superstructure consists of the components that are located above the
supports seen in Figure 2. Some of the basic components include the wearing surface, the
deck, the primary members, and the secondary members. Each of these will be discussed
in further detail in the following sections. Each of these components is dependent upon the
other in terms of loading and geometry. When designing each of these the others must be
taken into account.
Figure 2: Superstructure components (Tonias, 1995)
14
2.2.1 Wearing Course
The wearing course is the top most layer of the bridge deck. This is the surface that
will take the most punishment from the elements and from daily traffic. The wearing
course is usually anywhere from two to four inches thick depending on the amount of
traffic, the speed, and the volume of trucks that will be traveling over it (Tonias, 1995). This
layer is often made of bituminous pavement, which holds up well to traffic and gives a nice
ride over the structure.
2.2.2 Deck
The deck can be described as the physical extension across the roadway. The deck is
on the stringers and distributes the loads that act on the bridge along the bridge cross
section (Tonias, 1995). The deck can either be connected to the stringers which provides
extra load‐carrying capacity to the structure because the two components are working
together (composite) or it can sit freely on the stringers and transfer no additional load
bearing capacity other then the resistance of daily traffic (non composite) (Tonias, 1995).
Some of the advantages of using a composite decking system are it allows more efficient
use of materials since the size of the steel or concrete stringers does not have to be as large,
it can create greater vertical clearance because the stringers don’t have to be as deep, and it
can support greater vehicle loading. There are a few different types of decks that are
commonly used in industry today, cast‐in‐place concrete slab; steel orthotropic plate and
precast, pre‐stressed concrete panels.
2.2.3 CastinPlace Concrete Slab
The cast‐in‐place concrete slab is by far the most common form of decking on highway
overpasses (Tonias, 1995). This deck is reinforced with steel rebar to provide some extra
strength that using only concrete could not provide. The slab also usually works in
composite action with the bridge structure which also makes it a popular choice when
designing a bridge of either steel or concrete stringers.

15
2.2.4 Steel Orthotropic Plate
This type of deck is a steel plate that has stiffeners attached underneath to provide
longitudinal and transverse load carrying ability. One advantage to this deck is that it adds
very little dead load to the structure because it does not use concrete. This is very crucial
in large span bridges where dead load can become a significant issue. The downside to this
is that it is expensive to fabricate therefore they are not used on shorter span bridges,
under two hundred feet, where dead load is not as big an issue (Tonias, 1995).
2.2.5 Precast, Prestressed Concrete Panels
The precast, pre‐stressed concrete panels are delivered to the construction site
premade and ready to be set in place. The panels are four to five feet in width, are
longitudinally positioned, and placed transversely to the stringers. The panels are
connected by epoxy mortar which is put into a female‐female key (Tonias, 1995). The
panels can also be made to be in composite action with the structure by installing stud
shear connectors into voids in the panels, which are then filled with the epoxy mortar.
Some advantages to precast, pre‐stressed concrete panels are that they can be used on
bridge rehabilitations because they are not susceptible to vibrations when doing stage
construction, but they are more expensive than cast‐in‐place concrete decks and cannot be
used on curved structures.
2.2.6 Primary Members
The primary members are the most noticeable part of a highway overpass. They are
the structural elements that transfer the loads from the deck to the piers and abutments
(longitudinally) and are usually designed to resist flexure (Tonias, 1995). A stringer is
simply a horizontal member used to connect upright members. There are many different
types of stringers starting with the difference between steel and concrete. Both steel and
concrete have many different designs of stringers that are used for specific purposes. Some
designs are better for longer spans while others are better for shorter spans. These will be
16
further discussed in the following sections. Each of the designs has its advantages and
disadvantages which are also discussed.
2.2.7 Steel Stringers
There are many different types of steel stringers but we only looked at a few types for
our highway overpass. Steel when compared to concrete is much lighter and can be
constructed at a much faster pace because the stringers are fabricated at a factory then
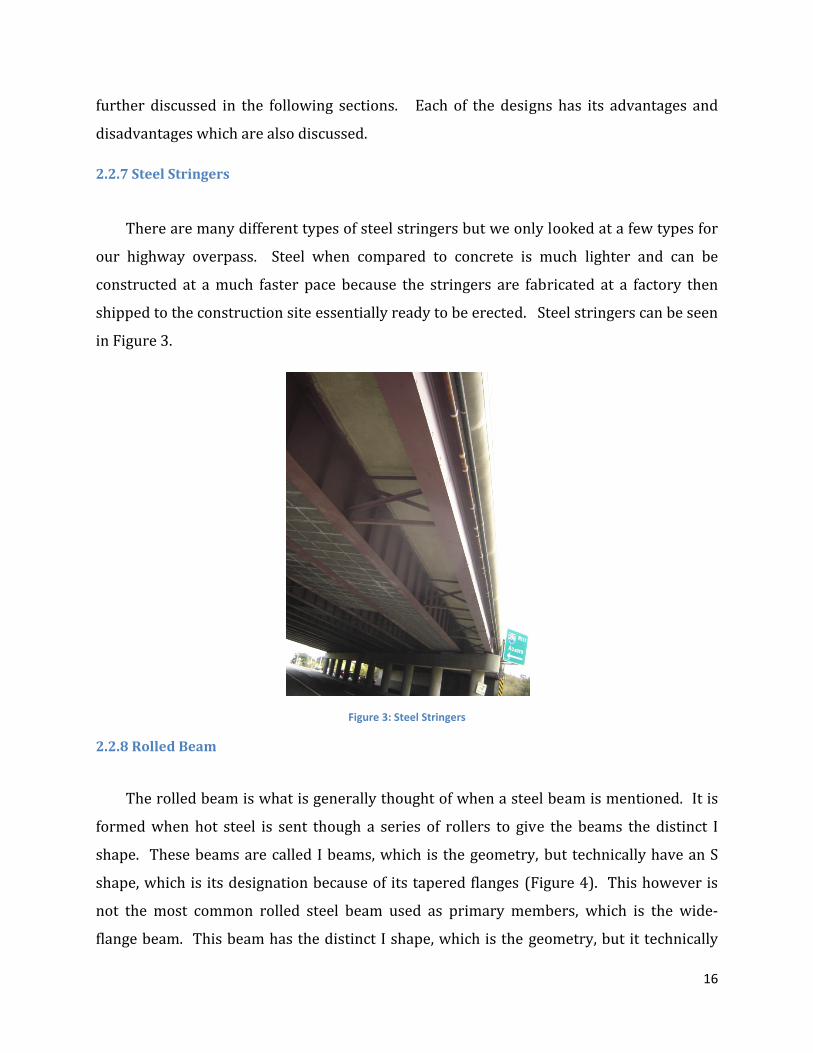
shipped to the construction site essentially ready to be erected. Steel stringers can be seen
in Figure 3.
Figure 3: Steel Stringers
2.2.8 Rolled Beam
The rolled beam is what is generally thought of when a steel beam is mentioned. It is
formed when hot steel is sent though a series of rollers to give the beams the distinct I
shape. These beams are called I beams, which is the geometry, but technically have an S
shape, which is its designation because of its tapered flanges (Figure 4). This however is
not the most common rolled steel beam used as primary members, which is the wide‐
flange beam. This beam has the distinct I shape, which is the geometry, but it technically
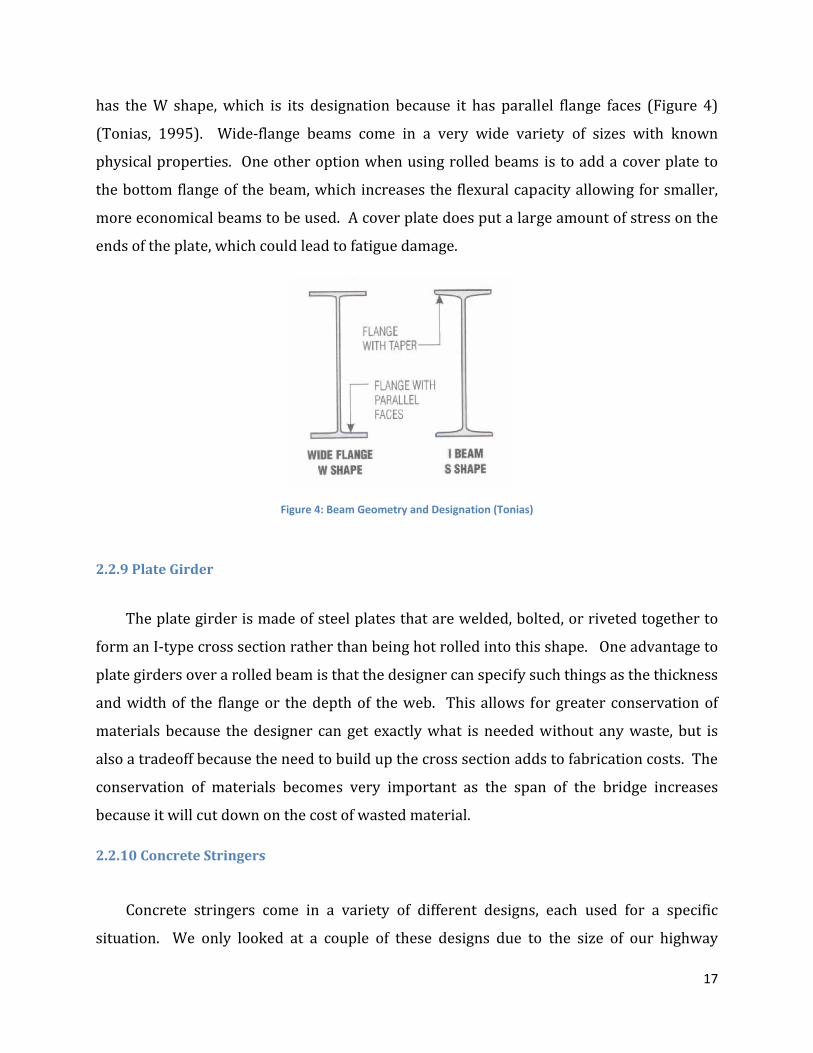
17
has the W shape, which is its designation because it has parallel flange faces (Figure 4)
(Tonias, 1995). Wide‐flange beams come in a very wide variety of sizes with known
physical properties. One other option when using rolled beams is to add a cover plate to
the bottom flange of the beam, which increases the flexural capacity allowing for smaller,
more economical beams to be used. A cover plate does put a large amount of stress on the
ends of the plate, which could lead to fatigue damage.
Figure 4: Beam Geometry and Designation (Tonias)
2.2.9 Plate Girder
The plate girder is made of steel plates that are welded, bolted, or riveted together to
form an I‐type cross section rather than being hot rolled into this shape. One advantage to
plate girders over a rolled beam is that the designer can specify such things as the thickness
and width of the flange or the depth of the web. This allows for greater conservation of
materials because the designer can get exactly what is needed without any waste, but is
also a tradeoff because the need to build up the cross section adds to fabrication costs. The
conservation of materials becomes very important as the span of the bridge increases
because it will cut down on the cost of wasted material.
2.2.10 Concrete Stringers
Concrete stringers come in a variety of different designs, each used for a specific
situation. We only looked at a couple of these designs due to the size of our highway

18
overpass. Concrete is lower in cost than steel but it also much heavier so it is not used
when weight is an issue (Tonias, 1995). Until the development of the pre‐stressed concrete
girders, concrete was rarely used because it could not span large gaps. Concrete stringers
can be seen in Figure 5.
Figure 5: Concrete Stringer
2.2.11 Prestressed Concrete Girder
The pre‐stressed concrete girder is one of the more popular choices for highway
overpass design because of its ease of construction, (prefabricated at a factory or done on
site), its cost effectiveness, and its physical properties. These girders come in two different
shapes, an I‐girder and a T‐girder, which are used base on the size of the overpass (Tonias,
1995). The girders’ designs, which are AASHTO standards, depending on the size needed,
have specified locations and numbers for pre‐stressing strands.
2.2.12 Concrete slab
The concrete slab bridge is a fairly simple concept because there are no primary
members. The slab acts as both the support for the bridge and the wearing surface. This
does not allow for long bridges of this type. Reinforcement is used in the concrete to give
additional strength and resistance to fatigue. Voids can also be added which lightens the
dead load of the bridge which allows the bridge to span larger gaps. This type of bridge is
not very popular since it is not a very efficient design (Tonias, 1995).

19
2.2.13 Secondary Members
The secondary members of an overpass are designed not to handle load but to prevent
deformation of the frame by bracing the primary members. Secondary members do not
handle load but they help transfer load from stringer to stringer by creating a single unit
out of the entire structure. Diaphragms are the main type of secondary member that we
will investigate. If the stringers are made from steel then steel diaphragms are used and if
concrete stringers are used concrete diaphragms are used accordingly. For a steel
diaphragm it is usually of the rolled beam type which lends its self to easy fabrication since
they are specified in the AISC Steel Construction Manual. AASHTO also has certain
specifications that must be satisfied including the spacing and on what designs and spans
they should be used. The steel connectors are mounted to the primary members though
connection plates which are welded or bolted to the structure. Concrete diaphragms can
be either cast in‐place with the stringers to create a single unit or they can be cast at a
factory and connected with rods to the girders. The key options are listed in Table 1
(Tonias, 1995).
Table 1: Key Options for Secondary Members
Type of Span Span Geometry Spacing Spec Rolled Beam and Plate Girder
All Spans At each support and intermediate locations spaced
not more than 25ft apart
AASHTO 10.20.1
Prestressed Concrete T‐Beam
Spans > 40 ft At span ends and points of maximum moment
AASHTO 9.10.2
2.2.14 Expansion Joints
Expansion joints are very critical to any type of bridge because they allow for
movement of the deck due to loads, thermal expansion/contraction, and some also protect
the substructure by acting as a sealant. There are many different options such as open
joints, filled joints, compression seal joints, and strip seal joints. Each joint has a range of
motion that it covers and we will not be able to choose the correct joint until we have

20
analyzed our structure for movement. The main options for expansion joints are listed in
Table 2 (Tonias, 1995).
Table 2: Expansion Joints
2.3 The Substructure
After establishing a thorough knowledge of the superstructure, we proceed to the
support for those elements, the substructure. Like the superstructure, substructure
components vary by geographical location and transportation department. For most
highway bridges the substructure contains most of the prominent aspects which could be
considered aesthetically pleasing. The substructure of a bridge consists of the bearings,
piers, abutments and retaining structures. It is imperative to fully understand each of these
components before beginning the design phase.
2.3.1 Bearings
Bearings’ primary functions are to transmit loads and accommodate any relative
movements between the superstructure and the substructure. There are a variety of forces
that the bearing must endure including: superstructure dead load, traffic loads, earthquake
loads and wind loads. There are translational and rotational movements within the
bearings caused by creeping, shrinkage, temperature effects and traffic loads and uneven
foundations respectively.
In connecting the bearings to the superstructure and substructure, steel plates are
used in conjunction with bolts and welding. Steel sole plates are bolted and welded to the
superstructure when using steel girders and embedded into the concrete girders with
anchor studs. A galvanized steel masonry plate with a fabric bearing pad underneath, is

21
used in connecting the bearing to the substructure. The purpose of the plates is to
distribute the concentrated bearing reactions to the superstructure and substructure
(Bearing Devices, 2005).
Through our research we found a wide variety of bearings. First, we discovered they
can be classified into either fixed or expansion bearings. The principle difference between
the two is fixed bearings restrict translational movements where expansion bearings allow
both translation and rotation. Common fixed bearings include rocker and pin types,
whereas elastomeric, sliding and roller are all considered expansion type bearings. For the
purposes of our project we will only look at roller and elastomeric bearings as they
accommodate both steel and concrete girders. When selecting a bearing it is important to
consider the maximum load capacity in addition to the bearings ability to resist
translational and rotational forces. Translation and rotational values account forces in the
transverse direction often associated with wind, seismic and vehicular collision loading.
Figure 6 and Figure 7 illustrate the roller and elastomeric bearings respectively. Table 3
outlines the bearing capacities (Chen & Duan, 1999).Table 3: Bearing Capacities (Chen and
Duan, 1999)
Figure 6: Typical roller bearing (Chen and Duan, 1999) Figure 7: Typical elastomeric bearing (Chen and Duan, 1999)
Table 3: Bearing Capacities (Chen and Duan, 1999)
22
With the information in the table provided above we can conclude that elastomeric
bearings are the most economical choice but have less structural capabilities. These
bearings are made of a rubber known as elastomer and use multiple types of reinforcement
pads including: plain, fiberglass, cotton duck and steel. If calculated design loads do not
permit the use of this type of bearing, roller bearings will be considered. Though this type
of bearing has large structural capabilities it can produce high maintenance costs as a
result of a high susceptibility to deterioration and corrosion (Chen & Duan, 26‐4).
2.3.2 Piers and Columns
Piers are the vertical supports that carry vertical loads from the superstructure to the
foundation and resist any horizontal loads acting on the bridge. Piers are generally made of
reinforced concrete. However, steel tubing filled with concrete are a growing commodity.
For our purposes we researched further into the design options and specifications of
reinforced concrete piers. A pier is defined as, “A supporting structure at the junction of
connecting spans of a bridge.” (The American Heritage Dictionary of the English Language,
2000) However, from a designer stand point, we need to be able to distinguish between a
pier and a column. In this, it is important to note that columns resist lateral forces by
flexural action where as piers use shear action. Also, a pier with multiple columns is known
as a bent.
There are many types of piers: monolithic and cantilevered which are defined by how
they connect to the superstructure. We explored each of these options as their use is
dependent on the use of concrete or steel girders respectively. A pier can also be
distinguished by its column shape: round, octagonal, hexagonal, or rectangular, each having

23
the option to be solid or hollow. The shape of the column affects the area which the load is
distributed, given geometric restrictions defined by the pier cap and footing dimensions.
Also, the shape of the column contributes to the aesthetic variability of the substructure.
Lastly, a pier can be distinguished by its frame, single column, bent, hammerhead or pier
wall. Figure 8 outlines the different options for piers and columns (Chen & Duan, 1999).
Figure 8: Piers and Columns flow chart
2.3.3 Abutments
The abutment’s primary function is to provide vertical support at the bridge ends.
There are two categories of abutments, open ended and close ended. Open‐ended
abutments have a slope that goes from the abutment to the roadway beneath; whereas
close‐ended abutments are constructed close to if not on the edge of the road as seen in
Figures 9 and 10. Open‐ended abutments are generally more economical, flexible and
aesthetically pleasing. Construction costs for close‐ended abutments tend to run higher

24
due to their higher walls and larger backfill area. Also, open ended abutments, with their
slopes, leave room for widening the under passing road (Chen & Duan, 1999).
Figure 9: Open Ended Abutment
Figure 10: Close Ended Abutment
Abutments can also be categorized based on their connection to the bridge
superstructure. With this we have two categories: monolithic or seat type. The monolithic
abutment is usually reserved for shorter bridges as it is integrated in directly with the
superstructure allowing no displacement between the two. In this, deformations of the
superstructure, such as thermal movements must be considered in the abutment design to
avoid cracking. Though, its greatest advantage is its lower construction costs, it is
important to consider the potential maintenance and rehabilitation costs often associated
with the deformation induced cracking when designing (Chen & Duan, 1999).
The seat type abutment is constructed separate from the superstructure. The
superstructure is positioned on the seat abutments through bearings previously discussed.
These bearings enable the designer to control bridge displacement. The ability to control
displacement makes this type of abutment popular for longer bridges, especially those with

25
concrete or steel girders. Although this type of abutment has a higher initial cost it is
relatively a lower cost solution to maintain.
2.3.5 Retaining Structures
There are a variety of retaining structures which all act to resist lateral forces. Several
types of retaining structures include: gravity wall, cantilever wall, tieback wall, and soil nail
wall (seen in Table 4). All retaining structures resist active soil pressure. Tie back walls
have strands that act as anchors for the wall elements. Soil nail walls have a similar system
that uses soil nails to resist lateral movement. It is critical to ensure vertical settlement for
all retaining structures. They must have the ability to resist against any sliding,
overturning, and foundation yielding while still maintaining the strength to avoid
structural failure (Chen & Duan, 1999).
Table 4: Types of Retaining Structures
Gravity Cantilever Tie Back Soil Nail
2.3.6 Foundations
The function of the foundation is to connect the bridge substructure to the ground
enabling load transfers between the two. There are two main types of foundations, shallow
and deep. Examples of shallow foundations are spread footings, strap footings, combined
footings and mat footings (Chen & Duan, 1999). In addition, types of deep foundations
include drilled shafts, driven piles, rock sockets and caissons. Deep foundations can
generally take larger vertical loads with the same surface area footing as a shallow
foundation due to their ability to reach deeper, more competent layers of soil and can resist
higher lateral loads to an increased level of assistance from the soil due to deeper
26
penetration. However, they are generally more expensive as of a result of their higher
material quantities. Though in cases where the surface soil is of poor quality (i.e. clay) a
deeper foundation can be more cost effective (Chen & Duan, 1999). One similarity between
deep and shallow foundations is the necessity for each of them to work together with the
superstructure in resisting external forces. If the foundation and superstructure are
designed separately the safety of the bridge could be compromised despite each
component’s ability to meet design specifications.
2.4 Highway Overpass Design
The design of an overpass includes many different components, limit‐states, and
design specifications. Each of these must be considered to design a safe and cost effective
overpass. To ensure this, the use of a number of analyses is coupled with an efficient work
strategy.
AASHTO LRFD Bridge Design Specifications is the main guidance for limit‐state
selection and use. Each component has its own limit‐states that must be followed, and
these are outlined by AASHTO. Depending on the loading applied to each component may
result in one or many governing limit‐states. AASHTO also specifies many criteria as for
what equations can be used, design loads, etc.
There are also many analyses that must be done to determine if the design of each
component is safe and cost effective. As indicated previously the governing limit state(s)
are dependent on the critical load for a particular component. AASHTO species each limit
state within section 3.4 Load Factors and Combinations, including Strength (I‐V), Service (I‐
III), Extreme Event (I and II) and Fatigue. Table 5 outlines the principal limit states for each
bridge component.
27
Table 5: Limit States Considered in the Design of each Component (FHWA, 2007)
Component Limit State Deck Strength I, Service I and Extreme Event II
Pre stressed Concrete Girder Strength I and IV and Service I and III
Steel Girder Strength I and V, Service I and II and Fatigue
Abutment Strength I and III and Extreme Event II
Pier Strength I, III and IV, Service I and Extreme Event II
Bearing Strength I, III and IV, Service I and Fatigue
Foundation (Piles) Strength I and Service I
The limit states within the table account for a variety of loads including; specific
vehicle and wind conditions, vehicle collision, in addition to high dead to live load ratios
and fatigue from repetitive gravitation force applied by vehicle live loads. It is important to
note that Service Limit states II and III are specific to steel and pre stressed members
respectively (AASHTO LRFD Bridge Design Specifications, 1998).
In addition, the components are analyzed in‐terms of initial and life‐cycle cost while
bearing in mind the importance of constructability to select a cost effective design which
can be implemented with minimal difficulty.
2.5 Constructability Considerations
Though it is critical to understand each of a bridge’s components before you begin the
design phase, it is also imperative to recognize the importance of the constructability of
those components. As a study conducted by the ASCE in the late 1970s pointed out, “there
is a missing link between design engineers and contractors,” proving the need for
constructability to be considered in the design phase (Wright, 1994). Constructability can
have a critical affect on cost and time, which despite the importance of safety, are often

28
viewed as the primary indicator of success for any particular project. In considering
constructability it was imperative to understand all applicable variables that go into it.
Edward D. Wrights’, Constructability Guide was a beneficial source in outlining all
appropriate construction considerations. Table 6 identifies a number of the potential
construction elements to be considered. In the end, having complete understanding of each
component enables us to properly gage the constructability of the project and hence allow
us to make proper decisions as to the specifications for each of those components.
Table 6: Potential Constructability Variables
2.6 Engineering Cost Estimate
The initial cost is a critical component to the comparative analysis of potential bridge
design options. An important element in determining this cost is the procurement of
reputable unit prices which are applied to material quantities in calculating the overall
cost. These costs include materials and labor for construction. Table 7 summarizes these
prices and the source from which they were obtained.
29
Table 7: Unit Prices for Construction Elements
Elements of Construction Value Source Structural Concrete $580 per cubic yard Mean’s Construction Index Reinforcing Steel $1,625 per ton Mean’s Construction Index
Pre‐stressed Concrete Girder $112 per linear foot Florida DOT website Rolled Beam Girder (W40X183) $200 per linear foot Mean’s Construction Index Rolled Bean Girder (W36X210) $225 per linear foot Mean’s Construction Index
Steel Plate Girder $1.16 per pound Florida DOT website
Rectangular Elastomeric Bearings $2000 each New York State Thruway
Authority website
Parapets $66.77 per linear foot Federal Highway
Administration website Piles $1.01 per pound Florida DOT website
Wearing Surface $45.31 per square yard Federal Highway
Administration website
Overall Bridge Cost $94 per square foot Federal Highway
Administration website
The application of these unit prices in addition to any adjustments and additional
considerations are discussed within the initial cost methodology and results sections.
2.7 LifeCycle Cost Analysis
“Transportation officials consider life‐cycle cost analysis an important technique for
assisting with investment decisions.” (NCHRP, 2007) In the world of transportation,
bridges have a much longer lifespan than pavements, making them a long term investment.
In an effort to ensure the success of these investments, a system is instituted which
considers both agency and user costs. Agency costs are reduced through the aid of the life‐
cycle cost analysis which provides investment planning to ensure needed funding is
available each year. In order to adequately conduct a life‐cycle analysis, we account for all
potential elements related to cost including the governing agencies responsible for each
entity. Additionally, user costs are considered to produce a well rounded result,
incorporating often overlooked factors which can place a financial burden on non‐agency
affiliated persona.

30
Throughout the life‐cycle of a bridge, there is a reasonable amount of maintenance and
intermittent rehabilitation and replacement work. Most maintenance work is handled by a
local governing agency. This agency also undertakes a great deal of the rehabilitation
projects, with minor contributions from outside design and construction firms. On the
contrary, an agency will outsource just about any work associated with either the
replacement of an individual element or the entire bridge structure (NCHRP, 2007).
In considering the costs for future maintenance work we often have to consider, the
type of material, condition, location, average daily traffic, highway classification, etc. “The
costs associated with the rehabilitation of bridge elements should be estimated for
different types of elements and the different rehabilitation alternatives applicable for each
element type.” (NCHRP, 2007) Element replacement costs are to be estimated the same
way as rehabilitation costs but are a separate entity as they may receive a different source
of funding. (NCHRP, 2007) Lastly, bridge replacement costs are estimated by breaking the
bridge down into elements and essentially creating an engineering estimate while applying
historical contract costs to validate the predicted cost at a given interval of time in the
future. (NCHRP, 2007) Details of funding sources, particularly the identification of
governing agencies responsible for particular cost elements, are addressed in Chapter 6 of
this report.
User costs are also a major contributor to the overall life‐cycle cost of a particular
bridge. User costs are generally associated with functional deficiencies due to factors such
as high accident rates, lost travel time and detours (NCHRP, 2007). In analyzing the future
impact of these variables it is important to understand future traffic rates and their impacts
on the lengths of detours. In addition, crash and bridge work costs need to be considered
from a user costs perspective.
An important tool when accounting for all aforementioned agency and user costs are
the use of cash flow diagrams, such as the one seen in Figure 11. From here, information
can be applied to agency and user cost model which considers initial, operational,
rehabilitation, replacement, salvage and all other applicable associated costs for a

31
particular bridge. These costs are “expressed as equivalent present worth of costs or as
equivalent uniform annual costs, using compound interest formulas “(NCHRP, 2007).
Figure 11: Cash Flow Diagram (NCHRP, 2007)
“Currently, most states do not use life‐cycle cost analysis.” (NCHRP, 2007) The states
that do use life‐cycle cost, use it from a qualitative approach rather than quantitative. In
supporting a shift to quantitative analysis we must begin to consider the following factors
seen in Figure 12 in the future:
Figure 12: Factors Supporting Shift to a Quantitative Analysis (NCHRP, 2007)
Though life‐cycle costing is not a straight forward procedure it is important to
integrate into the design process as it provides the ability to quantify inconspicuous details
in ensuring a sustainable financial system is in place for the life of a bridge.
2. 8 Roles and Responsibilities of Transportation Agencies
In understanding the implications of comparing a series of bridge designs, we must
first understand the roles and responsibilities of the different agencies who could
potentially integrate our analysis into their system. As indicated by the Federal Highway
Administration, “experience has shown that good relationships between agencies

32
responsible for conformity determinations are key to a successful process.”(Federal
Highway Administration, 2007) The most involved agencies surrounding bridges are state
and federal level transportation agencies.
There are a number of federal transportation agencies who have a critical role in
bridge infrastructure. The Federal Highway Administration is the main federal contributor
to maintenance and safety of highway bridges in addition to reconstructive relief in the
event of catastrophic failures. Another federal agency, The National Transportation Safety
Board investigates the cause of these failures. In addition, the Highway Bridge Program
which contributes all federally funded rehabilitation and replacement costs for bridges of
highest priority denoted by the state. The details of both federal and state level funding are
discussed later in the report (Highway Bridges: Conditions and the Federal/State Role,
2007).
Although federal highway agencies provide money towards the improvement of
highway bridges, the application of these funds are mostly controlled by the state DOTs.
Each state is responsible for either the hiring of a contractor or to carry out any
required/needed work themselves regardless of the source of the funding. Another
important responsibility of the state DOTs is the completion of the federally mandated
bridge inspections to be carried out once every two years. These inspections increase
quality assurance and aid the prioritization of maintenance, rehabilitation and replacement
projects (Highway Bridges: Conditions and the Federal/State Role, 2007).
Federal responsibilities are outlined within the Code of Federal Regulations under Title
23: Highways; Part 650 Bridge, Structures and Hydraulics. Within this part, Subparts C, D,
and G outline four critical federal bridge project requirements. Subpart C addresses the
national bridge inspection standards, mainly the law which mandates an inspection of each
bridge every two years as previously discussed. Subpart D outlines the policies and
procedures of the Highway Bridge Replacement and Rehabilitation Program. Last, Subpart
G discusses the Discretionary Candidate Bridge Rating Factor which addresses the
allocation of discretionary bridge funds on the federal level (Electronic Code of Federal
Regulations, 2008).

33
While the independent responsibilities of federal and state transportation agencies are
significant, the cooperation between them is of the utmost importance to continuing the
improvement of the bridge infrastructure system.
2.9 Conclusion
Through our research we were able to gain an understanding as to the options and
characteristics of each bridge component in addition to expanding our knowledge of the
different comparable measures. This understanding created a foundation that allowed us to
proceed to the design phase. The methodology that follows gives a brief overview of the
overall design process and examines the more intricate procedures associated with the
design of the individual components as well as any abstruse techniques used in
implementing the comparative measures previously discussed. We will go into further
detail of the specific design of components within their respective sections of Chapter 4.

34
3. Methods
3.1 Introduction
The purpose of the methodology is to define our approach as well as our involvement
in the design of each bridge component. In doing this, applicable critical loads must first be
considered. We compare pre‐stressed concrete girders with steel girders on the premise of
life‐cycle and initial cost as well as constructability. Below is an organizational chart
outlining the different components of our project that are considered in the methodology.
Through the flow chart one can observe the use of AASHTO LRFD Bridge Design
Specifications as our governing source as its’ application to the design of both
superstructure and substructure components. Furthermore, as indicated in the
organizational chart, both designs are compared on the basis of constructability, initial cost
and life‐cycle cost. Moreover, we successfully fulfilled the Capstone Design requirement
through this project.
Figure 13: Methodology Organizational Chart

35
3.2 Deck
The deck was designed two different ways, which affected the design of the primary
members. The deck was designed as a non‐composite and composite cast‐in‐place slab,
and was coupled with the three different types of girders. The following figure outlines the
design process for a typical deck design.
Figure 14: Deck Design Process
The first step in designing any bridge deck is defining the appropriate design method
as well as any assumptions that come with it. In addition certain parameters must be
identified including girder spacing, overhang width, yield and compressive strengths as
well as densities of applicable materials. Also, an adequate type of parapet must be chosen
using AASHTO. Next, deck and overhang thicknesses must be selected while adhering to
AASHTO specifications. Following these preliminary set of conditions, maximum dead and
live load moments must be calculated. This entails defining the loading factors as well as
calculating the maximum positive and negative moments. When the moments have been
calculated, the appropriate top and bottom reinforcing steel must be determined. On top of
this, additional reinforcement in the overhang must be defined. This is calculated using
three different design cases outlined with AASHTO. Lastly, top and bottom longitudinal
reinforcement are calculated using the previously calculated maximum positive and
negative moments. Once all the aforementioned calculations are completed, they must be
summarized in a schematic and table.
36
3.3 Girders
The primary members will be broken down into two categories, steel and concrete.
Each material has very different characteristics and will be looked at separately. We will be
looking at rolled girders and plate girder designs for our overpass. We will use standard
design sizes for both since this will help lessen cost and contribute to constructability,
which are critical comparative factors. Variations of spacing of pre‐stressed concrete
girders will be explored to determine the best spacing and size of these members. AASHTO
type girders will be used to help aid the design process. The figure below outlines the
general design process used.
Figure 15: Girder Design Process
3.4 Piers
Piers are critical components to the bridge in supporting mainly vertical loads. With
this, we designed an appropriate pier to accommodate all of the girder systems, while
constantly considering all governing requirements outlined within AASHTO. Before
starting the design of the pier, we first had to determine the maximum dead, live, braking
force and wind loads to be applied. The superstructure dead load was calculated using
material quantities from design calculations. We then calculated the maximum live load
reactions using the outputs from the girder live load analysis. In addition to the preliminary
determination of these loads, we had to select the general dimensions of the pier based
primarily on the superstructure’s dimensions. It is important to note that temperature and
shrinkage were not considered due to the sustained symmetry of the bridge superstructure
37
due to the aid of the expansion joints. Last, the pier design was conducted using a top down
approach, starting with the cap and ending with the design of the footing. Figure 16 gives
the basic design steps for a pier.
Figure 16: Pier Design Process
3.5 Abutments
The abutment was designed to be for a concrete girder superstructure system. The
design of abutments is not specified in great detail within the AASHTO LRFD Bridge Design
Specifications. Therefore, most state level agencies have developed their own design
guidelines (United States Department of Transportation Federal Highway Administration:
LRFD, 2007). This deterrent coupled with time constraints has lead to the design of
abutments which suffice both superstructure designs. Hand calculations were completed
following the steps outlined in Figure 17. The design process included finding the number
of piles needed; the dimensions of the backwall, wingwall, and approach slab; finding the
reinforcement from steel bars need for the backwall, wingwall, and approach slab; and

38
determining the passive earth pressure. The use of passive earth pressure versus active
pressure was used with the assumption that the wall is pushed into the soil mass instead of
the soil mass pushing the wall. The final schematics were drawn for the wingwall, backwall,
pile cap, and approach slab.
Figure 17: Abutment Design Procedure
3.6 RISA2D
RISA‐2D was used to help analyze different design options in a quick and efficient
manner. The standard model was a 75 foot member with pin supports at both ends. The
loads (point or distributed) were applied to the model as needed depending on the design
that was being done. The program allowed us to quickly find the moments, shear, and
deflection for a given design. This saved us a great amount of time and allowed us to work
more efficiently by not having to calculate by hand the moments, deflection, and shears for
each different design and spacing.
The live load was done using a HS20‐44 design truck, which can be seen in Figure 18
below. This live load was used for all design purposes needing a live load contribution.
The live loads were multiplied by a design load factor of 1.6 when they were applied to a
member, which can be seen in Figure 19 below. The location of the loads relative to each
other is specified by AASHTO and the load location on the member was determined
through trial and error to find the largest moment, shear, and deflection. A dead load was
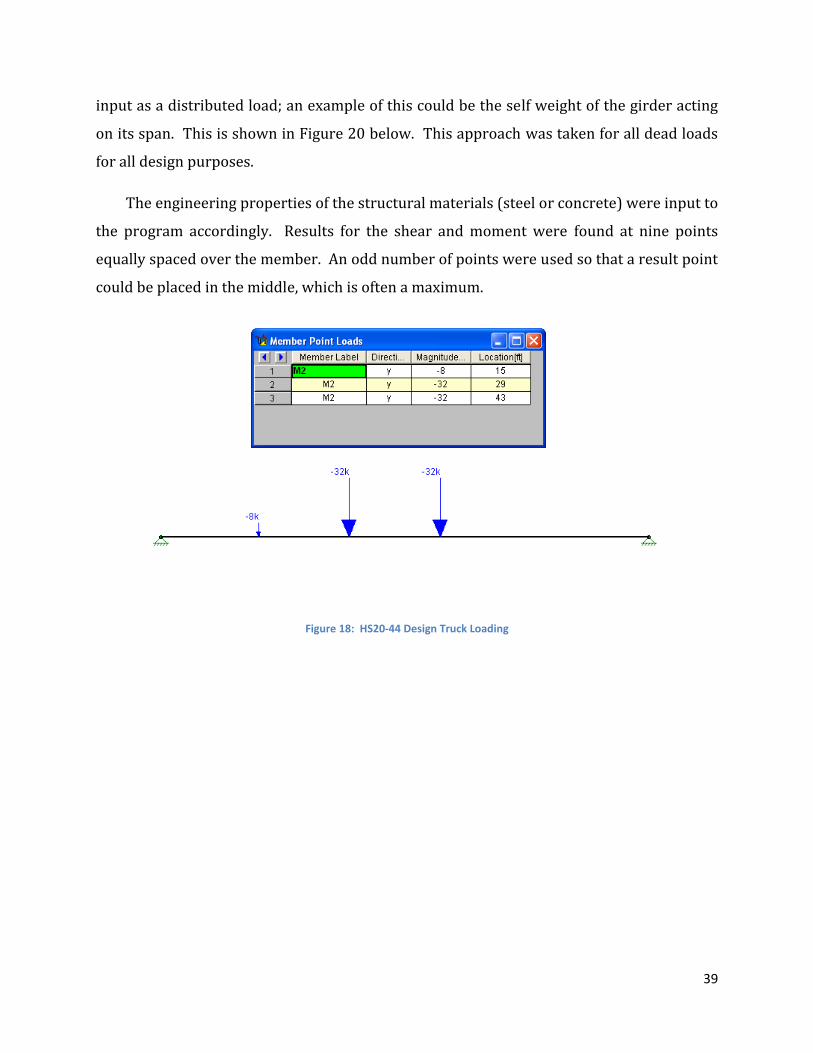
39
input as a distributed load; an example of this could be the self weight of the girder acting
on its span. This is shown in Figure 20 below. This approach was taken for all dead loads
for all design purposes.
The engineering properties of the structural materials (steel or concrete) were input to
the program accordingly. Results for the shear and moment were found at nine points
equally spaced over the member. An odd number of points were used so that a result point
could be placed in the middle, which is often a maximum.
Figure 18: HS20‐44 Design Truck Loading
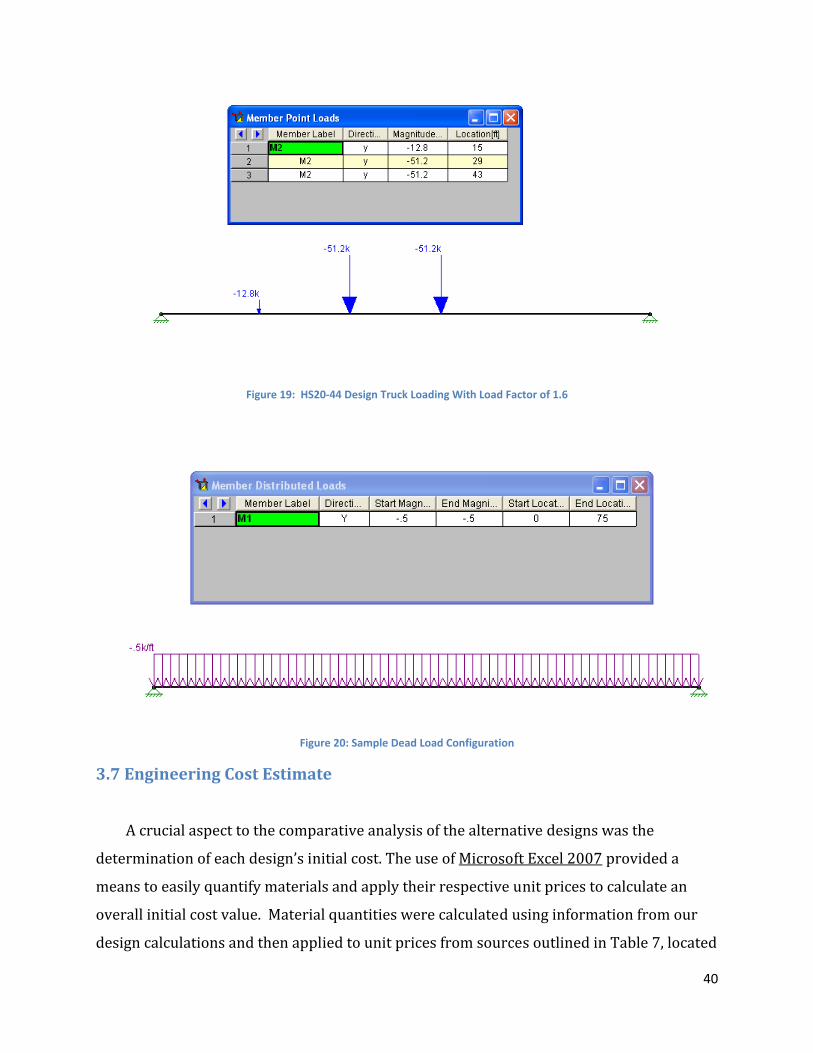
40
Figure 19: HS20‐44 Design Truck Loading With Load Factor of 1.6
Figure 20: Sample Dead Load Configuration
3.7 Engineering Cost Estimate
A crucial aspect to the comparative analysis of the alternative designs was the
determination of each design’s initial cost. The use of Microsoft Excel 2007 provided a
means to easily quantify materials and apply their respective unit prices to calculate an
overall initial cost value. Material quantities were calculated using information from our
design calculations and then applied to unit prices from sources outlined in Table 7, located

41
in Chapter 2. These unit prices were adjusted due to variances between the ages of
different sources of data. Once the overall costs were calculated, the data was made current
by applying the appropriate inflation rates. The details of the aforementioned adjustments
as well as the presentation and implication of the overall costs were addressed in the
results section.
3.8 LifeCycle Cost
A life‐cycle cost analysis was completed to help identify a design for our
recommendation. The first step to complete this process was gathering the necessary
information. This information included the period and cost for various maintenance, repair
and decommissioning activities during the life of the structure. These activities include
repaving, inspection, painting, non destructive testing, rehabilitation, demolition, and
salvage. We used the initial costs that were determined in our cost estimate as base costs.
A yearly maintenance cost was determined for each of the designs. This information was
gathered from a variety of sources that include the Prestressed Concrete Association of
Pennsylvania, Infrasense, Inc., City of Rockville, MD Department of Public Works, and
Asphalt Pavements: A Practical Guide to Design, Production and Maintenance by Patrick
Lavin. The life‐cycle cost values can be seen in Figure 21 below.
Using the information gathered from these sources we were able to use a Microsoft
Excel spreadsheet, which was provided by Professor Leonard Albano, to calculate life‐cycle
cost. A flow chart of the analysis process can be seen in Figure 22 below. The length of our
life‐cycle cost analysis was 70 years with a 6.0% discount rate. We input the 9 different
designs into the spreadsheet and calculated the total replacement/salvage cost, total
present worth (PW) replacement/salvage cost, total maintenance costs, total PW
maintenance costs, total life‐cycle costs, total PW life‐cycle costs, life‐cycle cost savings
compared to least cost design for each design, PW life‐cycle cost savings compared to least
cost design for each design, and total savings if PW life‐cycle was used compared to normal
life‐cycle for each design. The results were then compiled in a table which can be seen in
the life‐cycle analysis results section. Present worth life‐cycle cost was a very significant

number
fixed rat
this valu
because it s
te of return,
ue, we saw h
shows how
to be able t
how much m
w much mon
to pay all co
money was s
Figure 21:
ney had to b
osts until ye
saved by us
Life‐Cycle Cost
be put into a
ear 70. By c
ing the leas
Value
an account a
comparing e
st expensive
at year 0, w
each design
e design.
42
with a
with

43
Figure 22: Life‐Cycle Cost Analysis Procedure
3.9 Constructability
In order to conduct the analysis, we first researched variables that appropriately
measured the constructability of our bridge. These variables are outlined in Table 6 within
Chapter 2. Within the analysis, each girder system was given a comparative score (best (3),
neutral (2), worst (1)) for each of the decision variables. These scores were then weighted
using the approach outlined in a paper by, Hunter Weighted Evaluation Approach. This
approach establishes weighting factors by comparing performance criteria in pairs and
asking the question: “which one is more important?” Figure 23, is a blank performance
criteria matrix, similar to the one used in our analysis. Each of the chosen constructability
variables was listed (A, B, C…) and compared to each other using the aforementioned
process. Following the pair wise comparisons, the number of favorable outcomes for each

44
variable when compared to each other variable was totaled, and a percent of the total
number of outcomes was calculated to act as the weighting factor (Hunter, 2002).
Figure 23: Performance Criteria Matrix
This approach enabled us to achieve a single constructability score for each girder
system, by properly weighing the variables, and this single score provided a uniform base
for decision making.
45
4. Design
4.1 Introduction
With a firm grasp on conceptual bridge design, provided through our background and
methodology, we were able to proceed to the design phase. The following section provides
insight into the design process, including resources used, general methodology and any
problems that were encountered in designing each component. This section also provides a
summary of the results and explains their significance. The contents of this section allow us
to proceed to the comparative analysis and draw overall conclusions in determining the
optimum design.
4.2 Deck
4.2.1 Design Process
In designing both composite and non composite decks for both girder systems, we
followed two different design examples from the LRFD section of the U.S. Department of
Transportation Federal Highway Administration Website. In addition to these design
examples we compared them with a design example in Bridge Engineering Handbook by
Wai‐Fah Chen and Lian Duan, procured early in our research. The principal document used
for each design was AASHTO LFRD Bridge Design Specifications, which outlined a variety of
specifications we needed to reference.
With the above resources at our disposal we were able to complete design calculations
for the following deck configurations seen in Table 8. Hand calculations were completed for
the non composite and composite systems and applied to a spreadsheet format with the aid
of Microsoft Excel 2007. This allowed us to complete both the five and six girder designs
relatively quickly and facilitated any minor changes or further analysis. One major
difference in the design of the composite deck versus the non‐composite deck was the
assumption of the composite deck being continuous over the stringers and the non‐
composite deck being simply supported by the stringers. This resulted in the need for
maximum positive and negative moments for the composite deck design which were

46
calculated through the use of RISA 2D. The outputs of these moments, in addition to
discussion of the results are examined in detail within the following sections.
Table 8: Deck Design Options
Deck Types Geometric Options Non Composite 4 5 6
Composite 4 5 6
Once all calculations were completed, we organized our results into a series of tables
and schematics. With a variety of design options, including different girder spacings and
their appropriate reinforcing steel, we were able to make a more accurate and efficient
choice with regards to initial and life‐cycle cost in the design of our deck.
4.2.2 Results
As indicated in the above methodology, all designs were first completed by hand (see
Appendices B and C) and then integrated into Excel spreadsheets. The results of which are
summarized in the following tables and schematics.
Table 9: Non‐Composite Deck Results

47
Table 10: Composite Deck Results
Figure 24: Non Composite Deck Schematic

48
Figure 25: Composite Deck Reinforcement at Mid‐span of Girders
Figure 26: Composite Deck Reinforcement at Intermediate Pier
To clarify the location of each type of reinforcement, general schematics are provided
above; each labels the necessary design components and parameters. Figure 27 is a screen
shot of part of a typical worksheet used in our design. We’ve boxed critical areas to act as a
guide when viewing the spreadsheets. The red box outlines general information, including

49
design criteria, assumptions and parameters. The blue box identifies the various factored
and un‐factored loads used throughout the spreadsheet. Last, the black box indicates the
location of reinforcement steel selection which is also highlighted in yellow throughout all
the worksheets.
Figure 27: Screenshot of Excel Spreadsheet
The design of the non‐composite deck went relatively smoothly. The greatest challenge
was the set‐up of the primary worksheet, as seen above, which would act as a template for
not only the remaining spacings within the non‐composite design but for a large portion of
the composite spreadsheet.
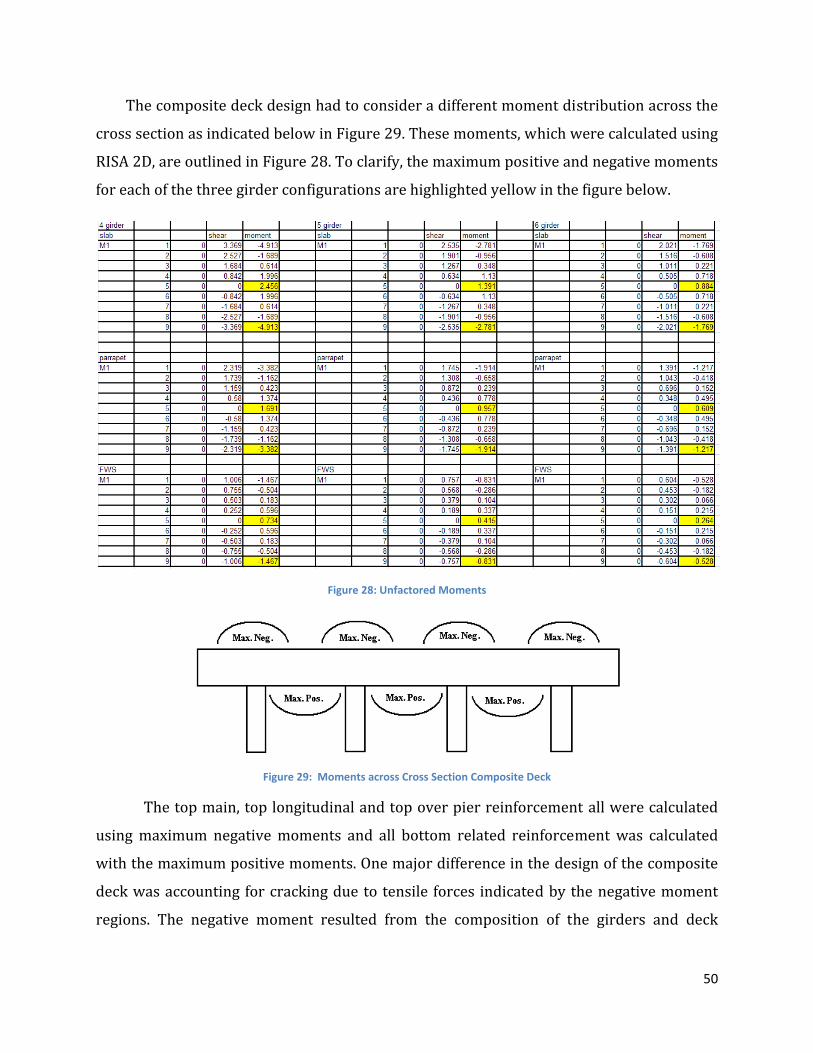
50
The composite deck design had to consider a different moment distribution across the
cross section as indicated below in Figure 29. These moments, which were calculated using
RISA 2D, are outlined in Figure 28. To clarify, the maximum positive and negative moments
for each of the three girder configurations are highlighted yellow in the figure below.
Figure 28: Unfactored Moments
Figure 29: Moments across Cross Section Composite Deck
The top main, top longitudinal and top over pier reinforcement all were calculated
using maximum negative moments and all bottom related reinforcement was calculated
with the maximum positive moments. One major difference in the design of the composite
deck was accounting for cracking due to tensile forces indicated by the negative moment
regions. The negative moment resulted from the composition of the girders and deck

51
creating fixed points versus the pin type points used in the design of the non composite
deck.
As one would expect, there was a gradual decrease in the amount of reinforcing steel
needed in both deck designs as the number of stringers increased from 4 to 6. This was due
to the loading relief each additional girder adds. The implications of this result are further
examined in the life‐cycle cost analysis to distinguish the more economically efficient
design.
4.3 Bearings
In addition to the design of the deck and girders we made some basic assumptions in
concluding the appropriate size, type and relative properties of the bearings used in our
design. In selecting a bearing, it was first important to know how much load it would need
to support. To calculate this we used the quantities calculated in our superstructure design.
In combining the weight of the superstructure components in addition to the maximum live
load obtained from the design tandem trucks scenario, we determined that each bearing
must support a maximum of 97 kips which makes the plain elastomeric bearing an easy
choice as it is capable of supporting nearing twice the required load and is the lowest in
cost as seen in Table 3 within our Background. One advantage of an elastomeric bearing is
its ability to be stiff in compression and flexible in shear maximizing its potential to resist
vertical loads while remaining flexible to lateral loading allowing for thermal expansion
and contraction. This ability coupled with their low cost and maintenance makes the
elastomeric bearing an easy choice. Figure 30 illustrates some of the basic parameters of
the bearing used in our design. Cost is examined in the life‐cycle cost section.

52
Figure 30: Bearing Schematics
4.3 Stringers
4.3.1 Design Process
The three different girder designs (prestressed concrete girder, rolled girder, and plate
girder) all started in very similar ways, but soon involved their own unique limit‐states to
their design. The loads to which each different design could be subjected had to be
calculated to give us a starting point, which was common for each of the designs. We used
AASHTO LRFD Bridge Design Specification to outline a variety of specifications when
needed. To aid us in the application of AASHTO provisions we followed examples from the
US Department of Transportation Federal Highway Administration website, specifically the
sections that contained LRFD calculations. We also used Structural Steel Design by Jack
McCormac & James Nelson, Jr., to aid us in design examples. The three different girder
designs and spacings are discussed below. Each design is discussed pertaining to the

53
unique design process that was used for each, which is followed by the results for each of
the designs and spacings.
4.3.1.1 Rolled Steel Girder
One of the main differences in designing the rolled steel girder compared to either of
the plate girder or the prestressed concrete girder is that there is a large listing of standard
sizes. This information is found in the American Institute of Steel Construction Manual,
which is very useful in the design and specifications of rolled steel girders. With the
information from this manual the design for 3 different spacings (8.34 feet, 6.675 feet, and
5.5625 feet) was completed. Two different design approaches (plastic neutral axis being in
the slab and plastic neutral axis being in steel flange) were considered because of the
characteristics of the design. The different designs had to be considered because different
equations are used if the plastic neutral axis is in the slab or if it is in the steel flange. Once
the hand calculations were completed for an initial spacing of 8.34 feet, they were
transferred into Microsoft Excel 2007 so the 2nd and 3rd spacings could be completed. With
the results computed for each of the spacings we used them to compute an initial cost and a
life‐cycle cost analysis for each of the three spacings. With this information we made an
appropriate selection.
4.3.1.2 Steel Plate Girder
The driving influence of the plate girder design was the span‐to‐depth ratio for
proportioning the cross section. The depth of the girder was based off a ratio (1/10) of its
total length. This ratio was given as the standard used for bridge design (Tonias, 1995).
This depth had an effect on the remaining design considerations because other this number
was used to calculate the web thickness and area of the flange, which affects the thickness
of the flange and width of the flange. Once the dimensions were found, the girder was
tested for maximum moment, shear and deflection. The design was found not to need end
bearing stiffeners nor intermediate stiffeners, which will be further discussed in the results
section. The plate girder hand designs were done for one spacing then transferred to
Microsoft Excel 2007 so the other two spacings could be investigated. The RISA‐2D
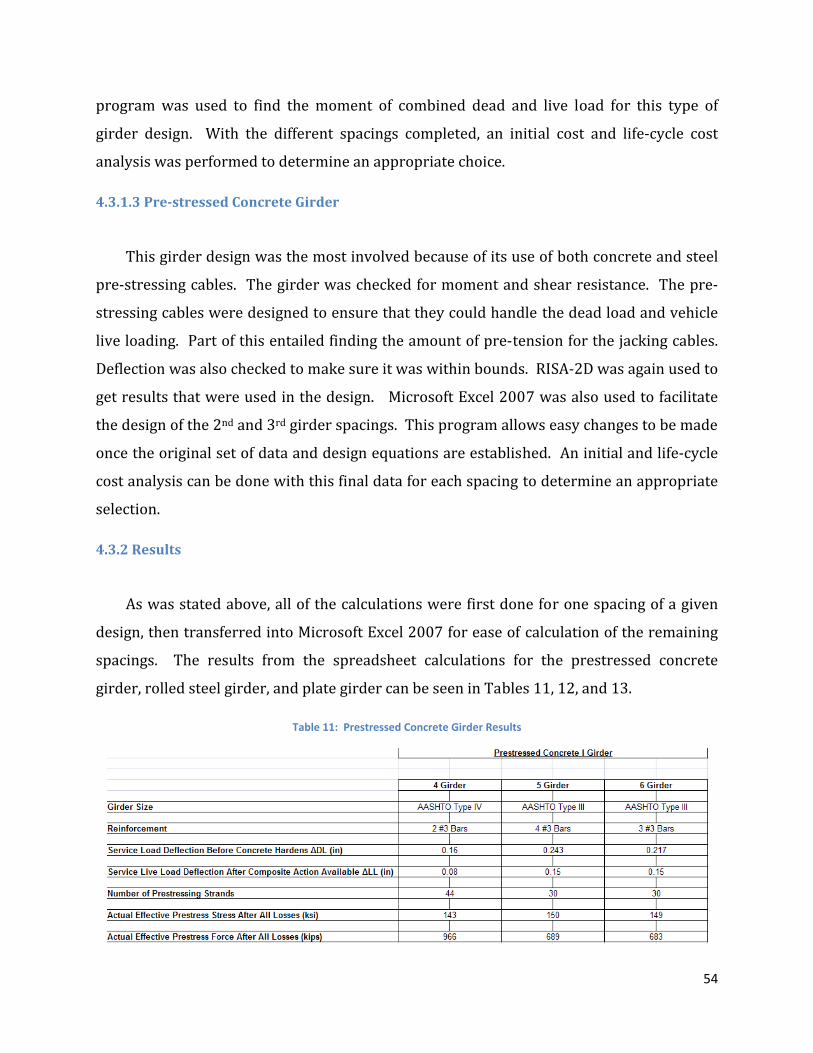
54
program was used to find the moment of combined dead and live load for this type of
girder design. With the different spacings completed, an initial cost and life‐cycle cost
analysis was performed to determine an appropriate choice.
4.3.1.3 Prestressed Concrete Girder
This girder design was the most involved because of its use of both concrete and steel
pre‐stressing cables. The girder was checked for moment and shear resistance. The pre‐
stressing cables were designed to ensure that they could handle the dead load and vehicle
live loading. Part of this entailed finding the amount of pre‐tension for the jacking cables.
Deflection was also checked to make sure it was within bounds. RISA‐2D was again used to
get results that were used in the design. Microsoft Excel 2007 was also used to facilitate
the design of the 2nd and 3rd girder spacings. This program allows easy changes to be made
once the original set of data and design equations are established. An initial and life‐cycle
cost analysis can be done with this final data for each spacing to determine an appropriate
selection.
4.3.2 Results
As was stated above, all of the calculations were first done for one spacing of a given
design, then transferred into Microsoft Excel 2007 for ease of calculation of the remaining
spacings. The results from the spreadsheet calculations for the prestressed concrete
girder, rolled steel girder, and plate girder can be seen in Tables 11, 12, and 13.
Table 11: Prestressed Concrete Girder Results
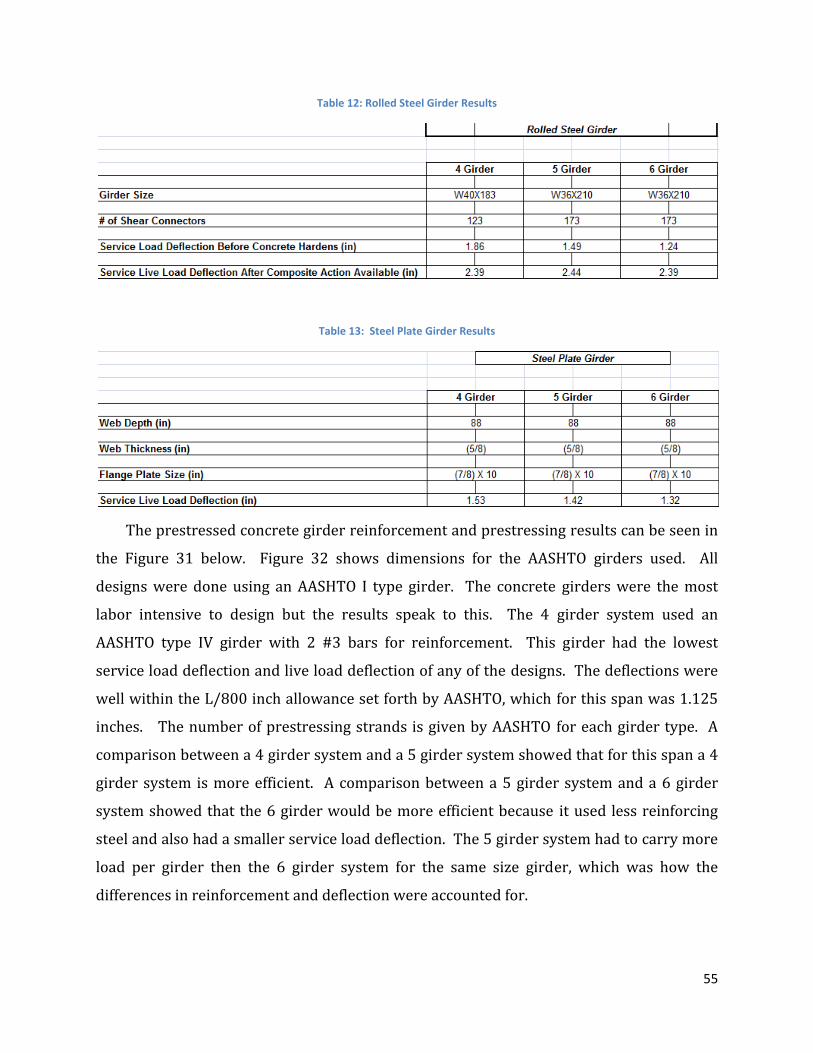
55
Table 12: Rolled Steel Girder Results
Table 13: Steel Plate Girder Results
The prestressed concrete girder reinforcement and prestressing results can be seen in
the Figure 31 below. Figure 32 shows dimensions for the AASHTO girders used. All
designs were done using an AASHTO I type girder. The concrete girders were the most
labor intensive to design but the results speak to this. The 4 girder system used an
AASHTO type IV girder with 2 #3 bars for reinforcement. This girder had the lowest
service load deflection and live load deflection of any of the designs. The deflections were
well within the L/800 inch allowance set forth by AASHTO, which for this span was 1.125
inches. The number of prestressing strands is given by AASHTO for each girder type. A
comparison between a 4 girder system and a 5 girder system showed that for this span a 4
girder system is more efficient. A comparison between a 5 girder system and a 6 girder
system showed that the 6 girder would be more efficient because it used less reinforcing
steel and also had a smaller service load deflection. The 5 girder system had to carry more
load per girder then the 6 girder system for the same size girder, which was how the
differences in reinforcement and deflection were accounted for.

56
Figure 31: Reinforcement & Prestressing Strands for AASHTO Girders
Figure 32: Dimensions for AASHTO Type Girders
As one can see from Table 6 above, the size of the rolled girder decreased as the
number of girders increased from 4 to 5, but stayed the same for 5 and 6 girder designs.
Even though the same size girder was used the service load deflection before the concrete
hardens decreased, which cannot be said for the live load deflection. The live load
deflection was larger for the 5 girder design than for a 4 girder, which is the same for the 6
girder design. The number of shear connectors also increased with increased beam size.

57
These changes could be an effect of the plastic neutral axis being in the concrete slab for the
4 girder design and it being in the steel flange for the 5 and 6 girder designs. With the PNA
being in the concrete means Y2 will be larger; therefore the PNA is located further down
resulting in a smaller sigma Qn. The PNA was in the steel flange for the 5 and 6 girder
designs which meant that Y2 would be smaller and consequently sigma Qn would be large.
This can be seen in the AISC composite design tables. The same size shear stud was used
for all three designs so the design with the smallest sigma Qn would accordingly require the
fewest shear studs.
An example of the spreadsheet can be seen below in Figure 33. We have outlined
areas to act as a guide. The red box outlines general information including, design criteria,
assumptions and parameters. The blue box includes the various factored and un‐factored
loads used throughout the spreadsheet. The black box includes the final results.
Figure 33: Sample Spreadsheet Calculations
The steel plate girder design was identical for the 3 different girder spacings. A
schematic of the steel plate girder can be seen in the figure below. It can be noted that
following the standard span‐to‐depth ratio the design strength of the girder far exceeds the
design loads for any of the designs. No end bearing or intermediate stiffeners were found

58
to be needed because of this. Adding these stiffeners would only add to the weight of the
girders since they are not needed to support the design loads. The decision of what design
to be used would therefore be based on the designer’s allowance of deflection which all of
these meet. The RISA outputs can be seen in Table 14 below that were used in the design
of the steel plate girders. Further results are attained with an initial and life‐cycle cost
analysis.
Figure 34: Plate Girder Schematic
Table 14: RISA Dead/Live Load Outputs for Steel Plate Girder

59
4.5 Piers
4.5.1 Design Process
It is first important to note that due to time constraints the pier was designed to
accommodate the pre cast girder system, as it transfers the greatest amount of load to the
substructure, mainly due to its superior size. In designing the piers we used a design
example in the LRFD section of the U.S. Department of Transportation Federal Highway
Administration website and cross examined it with Wai‐Fah Chen’s and Lian Duan’s, Bridge
Engineering Handbook. In addition, we used tables in Bridge Engineering, by Demetrios E.
Tonias, to determine the proper size reinforcement. As is consistent throughout the design
of each component, AASHTO LRFD Bridge Design Specifications was our leading reference
document. With the use of AASHTO in conjunction with the aforementioned design
example we outlined the governing limiting states that were used for the design of each
pier component in Table 15.
Table 15: Governing Limit States for each Pier Component
Component Limit States Cap Strength I, Service I
Column Strength I and V, Service 1
Footing Strength I, III and V, Service 1
The intermediate pier consists of the design of the cap, columns, footings and
foundation soil seen in Figure 35. A number of types of loads were considered for these
components, including dead, vehicle, temperature, shrinkage, wind and braking forces to
name a few.

60
Figure 35: Pier Components
In designing the pier cap, positive and negative moment resistance, minimum and
maximum reinforcement, flexural reinforcement distribution, shear resistance and
minimum reinforcement for temperature and shrinkage were all addressed. The cap was
reinforced in both the longitudinal and transverse direction to meet the aforementioned
limits outlined within AASHTO and on the U.S. DOT website.
The column design considered a number of the previous considerations. However, the
most significant element of the design was the determination of the column diameter,
which was checked for slenderness effects, along with the longitudinal reinforcing bar and
transverse tie sizes. The slenderness of the column was determined according to the
provisions within section 5.7.4.3 of AASHTO. The slenderness was determined using a ratio
if the length from the bottom of the cap to the top of the footing multiplied by a variable K
(determined from section 4.6.2.5 of AASHTO) all over a quarter times the radius of the
proposed diameter. This value must be less than the standard number twenty two. This
limit must be addressed to ensure the column’s resistance to longitudinal and transverse
loading.
Each of the four columns is positioned on a footing. The design of the footings was
relatively simple. A critical section was first determined and then the loads were applied.
Both the transverse and longitudinal faces of the footing were analyzed to determine the
proper amount of reinforcement.

61
Last, the foundation was designed to resist all applicable loads. It is important to note
that variables such as soil classification, depth of footing and soil density were assumed in
determining the footing effective dimensions and resistance factor. Therefore these
specifications must be noted for construction.
4.5.2 Results
As noted in the design process, there is one design for the pier that accommodates all
superstructure designs. The calculations for this design can be seen in Appendix G. Below,
in Table 16 the reinforcement for the pier cap, columns and footings is displayed. In
addition, schematics of each of these components are provided in Figures 36‐38, to clarify
the location of each type of reinforcement.
Table 16: Pier Reinforcement
Type of Reinforcement Bar Size No. of Bars
Cap Top Flexural Bars #9 14 Cap Bottom Flexural Bars #8 9
Cap Transverse Reinforcement #7 4 (each side) Cap Stirrup #5 4
Column Longitudinal Reinforcement
#8 16
Column Transverse Reinforcement
#3 10
Footing Top Reinforcement #5 13 Footing Bottom Reinforcement #9 13
Figure 36: Pier Cap

62
Figure 37: Pier Column
Figure 38: Pier Footing
In creating a pier design to accommodate all superstructure designs we had to
determine the most critical case, which was the six steel plate stringer composite deck
having a dead load of approximately 720 kips. This value was calculated from our
quantities within our superstructure design. In addition to this dead load, live, wind and
braking forces loads were are considered to create a sound design of the intermediate pier
which met all AASHTO specifications. In the end, our pier design helped to achieve the goal
of a complete highway overpass design, which is applied to the completion of the life‐cycle
analysis.
4.5 Abutments
4.5.1 Design Process
A single design was completed for the abutments because of time constraints. The
abutment design was completed for a 4 concrete stringer system. The abutment design
was completed with the aid of the U.S. Department of Transportation Federal Highway

63
Administration website, using the LRFD design examples. Information was also used from
Wai‐Fah Chen’s and Lian Duan’s, Bridge Engineering Handbook and Bridge Engineering, by
Demetrios E. Tonias. The abutment design was governed by AASHTO LRFD Bridge Design
Specifications, which was consistent with all of the designed components.
The abutment consists of individual parts that were designed separately but worked as
a whole, which can be seen in Figures 41‐43. These parts consisted of the piles, pile cap,
backwall, wingwall, and approach slab. These individual parts all functioned together to
provide an effective design. The parts were designed using one of the following when
considering loads; strength limit state I, strength limit state III, and extreme event limit
state, which can be seen in the figure below.
Figure 39: Design Element & Corresponding Limit State
The first step to start the design of the abutment was to gather all of the required
information such as the gravity loads (dead loads and live loads) and soil properties. The
un‐factored loads are calculated and using these loads the design of the pile cap can be
started. The pile cap design was based off of strength I limit state loads. Maximum positive
and negative reactions were found for both parts of the two stage construction.
The piles were designed once the reactions for the pile cap were completed. The pile
design consists of a steel HP section that was sized according to the forces that were
exerted on it assuming soil characteristics set forth in the background and assuming piles
fully embedded in the soil. Once a size for the HP section was determined, the number of
piles was calculated. The maximum positive and negative reactions were found using
strength I limit state as a control. The pile spacing was found once the number of piles
needed was found. An important note was considered when doing this was the pile end
64
distance, which was the distance from the end of the pile cap to the first pile. This distance
cannot be smaller than what AASHTO sets forth.
The design of the backwall started with the design of the pile cap for gravity loads.
The abutment was constructed in two stages; therefore two cases A and B were used. Case
A mulled over the self‐weight of the abutment, the reactions of the stringers due to self
weight of the stringers, deck, slab, and haunch. Case B considered the design of the
abutment under effect of the full loads on the abutment. Case A was controlled by strength
limit state III and found the maximum positive and negative reactions for shear and flexure.
The same procedure was done for Case B. Using this information, the amount and location
of steel bar reinforcement was determined for the pile cap.
The backwall was designed once the pile cap design was completed. The backwall was
designed to resist passive earth pressure, which is the maximum lateral soil pressure that
may be exerted on the abutment. No loading factor is specified in AASHTO for passive
earth pressure, so it was assumed that it was the same as active earth pressure. Active
earth pressure is the minimum lateral soil pressure that may be exerted on the abutment.
It was also assumed that the backwall acted as a continuous beam. Shear and flexure were
checked for the back wall and from this information, a design for the steel bar
reinforcement was done.
For the design of the wingwall, two load cases were considered. These two cases were
applied using the Rankine theory, where beta, the back fill angle, was 0 degrees and phi, the
angle of shearing resistance of the soil was 33 degrees. A surcharge load was not
considered because an approach slab and roadway cover the abutment backfill material.
Load case 1 subjects the wingwall to passive earth pressure and was considered under
strength I limit state. Load case 2 subjects the wingwall to active earth pressure and
collision loading on a parapet and was considered under extreme event limit state. Once
the maximum positive and negative forces were determined for each load case, the
governing loads were selected and the steel bar reinforcement was designed.
The approach slab was also a critical part of the abutment design. The approach slab
was designed to be placed on a sleeper slab. The design was started by determining the
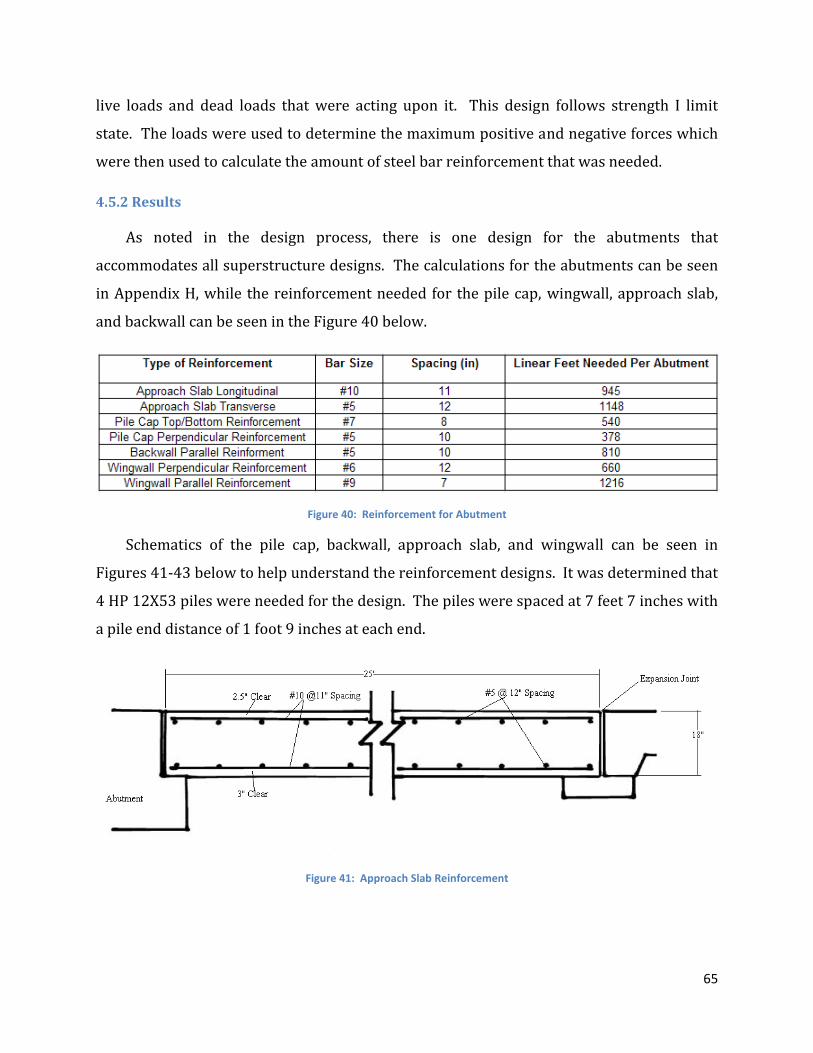
65
live loads and dead loads that were acting upon it. This design follows strength I limit
state. The loads were used to determine the maximum positive and negative forces which
were then used to calculate the amount of steel bar reinforcement that was needed.
4.5.2 Results
As noted in the design process, there is one design for the abutments that
accommodates all superstructure designs. The calculations for the abutments can be seen
in Appendix H, while the reinforcement needed for the pile cap, wingwall, approach slab,
and backwall can be seen in the Figure 40 below.
Figure 40: Reinforcement for Abutment
Schematics of the pile cap, backwall, approach slab, and wingwall can be seen in
Figures 41‐43 below to help understand the reinforcement designs. It was determined that
4 HP 12X53 piles were needed for the design. The piles were spaced at 7 feet 7 inches with
a pile end distance of 1 foot 9 inches at each end.
Figure 41: Approach Slab Reinforcement
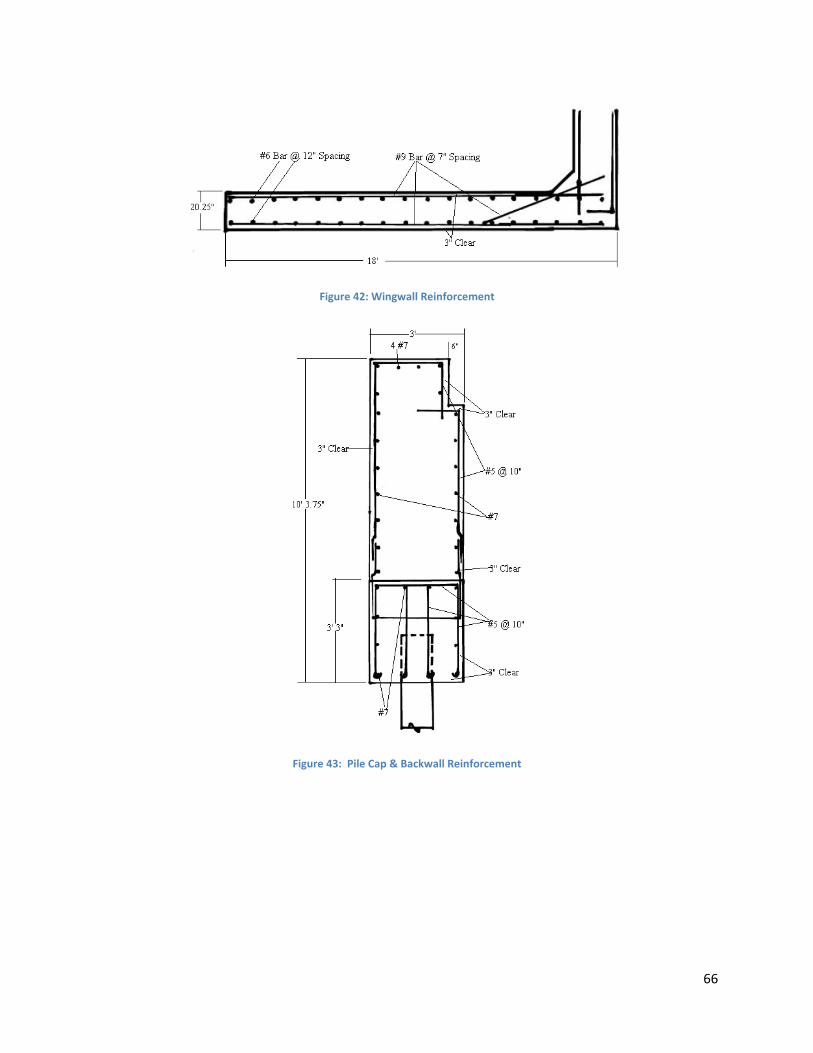
66
Figure 42: Wingwall Reinforcement
Figure 43: Pile Cap & Backwall Reinforcement

67
5. Evaluation of Alternatives
In this section the designs from Chapter 4 are evaluated using the three comparative
measures outlined within the methodology and background. With this each design is
assessed on the premise of constructability and initial and life‐cycle cost.
5.1 Constructability
A factor that was considered when choosing which girder system to use was the
constructability of the proposed design. We looked at factors that could make it easier or
more difficult for a construction company to build the selected components. These factors
included mobility (which impacts shipment and assembly), labor required for installation,
construction site space demand (impacted by the amount of material to be stored on site),
and accessibility of each component.
Below is a more quantitative analysis of the constructability of each superstructure
component. The following table defines how each consideration is quantified.
Table 17: Quantifying Construction Considerations
Construction Considerations
Quantified using: Reference
Mobility of components (shipment and construction site)
Weight of Component Design Calculations
Onsite Assembly Labor costs Concrete vs. Steel, 2005 Construction site space dedicated to material storage
Volume of Component Design Calculations
Procurement of Materials Fabrication difficulty (Number of fabricators nationally for given material)
Concrete vs. Steel, 2005
We analyzed the constructability of the three different girder options seen in Table 18.
It is important to note we included the applicable deck with each girder option, in

68
determining their overall constructability. The level of difficulty or level of involvement
required to conduct each construction consideration was scored as follows: best (3),
neutral (2) or worst (1).
Table 18: Data to Assign Constructability Ratings
Construction Considerations
Rolled Beam Girder Plate Girder Precast Girder
Mobility of components (weight of materials for 4 girder system design)
316,492 lbs 335,392 lbs 515,324 lbs
Onsite Assembly Although we were unable to distinguish an advantage to rolled beam vs. plate girders we did find an overwhelming amount of support towards the advantages of concrete construction. Alfred G. Gerosa, President of the Concrete Alliance Inc. states, “Structures with concrete can almost always be built faster. When compared to structural steel, sometimes twice as fast.” (Concrete vs. Steel, 2005)
Construction Site Size (volume of reinforcing steel. and girders for 4 girder system design)
128 ft^3 173 ft^3 1686 ft^3
Procurement of Materials
Availability of steel or concrete varies primarily by location. In general, many states reported shortages of cement in 2004 and 2005 as a result of an increase in winter construction. In an effort to supplement the shortage of cement, more is being imported, which increases costs due to the increased shipping rates. This ultimately has resulted in an unreliable supply. It is important to note that this has mostly impacted smaller contractors rather than large‐scale transportation agencies. Steel’s availability is limited in some people’s minds due to the heavy amounts of construction in Asia. However, experts from the steel industry insist there is no shortage, explaining the ability of the U.S. to produce over 6 million tons of steel a year which far supersedes our current need. (Concrete vs. Steel, 2005) With the above information, in conjunction with no initial predefined location, it is impossible to consider procurement of materials into our constructability analysis. Though are results would appear more conclusive by locating the bridge for this particular component of the constructability analysis, the overall results will be tarnished as location affects a number of issues within the analysis. It is better to keep the focus more general while remaining aware of jurisdictional impacts.
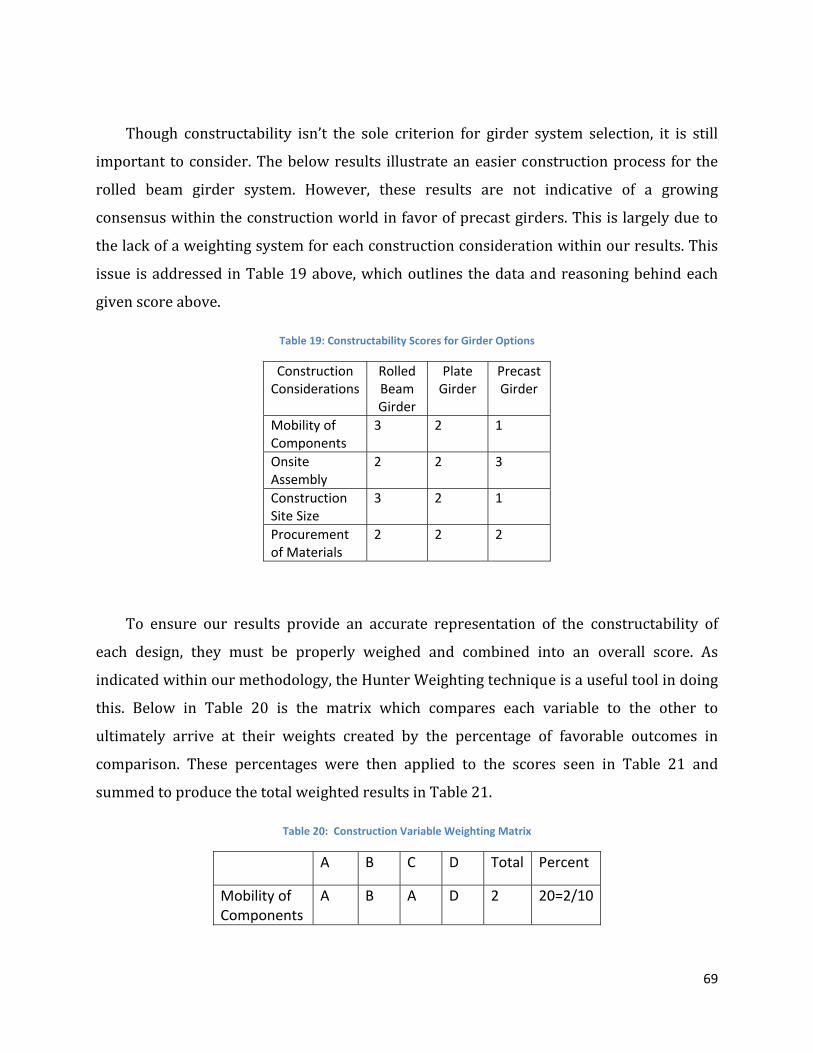
69
Though constructability isn’t the sole criterion for girder system selection, it is still
important to consider. The below results illustrate an easier construction process for the
rolled beam girder system. However, these results are not indicative of a growing
consensus within the construction world in favor of precast girders. This is largely due to
the lack of a weighting system for each construction consideration within our results. This
issue is addressed in Table 19 above, which outlines the data and reasoning behind each
given score above.
Table 19: Constructability Scores for Girder Options
Construction Considerations
Rolled Beam Girder
Plate Girder
Precast Girder
Mobility of Components
3 2 1
Onsite Assembly
2 2 3
Construction Site Size
3 2 1
Procurement of Materials
2 2 2
To ensure our results provide an accurate representation of the constructability of
each design, they must be properly weighed and combined into an overall score. As
indicated within our methodology, the Hunter Weighting technique is a useful tool in doing
this. Below in Table 20 is the matrix which compares each variable to the other to
ultimately arrive at their weights created by the percentage of favorable outcomes in
comparison. These percentages were then applied to the scores seen in Table 21 and
summed to produce the total weighted results in Table 21.
Table 20: Construction Variable Weighting Matrix
A B C D Total Percent
Mobility of Components
A B A D 2 20=2/10

70
(A)
Onsite Assembly (B)
B B B 4 40
Construction Site Size (C)
C D 1 10
Procurement of Materials (D)
D 3 30
Totals 10 100
Table 21: Weighted Constructability Scores
Construction Considerations
Rolled Beam Girder
Plate Girder
Precast Girder
Mobility of Components
3*(0.2)=0.6 2*(0.2)=0.4 1*(0.2)=0.2
Onsite Assembly
2*(0.4)=0.8 2*(0.4)=0.8 3*(0.4)=1.2
Construction Site Size
3*(0.1)=0.3 2*(0.1)=0.2 1*(0.1)=0.1
Procurement of Materials
2*(0.3)=0.6 2*(0.3)=0.6 2*(0.3)=0.6
Total Scores 2.3 2.0 2.1
With each variable and score validated and the Hunter Weighing scheme applied we
were able to provide an important perspective of bridge design to produce a well‐rounded
final recommendation. Though we predicted the precast girder to achieve the highest
constructability due to industry trends, our analysis proved otherwise. This may be due in
part to an even heavier weight than was placed on the consideration of onsite assembly as
we push to an era where user costs become increasingly important factors in infrastructure
management. In any event, the connection between engineer and contractor is of growing
importance as we progress into the future where the implication of life‐cycle costing
becomes a commodity. Designing with constructability in mind will ensure construction
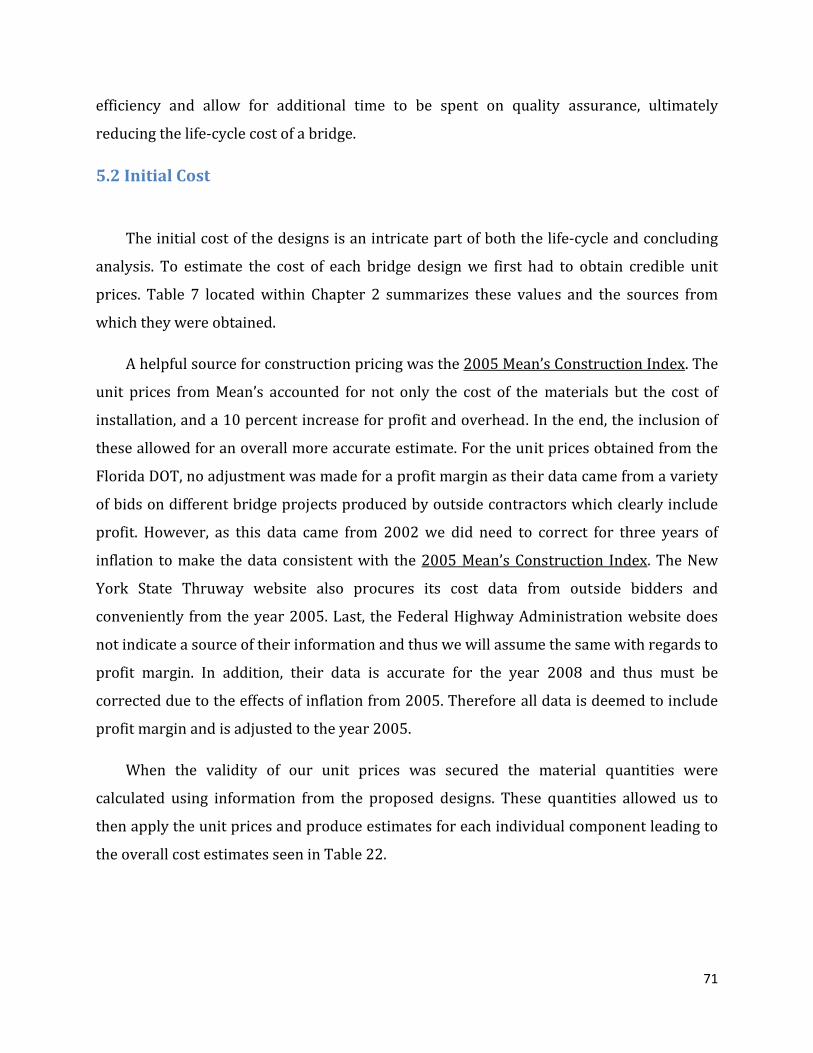
71
efficiency and allow for additional time to be spent on quality assurance, ultimately
reducing the life‐cycle cost of a bridge.
5.2 Initial Cost
The initial cost of the designs is an intricate part of both the life‐cycle and concluding
analysis. To estimate the cost of each bridge design we first had to obtain credible unit
prices. Table 7 located within Chapter 2 summarizes these values and the sources from
which they were obtained.
A helpful source for construction pricing was the 2005 Mean’s Construction Index. The
unit prices from Mean’s accounted for not only the cost of the materials but the cost of
installation, and a 10 percent increase for profit and overhead. In the end, the inclusion of
these allowed for an overall more accurate estimate. For the unit prices obtained from the
Florida DOT, no adjustment was made for a profit margin as their data came from a variety
of bids on different bridge projects produced by outside contractors which clearly include
profit. However, as this data came from 2002 we did need to correct for three years of
inflation to make the data consistent with the 2005 Mean’s Construction Index. The New
York State Thruway website also procures its cost data from outside bidders and
conveniently from the year 2005. Last, the Federal Highway Administration website does
not indicate a source of their information and thus we will assume the same with regards to
profit margin. In addition, their data is accurate for the year 2008 and thus must be
corrected due to the effects of inflation from 2005. Therefore all data is deemed to include
profit margin and is adjusted to the year 2005.
When the validity of our unit prices was secured the material quantities were
calculated using information from the proposed designs. These quantities allowed us to
then apply the unit prices and produce estimates for each individual component leading to
the overall cost estimates seen in Table 22.

72
Table 22: Engineering Cost Estimates for Each Bridge Design
4 Girder 5 Girder 6 Girder
Composite Pre‐stressed Concrete Girder
$356,634 $394,266 $407,017
Non‐ Composite Steel Rolled Beam Girder
$386,893 $441,730 $466,108
Non‐Composite Steel Plate Girder
$402,682 $461,466 $489,791
It is also important to note that the final values were adjusted for three years of
inflation from 2005 to current. All inflation values were taken as an average over the
applicable span of years and procured from inflationdata.com. These values are displayed
in Table 23.
Table 23: Inflation Rates
Time Frame Average Inflation Rate
2002‐2005 2.18 %
2005‐2008 3.16%
To further validate our results, we applied a unit price for the national average of
overall bridge costs ($94 per square foot) obtained from the Federal Highway Website, to
our bridge and compared that number to the average cost of all our designs. The difference
between these values was $190, 304. However, if our average cost was compared to a state
with a higher average unit price such as Massachusetts ($144 per square foot) then our
average cost estimate would be within $70,000, proving the economical significance of
building in different regions. The figure below shows the cost of each design per square
foot, with an average for all designs of $171/foot squared. With the estimated costs
calculated and validated the remaining life‐cycle costs can be explored.

73
Figure 44: Engineer's Cost per Square Foot
5.3 LifeCycle Results
The life‐cycle analysis was completed using a spreadsheet provided by Professor
Leonard Albano. The life‐cycle cost analysis, which was a present worth (PW) analysis, was
completed for a 70 year cycle at a discount rate of 6%. This spreadsheet was used to
calculate a variety of results, which can be seen in Figure 44 below. This spread sheet is an
example of the fields used in the actual spreadsheet. Figure 45 below displays the results
from the actual spreadsheet used. From this figure it was seen that the prestressed
concrete girder with 4 girders had the lowest PW life‐cycle cost, $398,620, of any of the
designs. The prestressed concrete girder with 5 girders had the 2nd lowest PW life‐cycle
cost, $437,944, followed by the rolled steel girder with 4 girders, $447,670, which was only
slightly less expensive than the last prestressed concrete girder design which was
$451,268. The least cost plate girder design was for 4 girders which came in at $464,881.
On average the prestressed concrete girders were the most economical, followed by the
rolled steel girder designs and the steel plate girder designs.
The total savings using the present worth method can also be seen in the figure below
for each design compared to a life‐cycle cost without the time value of money. The
prestressed concrete girder with 4 girders saved $276,931 compared to a life‐cycle cost
without the time value of money. The figure below also shows the present worth savings of
a design compared to the least expensive design, which is the prestressed concrete girder
with 4 girders. The second least expensive design was $39,324 more expensive and the
most expensive design was $161,208 more than the least expensive design. By completing
the life‐cycle analysis, a design that had an initial cost more than another design ended up

74
being more economical in the long run. This was observed for the prestressed concrete
girder with 5 girders and the rolled steel girder with 4 girders. The initial cost for the
prestressed concrete girder ($394,266) was higher than the rolled steel girder ($386,893),
but after applying the life‐cycle cost analysis it was determined that the prestressed
concrete girder ($437,944) would be more economical than the rolled steel girder
($447,670) over the 70 year life‐cycle.

75
Figure 45: Example Life‐Cycle Cost Spreadsheet

76
Figure 46: Life‐Cycle Cost Analysis Results
77
6. Related Issues for Cost, Funding and Maintenance
In addition to evaluating each design, it is important to consider the impact of related
issues with respect to cost, funding and maintenance in assessing the implications of our
results on current infrastructure management practices. To gain this perspective we
examined, the impact of building in different regions, state versus federal funding and the
impact of non‐destructive testing on bridge inspections.
6.1 Impact of Constructing in Different Regions
The state or region in which a bridge is constructed can have an enormous impact on
initial, maintenance, and rehabilitation costs. The philosophy of a particular DOT with
respect to bridges can affect how rehabilitation and maintenance is approached as well as
the total funds that are allocated.
There are two major contributors to variances in initial costs between different states;
labor costs and material prices. Labor costs differ from state to state. The 2005 Mean’s
Construction Index gives labor costs for each state. North Carolina has the lowest
installation costs whereas New York has the highest. These discrepancies can have a
significant effect on the overall costs. As indicated, material prices can be affected by the
location of construction. A greater availability of a material in an area makes it more cost
effective. A good example of this would be the relatively low cost of steel construction in
Pennsylvania, due to the decreased price of steel caused by the high number of steel mills.
In fact the United States Steel Corporation headquarters is located in Pittsburgh. Though a
majority of the impacts are associated with the initial construction cost, there are other
variables affected by the location of a bridge that can influence future condition and
therefore the maintenance and rehabilitation costs.
The condition of a bridge is often influenced by the practices of the governing agency
which is responsible for it. Generally there are two types of approaches to infrastructure
management, proactive and reactive. All states perform routine maintenance, but only
proactive states implement systems that are efficient in determining and solving problems

78
before they occur. This type of approach requires more funding in the maintenance area
and aims to alleviate rehabilitation and replacement costs by addressing potential
problems before they become critical.
Though our project is of a theoretical design it is important to understand the impact
of potentially applying it to various locations. Considering both the initial and continuing
costs of infrastructure projects are crucial for any transportation agency to remain
successful.
6.2 State versus Federal Highway Funding
In the world of highway design and construction the derivation of funding is of critical
concern. A vast majority of funding is obtained from two different agencies: state and
federal. To fully understand the implications of each route of funding, it is important to
compare their level of involvement to the highway system in addition to their specific
contribution to bridges with respect to replacement, rehabilitation and maintenance costs.
In 1956 President Dwight Eisenhower signed the Federal‐aid Highway Act which
established the Highway Trust Fund. The trust fund was established to ensure a
dependable source of revenue for our nation’s highways and is used to aid growing state
highway budgets. It is important to note, “the Nation’s capital investment in its highway
system has doubled in the last 20 years, and during that time period as a whole, state and
local investment in highways outstripped federal investment in highways‐both in terms of
the amount of and growth in spending. “ (United States Government Accountability Office,
2004) In an attempt to further quantify this statement, from 1982 to 2002 states and local
governing agencies have increased their spending 150 percent whereas federal investment
only increased 98 percent, putting their overall contributions to highway funding in 2002
at 54% and 46% respectively. (United States Government Accountability Office, 2004)
Though the federal highway budget is substantial, only a small portion of it is
contributed to bridge work. For example, in 2007 Florida received 5.4% of the federal
highway budget and only allocated 2% of those funds for bridge use. (Federal Highway
Funding and Legislation, 2007)This is in part due to the priorities of the state and part due
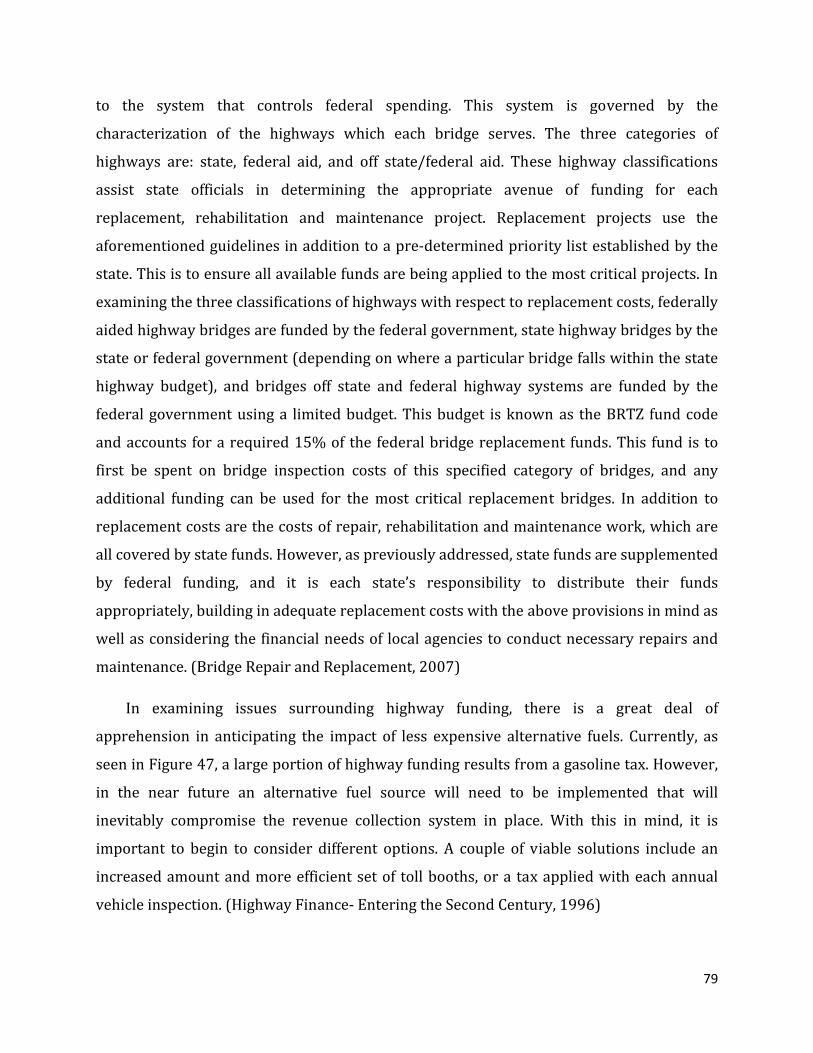
79
to the system that controls federal spending. This system is governed by the
characterization of the highways which each bridge serves. The three categories of
highways are: state, federal aid, and off state/federal aid. These highway classifications
assist state officials in determining the appropriate avenue of funding for each
replacement, rehabilitation and maintenance project. Replacement projects use the
aforementioned guidelines in addition to a pre‐determined priority list established by the
state. This is to ensure all available funds are being applied to the most critical projects. In
examining the three classifications of highways with respect to replacement costs, federally
aided highway bridges are funded by the federal government, state highway bridges by the
state or federal government (depending on where a particular bridge falls within the state
highway budget), and bridges off state and federal highway systems are funded by the
federal government using a limited budget. This budget is known as the BRTZ fund code
and accounts for a required 15% of the federal bridge replacement funds. This fund is to
first be spent on bridge inspection costs of this specified category of bridges, and any
additional funding can be used for the most critical replacement bridges. In addition to
replacement costs are the costs of repair, rehabilitation and maintenance work, which are
all covered by state funds. However, as previously addressed, state funds are supplemented
by federal funding, and it is each state’s responsibility to distribute their funds
appropriately, building in adequate replacement costs with the above provisions in mind as
well as considering the financial needs of local agencies to conduct necessary repairs and
maintenance. (Bridge Repair and Replacement, 2007)
In examining issues surrounding highway funding, there is a great deal of
apprehension in anticipating the impact of less expensive alternative fuels. Currently, as
seen in Figure 47, a large portion of highway funding results from a gasoline tax. However,
in the near future an alternative fuel source will need to be implemented that will
inevitably compromise the revenue collection system in place. With this in mind, it is
important to begin to consider different options. A couple of viable solutions include an
increased amount and more efficient set of toll booths, or a tax applied with each annual
vehicle inspection. (Highway Finance‐ Entering the Second Century, 1996)

80
Figure 47: Highway Funding Contributors (Federal Highway Funding and Legislation, 2007)
Funding of our nation’s highways is of necessary importance. A firm understanding
and continued development of the current system will allow us to account and prepare for
any necessary changes. Overall, it is imperative to have a sustainable funding structure to
ensure consistent, high quality highway transportation in the future.
6.3 Impact of Nondestructive Testing on Bridge Inspecting
“Federal law mandates that each bridge, spanning more than 20 feet, “is to be
inspected at regular intervals not to exceed 2 years in accordance with section 2.3 of the
AASHTO Manual.” (Federal Highway Administration, DOT, 2002) To assist and improve
these inspections; the use of nondestructive testing can be implemented. To understand
the impact nondestructive testing can have on current inspection practices, we must first
examine the advantages it offers as well as its application to the bridge industry.
“The field of Nondestructive Testing (NDT) is a very broad, interdisciplinary field that
plays a critical role in assuring that structural components and systems perform their
function in a reliable and cost effective fashion.” (Non‐Destructive Testing, 2007) NDT
allows us to quickly examine the condition of a material and identify any defects that could
cause larger problems in the future. In addition, NDT does not diminish the operational and
monetary value of the given material, “providing an excellent balance between quality
control and cost‐effectiveness.” (Non‐Destructive Testing, 2007)
Gasoline
Diesel and Special Fuels
Truck Use
Truck Tires
Truck Sales

81
There lies enormous potential in applying nondestructive testing to improve current
bridge inspection practices. Currently, inspection techniques rely heavily on lane closures,
which have an adverse effect on the efficiency of our traffic system and increase user costs
as transportation consumes a large portion of overhead costs for all goods and services,
especially in this day and age. In using appropriate non‐destructive tests, surveys can be
conducted at the speed of traffic relieving the economic stresses that result from the
current inspection system. Nondestructive testing also reduces the risk of accidents,
improving safety. In addition to user cost savings, nondestructive testing if used
periodically, can identify problems early and alleviate high costs associated with
rehabilitation and replacement work.
A type of NDT that is widely used and achieves the aforementioned improvements is
Ground Penetrating Radar (GPR). “There has been increased encouragement from agencies
such as the FHWA to incorporate the use of GPR for bridge and pavement management
applications.” (Infrasense.com, 2007) The application of GPR can provide us with condition
data such as the location of delamination, freeze‐thaw damage, deteriorations as well as
debonding of the overlay. In addition to condition data, GPR can also offer thickness
measurements, rebar depth, joint spacing, amongst others. (Infrasense.com, 2007) One of
the greatest advantages to GPR data is the ability to map it, allowing for the location and
quantities of poor conditioned areas to be easily identified with respect to the coordinates
of a particular bridge. Figure 48 shows a typical GPR condition map.
Figure 48: Sample GPR Condition Map (Infrasense, 2007)

82
Though GPR can provide a more efficient deck survey it does not provide an analysis of
the substructure condition making it an aid and not a replacement for the current
inspecting process.
Through our research we conclude that nondestructive testing can assist and improve
current federally mandated inspection practices. The implementation of NDT will provide
the means for a more accurate and thorough inspection, while minimizing user related
costs.
83
7. Project Conclusions
The overall purpose of this report was to compare three different bridge designs on
the premise of constructability as well as initial and life‐cycle cost. An extensive
background was developed for each bridge component in addition to the aforementioned
comparative measures. This background was applied to create an efficient and accurate
procedure for the design and comparison of each system. In the end we obtained results for
each independent comparative analysis. Though these results reveal a great deal of
information they are not entirely conclusive. In this section we discuss these independent
results and unite them to form our final recommendation. In addition we tie the different
aspects of our report together to address, our recommendations correspondence with
industry trends, the implications projects such as this can have on infrastructure
management practices, and the impact jurisdiction has on funding and maintenance related
issues.
As indicated in our results, the three designs were compared on the premise of initial
and life‐cycle cost as well as constructability. The initial cost concluded that the pre cast
girder system was decisively the most economically advantageous design. The validity of
our cost estimates was proven by cross referencing them with unit prices for the national
average of bridge construction costs in addition to a few states. In addition to construction
cost estimates, life‐cycle cost analyses were investigated. This analysis also proved the pre
cast girder design to be more economically appealing, due to its lower maintenance,
replacement and ultimately overall life‐cycle costs. As a result, the initial investment to
benefit from the savings life‐cycle planning can provide would be significantly less than the
second economically beneficial system. Last, constructability was examined. However, this
analysis did not conclude the precast girder design to be the most efficient with respect to
construction despite the growing consensus within the infrastructure world. Though
Hunter’s Weighted Evaluation Approach was applied, we feel there was still not enough
weight put on the “onsite assembly” variable, which favored precast girder construction.
Despite this anomaly, the precast girder system is undoubtedly our recommendation with
respect to the preceding comparative measures.

84
In addition to the recommended result of our study, it is important to note that precast
girder bridges are a growing commodity in the infrastructure industry. “More extensive use
of precast concrete components, which are fabricated off site and then connected on‐site,
can allow bridges to be constructed more rapidly.” (Hieber, Wacker, Eberhard and Stanton,
2006) This rapid construction process allows for less labor and ultimately reduces the
overall initial cost. With this it is easy to understand the growing partiality towards precast
bridges.
On top of the immediate fiscal related advantages the precast system offers comes
minimal user costs. Low maintenance and high speed construction practices reduce user
related costs associated with traffic flow inefficiencies. It is important to consider this in
addition to the evaluation techniques to fully understand the implications projects such as
this can have on infrastructure management practices. By applying the techniques with this
report to numerous sets of differing initial conditions (i.e. span length, loading, number of
lanes, etc.) will allow governing agencies to properly identify the most advantageous design
with respect to constructability, initial and life‐cycle cost while continuing to consider user
related costs.
Last, in applying the results of this report it is also important to consider the impact of
the location with regards to funding policies, maintenance practices and construction
norms. As addressed in Chapter 6, funding policies have an enormous impact on project
priorities. For example, a state which allocates relatively low funding towards bridge
maintenance may be more inclined to pay a higher initial cost to ensure a more sustainable
structure. In addition, states which put less emphasis on maintenance, address problems as
they occur, earning the title “reactive.” In contrast proactive states stress the importance of
maintenance related issues including the prioritization of prospective problems. Last,
applying the comparative measures of this report requires the consideration of
construction norms within a given region. The availability of materials in a certain area can
have a dramatic impact on not only the initial cost but on rehabilitation and replacements
costs as well. In examining the above issues, the location of a project is undoubtedly of
great importance.
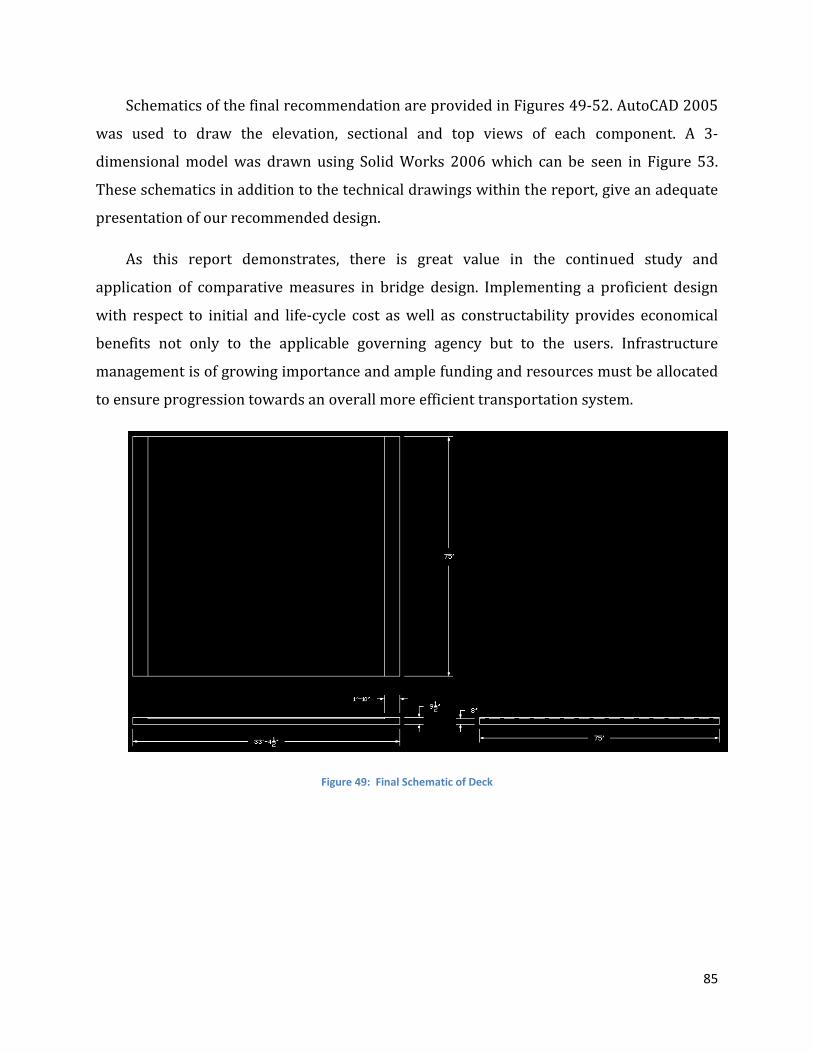
85
Schematics of the final recommendation are provided in Figures 49‐52. AutoCAD 2005
was used to draw the elevation, sectional and top views of each component. A 3‐
dimensional model was drawn using Solid Works 2006 which can be seen in Figure 53.
These schematics in addition to the technical drawings within the report, give an adequate
presentation of our recommended design.
As this report demonstrates, there is great value in the continued study and
application of comparative measures in bridge design. Implementing a proficient design
with respect to initial and life‐cycle cost as well as constructability provides economical
benefits not only to the applicable governing agency but to the users. Infrastructure
management is of growing importance and ample funding and resources must be allocated
to ensure progression towards an overall more efficient transportation system.
Figure 49: Final Schematic of Deck

86
Figure 50: Final Schematic of Girder
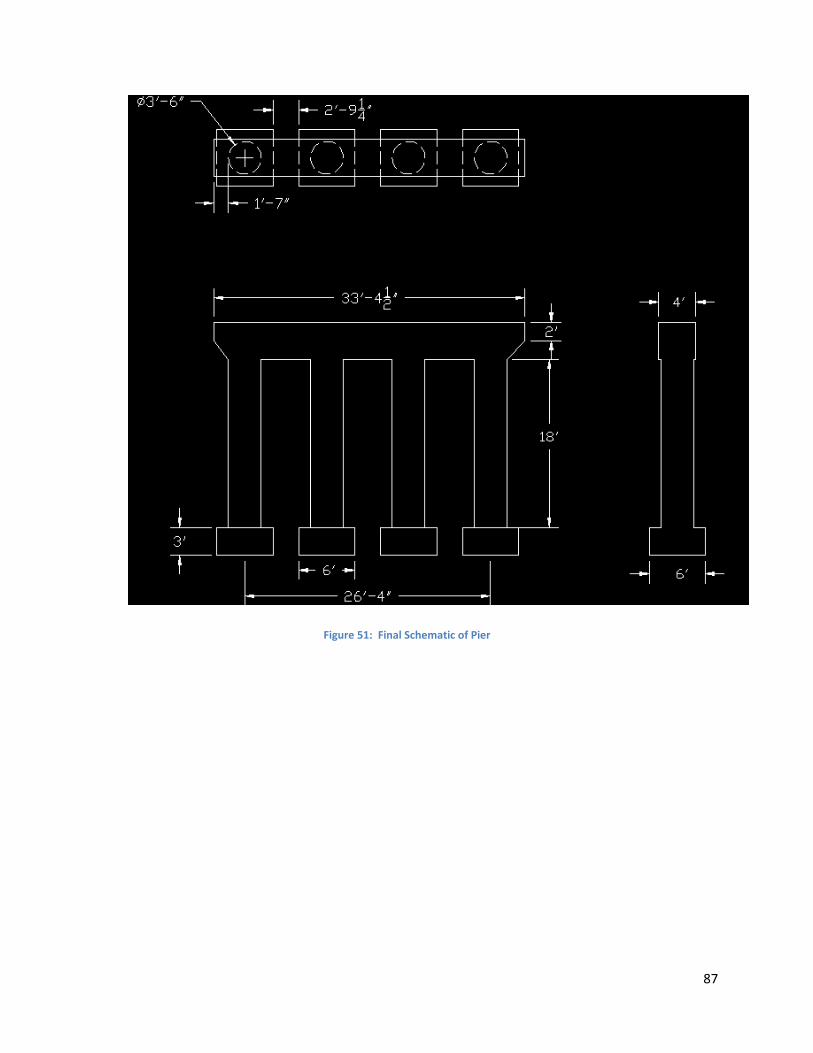
87
Figure 51: Final Schematic of Pier

88
Figure 52: Final Schematic of Abutment
Figure 53: Three Dimensional View of Design

89
Sources
AASHTO Girder Section Properties. (2000). Retrieved November 2007. <http://www.gcprestress.com/product/sp‐1.html>
AASHTO LRFD Bridge Design Specifications. (1998). Washington, D.C.: American Association of State Highway and Transportation Officials
American Institute of Steel Construction Inc. Steel Construction Manual 13th Edition. (December 2005)
Bearing Devices. (2005). Retrieved January 15, 2008. <http://www.nysthruway.gov/business/design‐manual/section8.pdf>
Bridge Development Report Cost Estimating. (August, 12, 2002). Retrieved December 3, 2007. <http://www.dot.state.fl.us/structures/Manuals/LRFDSDG2002AugChap11.pdf>
Chen, Wai‐Fah (Ed.) & Duan, Lian (Ed.) (1999). Bridge Engineering Handbook. Boca Raton, Florida: CRC Press
Christian, James. Federal Highway Funding and Legislation. (November 16, 2007). Retrieved February 5, 2008. <http://www.hagenconsultingservices.com/Downloads/Session4_FHWA%202007_ITE.pdf>
City of Rockville Department of Public Works. Standard Prices for Cost Estimating & Permit Applications. (April 2003). Retrieved February 10, 2008. <http://www.rockvillemd.gov/e‐gov/pw/Standard_Prices_Cost_Est_Permit.pdf>
Concrete vs. Steel. (2005). Retrieved February 4, 2008. <http://www.buildings.com/articles/detail.aspx?contentID=2511>
Empirical Study of Life Cycle Cost Analysis for Bridges. (2003). Retrieved October 7, 2007. <http://www.iti.northwestern.edu/research/presentations/hadavi/2003‐hadavi‐aace‐december.pdf>
Federal Highway Administration, DOT. National Bridge Inspection Standards. (2002). Retrieved February 7, 2008. <http://a257.g.akamaitech.net/7/257/2422/14mar20010800/edocket.access.gpo.gov/cfr_2002/aprqtr/pdf/23cfr650.303.pdf>
Florida Department of Transportation. Bridge Repair and Replacement. (September 21, 2007). Retrieved February 5, 2008. <http://www.dot.state.fl.us/programdevelopmentoffice/Development/PDFInstructions2008/PARTIIICHAP05.pdf>
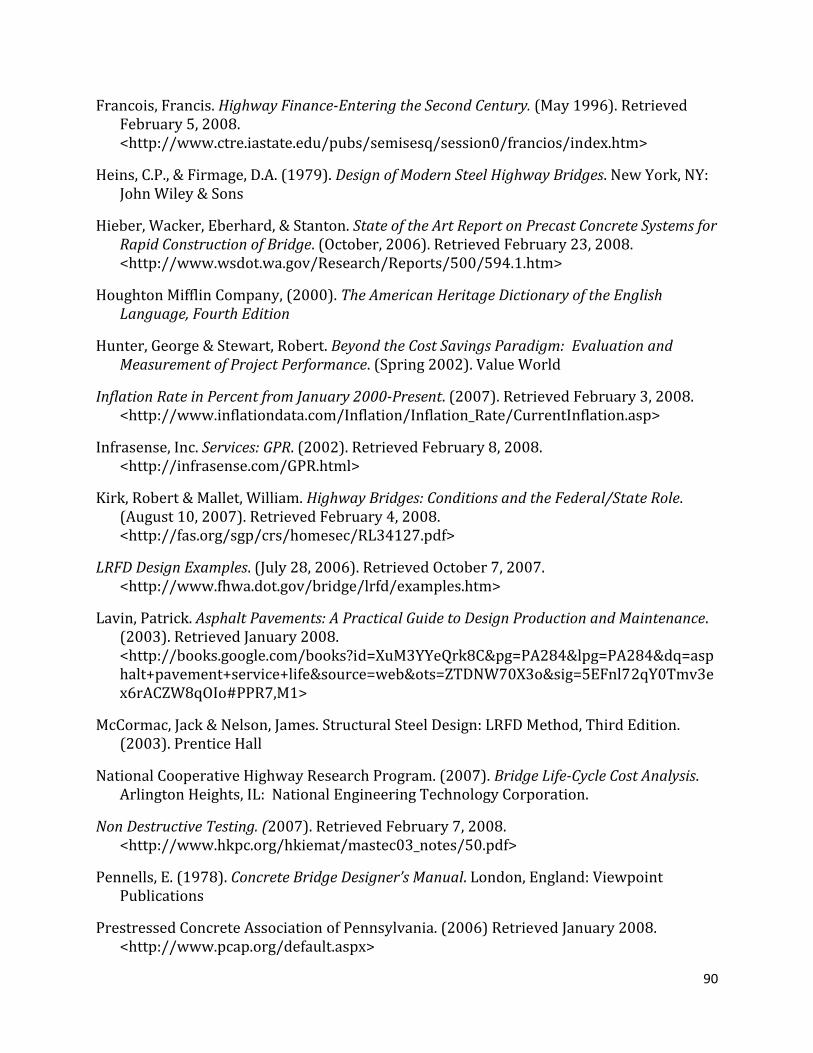
90
Francois, Francis. Highway FinanceEntering the Second Century. (May 1996). Retrieved February 5, 2008. <http://www.ctre.iastate.edu/pubs/semisesq/session0/francios/index.htm>
Heins, C.P., & Firmage, D.A. (1979). Design of Modern Steel Highway Bridges. New York, NY: John Wiley & Sons
Hieber, Wacker, Eberhard, & Stanton. State of the Art Report on Precast Concrete Systems for Rapid Construction of Bridge. (October, 2006). Retrieved February 23, 2008. <http://www.wsdot.wa.gov/Research/Reports/500/594.1.htm>
Houghton Mifflin Company, (2000). The American Heritage Dictionary of the English Language, Fourth Edition
Hunter, George & Stewart, Robert. Beyond the Cost Savings Paradigm: Evaluation and Measurement of Project Performance. (Spring 2002). Value World
Inflation Rate in Percent from January 2000Present. (2007). Retrieved February 3, 2008. <http://www.inflationdata.com/Inflation/Inflation_Rate/CurrentInflation.asp>
Infrasense, Inc. Services: GPR. (2002). Retrieved February 8, 2008. <http://infrasense.com/GPR.html>
Kirk, Robert & Mallet, William. Highway Bridges: Conditions and the Federal/State Role. (August 10, 2007). Retrieved February 4, 2008. <http://fas.org/sgp/crs/homesec/RL34127.pdf>
LRFD Design Examples. (July 28, 2006). Retrieved October 7, 2007. <http://www.fhwa.dot.gov/bridge/lrfd/examples.htm>
Lavin, Patrick. Asphalt Pavements: A Practical Guide to Design Production and Maintenance. (2003). Retrieved January 2008. <http://books.google.com/books?id=XuM3YYeQrk8C&pg=PA284&lpg=PA284&dq=asphalt+pavement+service+life&source=web&ots=ZTDNW70X3o&sig=5EFnl72qY0Tmv3ex6rACZW8qOIo#PPR7,M1>
McCormac, Jack & Nelson, James. Structural Steel Design: LRFD Method, Third Edition. (2003). Prentice Hall
National Cooperative Highway Research Program. (2007). Bridge LifeCycle Cost Analysis. Arlington Heights, IL: National Engineering Technology Corporation.
Non Destructive Testing. (2007). Retrieved February 7, 2008. <http://www.hkpc.org/hkiemat/mastec03_notes/50.pdf>
Pennells, E. (1978). Concrete Bridge Designer’s Manual. London, England: Viewpoint Publications
Prestressed Concrete Association of Pennsylvania. (2006) Retrieved January 2008. <http://www.pcap.org/default.aspx>

91
Reed Construction Data Inc. (2005) RS Means Construction Cost Data. 63rd Annual Addition. Kingston, MA.
Roles and Responsibilities of Different Agencies. (2006). Retrieved February 3, 2008. <http://www.fhwa.dot.gov/environment/conformity/ref_guid/chap2.htm#roles>
Electronic Code of Federal Regulations. (2008). Title 23: Highways; Part 650Bridges, Structures and Hydraulics. Retrieved February 26, 2008. <http://ecfr.gpoaccess.gov/cgi/t/text/text‐idx?c=ecfr&sid=4326b3462801c075d9d260366f1f811e&rgn=div5&view=text&node=23:1.0.1.7.28&idno=23>
Tonias, D.E. (1995). Bridge Engineering. New York, NY: McGraw‐Hill, Inc.
United States Department of Transportation Federal Highway Administration. LRFD. (January 23, 2007). Retrieved October 10, 2007. <http://www.fhwa.dot.gov/bridge/lrfd/>
United States Government Accounting Office. FederalAid Highways. (August 2004). Retrieved February 4, 2008. <http://www.gao.gov/new.items/d04802.pdf>
Wright, Edward D. Constructability Guide. (1994). Retrieved January 20, 2008. <http://www.azdot.gov/Highways/ConstGrp/PDF/ConstructabilityGuide.pdf>
92
Appendix A: Proposal
Comparative Highway Bridge Design
A Major Qualifying Project Report Proposal
Submitted to the Faculty
of the
WORCESTER POLYTECHNIC INSTITUTE
By
____________________________
Adam Carmichael
____________________________
Nathan Desrosiers
Date: 11 October 2007
Approved:
Professor Leonard Albano, Advisor
________________________________________

93
Abstract
This proposal outlines the design of both a steel and concrete girder system and their respective
components (piers, abutments, bearings, expansion joints, etc.) for a typical highway overpass. Each
system will be compared on the premise of initial cost, life ‐cycle cost and constructability. The project
will be aided by the use of AASHTO LFRD Bridge Design Specifications, a series of bridge engineering
handbooks, and RISA’s structural engineering software, in addition to many other sources. The goal of
this project is to implement our research in deriving an accurate and thorough analysis of the
advantages and disadvantages of two common types of bridge designs.
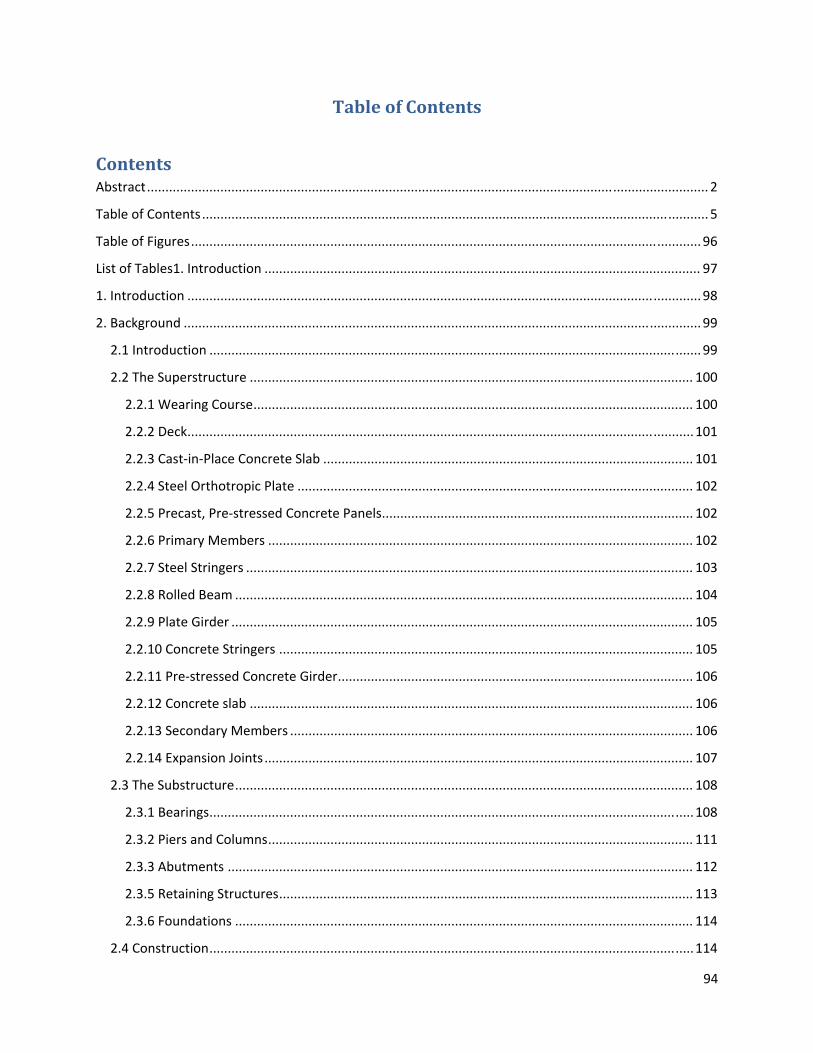
94
Table of Contents
Contents Abstract ......................................................................................................................................................... 2
Table of Contents .......................................................................................................................................... 5
Table of Figures ........................................................................................................................................... 96
List of Tables1. Introduction ....................................................................................................................... 97
1. Introduction ............................................................................................................................................ 98
2. Background ............................................................................................................................................. 99
2.1 Introduction ...................................................................................................................................... 99
2.2 The Superstructure ......................................................................................................................... 100
2.2.1 Wearing Course ........................................................................................................................ 100
2.2.2 Deck .......................................................................................................................................... 101
2.2.3 Cast‐in‐Place Concrete Slab ..................................................................................................... 101
2.2.4 Steel Orthotropic Plate ............................................................................................................ 102
2.2.5 Precast, Pre‐stressed Concrete Panels ..................................................................................... 102
2.2.6 Primary Members .................................................................................................................... 102
2.2.7 Steel Stringers .......................................................................................................................... 103
2.2.8 Rolled Beam ............................................................................................................................. 104
2.2.9 Plate Girder .............................................................................................................................. 105
2.2.10 Concrete Stringers ................................................................................................................. 105
2.2.11 Pre‐stressed Concrete Girder ................................................................................................. 106
2.2.12 Concrete slab ......................................................................................................................... 106
2.2.13 Secondary Members .............................................................................................................. 106
2.2.14 Expansion Joints ..................................................................................................................... 107
2.3 The Substructure ............................................................................................................................. 108
2.3.1 Bearings .................................................................................................................................... 108
2.3.2 Piers and Columns .................................................................................................................... 111
2.3.3 Abutments ............................................................................................................................... 112
2.3.5 Retaining Structures ................................................................................................................. 113
2.3.6 Foundations ............................................................................................................................. 114
2.4 Construction .................................................................................................................................... 114
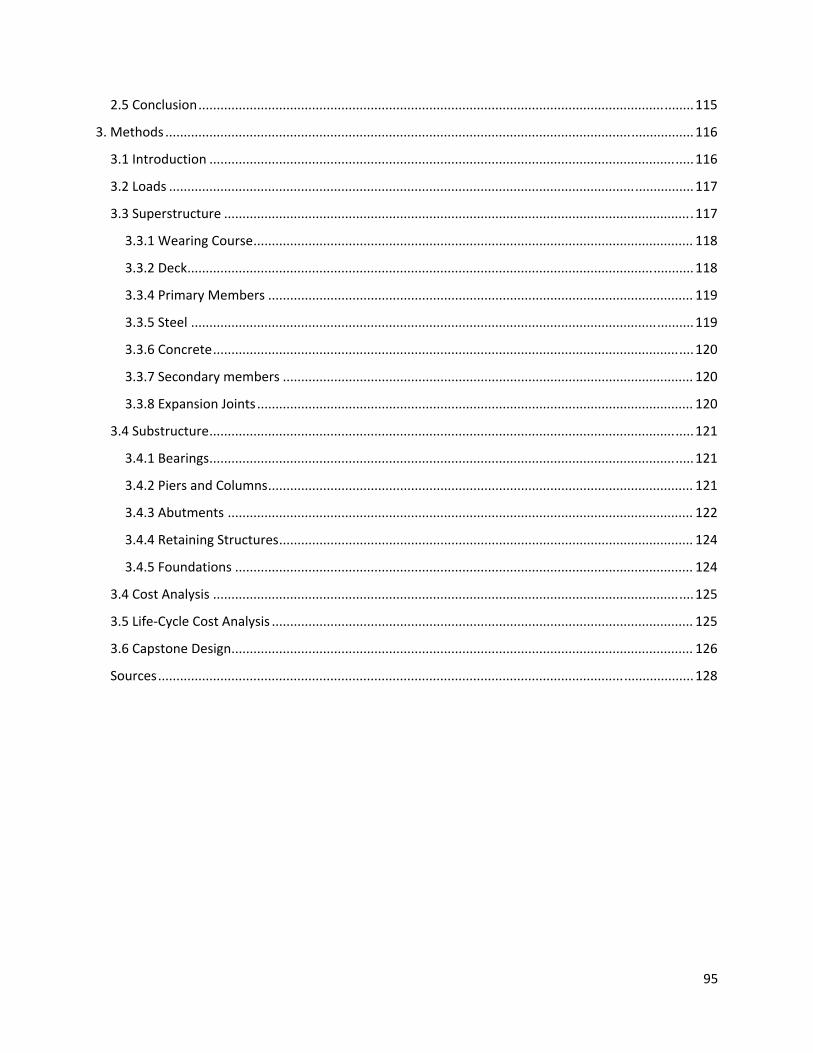
95
2.5 Conclusion ....................................................................................................................................... 115
3. Methods ................................................................................................................................................ 116
3.1 Introduction .................................................................................................................................... 116
3.2 Loads ............................................................................................................................................... 117
3.3 Superstructure ................................................................................................................................ 117
3.3.1 Wearing Course ........................................................................................................................ 118
3.3.2 Deck .......................................................................................................................................... 118
3.3.4 Primary Members .................................................................................................................... 119
3.3.5 Steel ......................................................................................................................................... 119
3.3.6 Concrete ................................................................................................................................... 120
3.3.7 Secondary members ................................................................................................................ 120
3.3.8 Expansion Joints ....................................................................................................................... 120
3.4 Substructure .................................................................................................................................... 121
3.4.1 Bearings .................................................................................................................................... 121
3.4.2 Piers and Columns .................................................................................................................... 121
3.4.3 Abutments ............................................................................................................................... 122
3.4.4 Retaining Structures ................................................................................................................. 124
3.4.5 Foundations ............................................................................................................................. 124
3.4 Cost Analysis ................................................................................................................................... 125
3.5 Life‐Cycle Cost Analysis ................................................................................................................... 125
3.6 Capstone Design .............................................................................................................................. 126
Sources .................................................................................................................................................. 128

96
Table of Figures Figure 1: Superstructure components (Tonias) ........................................................................................ 100 Figure 2: Steel Stringers ............................................................................................................................ 103 Figure 3: Beam Geometry and Designation (Tonias) ................................................................................ 104 Figure 4: Concrete Stringer ....................................................................................................................... 105 Figure 5: Typical roller bearing (Chen and Duan, 26‐3) ............................................................................ 110 Figure 6:Typical elastomeric bearing (Chen and Duan, 26‐3) ................................................................... 110 Figure 7: Piers and Columns flow chart .................................................................................................... 112 Figure 8:Deck Design Steps (“LRFD Design Examples”) ............................................................................ 118 Figure 9: Girder Design Steps (“LRFD Design Examples”) ......................................................................... 119 Figure 10: Pier Design Steps (“LRFD Design Examples”) ........................................................................... 122 Figure 11: Abutment Design Steps (“LRFD Design Examples”) ................................................................. 123 Figure 12: Scheduled Completion of Major Project Activities .................................................................. 127

97
Table of Tables Table 1: Key Options for Secondary Members .............................................. Error! Bookmark not defined. Table 2: Main Options for Expansion Joints .............................................................................................. 108 Table 3: Bearing Capacities (Chen and Duan, 26‐7) .................................................................................. 110 Table 4: Assumed Soil Values (Chen and Duan, 29‐14) ............................................................................ 124

98
1. Introduction
This proposal outlines our background of the substructure and superstructure
components as well as our methodology in the design of these components. Our project
looks to compare both steel and concrete girder systems on the level of constructability and
financial and life‐cycle cost. In our background we explore the basic types of each
component and their accompanying properties. Our methodology defines our extent of
involvement in the design of each component. It also, gives a basic idea as to the design
process and required design variables. In the end, the critical elements of life‐cycle cost as
well as initial cost analysis are defined. The contents of this proposal give a distinct direction
to both desired bridge designs.

99
2. Background
2.1 Introduction
“Planning and designing of bridges is part art and part compromise, the most significant aspect
of structural engineering.” (Bridge Engineering Handbook) Along with this, comes the
substantial amount of specifications that must be abided by, a majority of which are outlined in
the AASHTO LFRD Bridge Design Specifications, 2nd Ed. 1998.
Before we begin to design we must first analyze the bridge conceptually. Defining the
basic parameters of the bridge allows us to begin to define its’ function and performance. In
doing this it is important to constantly consider the solution to maximizing safety while
minimizing cost. In this conceptual analysis we take both an analytical and practical approach
which incorporates both new and old methods. This preliminary analysis aids in creating the
final design while reducing the overall design efforts.
To assist our preliminary analysis it is important to understand the basic components of
a bridge as well as gain a firm grasp on different design specifications. To first understand the
different components we divide the bridge into two sections: superstructure and substructure.
The superstructure of a bridge consists of; the deck, approach slabs, expansion joints and
girders. Supporting the superstructure is the substructure which includes: piers, columns,
bearings, abutments and retaining structures. Along with the superstructure and substructure

100
components we researched, foundations and both concrete and steel bridge construction.
Expanding our knowledge of construction practices was important when considering general
constructability in our design.
2.2 The Superstructure
The bridge superstructure consists of the components that are located above the supports
(Figure 2: Superstructure components (Tonias, 1995) . Some of the basic components include the
wearing surface, the deck, the primary members, and the secondary members. Each of these
will be discussed in further detail in the following sections. Each of these components is
dependent upon the other in terms of load, geometry, and load path. When designing each of
these the others must be taken into account.
Figure 54: Superstructure components (Tonias)
2.2.1 Wearing Course
The wearing course is the top most layer of the bridge deck. This is the surface that will take
the most punishment from the elements and from daily traffic. The wearing course is usually
anywhere from two to four inches thick depending on the amount of traffic, the speed, and the
101
volume of trucks that will be traveling over it(Tonias). This layer is often made of bituminous
pavement, which holds up well to traffic and gives a nice ride over the structure.
2.2.2 Deck
The deck can be described as the physical extension across the roadway. The deck is on the
stringers and distributes the loads that act on the bridge along the bridge cross section
(transversely) (Tonias). The deck can either be connected to the stringers which provides extra
load bearing capacity to the structure because the two components are working together
(composite) or it can sit freely on the stringers and transfer no additional load bearing capacity
other then the resistance of daily traffic (no composite) (Tonias). Some of the advantages of
using a composite decking system are it allows more efficient use of materials since the size of
the steel or concrete stringers does not have to be as large, it can create greater vertical
clearance because the stringers don’t have to be as deep, and it can support greater vehicle
loading. There are a few different types of decks that are commonly used in industry today,
cast‐in‐place concrete slab, precast, pre‐stressed concrete panels, and steel orthotropic plate.
2.2.3 CastinPlace Concrete Slab
The cast‐in‐place concrete slab is by far the most common form of decking on highway
overpasses (Tonias). This deck is reinforced with steel rebar to provide some extra strength
that using only concrete could not provide. The slab also usually works in composite action
with the bridge structure which also makes it a popular choice when designing a bridge of
either steel or concrete stringers.

102
2.2.4 Steel Orthotropic Plate
This type of deck is a steel plate that has stiffeners attached underneath to provide longitudinal
and transverse load carrying ability. One advantage to this deck is that it adds very little dead
load to the structure because it does not use concrete. This is very crucial in large span bridges
where dead load can become a significant issue. The downside to this is that it is expensive to
fabricate therefore they are not used on shorter span bridges, under two hundred feet, where
dead load is not as big an issue (Tonias).
2.2.5 Precast, Prestressed Concrete Panels
The precast, pre‐stressed concrete panels are delivered to the construction site premade and
ready to be set in place. The panels are four to five feet in width, are longitudinally positioned,
and placed transversely to the stringers. The panels are connected by epoxy mortar which is
put into a female‐female key (Tonias). The panels can also be made to be in composite action
with the structure by installing stud shear connectors into voids in the panels, which are then
filled with the epoxy mortar. Some advantages to precast, pre‐stressed concrete panels are
that they can be used on bridge rehabilitations because they are not susceptible to vibrations
when doing stage construction, but they are more expensive than cast‐in‐place concrete decks
and cannot be used on curved structures.
2.2.6 Primary Members
The primary members are the most noticeable part of a highway overpass. They are the
structural elements that transfer the loads from the deck to the piers and abutments

103
(longitudinally) and are usually designed to resist flexure (Tonias). There are many different
types of stringers starting with the difference between steel and concrete. Both steel and
concrete have many different designs of stringers that are used for specific purposes. Some
designs are better for longer spans while others are better for shorter spans. These will be
further discussed in the following sections. Each of the designs has its advantages and
disadvantages which will also be discussed.
2.2.7 Steel Stringers
There are many different types of steel stringers but we will only be looking at a few types for
our highway overpass. Steel when compared to concrete is much lighter and can be
constructed at a much faster pace because the stringers are fabricated at a factory then
shipped to the construction site essentially ready to be erected. Steel stringers can be seen in
Figure 3.
Figure 55: Steel Stringers

104
2.2.8 Rolled Beam
The rolled beam is what is generally thought of when a steel beam is mentioned. It is formed
when hot steel is sent though a series of rollers to give the beams the distinct I shape. These
beams are called I beams, which is the geometry, but technically have an S shape, which is its’
designation because of its tapered flanges (Figure 4). This however is not the most common
rolled steel beam used as primary members, which is the wide‐flange beam. This beam has the
distinct I shape, which is the geometry, but it technically has the W shape, which is its’
designation because it has parallel flange faces (Figure 4)(Tonias). Wide flange beams come in a
very wide variety of sizes with known physical properties. One other option when using rolled
beams is to add a cover plate to the bottom flange of the beam, which increases the flexural
capacity allowing for smaller, more economical beams to be used. A cover plate does put a
large amount of stress on the ends of the plate, which could lead to fatigue damage.
Figure 56: Beam Geometry and Designation (Tonias)

105
2.2.9 Plate Girder
The plate girder is made of steel plates that are welded, bolted, or riveted together to form an I‐type
cross section rather than being hot rolled into this shape. One advantage to plate girders over a rolled
beam is that the designer can specify such things as the thickness and width of the flange or the
depth of the web. This allows for greater conservation of materials because the designer can
get exactly what is needed without any waste, but is also a tradeoff because this adds to
fabrication costs. This becomes very important as the span of the bridge increase because it
will cut down on the cost of wasted material.
2.2.10 Concrete Stringers
Concrete stringers come in a variety of different designs, each used for a specific situation. We
will only be looking at a couple of these designs due to the size of our highway overpass.
Concrete is lower in cost than steel but it also much heavier so it is not used when weight is an
issue(Tonias). Until the development of the pre‐stressed concrete girder concrete was rarely
used because it could not span large gaps. Concrete stringers can be seen in Figure 5.
Figure 57: Concrete Stringer
106
2.2.11 Prestressed Concrete Girder
The pre‐stressed concrete girder is one of the more popular choices for highway overpass
design because of its ease of construction, prefabricated at a factory or done on site, its cost
effectiveness, and its physical properties. These girders come in two different shapes, an I‐
girder and a T‐girder, which are used base on the size of the overpass (Tonias). The girders’
designs, which are AASHTO standards, depending on the size needed, have specified locations
and numbers for pre‐stressing strands.
2.2.12 Concrete slab
The concrete slab bridge is a fairly simple concept because there are no primary members. The
slab acts as both the support for the bridge and the wearing surface. This does not allow for
long bridges of this type. Reinforcement is used in the concrete to give additional strength and
resistance to fatigue. Voids can also be added which lightens the dead load of the bridge which
allows the bridge to span larger gaps. This type of bridge is not very popular since it is not a
very efficient design (Tonias).
2.2.13 Secondary Members
The secondary members of an overpass are designed not to handle load but to prevent
deformation of the frame by acting as bracing for the primary members. Secondary members
do not handle load but they help transfer load from stringer to stringer by creating a single unit
out of the entire structure. Diaphragms are the main type of secondary member that we will

107
investigate. If the stringers are made from steel then steel diaphragms are used and if concrete
stringers are used concrete diaphragms are used accordingly. For a steel diaphragm it is usually
of the rolled beam type which lends its self to easy fabrication since they are specified in the
AISC Steel Construction Manual. AASHTO also has certain specifications that they must meet
including the spacing and on what designs and spans they should be used. The steel connectors
are mounted to the primary members though connection plates which are welded or bolted to
the structure. Concrete diaphragms can be either cast in‐place with the stringers to create a
single unit or they can be cast at a factory and connected with rods to the girders. The key
options are listed in Error! Reference source not found. (Tonias).
Table 24: Key Options for Secondary Members
Type of Span Span Geometry Spacing Spec
Rolled Beam and Plate Girder
All Spans At each support and intermediate locations spaced
not more than 25ft apart
AASHTO 10.20.1
Prestressed Concrete T‐Beam
Spans > 40 ft At span ends and points of maximum moment
AASHTO 9.10.2
2.2.14 Expansion Joints
Expansion joints are very critical to any type of bridge because they allow for movement of deck due to loads, thermal expansion/contraction, and some also protect the substructure by
acting as a sealant. There are many different options such as open joints, filled joints, compression seal joints, and strip seal joints. Each joint has a range of motion that it covers

108
we will not be able to choose the correct joint until we have analyzed our structure for movement. The main options for expansion joints are listed in Table 2: Expansion Joints
(Tonias).
Table 2: Main Options for Expansion Joints
2.3 The Substructure
After establishing a thorough knowledge of the superstructure, we move on to the
support for those elements, the substructure. Like the superstructure, substructure
components vary by geographical location and transportation department. For most highway
bridges the substructure contains the only prominent aspects which could be considered
aesthetically pleasing. The substructure of a bridge consists of the bearings, piers, abutments
Expansion Joint Type
Range of Motion Protection of Substructure
Cost
Open Small None Low
Filled Small Some Low
Compression Seal .5 to 2.5 inches Good Moderate
Strip Seal Up to 4 inches Good Moderate

109
and retaining structures. It is imperative to fully understand each of these components before
beginning the design phase.
2.3.1 Bearings
Bearings primary functions are to transmit loads and accommodate any relative
movements between the superstructure and the substructure. There are a variety of forces
that the bearing must endure including: superstructure dead load, traffic loads, earthquake
loads and wind loads. There are translational and rotational movements within the bearings
caused by creeping, shrinkage, temperature effects and traffic loads and uneven foundations
respectively.
In connecting the bearings to the superstructure and substructure, steel plates are used
in conjunction with bolts and welding. Steel sole plates are bolted and welding to the
superstructure when using steel girders and embedded into the concrete girders with anchor
studs. A steel masonry plate is used in connecting the bearing to the substructure. The purpose
of the plates is to distribute the concentrated bearing reactions to the superstructure and
substructure.
Through our research we found a wide variety of bearings. First, we discovered they can
be classified into either fixed or expansion bearings. The big difference between the two is fixed
bearings restrict translational movements where expansion bearings allow both translation and
rotational. The most common types of bearings currently in use today include; sliding, rocker
and pin, roller, elastomeric, curved, pot and disk bearings. For the purposes of our project we

110
will only look at roller and elastomeric bearings as they accommodate both steel and concrete
girders.
Figure 6 and Figure 7 illustrate the roller and elastomeric bearings respectively. Table 3: Bearing Capacities (Chen and Duan, 1999)
outlines the bearing capacities. (Chen and Duan, 26‐1)
Figure 58: Typical roller bearing (Chen and Duan, 26‐3)
Figure 59:Typical elastomeric bearing (Chen and Duan, 26‐3)
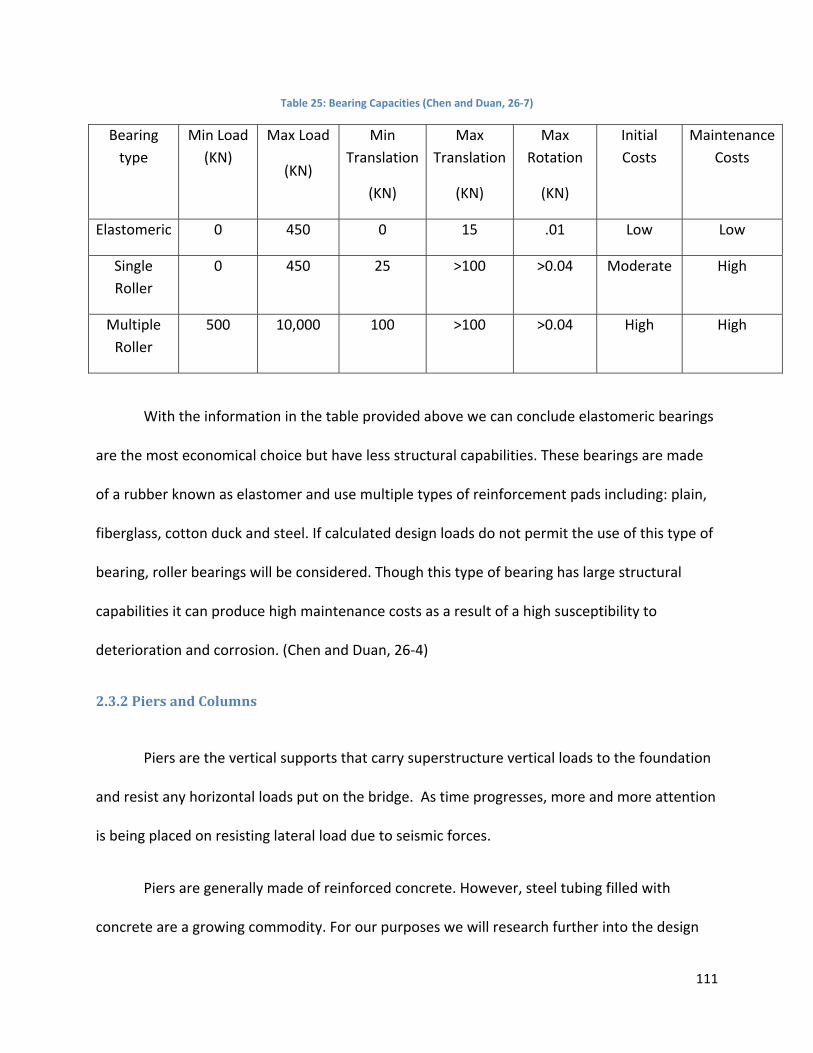
111
Table 25: Bearing Capacities (Chen and Duan, 26‐7)
With the information in the table provided above we can conclude elastomeric bearings
are the most economical choice but have less structural capabilities. These bearings are made
of a rubber known as elastomer and use multiple types of reinforcement pads including: plain,
fiberglass, cotton duck and steel. If calculated design loads do not permit the use of this type of
bearing, roller bearings will be considered. Though this type of bearing has large structural
capabilities it can produce high maintenance costs as a result of a high susceptibility to
deterioration and corrosion. (Chen and Duan, 26‐4)
2.3.2 Piers and Columns
Piers are the vertical supports that carry superstructure vertical loads to the foundation
and resist any horizontal loads put on the bridge. As time progresses, more and more attention
is being placed on resisting lateral load due to seismic forces.
Piers are generally made of reinforced concrete. However, steel tubing filled with
concrete are a growing commodity. For our purposes we will research further into the design
Bearing type
Min Load (KN)
Max Load
(KN)
Min Translation
(KN)
Max Translation
(KN)
Max Rotation
(KN)
Initial Costs
Maintenance Costs
Elastomeric 0 450 0 15 .01 Low Low
Single Roller
0 450 25 >100 >0.04 Moderate High
Multiple Roller
500 10,000 100 >100 >0.04 High High

112
options and specifications of reinforced concrete piers due to the simplicity of our bridge. A pier
is defined as, “A supporting structure at the junction of connecting spans of a bridge.” (The
American Heritage Dictionary of the English Language, Fourth Edition) However, from a
designer stand point, we need to be able to distinguish between a pier and a column. In this, it
is important to note that columns resist lateral forces by flex action where as piers use shear
action. Also, not a pier with multiple columns is known as a bent.
There are many types of piers: monolithic and cantilevered which are defined by how
they connect to the superstructure. We will explore each of these options as their use is
dependent on the use of concrete or steel girders respectively. You can also distinguish a pier
by shape: round, octagonal, hexagonal, or rectangular, each having the option to be solid or
hollow. Lastly, you can distinguish by its frame, single column, bent, hammerhead or pier wall.
Figure 8 the different options for piers and columns. (Chen and Duan, 27‐1)
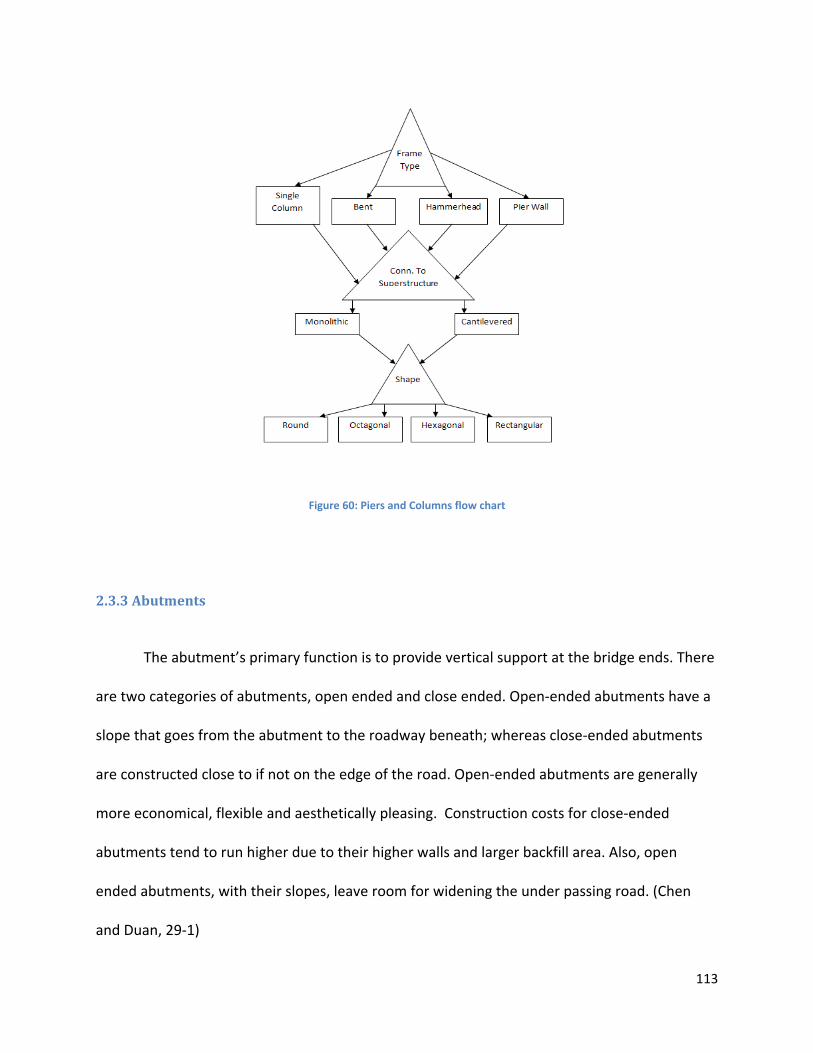
113
Figure 60: Piers and Columns flow chart
2.3.3 Abutments
The abutment’s primary function is to provide vertical support at the bridge ends. There
are two categories of abutments, open ended and close ended. Open‐ended abutments have a
slope that goes from the abutment to the roadway beneath; whereas close‐ended abutments
are constructed close to if not on the edge of the road. Open‐ended abutments are generally
more economical, flexible and aesthetically pleasing. Construction costs for close‐ended
abutments tend to run higher due to their higher walls and larger backfill area. Also, open
ended abutments, with their slopes, leave room for widening the under passing road. (Chen
and Duan, 29‐1)

114
Abutments can also be categorized based on their connection to the bridge
superstructure. With this we have two categories: monolithic or seat type. The monolithic
abutment is usually reserved for shorter bridges. Its advantages are its lower construction cost
and ability to transfer movement from the superstructure directly to the abutments and then
the backfill and footings. On the contrary open ended abutment stems can be difficult to
design. (Chen and Duan, 29‐1)
The seat type abutment is constructed separate from the superstructure. The
superstructure is positioned on the seat abutments through bearings previously discussed.
These bearings enable the designer to control bridge displacement. The ability to control
displacement makes this type of abutment popular for longer bridges especially those with
concrete or steel girders. Although this type of abutment has a higher initial cost it is relatively
cheaper to maintain.
2.3.5 Retaining Structures
There are a variety of retaining structures which all act to resist lateral forces.
Several types of retaining structures include: cantilever wall, tieback wall, soil nail wall and
mechanically stabilized embankment. All retaining structures resist active soil pressure. Tie back
walls have the strands that act as anchors for the wall elements. Soil nail walls have a similar
system that uses soil nails to resist lateral movement. It is critical to ensure vertical settlement
for all retaining structures. The must have the ability to resist against any sliding, overturning,
foundation yielding while still maintaining the strength to avoid structural failure. (Chen and
Duan, 29‐23)

115
2.3.6 Foundations
The function of the foundation is to connect the bridge substructure to the ground
enabling load transfers between the two. There are two main types of foundations; shallow and
deep. Examples of shallow foundations are spread footings, strap footings, combined footings
and mat footings. (Chen and Duan, 31‐1)Deep foundations can generally take larger loads but
are less cost effective. (Chen and Duan, 32‐2) One similarity between deep and shallow
foundations is the necessity for each of them to work together with the superstructure in
resisting external forces. If the foundation and superstructure are designed separately the
safety of the bridge could be compromised in despite of each components ability to meet
design specifications.
2.4 Construction
Though it is critical to understand each of a bridge’s components before you begin the design
phase, it is also imperative to recognize the importance of the constructability of those components
both individually and from an assembly point of view. Constructability can have a critical affect on cost
and time, which despite the importance of safety, is often viewed as the primary indicator of success for
any particular project. Knowing each component inside and out will enable us to properly gage the
constructability of the project and hence allow us to make proper decisions as to the specifications for
each of those components.

116
2.5 Conclusion
Through our background we were able to come to an understanding as to the options and
characteristics of each bridge component. This understanding creates a foundation that will allow us to
proceed to the design phase. The outline of this design phase will be explored further in the methods
section.

117
3. Methods
3.1 Introduction
The purpose of the methodology is to define our approach as well as our involvement in
the design of each bridge component. In doing this, applicable critical loads must first be
considered. We will compare pre‐stressed concrete girders with steel girders on the premise of
life‐cycle and financial cost as well as constructability. With this, we will successfully fulfill the
Capstone Design requirement. Below is an organizational chart outlining the different
components of our project that will be considered in the methodology. Through the flow chart
you can observe our consideration of applicable loads for the design of both superstructure and
substructure components. As indicated in the organizational chart, both designs will be
compared on the principles of constructability, initial cost and life‐cycle cost.

118
3.2 Loads
Loads come in many different forms some are greater than others but they all must be
looked at with equal importance. Loads that do not change are referred to as permanent loads
which include dead load (DL), superimposed dead load (SDL), and pressure. Loads that act for a
short period of time are referred to as temporary loads which include vehicle live load (VLL),
wind loading (WL), and seismic loads (SL).
We will be designing our overpass using loading cases specified by AASHTO to
determine the greatest load that the design must withstand. Each loading case takes into
consideration such things as vehicle load, dead load, and wind load. Loads that will not be
factored into our design are creep, shrinkage, settlement, temperature gradient, uniform
temperature, vehicle collision, centrifugal, brake, and pedestrian forces.
3.3 Superstructure
There are many things that one should look at when they are designing a bridge. Even
the smallest detail that is overlooked could cause a failure in any component of the bridge.
When designing each element the designer must consider if the load is going to be permanent
or temporary, the direction that the load will be acting, deformation, and its effect on the
structure (bending, shear, and torsion). Things such as the type of floor; size, stiffness, and
spacing of primary members; the spacing and stiffness of secondary members; and the size and
position of loads all effect the design of a highway overpass. Parameters for the design of each
component will be guided by AASHTO LFRD Bridge Design Specifications and used in
conjunction with use of load combination equations. We will be defining the design of the

119
deck, wearing course, expansion joints, primary members, and secondary members in this
section.
3.3.1 Wearing Course
When selecting a wearing course it is important to look at the traffic load and weather
to which the surface will be exposed. For this reason we will use these two factors as
guidelines, along with AASHTO, in defining bituminous pavement design options. There will be
a specified thickness to which a mix design will be chosen. The mix design will be chosen based
on a cost analysis and life cycle cost analysis.
3.3.2 Deck
The deck will be designed two different ways, which will affect the design of the primary
members. The deck will be designed as a noncomposite cast‐in‐place slab for the concrete
girders along with a composite cast‐in‐place slab for steel girders. These two designs not only
differ in cost but also the constructability of the overpass. Figure 61 outlines the design process
for a typical deck design.
Figure 61: Deck Design Steps (“LRFD Design Examples”)

120
3.3.4 Primary Members The Primary members will be broken down into two categories, steel and concrete. Each
material has very different characteristics and will be looked at separately. The results for both
will then be compared, to find the best material and design for our overpass. We will compare
the designs in cost analysis, life cycle cost analysis, and constructability. Figure 62 is a general
design process for girders.
Figure 62: Girder Design Steps (“LRFD Design Examples”)
3.3.5 Steel
We will be looking at rolled girders and plate girder designs for our overpass. We will
use standard design sizes for both since this will help lessen cost and contribute to
constructability, which are main factors in the decision of what to use. An economical and
efficient spacing will be determined by investigating several different designs of different

121
spacing for each of rolled girders and plate girders. The AISC Steel Construction Manual will be
used to help with the design of the standard members.
3.3.6 Concrete
The only viable option for this design is pre‐cast concrete girders because of the span
length of our overpass. From our background research we found that a concrete slab would
not be possible for our span because of the characteristics of a slab design, so variations of
spacing of pre‐stressed concrete girders will be explored to determine the best spacing and size
of these members. AASHTO type girders will be used to help aid the design process. We will
also consider continuous versus simple spans when designing these members.
3.3.7 Secondary members
Secondary members are very critical in controlling the loads of the deck. We will design
both concrete and rolled steel members depending on the material used for the primary
member. We will look at different spacings for each to determine the most cost effective
route.
3.3.8 Expansion Joints
Expansion joints are a very critical piece in any overpass design. The bridge’s movement
will vary depending on what material and design we use, so we must choose an expansion joint
after we have determined the extent of this movement. We will look at open joints, filled
joints, strip seal joints, and compression seal expansion joints and make a decision based upon
their range of coverage, cost and durability.

122
3.4 Substructure
In this section we define our involvement in the design of each substructure component
including the bearings, piers and columns, abutments, retaining structures and foundations.
The calculation of worst case loading in conjunction with the constraints of defined parameters,
while adhering to AASHTO LFRD Bridge Design Specifications and considering initial and life
cycle costs allows us to define the proper parameters for each component.
3.4.1 Bearings
Bearing design is a growing commonality in bridge design. In the past, bridge designers
left much of the bearing design to the manufactures. (Chen and Duan, 29‐1)Though, due to a
growing awareness of their importance, bridge designers are taking a more active role in
defining design parameters/criteria. Despite this, the bearing’s involvement in our project will
be limited. We will select the type of bearing that will accommodate both a steel and pre‐
stressed concrete girder system. We will make assumptions when needed in designing the
other components of the bridge. We will also assume a number of typical parameters of our
selected type of bearings in defining their basic geometry. (Chen and Duan, 29‐1)
3.4.2 Piers and Columns
The piers or columns are critical components to the bridge in supporting mainly vertical
loads. With this, we will design the appropriate pier or column for each girder system while
constantly considering the functional, structural and geometrical requirements they share. In
the end, the design will include basic parameters of the piers or columns such as diameter as

123
well as elements of design development including vertical and lateral reinforcement. Figure 63
gives the basic design steps for piers or columns.
Figure 63: Pier Design Steps (“LRFD Design Examples”)
3.4.3 Abutments
We will explore the advantages and disadvantages of open ended seat and monolithic
type abutments for both girder systems. We plan to design abutments for each system using
both a load factor method and service load method. The load factor method is simply the

124
service load multiplied by the appropriate load factor (i.e. factor of safety). Generally the
service method is used for a stability check whereas the load factor method is used for the
design. The abutment design will consist of the separate designs of its back wall, stem, footing
and wing wall. Figure 64 outlines the different steps involved in a typical abutment design.
Figure 64: Abutment Design Steps (“LRFD Design Examples”)

125
3.4.4 Retaining Structures
As we are designing a relatively simple bridge, any retaining structure design will be dealt with
within the design of the abutments. Due to the pre‐defined constraints it is certain we will use
either a gravity or cantilever wall type of retaining structure.
3.4.5 Foundations
As we have the ability to create the existing conditions of the location and environment
of our bridge; we will assume adequate soil density, groundwater, cohesion and settlement
conditions. All design pertaining to footings will be covered in both the design of the piers and
columns as well as the abutments. Table 26 outlines all assumed soil values necessary for the
design of the different components.
Table 26: Assumed Soil Values (Chen and Duan, 29‐14)
Allowable soil bearing pressure 4.0 ksf (0.19MPa)
Soil lateral pressure coefficient (Ka) 0.3
Friction Coefficient Tan33
Soil liquefaction potential Very low
Ground acceleration 0.3g
126
Live load surcharge 2ft. (0.6m)
Unit weight of backfill soil 120pcf (1922 kg/m^3)
** Soil passive pressure by soil at the abutment toe is neglected
3.4 Cost Analysis
A construction cost analysis for just materials used will be performed with standard prices for
the given materials. This will be used to help determine which material and design should be used in
terms of cost effectiveness for construction of the overpass. This is an effective way to compare
materials because it is objective and is very clear which material and design is the most cost effective.
The source of the cost data will be researched and standard costs will be used.
3.5 Life Cycle Cost Analysis
Part of our project is to complete a life cycle cost analysis of both the steel and concrete girder
designs. A life cycle cost analysis is defined as, “an economical set of actions and their timing during the
life of a bridge to achieve a 50‐100 year service life.” (“Empirical Study of Life Cycle Cost Analysis for
Bridges”) Costs typically considered in a life cycle cost analysis are: design and engineering, land
acquisition, construction, reconstruction/rehabilitation, and preservation/maintenance. To complete
this analysis we will need a variety of elements including the inflation rate, initial cost, service life and
maintenance history for targeted area, as well as traffic conditions. We will obtain the inflation rate
from the ENR website. Our initial cost will come from the cost analysis. Traffic data will be obtained from
the New Hampshire Department of Transportation for NH RT 123 in Alstead, NH. We are currently
127
researching further into cost analysis for reconstruction and maintenance. A promising source is, Hugh
Hawks, Bridge life‐cycle cost analysis.
3.6 Constructability
A factor that must be considered when choosing what component to use is the constructability
of the component. We will look at factors that could make it easier or harder for a construction
company to build the selected components. These factors will include mobility for things such as
shipment of the stringers, if there is a need for specialized equipment for the component to be
assembled, ease of construction, and if the component can be easily accessed. We will assume that the
road beneath the overpass does have traffic flow and must be taken into account.
3.7 Capstone Design
An important component of this project is to satisfy the ABET Capstone Design
requirements. Our project will address the impact of several of the realistic constraints
including, economics, safety, reliability, aesthetics, and ethics within bridge design. Safety and
ethics are satisfied by the adherence to the, AASHTO LFRD Bridge Design Specifications. On top
of this, the analysis of initial and life cycle cost within our project ensures the fulfillment of both
the economic and reliability aspects respectively. Lastly, aesthetics will be considered in the
selection of each bridge component throughout our design. With the combined effort of these
elements, this project will satisfy our Capstone Design experience.

128
3. 8 Project Deliverables
In completing this project we will have all necessary design calculations done by hand at first
and checked/ completed through the use of RISA. These calculations will be accompanied by a series of
structural drawings for each component and of the entire bridge schematic. Along with this will come a
detailed initial and life cycle cost analysis which will be summarize through the use of appropriate
graphs and tables. Lastly, a comparison of constructability will be addressed in further depth for each
design. Below is a basic schedule for this project to ensure the completion of each deliverable.
Figure 65: Scheduled Completion of Major Project Activities

129
Sources
AASHTO LRFD Bridge Design Specifications. (1998). Washington, D.C.: American Association of State Highway and Transportation Officials
Chen, Wai‐Fah (Ed.) & Duan, Lian (Ed.) (1999). Bridge Engineering Handbook. Boca Raton, Florida: CRC Press
Heins, C.P., & Firmage, D.A. (1979). Design of Modern Steel Highway Bridges. New York, NY: John Wiley & Sons
Pennells, E. (1978). Concrete Bridge Designer’s Manual. London, England: Viewpoint Publications
Tonias, D.E. (1995). Bridge Engineering. New York, NY: McGraw‐Hill, Inc.
Houghton Mifflin Company, (2000). The American Heritage Dictionary of the English Language, Fourth Edition
LRFD Design Examples. (July 28, 2006). Retrieved October 7, 2007, from http://www.fhwa.dot.gov/bridge/lrfd/examples.htm
Empirical Study of Life Cycle Cost Analysis for Bridges. (2003). Retrieved October 7, 2007, from http://www.iti.northwestern.edu/research/presentations/hadavi/2003‐hadavi‐aace‐december.pdf

130
Appendix B: Non Composite Deck Hand Calculations

131
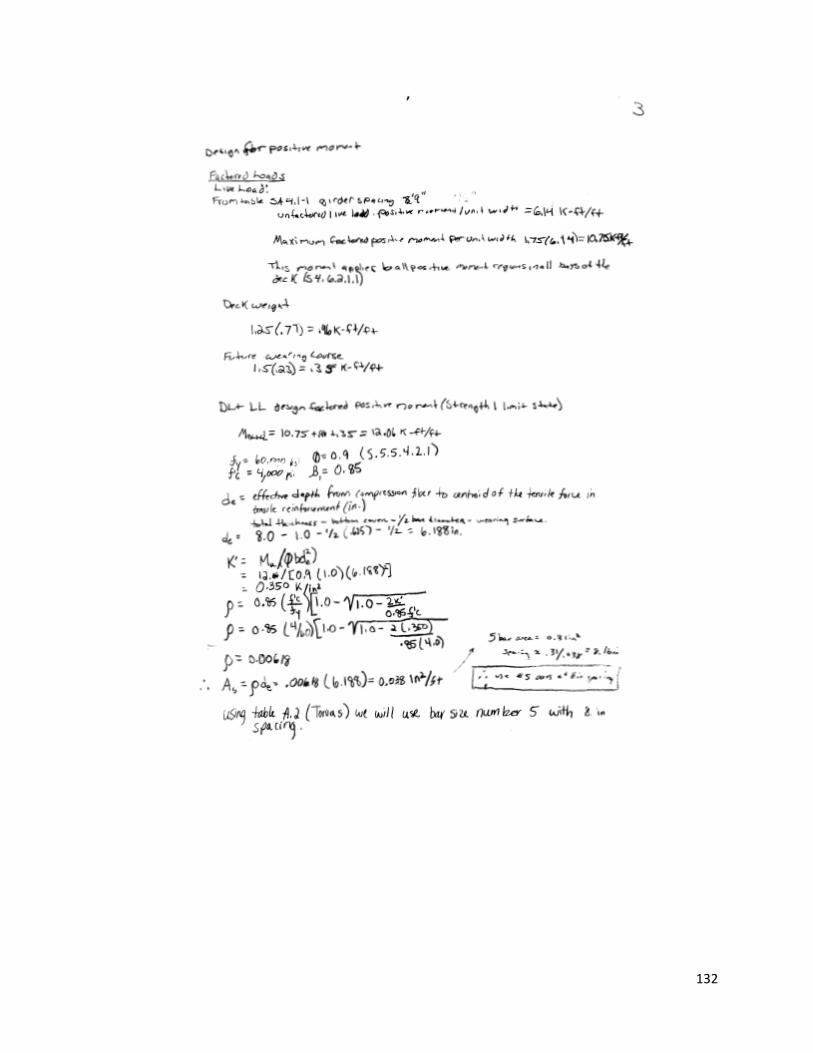
132

133

134

135

136
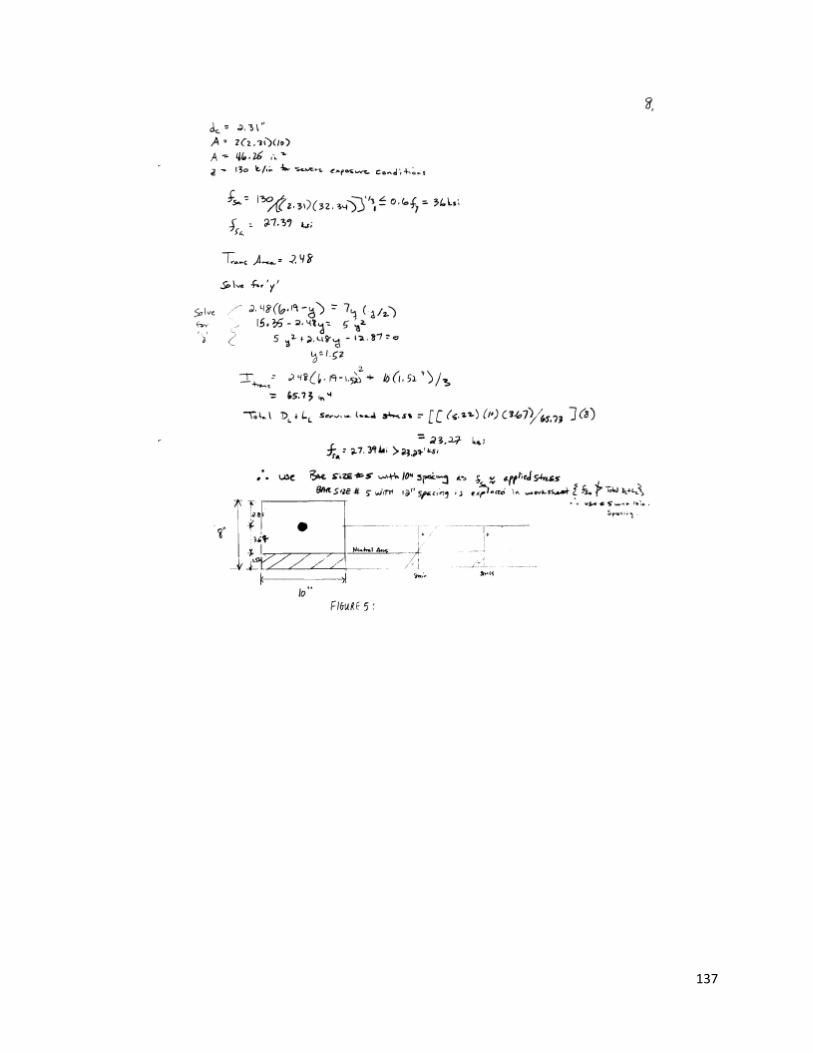
137
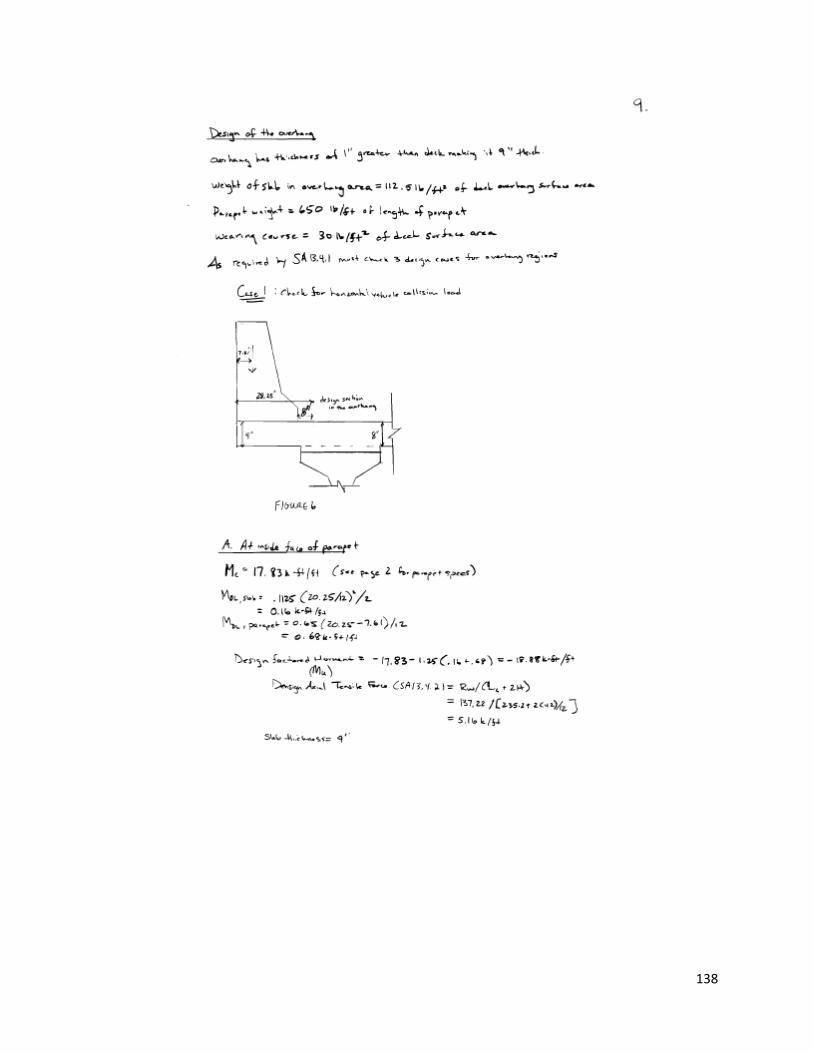
138

139

140
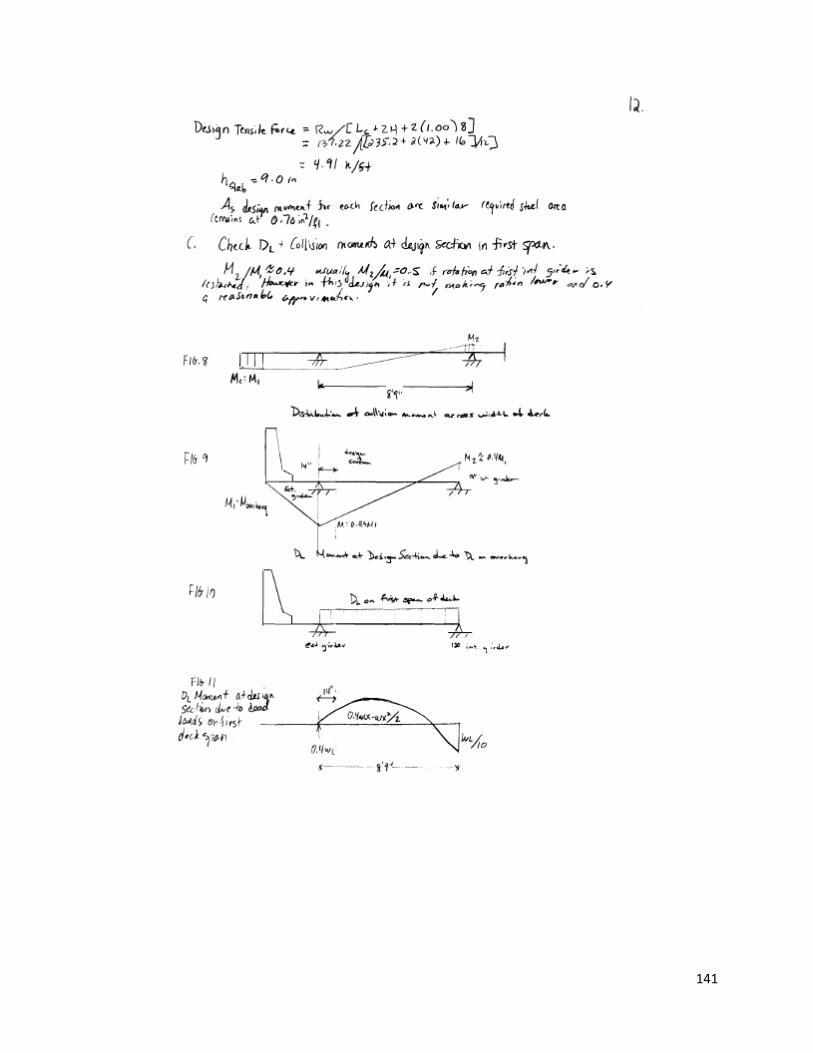
141

142

143

144
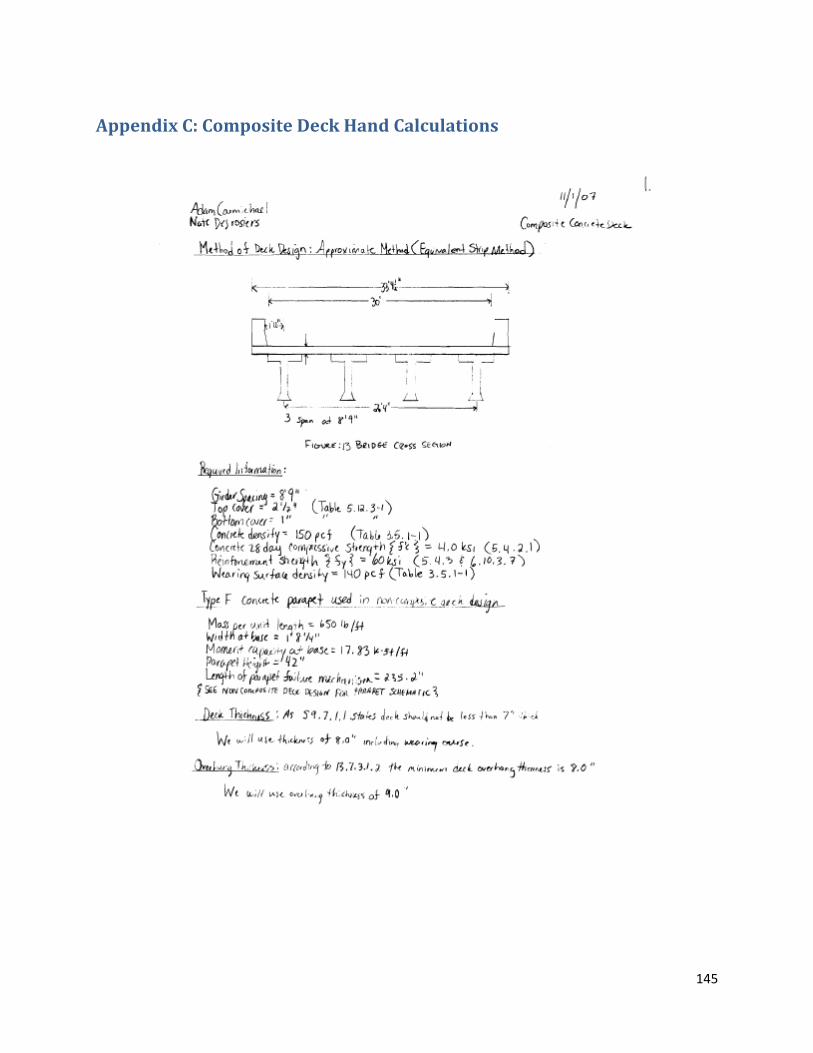
145
Appendix C: Composite Deck Hand Calculations
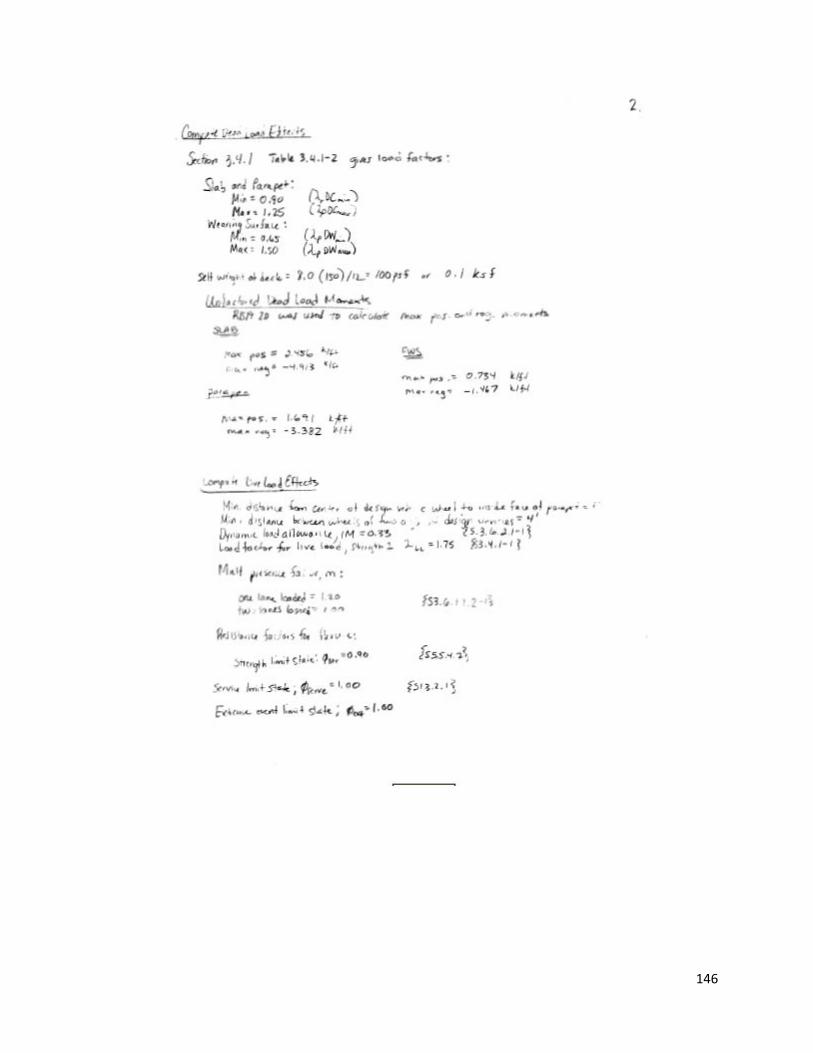
146

147

148
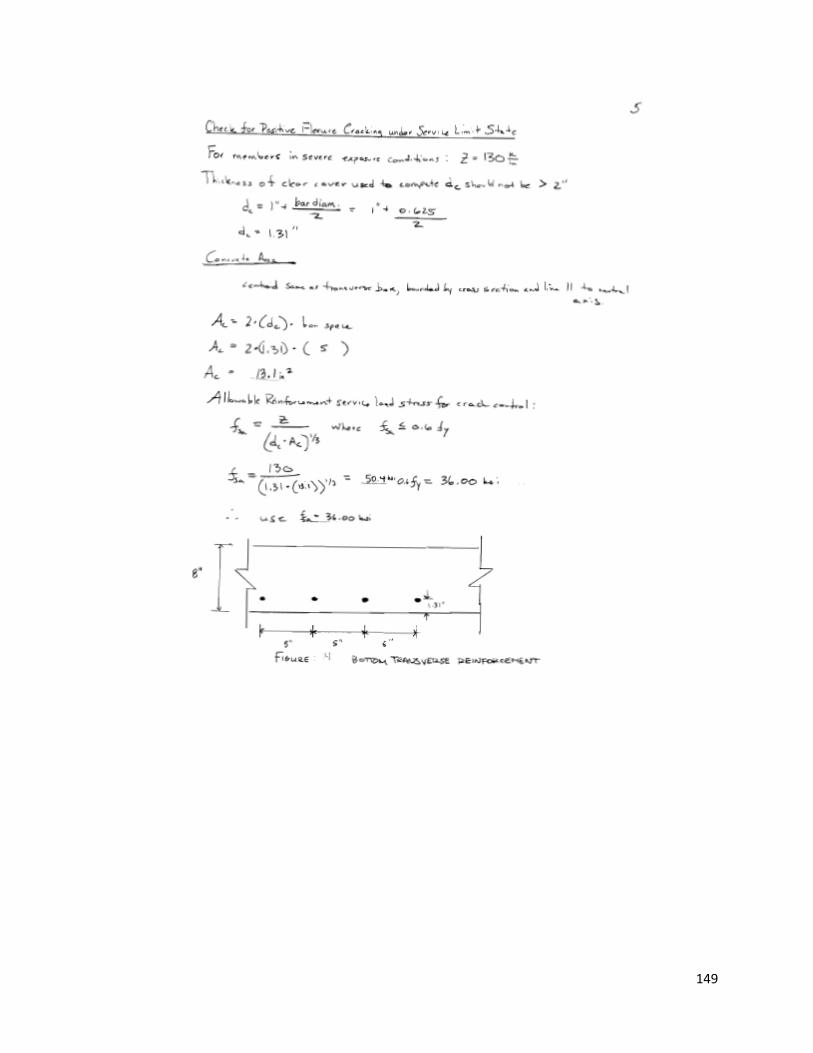
149

150

151
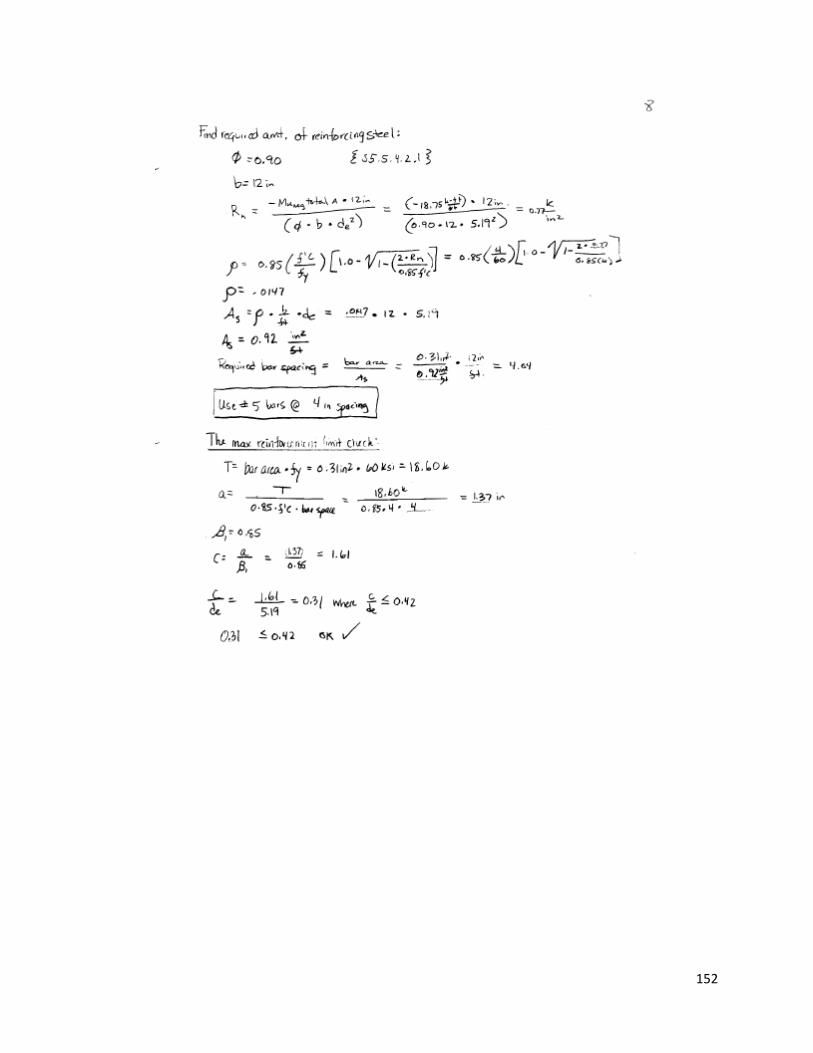
152
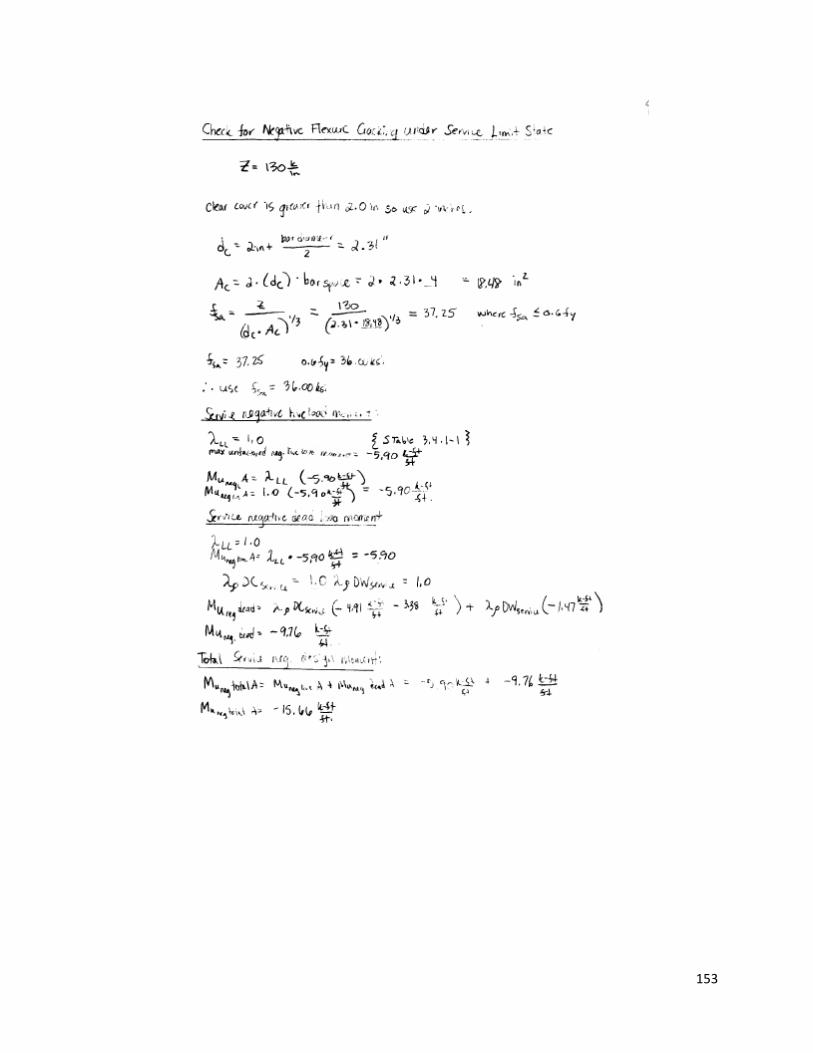
153
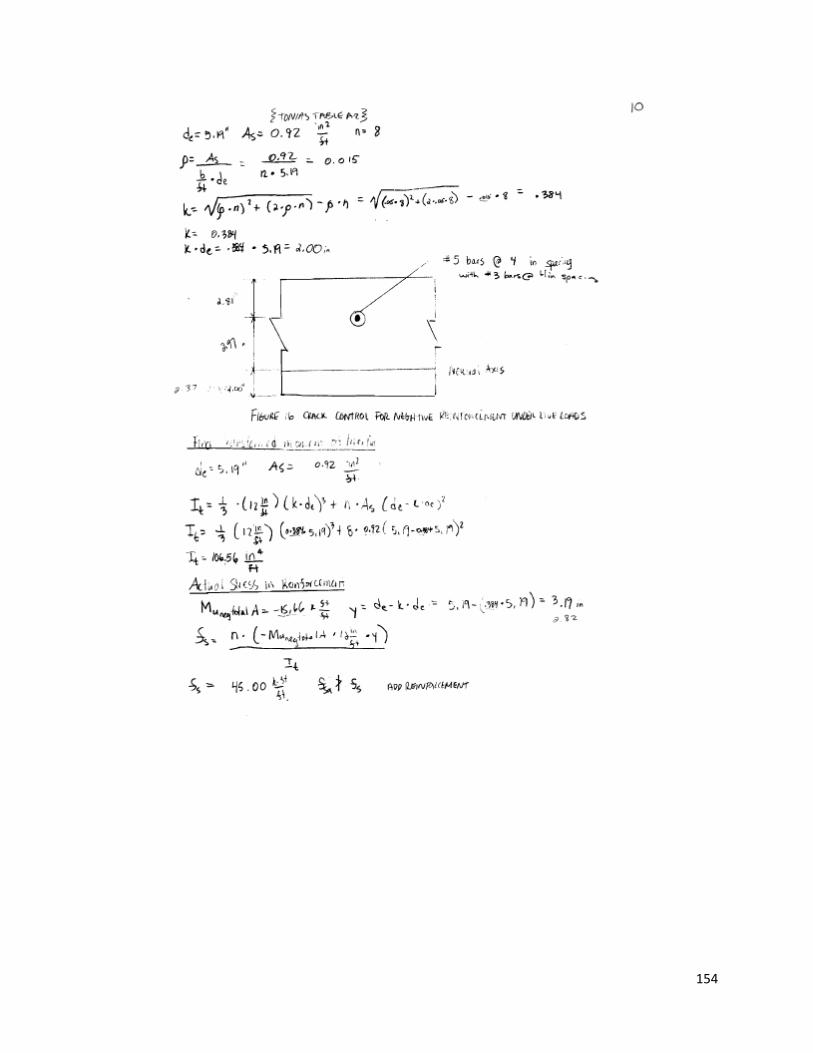
154

155
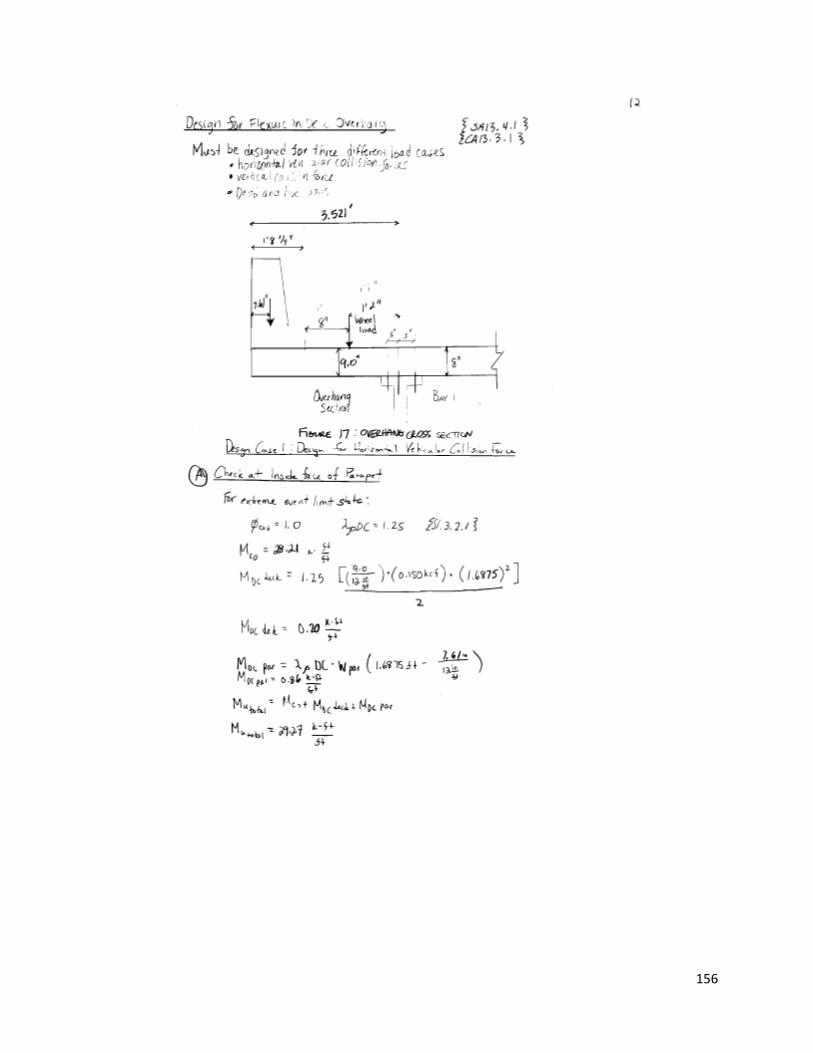
156

157

158
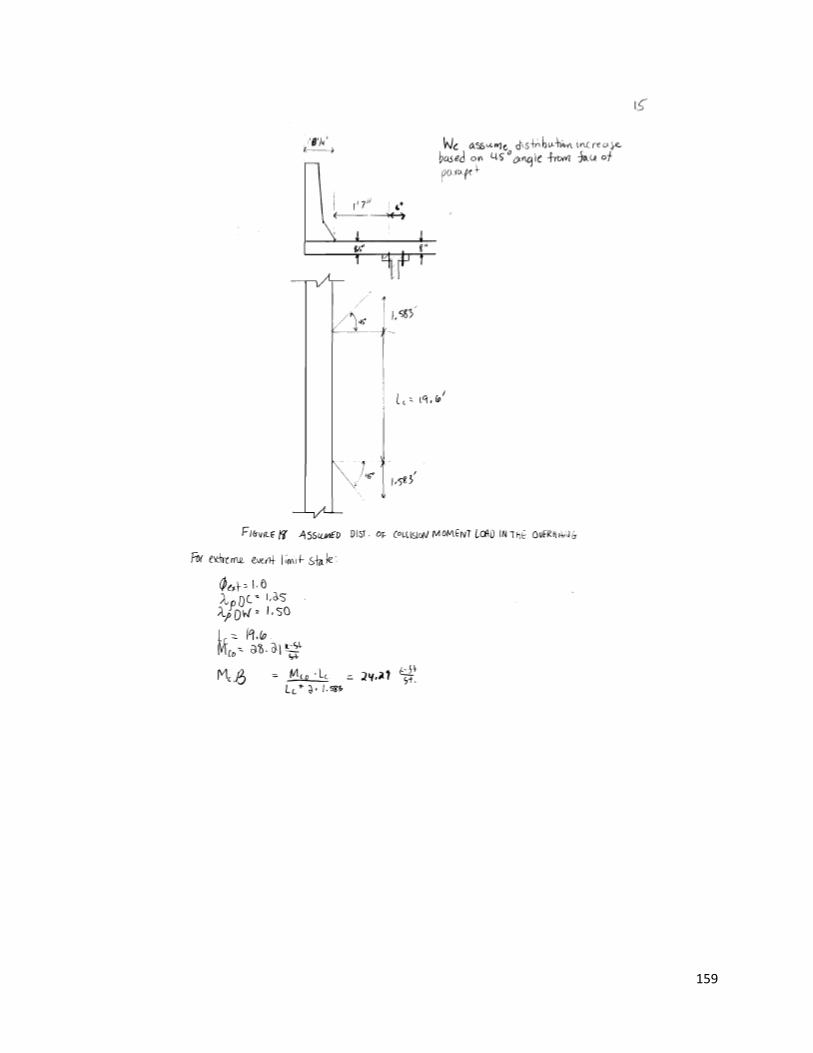
159

160
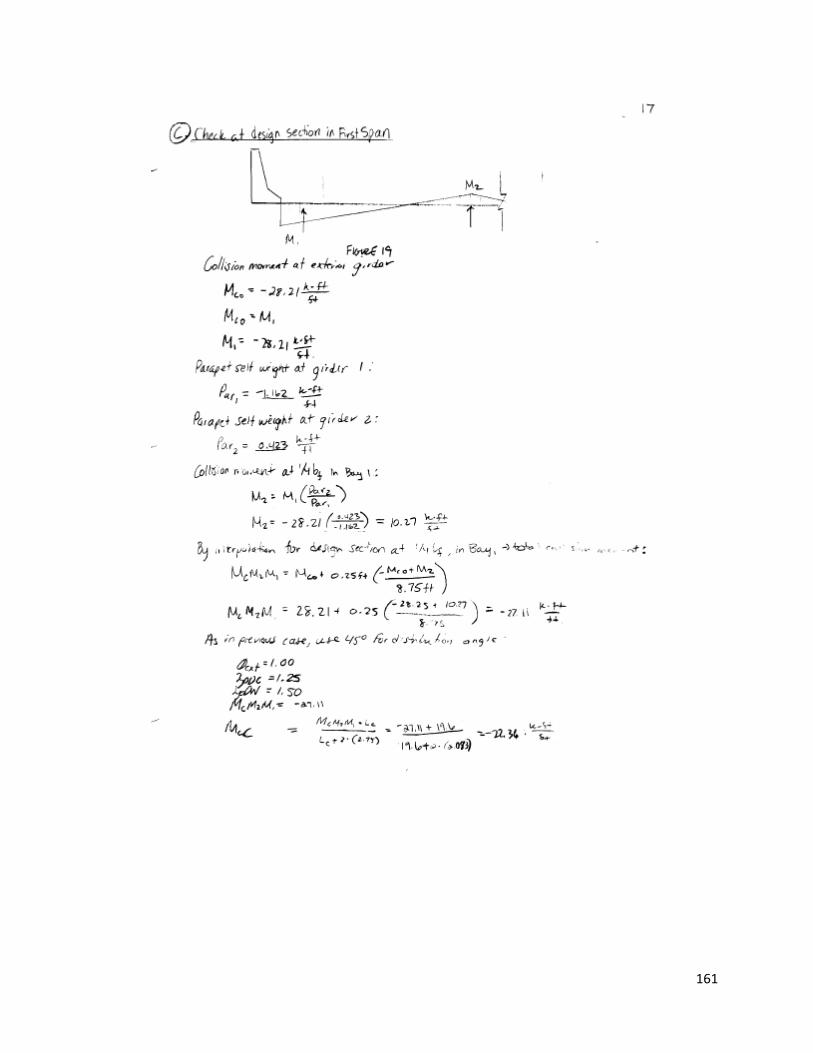
161

162

163

164
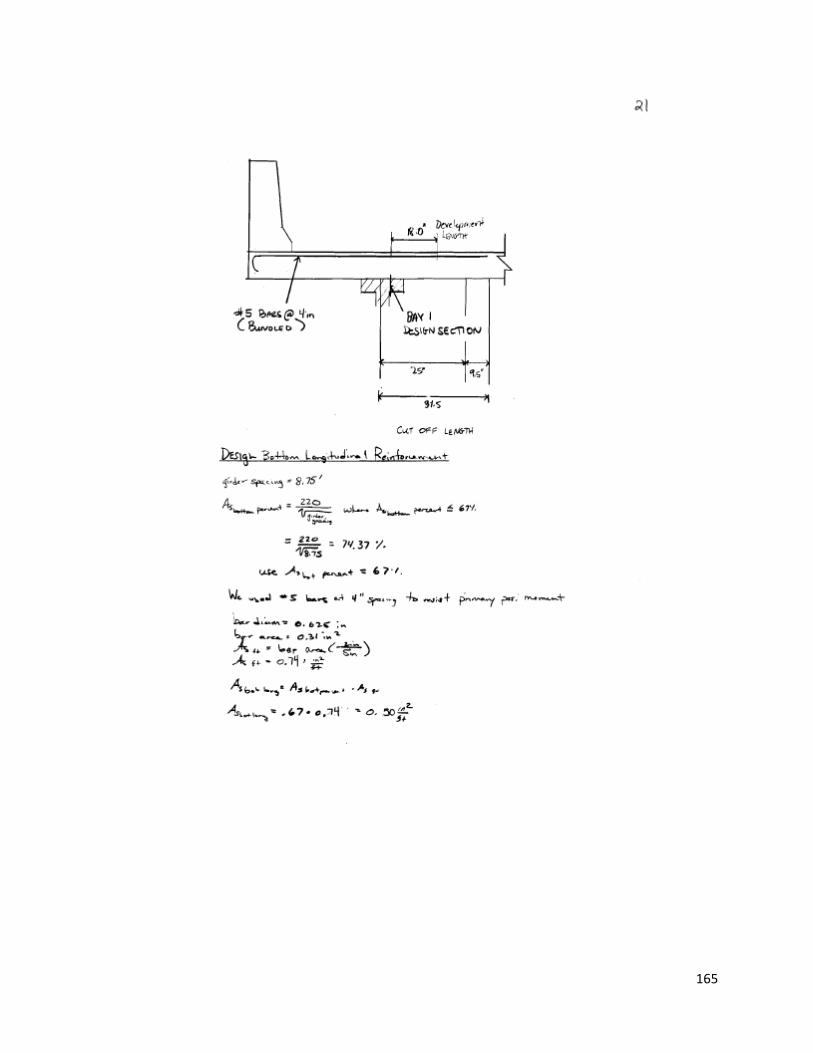
165
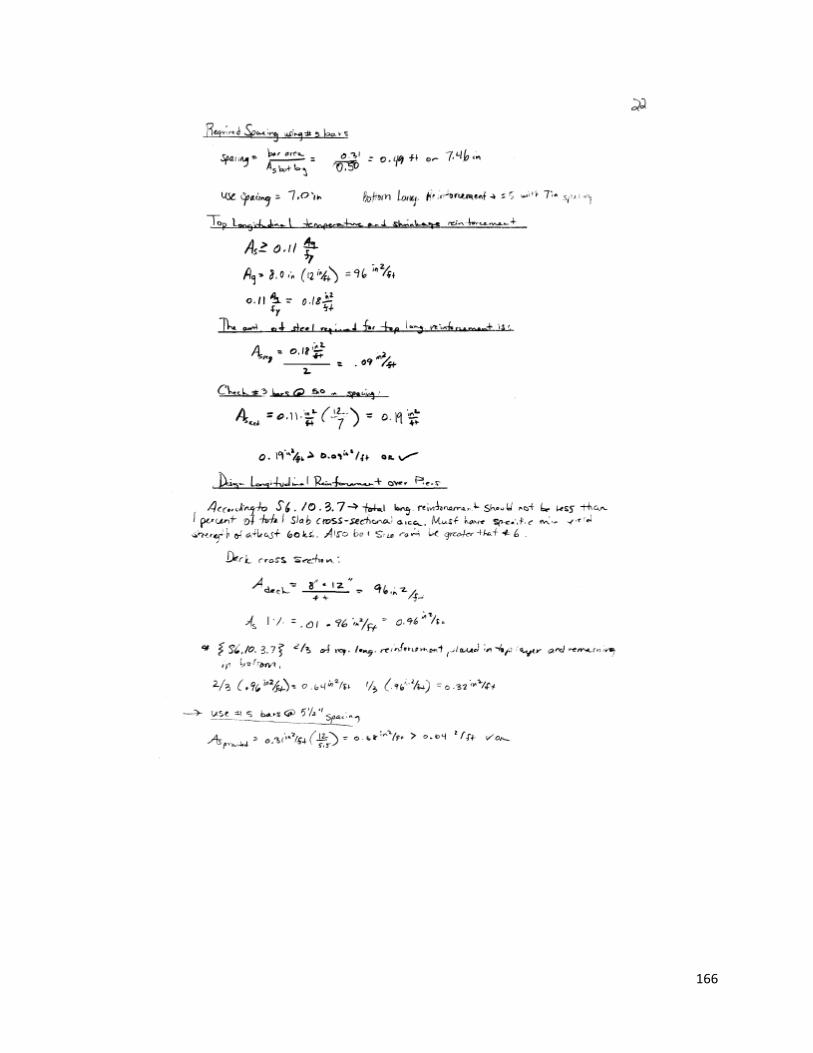
166

167

168
Appendix D: Rolled Beam Hand Calculations

169

170

171
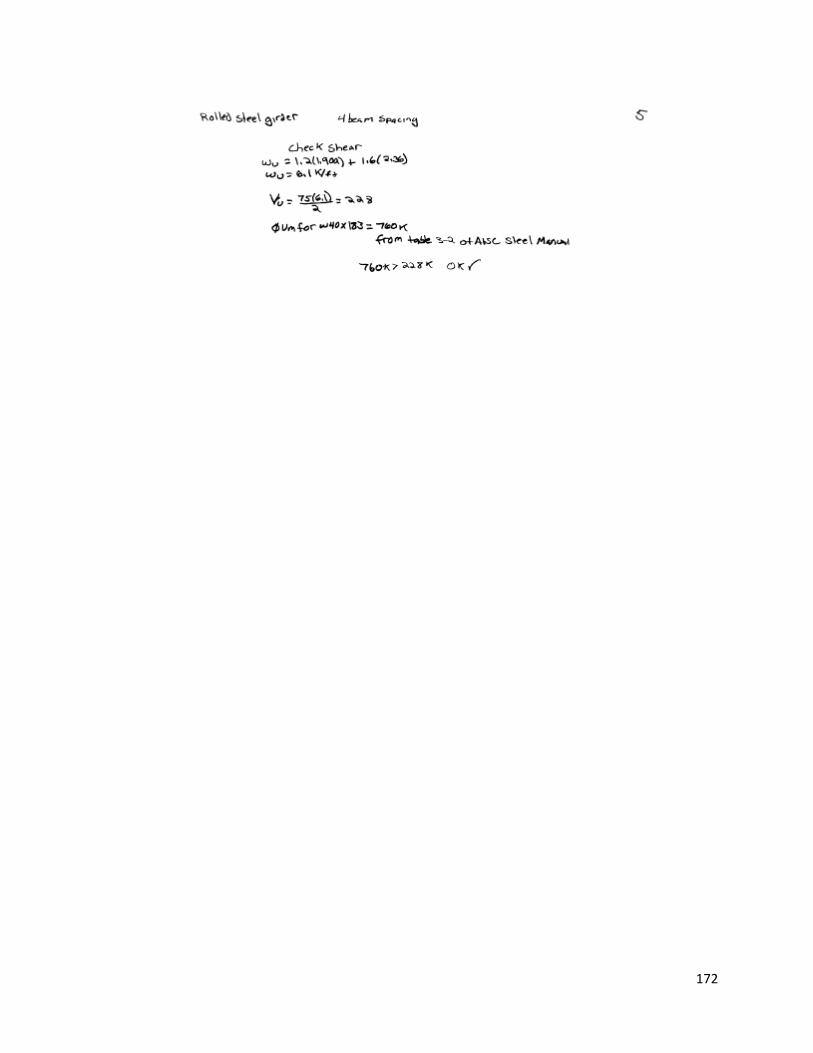
172

173

174

175
Appendix E: Plate Girder Hand Calculations

176
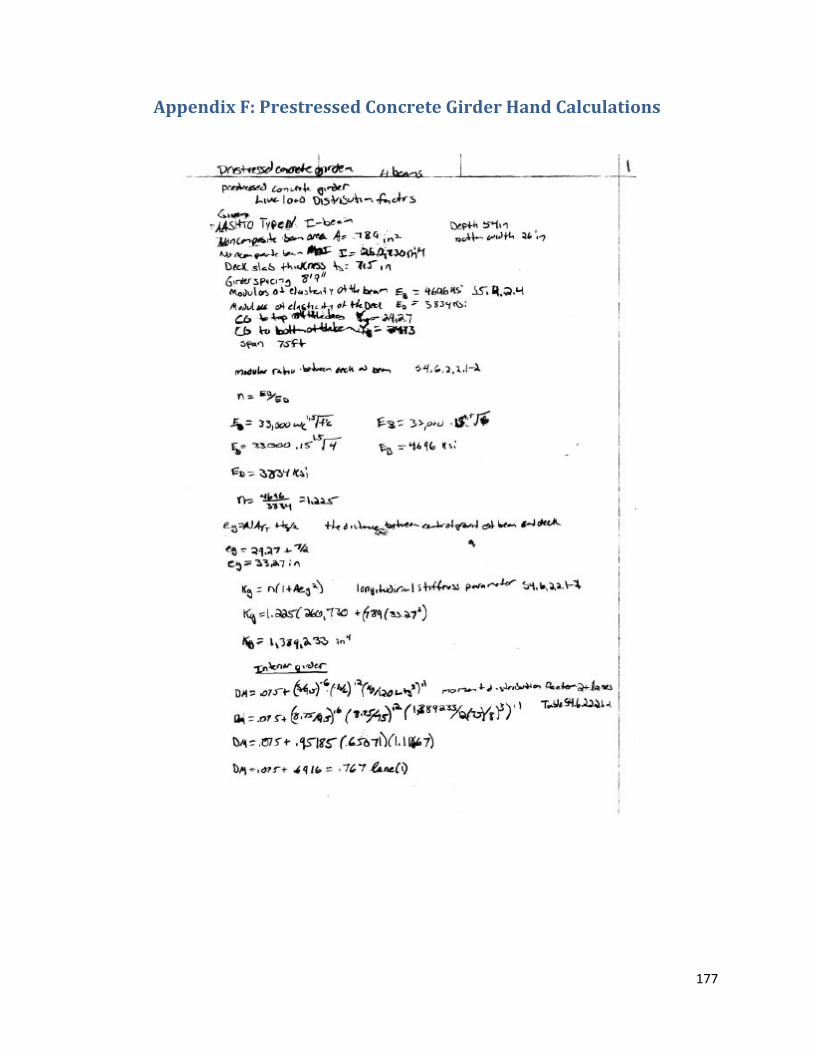
177
Appendix F: Prestressed Concrete Girder Hand Calculations

178
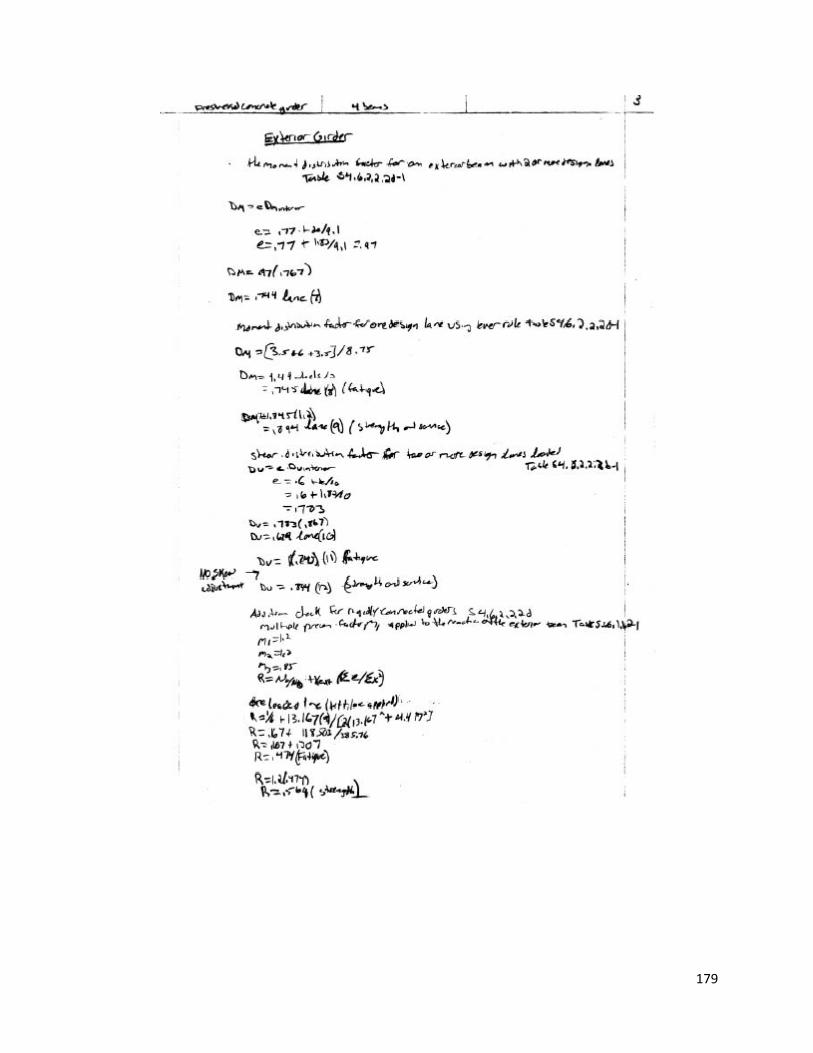
179

180

181

182

183

184

185

186

187
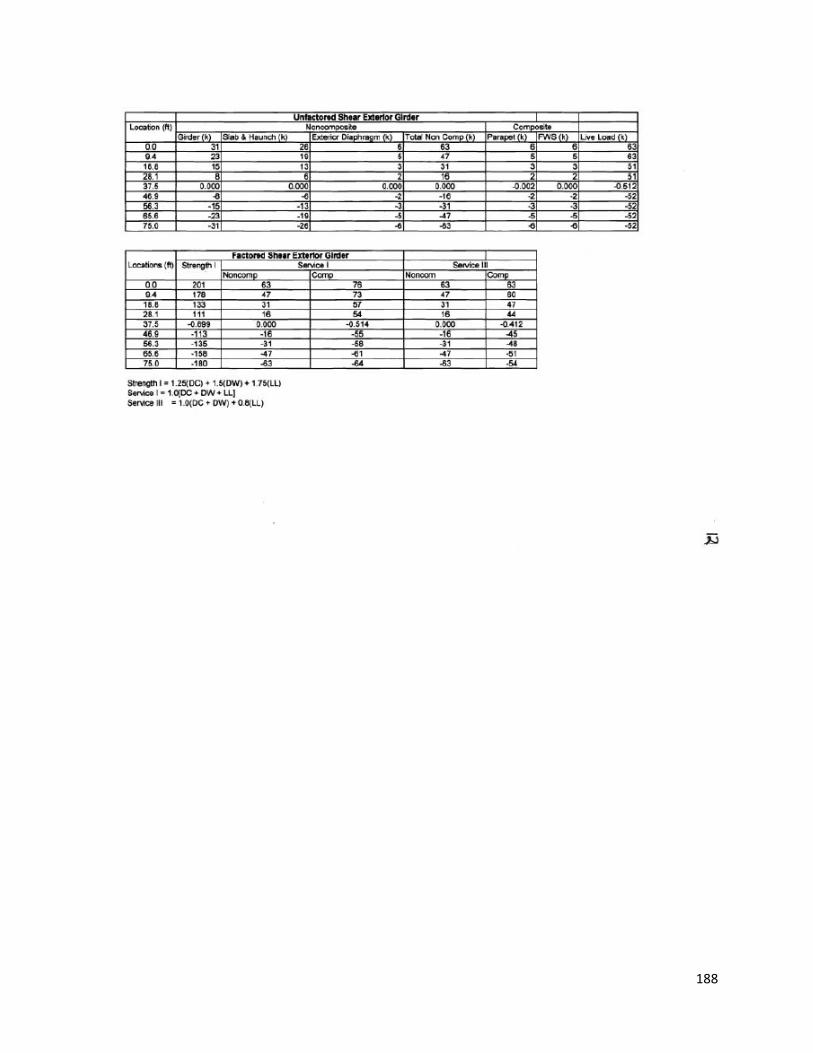
188
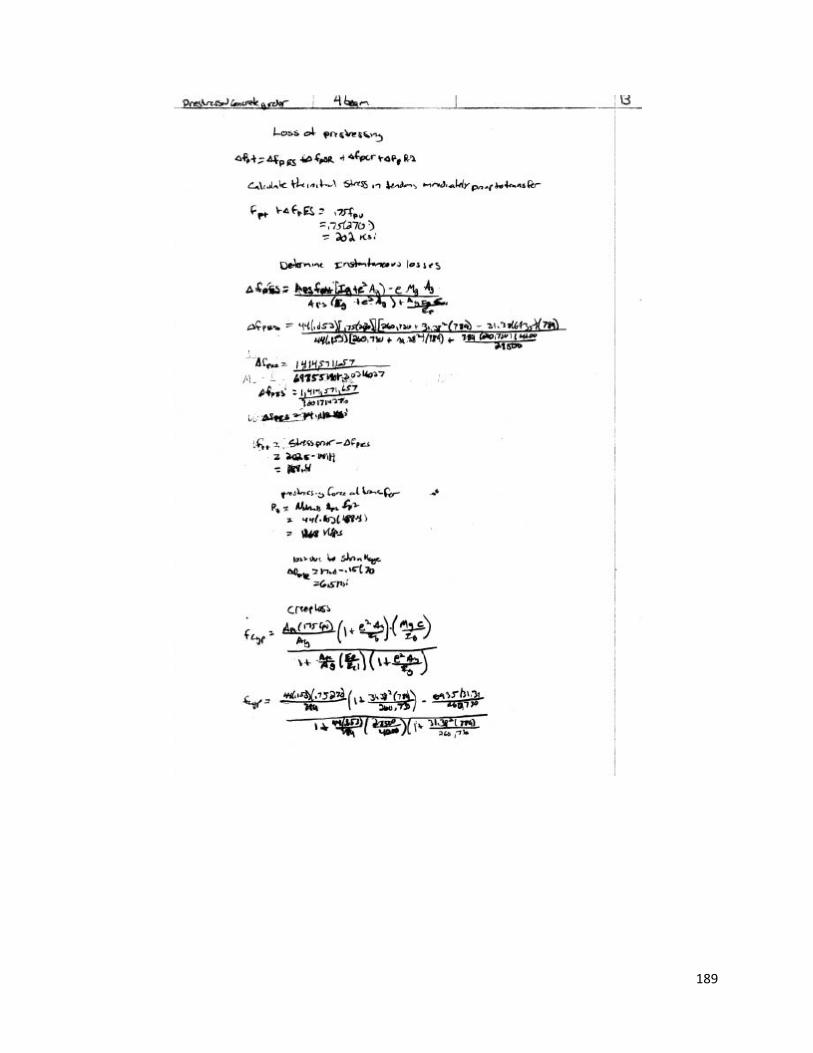
189

190

191

192

193

194

195

196
Appendix G: Pier Design Hand Calculations
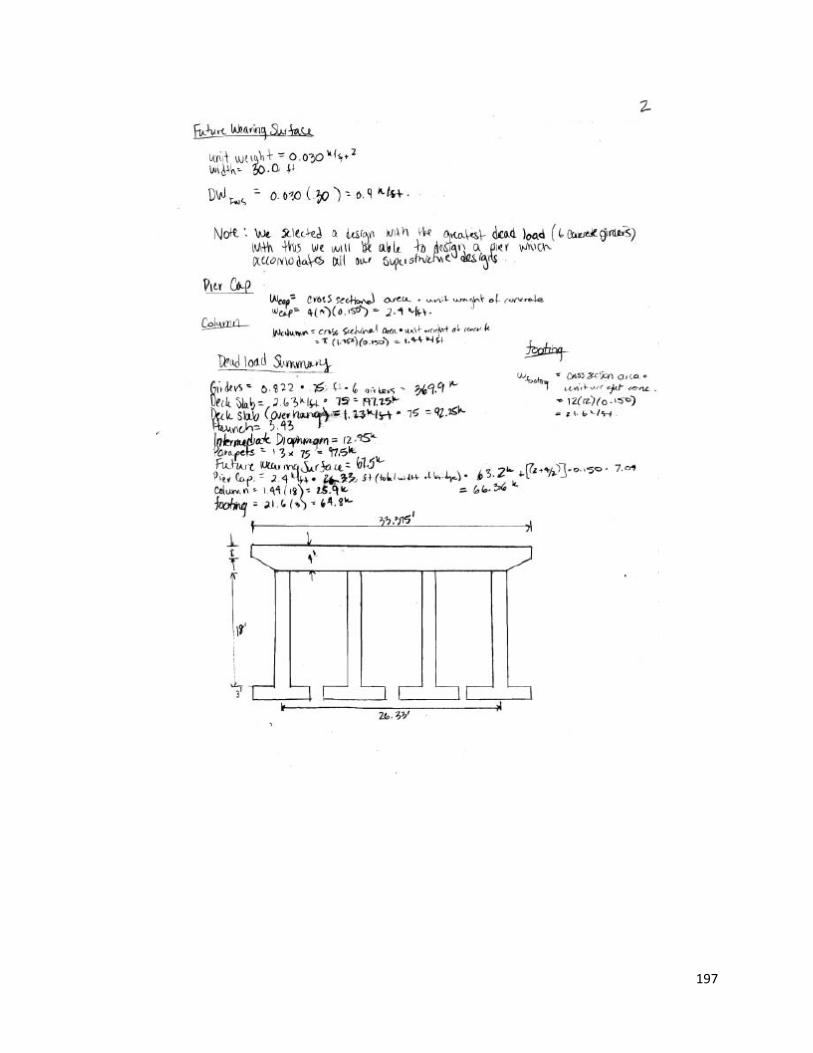
197

198

199

200

201

202
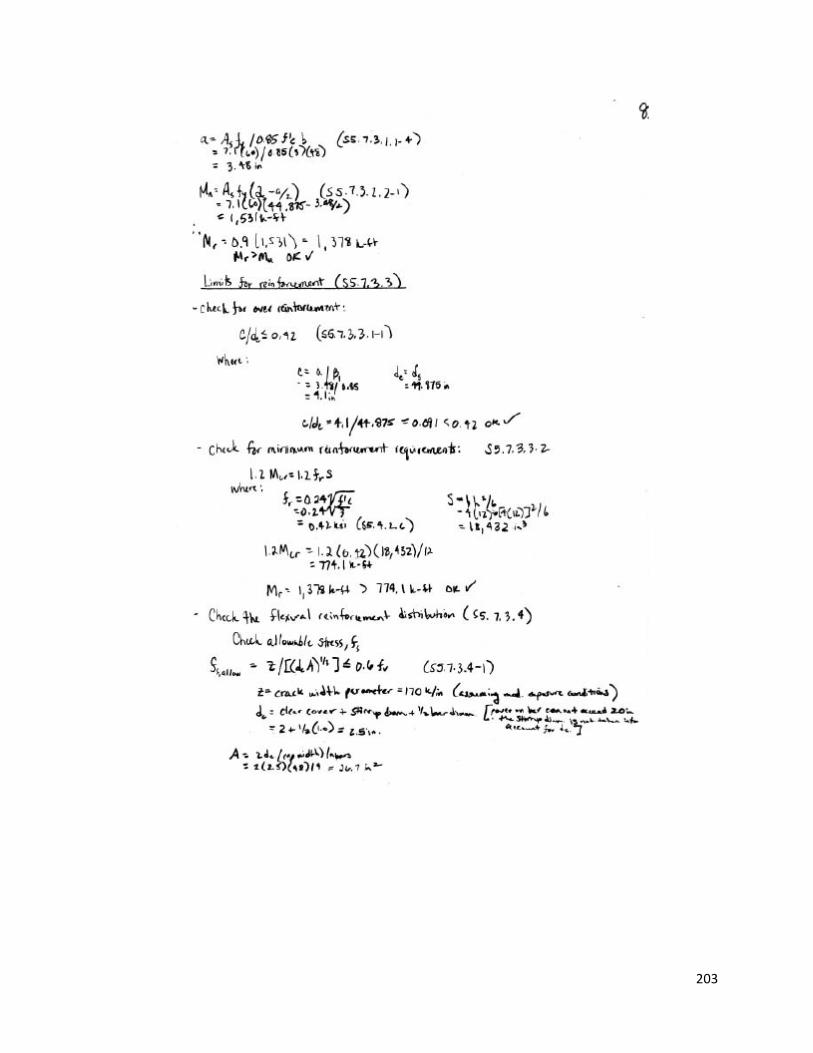
203

204
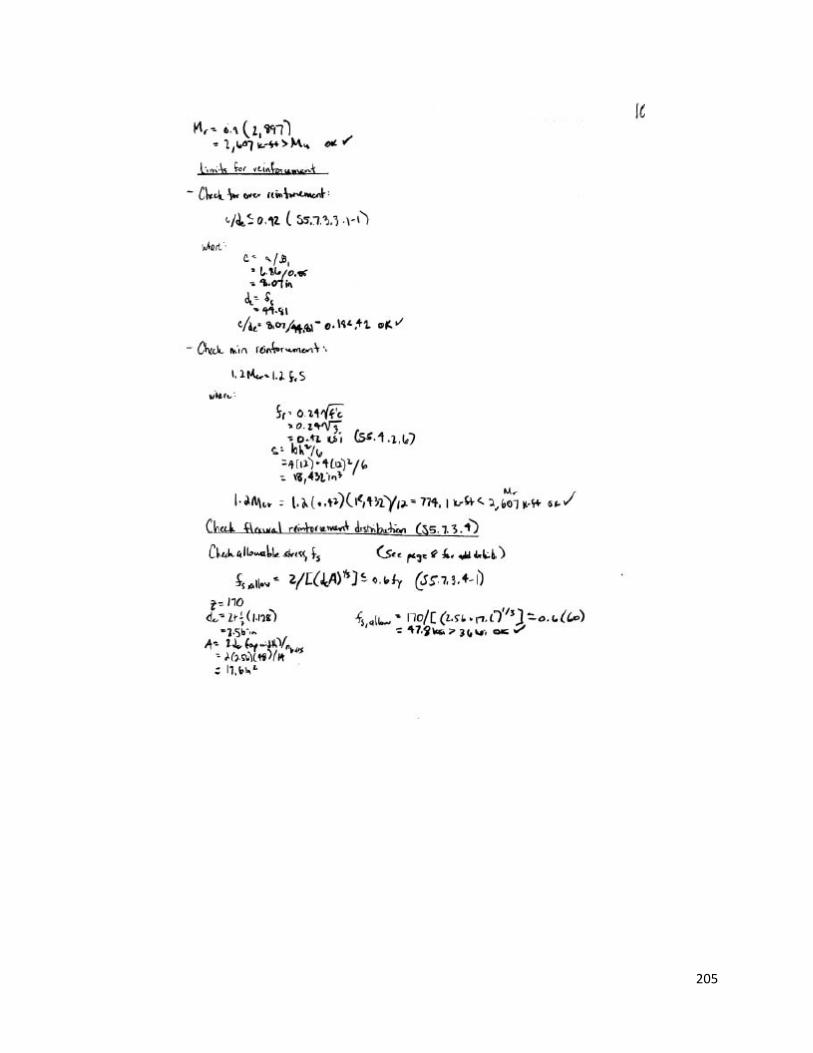
205
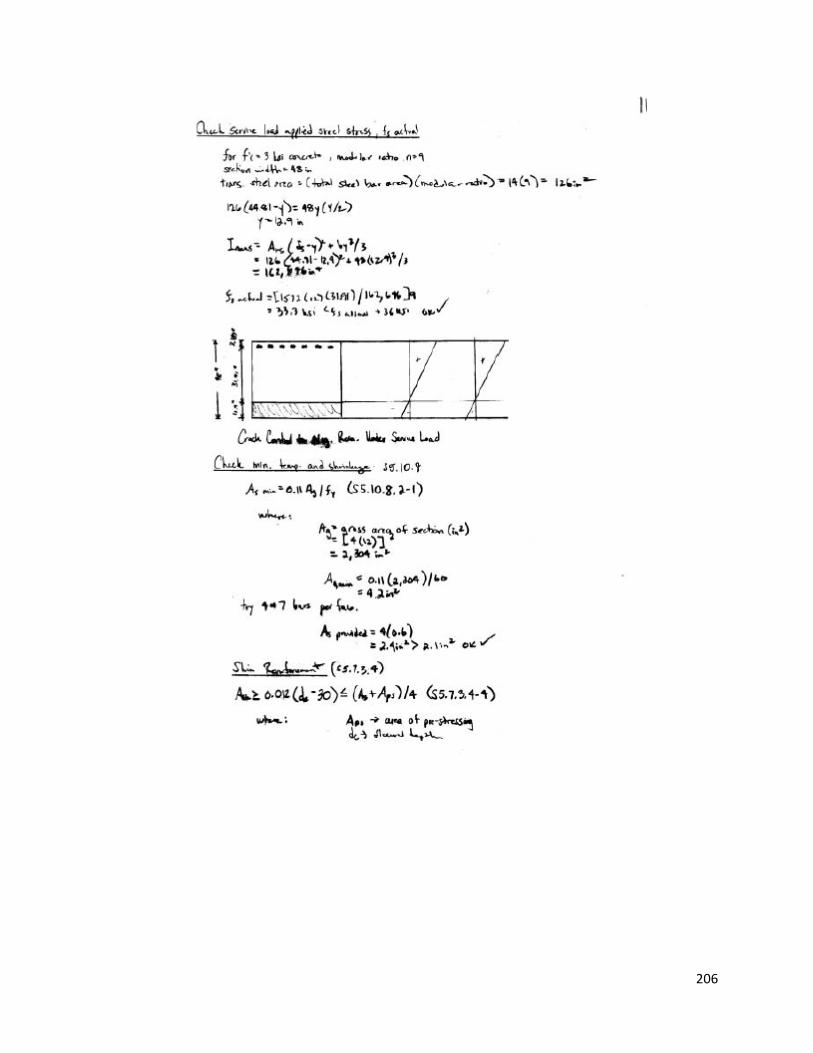
206

207
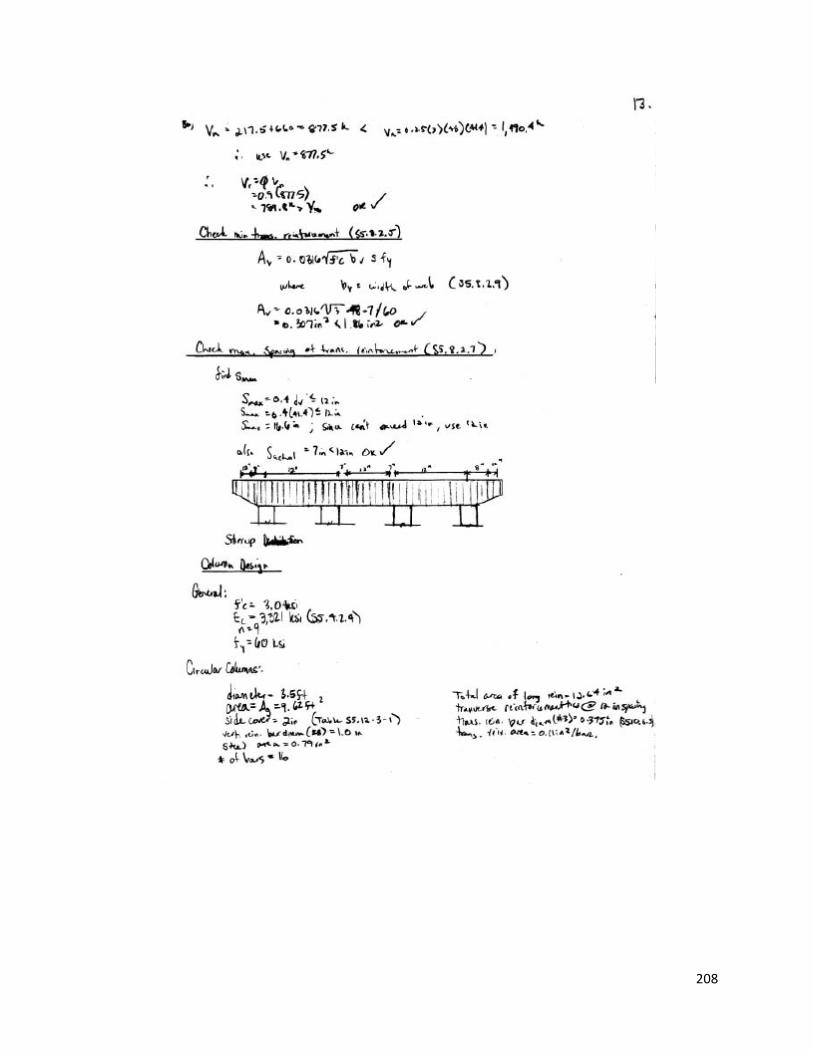
208

209

210

211

212
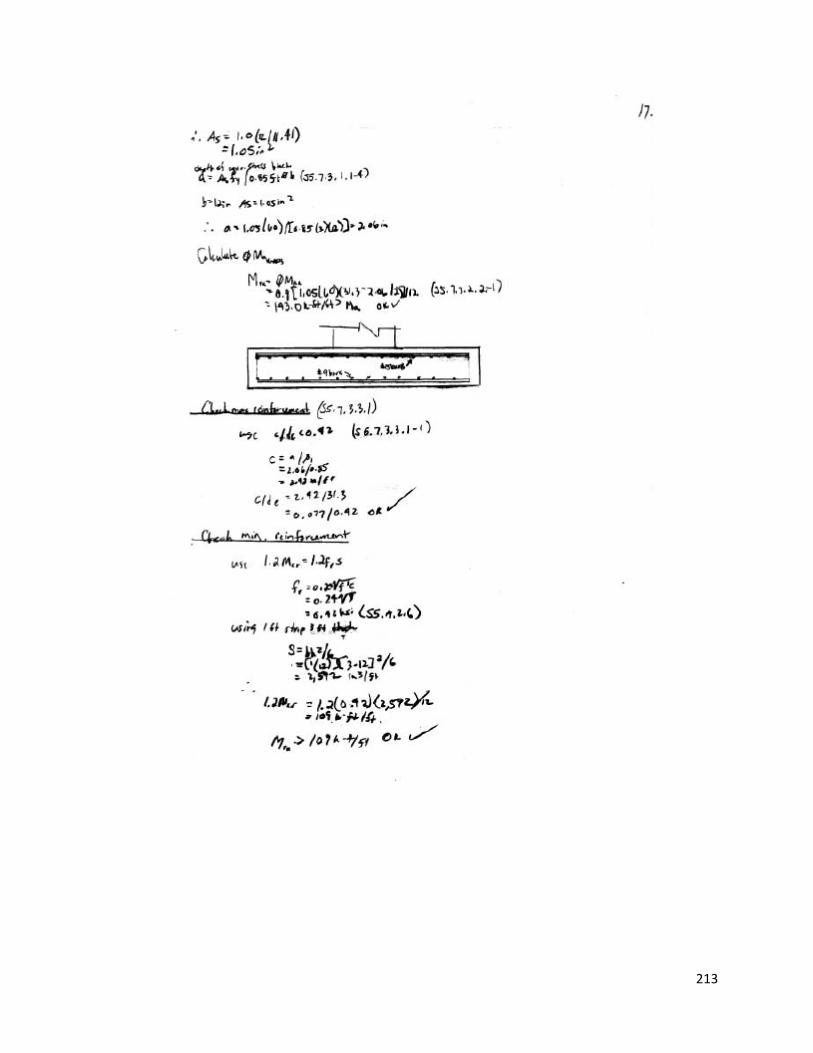
213

214
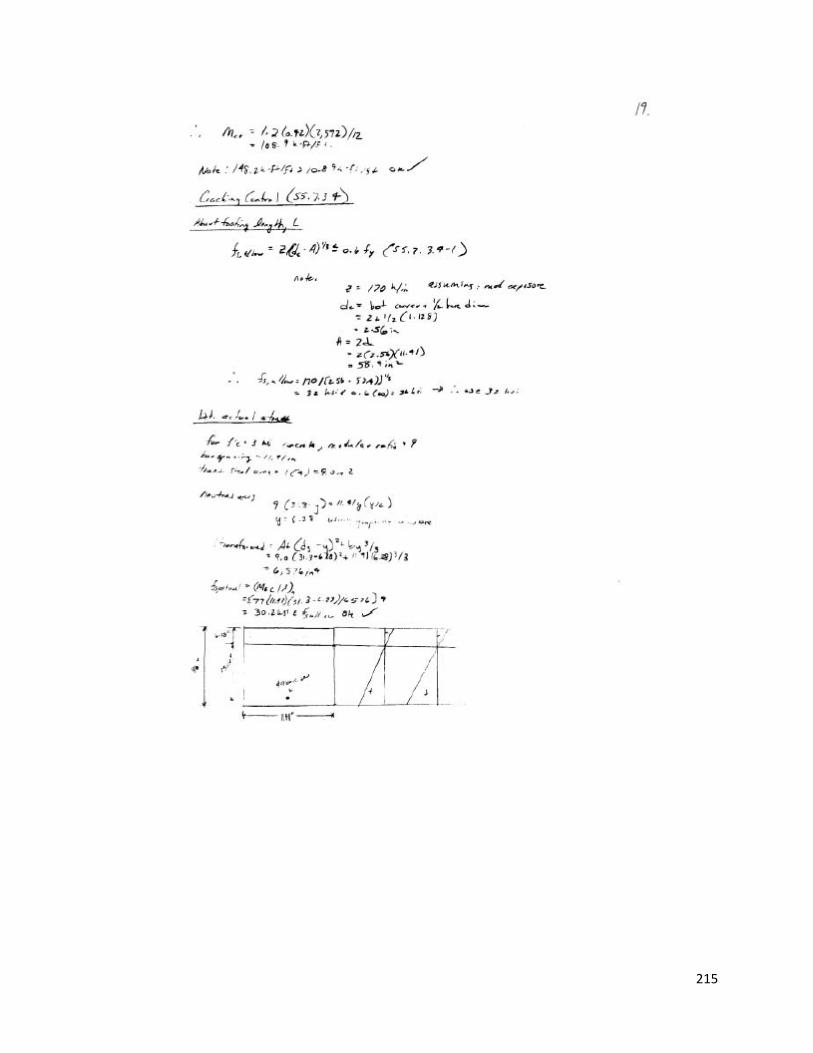
215

216

217
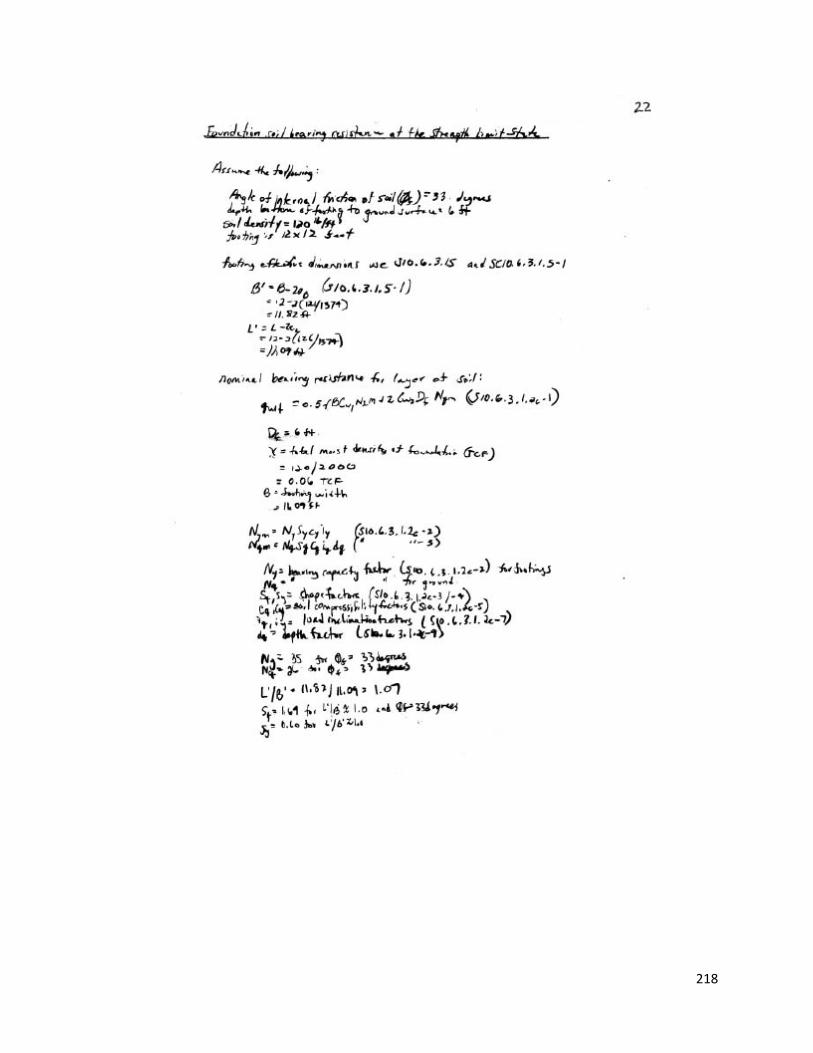
218

219

220
Appendix H: Abutment Design Hand Calculations

221
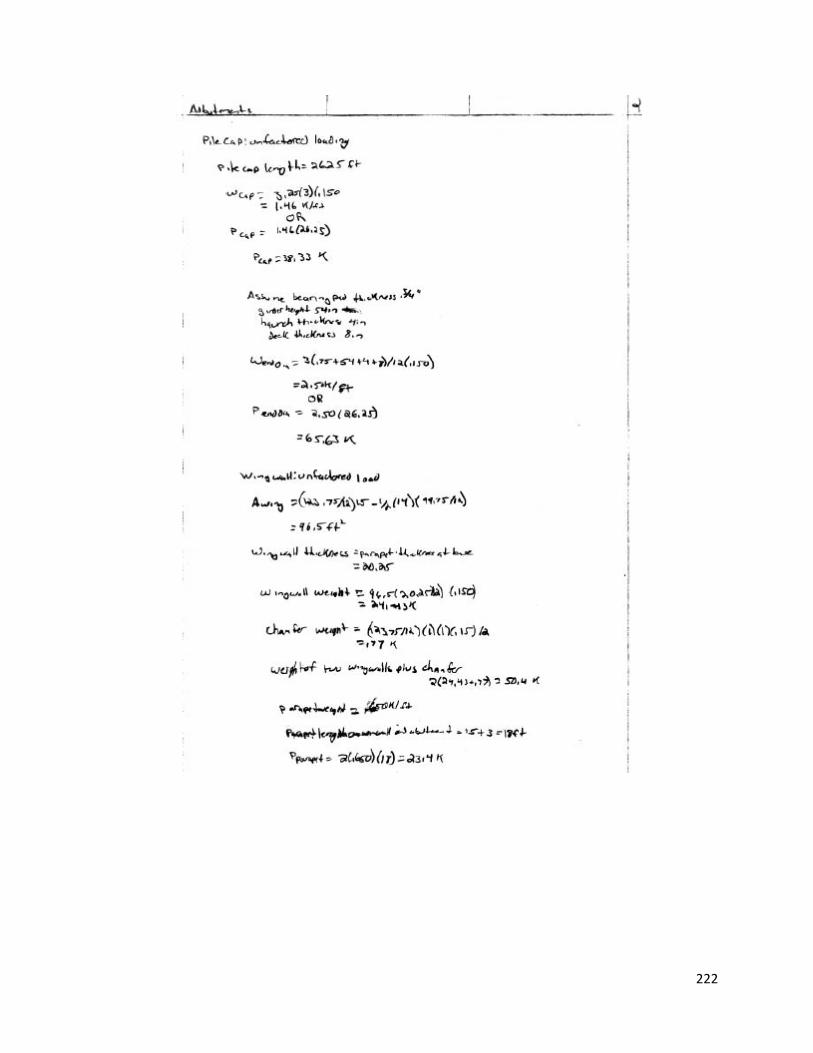
222
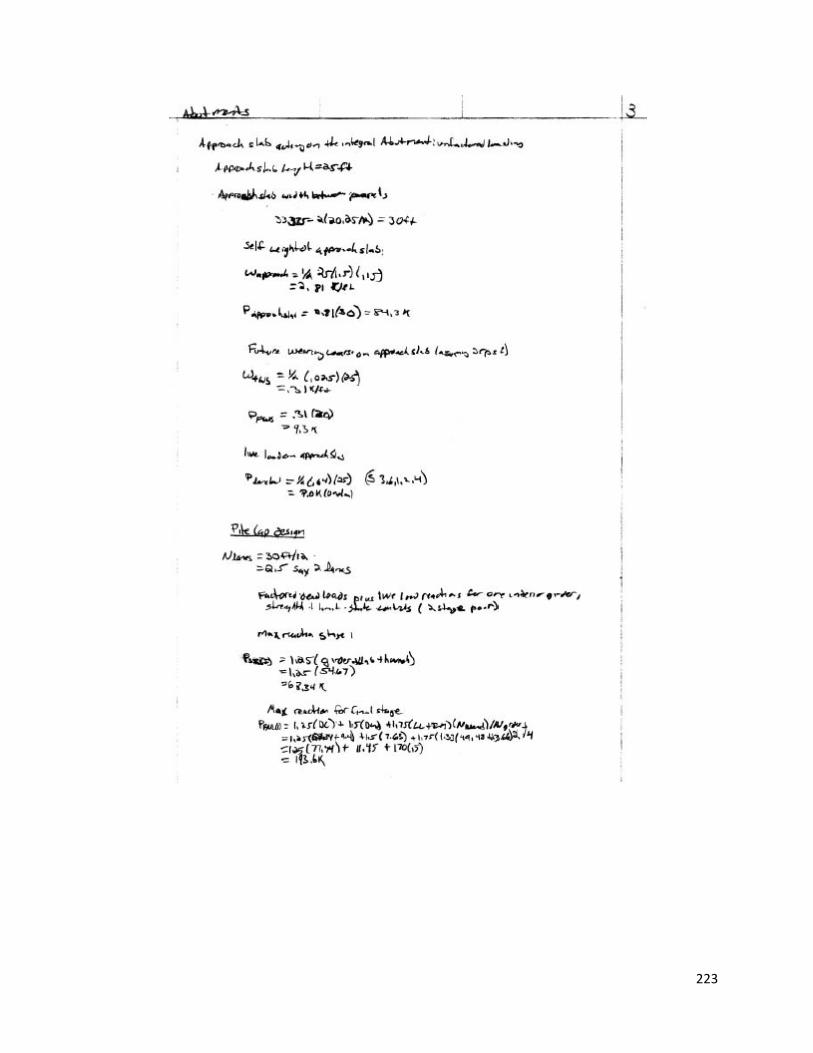
223

224

225

226
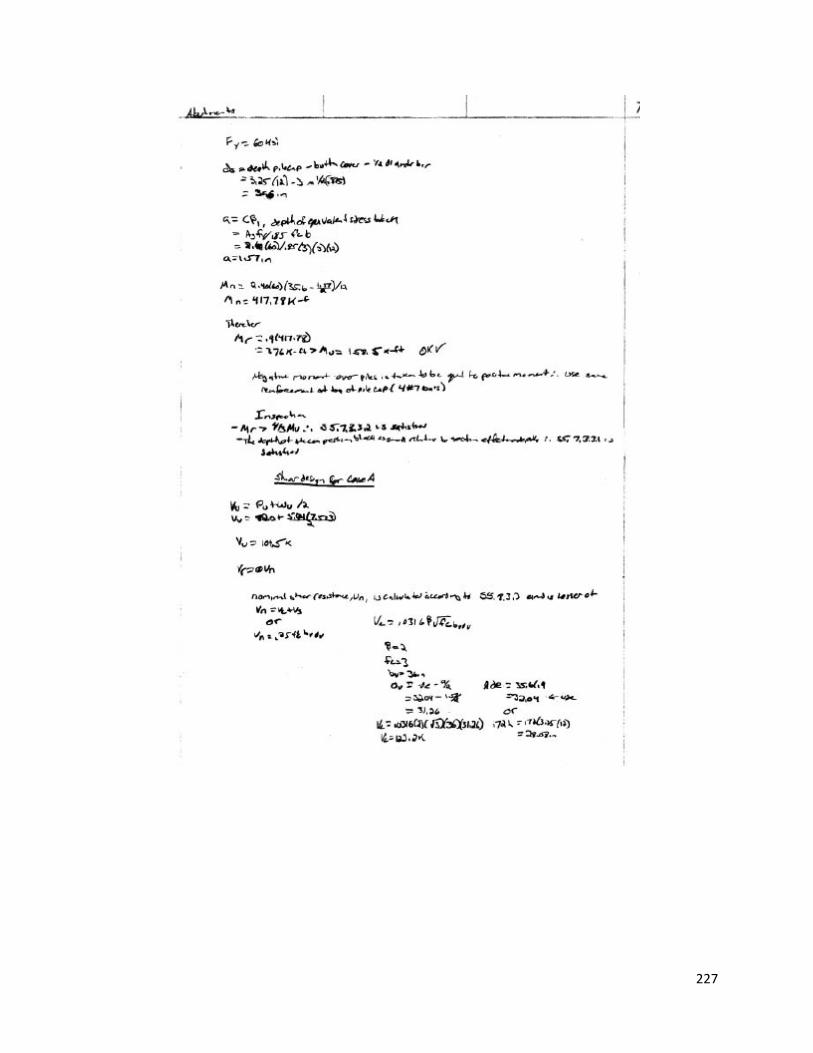
227

228
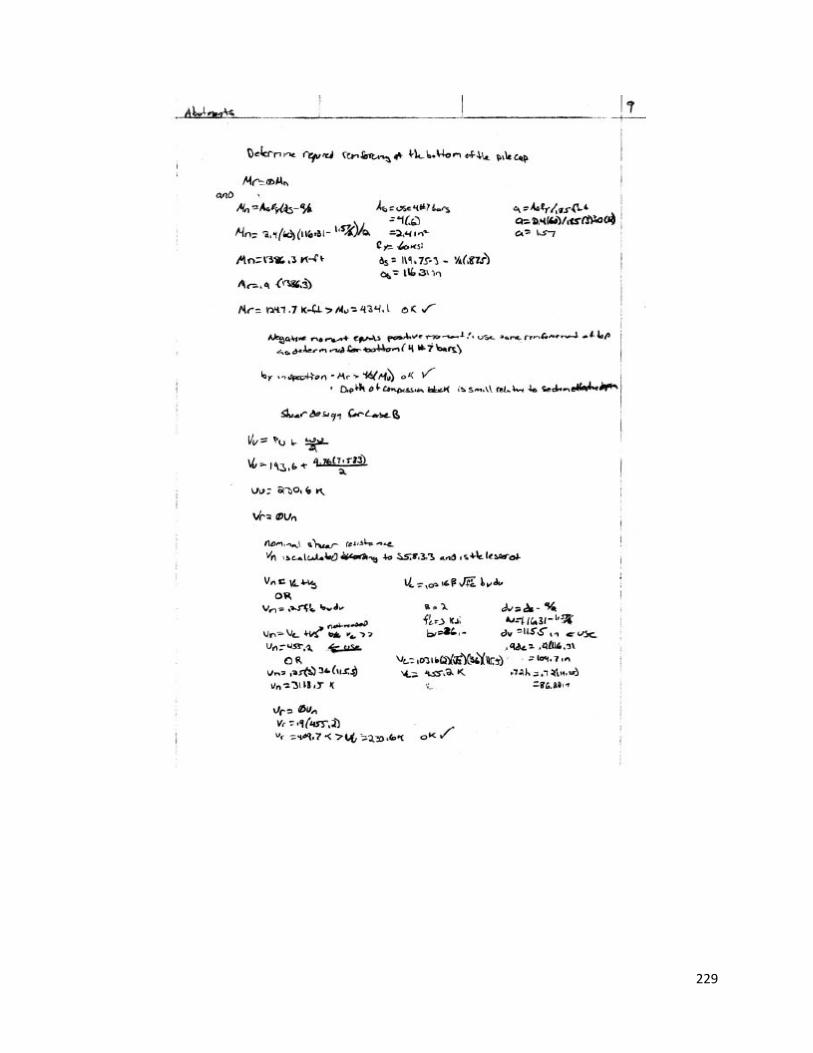
229
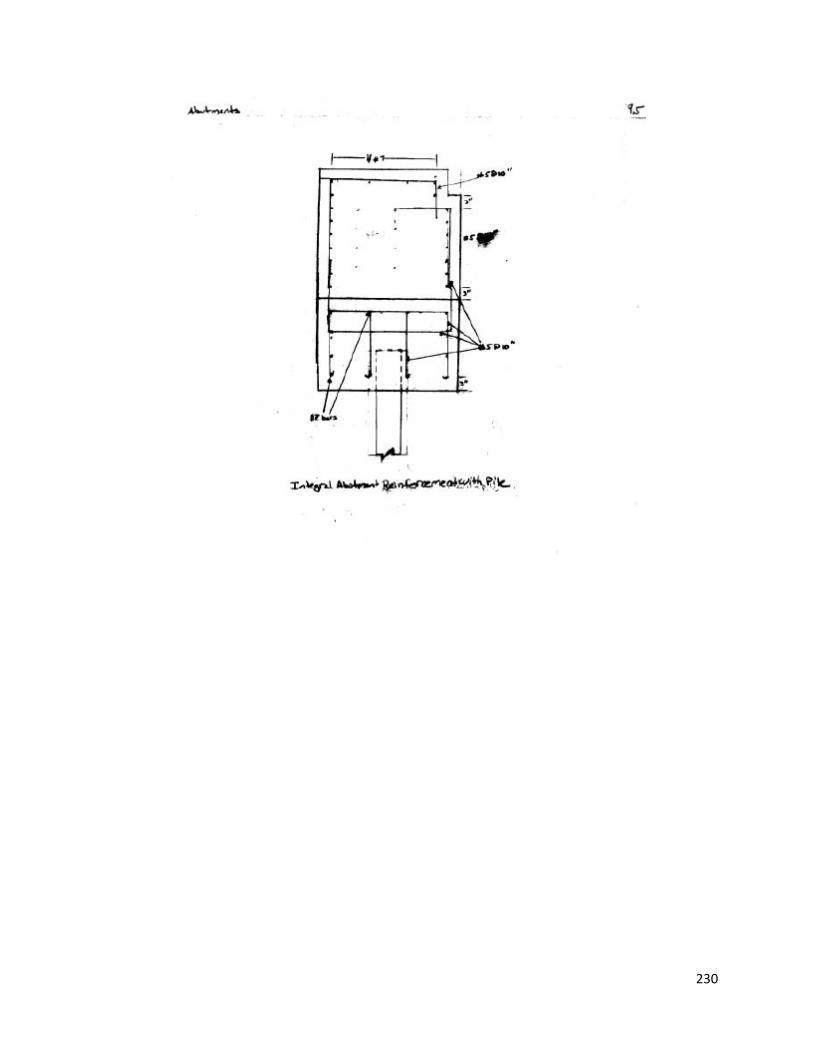
230

231

232

233

234
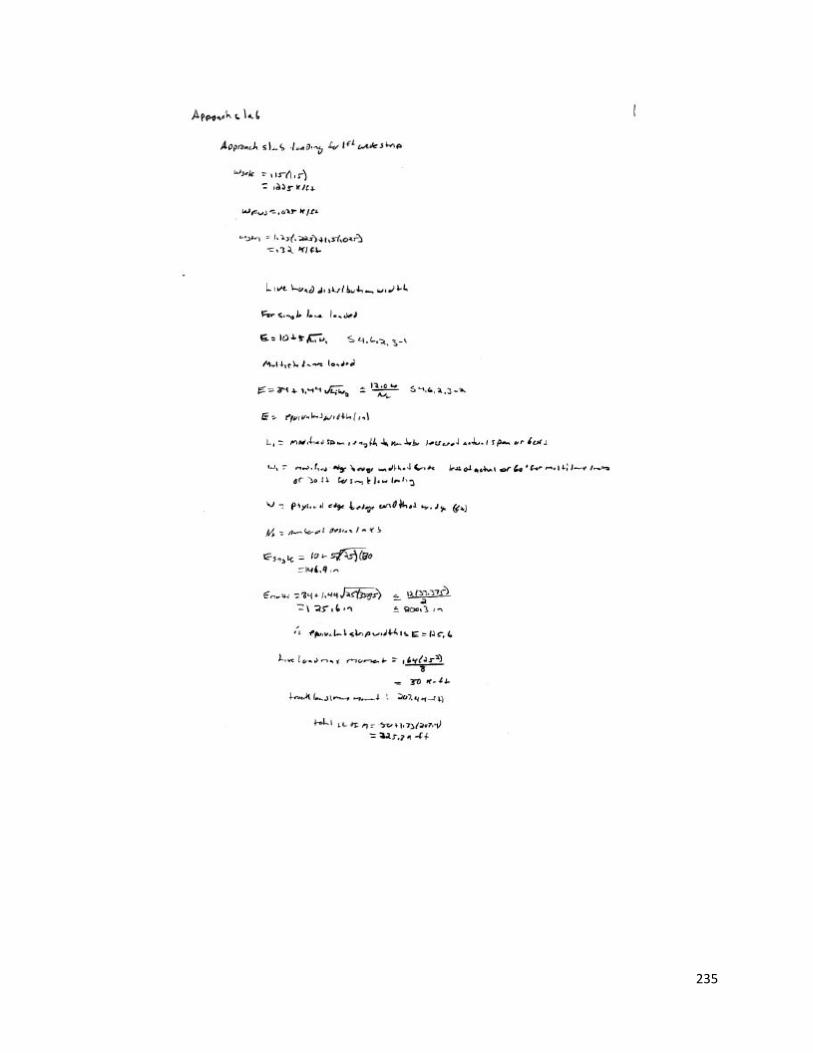
235

236