Comparative Genomics and Visualisation BS32010
88
Comparative Genomics and Visualisation BS32010 Leighton Pritchard 1,2,3 1 Information and Computational Sciences, 2 Centre for Human and Animal Pathogens in the Environment, 3 Dundee Effector Consortium, The James Hutton Institute, Invergowrie, Dundee, Scotland, DD2 5DA
-
Upload
leighton-pritchard -
Category
Science
-
view
724 -
download
0
Transcript of Comparative Genomics and Visualisation BS32010
Comparative Genomics andVisualisationBS32010
Leighton Pritchard1,2,3
1Information and Computational Sciences,2Centre for Human and Animal Pathogens in the Environment,3Dundee Effector Consortium,The James Hutton Institute, Invergowrie, Dundee, Scotland, DD2 5DA

Acceptable Use Policy
Recording of this talk, taking photos, discussing the content usingemail, Twitter, blogs, etc. is permitted (and encouraged),providing distraction to others is minimised.
These slides will be made available on SlideShare.
These slides, and supporting material including exercises, areavailable at https://github.com/widdowquinn/Teaching-Dundee-BS32010
Table of Contents
IntroductionWhat is comparative genomics?Levels of genome comparison
Making ComparisonsIn silico bulk genome comparisonsWhole genome comparisonsGenome feature comparisons
What Is Comparative Genomics?
The combination of genomic data, andcomparative and evolutionary biology, toaddress questions of genome structure,evolution, and function.
Evolution is the central concept
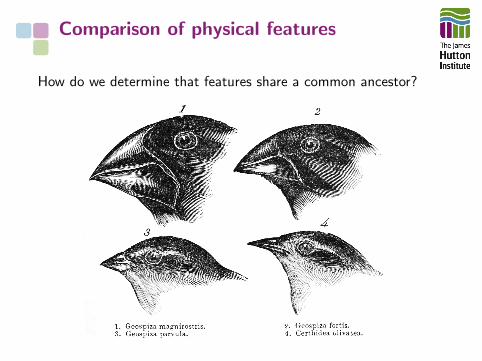
Comparison of physical features
How do we determine that features share a common ancestor?
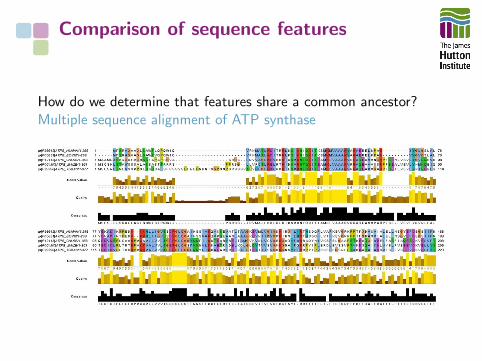
Comparison of sequence features
How do we determine that features share a common ancestor?Multiple sequence alignment of ATP synthase
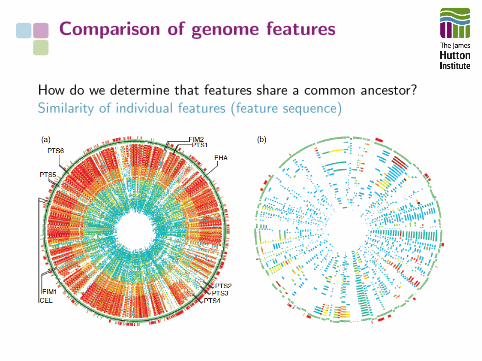
Comparison of genome features
How do we determine that features share a common ancestor?Similarity of individual features (feature sequence)
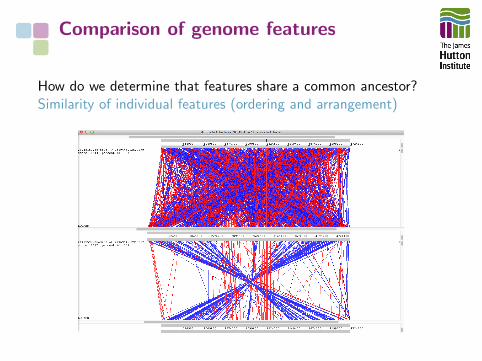
Comparison of genome features
How do we determine that features share a common ancestor?Similarity of individual features (ordering and arrangement)
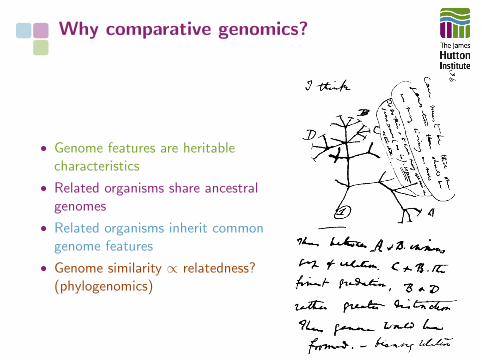
Why comparative genomics?
• Genome features are heritablecharacteristics
• Related organisms share ancestralgenomes
• Related organisms inherit commongenome features
• Genome similarity ∝ relatedness?(phylogenomics)
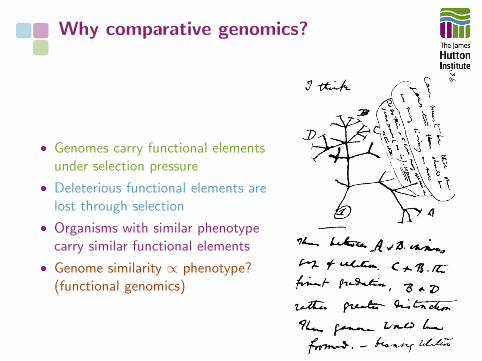
Why comparative genomics?
• Genomes carry functional elementsunder selection pressure
• Deleterious functional elements arelost through selection
• Organisms with similar phenotypecarry similar functional elements
• Genome similarity ∝ phenotype?(functional genomics)
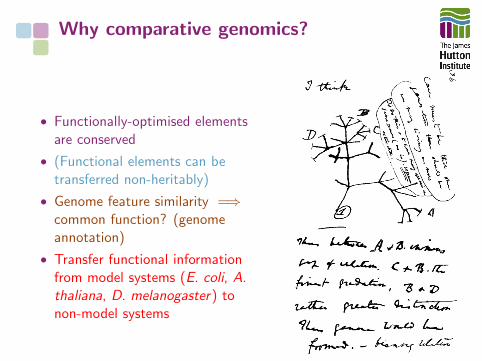
Why comparative genomics?
• Functionally-optimised elementsare conserved
• (Functional elements can betransferred non-heritably)
• Genome feature similarity =⇒common function? (genomeannotation)
• Transfer functional informationfrom model systems (E. coli, A.thaliana, D. melanogaster) tonon-model systems
Table of Contents
IntroductionWhat is comparative genomics?Levels of genome comparison
Making ComparisonsIn silico bulk genome comparisonsWhole genome comparisonsGenome feature comparisons
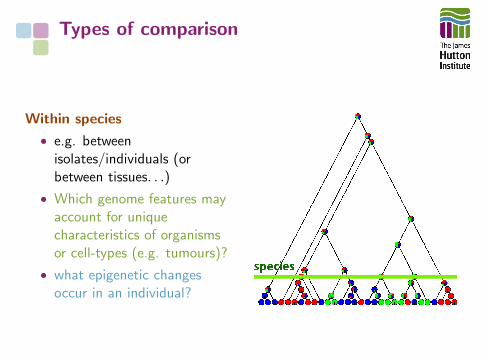
Types of comparison
Within species
• e.g. betweenisolates/individuals (orbetween tissues. . .)
• Which genome features mayaccount for uniquecharacteristics of organismsor cell-types (e.g. tumours)?
• what epigenetic changesoccur in an individual?
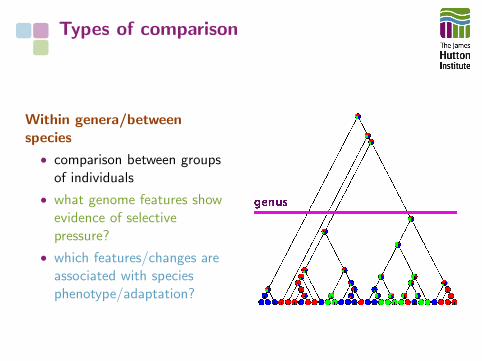
Types of comparison
Within genera/betweenspecies
• comparison between groupsof individuals
• what genome features showevidence of selectivepressure?
• which features/changes areassociated with speciesphenotype/adaptation?
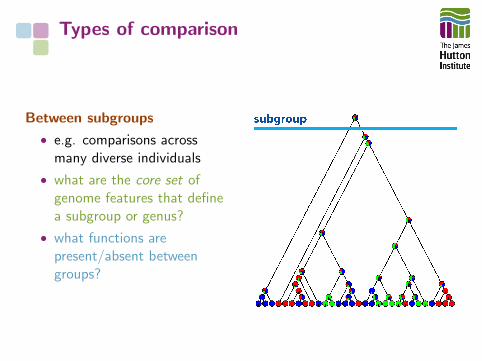
Types of comparison
Between subgroups
• e.g. comparisons acrossmany diverse individuals
• what are the core set ofgenome features that definea subgroup or genus?
• what functions arepresent/absent betweengroups?
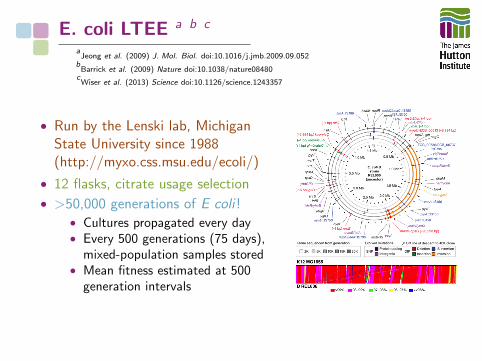
E. coli LTEE a b c
aJeong et al. (2009) J. Mol. Biol. doi:10.1016/j.jmb.2009.09.052
bBarrick et al. (2009) Nature doi:10.1038/nature08480
cWiser et al. (2013) Science doi:10.1126/science.1243357
• Run by the Lenski lab, MichiganState University since 1988(http://myxo.css.msu.edu/ecoli/)
• 12 flasks, citrate usage selection
• >50,000 generations of E coli !• Cultures propagated every day• Every 500 generations (75 days),
mixed-population samples stored• Mean fitness estimated at 500
generation intervals
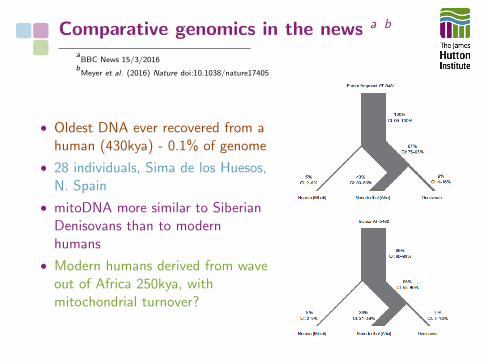
Comparative genomics in the news a b
aBBC News 15/3/2016
bMeyer et al. (2016) Nature doi:10.1038/nature17405
• Oldest DNA ever recovered from ahuman (430kya) - 0.1% of genome
• 28 individuals, Sima de los Huesos,N. Spain
• mitoDNA more similar to SiberianDenisovans than to modernhumans
• Modern humans derived from waveout of Africa 250kya, withmitochondrial turnover?
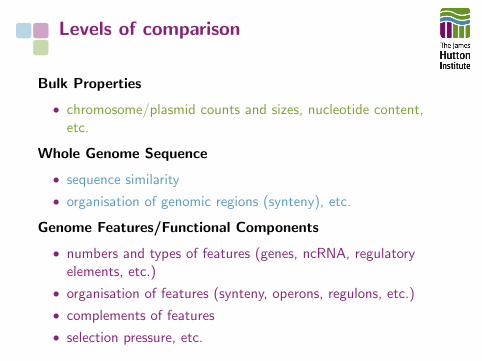
Levels of comparison
Bulk Properties
• chromosome/plasmid counts and sizes, nucleotide content,etc.
Whole Genome Sequence
• sequence similarity
• organisation of genomic regions (synteny), etc.
Genome Features/Functional Components
• numbers and types of features (genes, ncRNA, regulatoryelements, etc.)
• organisation of features (synteny, operons, regulons, etc.)
• complements of features
• selection pressure, etc.
Table of Contents
IntroductionWhat is comparative genomics?Levels of genome comparison
Making ComparisonsIn silico bulk genome comparisonsWhole genome comparisonsGenome feature comparisons
Bulk property comparisons
You don’t have to sequence genomes tocompare them(but it helps)
Genome comparisons predate NGS
• Sequence data wasn’t always cheap and abundant
• Practical, experimental genome comparisons were needed
Bulk property comparisons
Calculate values for individual genomes,then compare them.• Number of chromosomes
• Ploidy
• Chromosome size
• Nucleotide (A,C,G,T) frequency
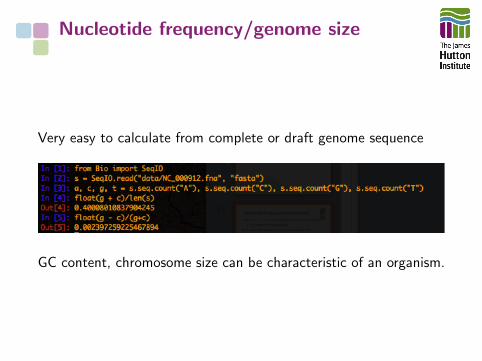
Nucleotide frequency/genome size
Very easy to calculate from complete or draft genome sequence
GC content, chromosome size can be characteristic of an organism.

Genome Size and GC%
Blobology a b
aKumar & Blaxter (2011) Symbiosis doi:10.1007/s13199-012-0154-6
bhttp://nematodes.org/bioinformatics/blobology/
Sequence data can be contaminated by other organisms
• Host and symbiont DNA have different %GC
• Host and symbiont DNA differ in coverage
• Assemble genome
• Map reads
• Plot coverage against %GC
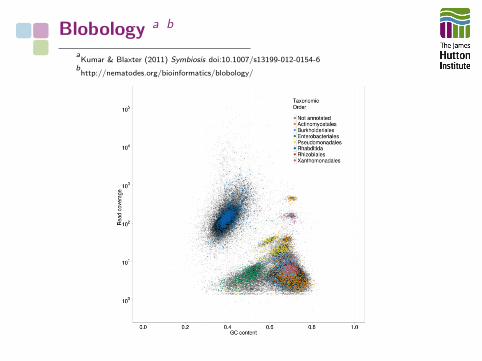
Blobology a b
aKumar & Blaxter (2011) Symbiosis doi:10.1007/s13199-012-0154-6
bhttp://nematodes.org/bioinformatics/blobology/
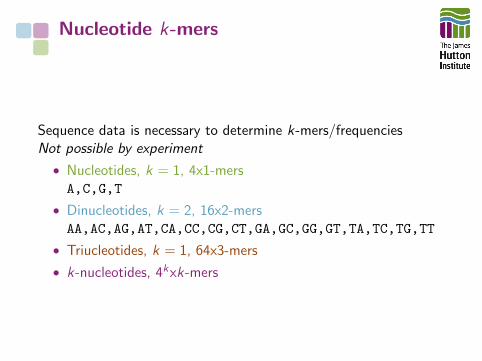
Nucleotide k-mers
Sequence data is necessary to determine k-mers/frequenciesNot possible by experiment
• Nucleotides, k = 1, 4x1-mersA,C,G,T
• Dinucleotides, k = 2, 16x2-mersAA,AC,AG,AT,CA,CC,CG,CT,GA,GC,GG,GT,TA,TC,TG,TT
• Triucleotides, k = 1, 64x3-mers
• k-nucleotides, 4kxk-mers
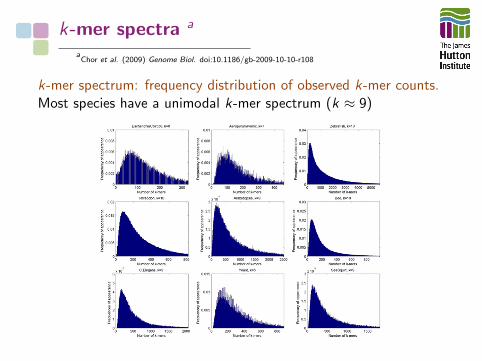
k-mer spectra a
aChor et al. (2009) Genome Biol. doi:10.1186/gb-2009-10-10-r108
k-mer spectrum: frequency distribution of observed k-mer counts.Most species have a unimodal k-mer spectrum (k ≈ 9)
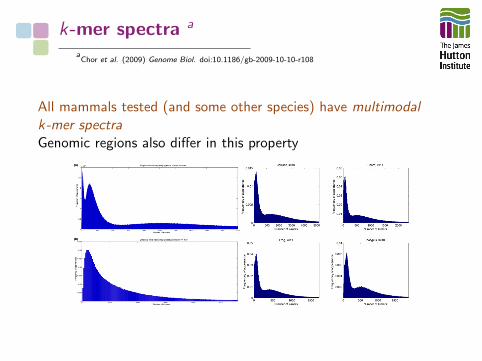
k-mer spectra a
aChor et al. (2009) Genome Biol. doi:10.1186/gb-2009-10-10-r108
All mammals tested (and some other species) have multimodalk-mer spectraGenomic regions also differ in this property
Table of Contents
IntroductionWhat is comparative genomics?Levels of genome comparison
Making ComparisonsIn silico bulk genome comparisonsWhole genome comparisonsGenome feature comparisons
Whole genome comparisons
Comparisons of one whole or draft genomewith another(. . .or many others)
Whole genome comparisons
Minimum requirement: two genomes
• Reference Genome
• Comparator Genome
The experiment produces a comparative result that is dependenton the choice of genomes.
Whole genome comparisons
Experimental methods mostly involve direct or indirect DNAhybridisation
• DNA-DNA hybridisation (DDH)
• Comparative Genomic Hybridisation (CGH)
• Array Comparative Genomic Hybridisation (aCGH)
Whole genome comparisons
Analogously, in silico methods mostly involve sequence alignment
• Average Nucleotide Identity (ANI)
• Pairwise genome alignment
• Multiple genome alignment
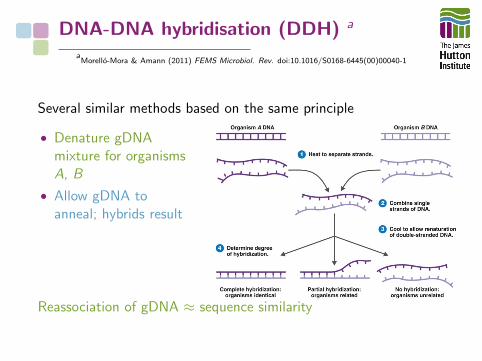
DNA-DNA hybridisation (DDH) a
aMorello-Mora & Amann (2011) FEMS Microbiol. Rev. doi:10.1016/S0168-6445(00)00040-1
Several similar methods based on the same principle
• Denature gDNAmixture for organismsA, B
• Allow gDNA toanneal; hybrids result
Reassociation of gDNA ≈ sequence similarity
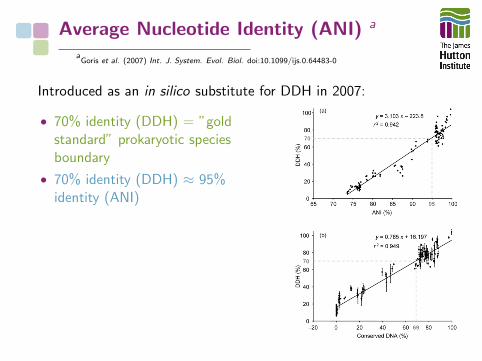
Average Nucleotide Identity (ANI) a
aGoris et al. (2007) Int. J. System. Evol. Biol. doi:10.1099/ijs.0.64483-0
Introduced as an in silico substitute for DDH in 2007:
• 70% identity (DDH) = ”goldstandard” prokaryotic speciesboundary
• 70% identity (DDH) ≈ 95%identity (ANI)
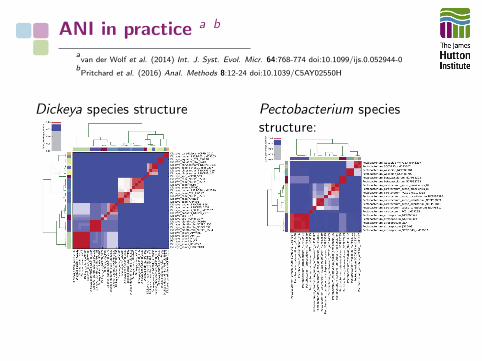
ANI in practice a b
avan der Wolf et al. (2014) Int. J. Syst. Evol. Micr. 64:768-774 doi:10.1099/ijs.0.052944-0
bPritchard et al. (2016) Anal. Methods 8:12-24 doi:10.1039/C5AY02550H
Dickeya species structure Pectobacterium speciesstructure:
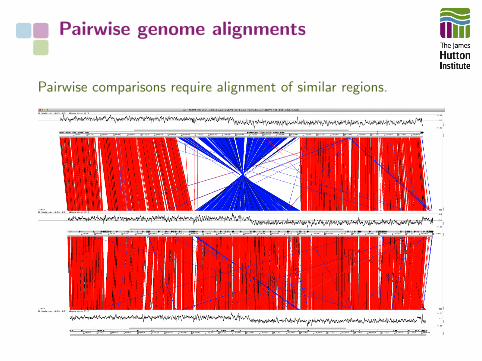
Pairwise genome alignments
Pairwise comparisons require alignment of similar regions.
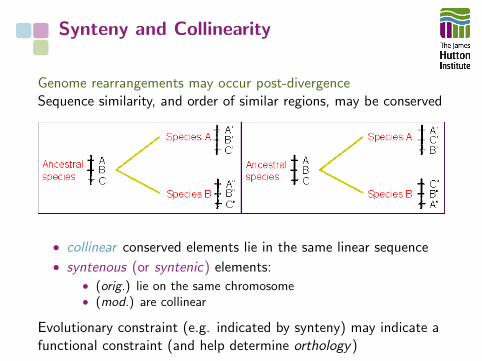
Synteny and Collinearity
Genome rearrangements may occur post-divergenceSequence similarity, and order of similar regions, may be conserved
• collinear conserved elements lie in the same linear sequence
• syntenous (or syntenic) elements:• (orig.) lie on the same chromosome• (mod.) are collinear
Evolutionary constraint (e.g. indicated by synteny) may indicate afunctional constraint (and help determine orthology)
Alignment algorithms/programs
I assume you’re familiar with BLAST. . .BLASTN and naıve alignment algorithms are not appropriate forwhole-genome alignment:
• Needleman-Wunsch: optimal global alignment
• Smith-Waterman: optimal local alignment
Cannot handle rearrangementComputationally expensive
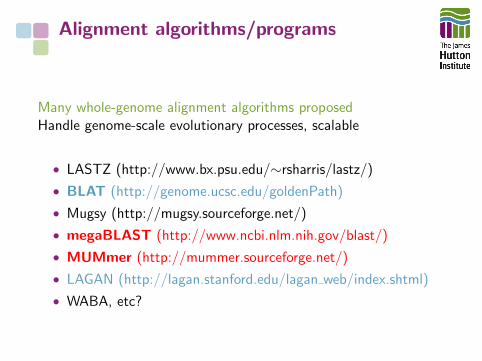
Alignment algorithms/programs
Many whole-genome alignment algorithms proposedHandle genome-scale evolutionary processes, scalable
• LASTZ (http://www.bx.psu.edu/∼rsharris/lastz/)
• BLAT (http://genome.ucsc.edu/goldenPath)
• Mugsy (http://mugsy.sourceforge.net/)
• megaBLAST (http://www.ncbi.nlm.nih.gov/blast/)
• MUMmer (http://mummer.sourceforge.net/)
• LAGAN (http://lagan.stanford.edu/lagan web/index.shtml)
• WABA, etc?
megaBLAST a b
aZhang et al. (2000) J. Comp. Biol. 7(1-2): 203-214
bKorf et al. (2003) BLAST O’Reilly & Associates, Sebastopol, CA
Optimised for:
• speed and genome-level searching
• queries on large sequence sets: ”query-packing”
• long alignments of very similar sequences (dc-megablast fordivergent sequences)
Uses Zhang et al. greedy algorithm, not BLAST algorithm
BLASTN+ defaults to megaBLAST algorithm(see http://www.ncbi.nlm.nih.gov/blast/Why.shtml)
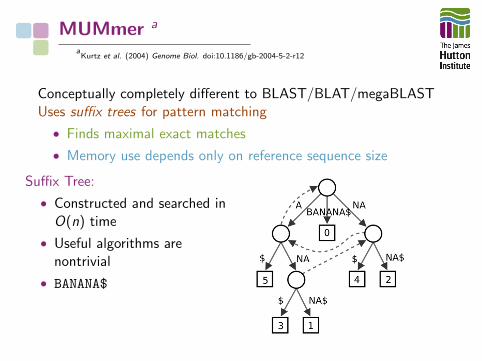
MUMmer a
aKurtz et al. (2004) Genome Biol. doi:10.1186/gb-2004-5-2-r12
Conceptually completely different to BLAST/BLAT/megaBLASTUses suffix trees for pattern matching
• Finds maximal exact matches
• Memory use depends only on reference sequence size
Suffix Tree:
• Constructed and searched inO(n) time
• Useful algorithms arenontrivial
• BANANA$
Pairwise genome alignments
Which genomes should you align (or not bother with)?For reasonable analysis, genomes should:
• derive from a sufficiently recent common ancestor, so thathomologous regions can be identified
• derive from a sufficiently distant common ancestor, so thatbiologically meaningful changes are likely to be found
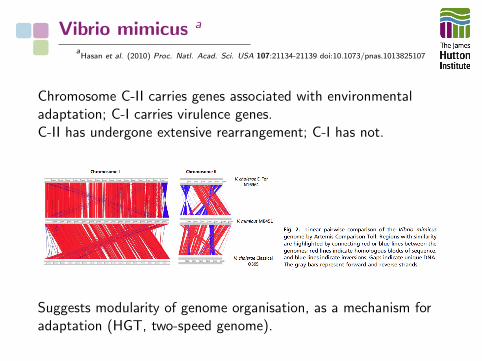
Vibrio mimicus a
aHasan et al. (2010) Proc. Natl. Acad. Sci. USA 107:21134-21139 doi:10.1073/pnas.1013825107
Chromosome C-II carries genes associated with environmentaladaptation; C-I carries virulence genes.C-II has undergone extensive rearrangement; C-I has not.
Suggests modularity of genome organisation, as a mechanism foradaptation (HGT, two-speed genome).
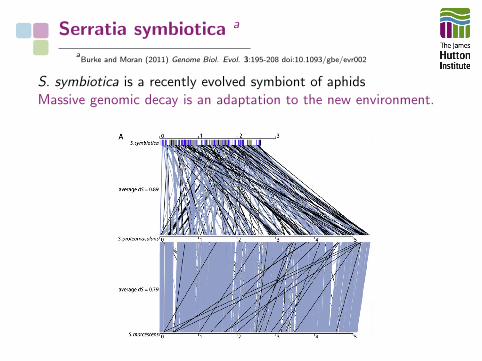
Serratia symbiotica a
aBurke and Moran (2011) Genome Biol. Evol. 3:195-208 doi:10.1093/gbe/evr002
S. symbiotica is a recently evolved symbiont of aphidsMassive genomic decay is an adaptation to the new environment.
Multiple genome alignments
Multiple genome alignments are “harder” than pairwise
• Computationally difficult to produce
• Lead to NP-complete optimisation problems!
Solutions: heuristics
• Progressive (build a tree, combine pairwise alignments)
• Iterative (realign initial sequences as new genomes added)
• Positional homology
• Glocal alignments
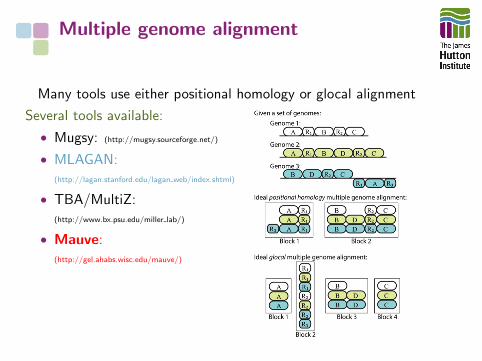
Multiple genome alignment
Many tools use either positional homology or glocal alignment
Several tools available:
• Mugsy: (http://mugsy.sourceforge.net/)
• MLAGAN:(http://lagan.stanford.edu/lagan web/index.shtml)
• TBA/MultiZ:(http://www.bx.psu.edu/miller lab/)
• Mauve:(http://gel.ahabs.wisc.edu/mauve/)
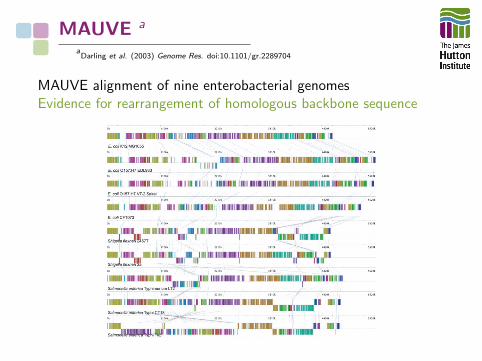
MAUVE a
aDarling et al. (2003) Genome Res. doi:10.1101/gr.2289704
MAUVE alignment of nine enterobacterial genomesEvidence for rearrangement of homologous backbone sequence
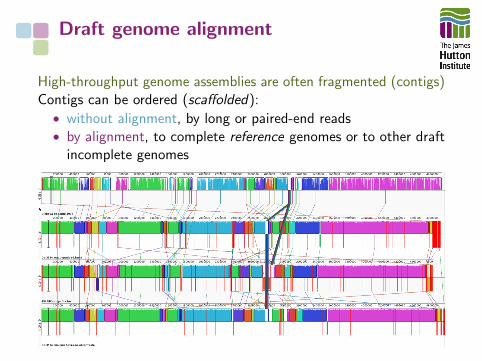
Draft genome alignment
High-throughput genome assemblies are often fragmented (contigs)Contigs can be ordered (scaffolded):• without alignment, by long or paired-end reads• by alignment, to complete reference genomes or to other draft
incomplete genomes
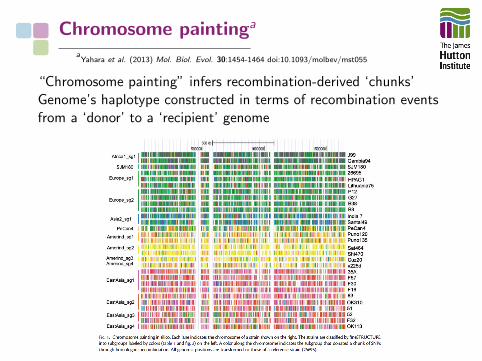
Chromosome paintinga
aYahara et al. (2013) Mol. Biol. Evol. 30:1454-1464 doi:10.1093/molbev/mst055
“Chromosome painting” infers recombination-derived ‘chunks’Genome’s haplotype constructed in terms of recombination eventsfrom a ‘donor’ to a ‘recipient’ genome
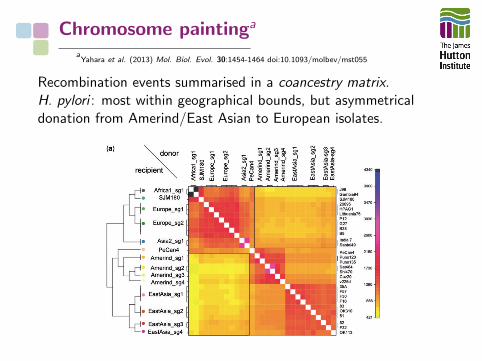
Chromosome paintinga
aYahara et al. (2013) Mol. Biol. Evol. 30:1454-1464 doi:10.1093/molbev/mst055
Recombination events summarised in a coancestry matrix.H. pylori : most within geographical bounds, but asymmetricaldonation from Amerind/East Asian to European isolates.
Whole Genome Comparisons
Physical and computational genome comparisons
• Similar biological questions
• ∴ similar concepts
Modern biology: lots of sequence data
• Conservation ≈ evolutionary constraint
• Many choices of algorithms/software
• Many choices of visualisation tools/software
Table of Contents
IntroductionWhat is comparative genomics?Levels of genome comparison
Making ComparisonsIn silico bulk genome comparisonsWhole genome comparisonsGenome feature comparisons
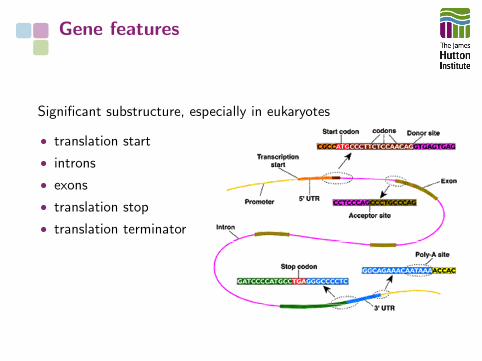
Gene features
Significant substructure, especially in eukaryotes
• translation start
• introns
• exons
• translation stop
• translation terminator
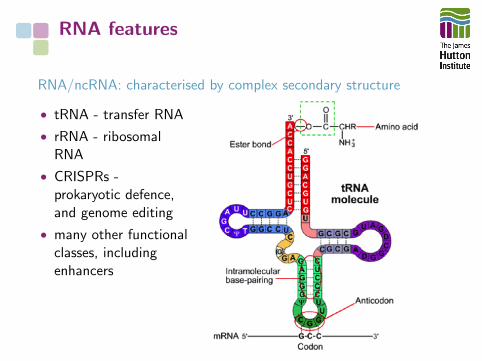
RNA features
RNA/ncRNA: characterised by complex secondary structure
• tRNA - transfer RNA
• rRNA - ribosomalRNA
• CRISPRs -prokaryotic defence,and genome editing
• many other functionalclasses, includingenhancers
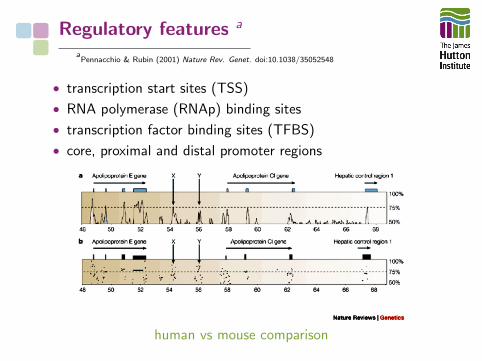
Regulatory features a
aPennacchio & Rubin (2001) Nature Rev. Genet. doi:10.1038/35052548
• transcription start sites (TSS)
• RNA polymerase (RNAp) binding sites
• transcription factor binding sites (TFBS)
• core, proximal and distal promoter regions
human vs mouse comparison
Gene finding a b c
aLiang et al. (2009) Genome Res. doi:10.1101/gr.088997.108
bBrent (2007) Nat. Biotech. doi:10.1038/nbt0807-883
cKorf (2004) BMC Bioinf. doi:10.1186/1471-2105-5-59
At genome scales, we need to automate functional prediction
Empirical (evidence-based) methods:
• Inference from known protein/cDNA/mRNA/EST sequence
• Interference from mapped RNA reads (e.g. RNAseq)
Ab initio methods:
• Prediction on the basis of gene features (TSS, CpG islands,Shine-Dalgarno sequence, stop codons, nucleotidecomposition, etc.)
Inference from genome comparisons/sequence conservation
Regulatory element finding a b c
aZhang et al. (2011) BMC Bioinf. doi:10.1186/1471-2105-12-238
bKilic et al. (2013) Nucl. Acids Re. doi:10.1093/nar/gkt1123
cVavouri & Elgar (2005) Curr. Op. Genet. Deve. doi:10.1016/j.gde.2005.05.002
Empirical (evidence-based) methods:
• Inference from protein-DNA binding experiments
• Interference from co-expression
Ab initio methods:
• Identification of regulatory motifs (profile/other methods;TATA, σ-factor binding sites, etc.)
• Statistical overrepresentation of motifs
• Identification from sequence properties
Inference from genome comparisons/sequence conservation
Equivalent genome features
When comparing two features (e.g. genes) between two or moregenomes, there must be some basis for making the comparison.They have to be equivalent in some way, such as:
• common evolutionary origin
• functional similarity
• a family-based relationship
It’s common to define equivalence of genome features in terms ofevolutionary relationship.
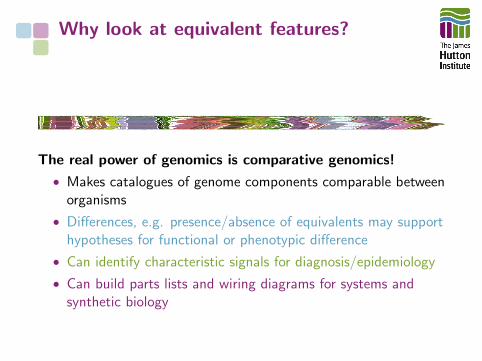
Why look at equivalent features?
The real power of genomics is comparative genomics!
• Makes catalogues of genome components comparable betweenorganisms
• Differences, e.g. presence/absence of equivalents may supporthypotheses for functional or phenotypic difference
• Can identify characteristic signals for diagnosis/epidemiology
• Can build parts lists and wiring diagrams for systems andsynthetic biology
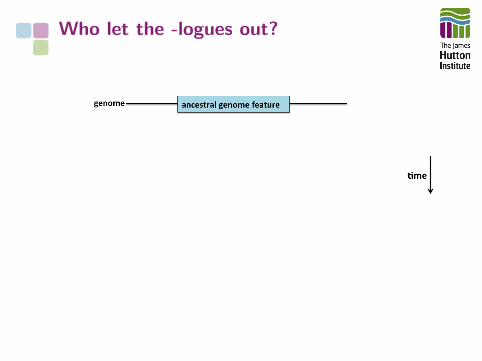
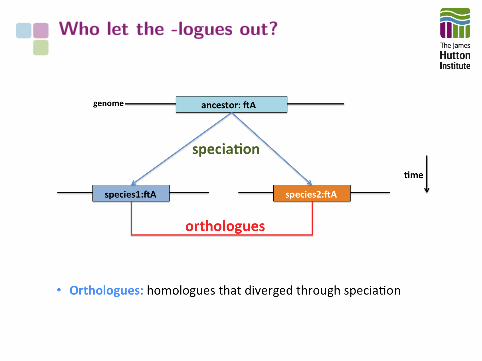
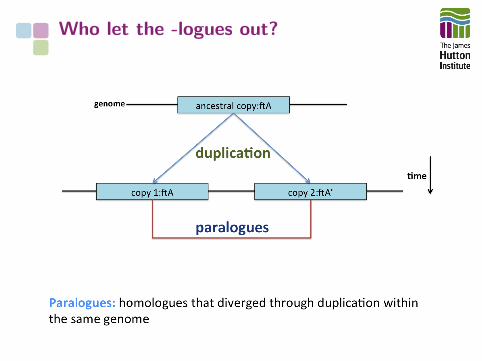
Who let the -logues out?
Genome features can have complexevolutionary relationships
We have precise terms to describe theserelationships
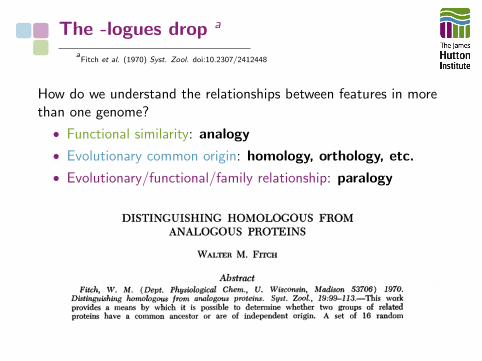
The -logues drop a
aFitch et al. (1970) Syst. Zool. doi:10.2307/2412448
How do we understand the relationships between features in morethan one genome?
• Functional similarity: analogy
• Evolutionary common origin: homology, orthology, etc.
• Evolutionary/functional/family relationship: paralogy
Who let the -logues out?
Who let the -logues out?
Who let the -logues out?
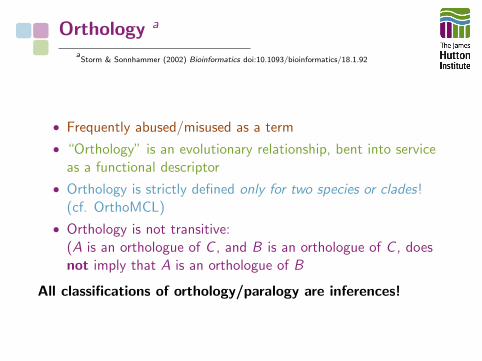
Orthology a
aStorm & Sonnhammer (2002) Bioinformatics doi:10.1093/bioinformatics/18.1.92
• Frequently abused/misused as a term
• “Orthology” is an evolutionary relationship, bent into serviceas a functional descriptor
• Orthology is strictly defined only for two species or clades!(cf. OrthoMCL)
• Orthology is not transitive:(A is an orthologue of C , and B is an orthologue of C , doesnot imply that A is an orthologue of B
All classifications of orthology/paralogy are inferences!
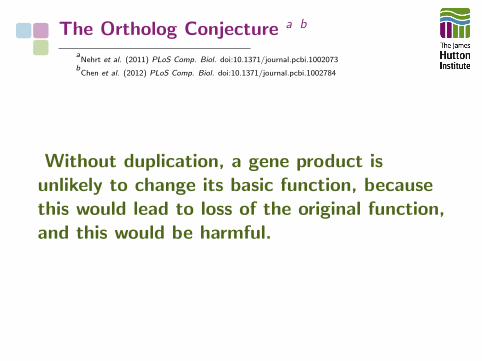
The Ortholog Conjecture a b
aNehrt et al. (2011) PLoS Comp. Biol. doi:10.1371/journal.pcbi.1002073
bChen et al. (2012) PLoS Comp. Biol. doi:10.1371/journal.pcbi.1002784
Without duplication, a gene product isunlikely to change its basic function, becausethis would lead to loss of the original function,and this would be harmful.
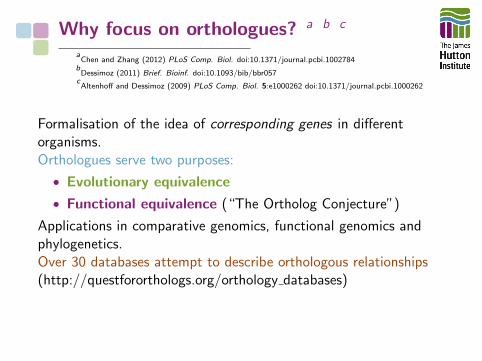
Why focus on orthologues? a b c
aChen and Zhang (2012) PLoS Comp. Biol. doi:10.1371/journal.pcbi.1002784
bDessimoz (2011) Brief. Bioinf. doi:10.1093/bib/bbr057
cAltenhoff and Dessimoz (2009) PLoS Comp. Biol. 5:e1000262 doi:10.1371/journal.pcbi.1000262
Formalisation of the idea of corresponding genes in differentorganisms.Orthologues serve two purposes:
• Evolutionary equivalence
• Functional equivalence (“The Ortholog Conjecture”)
Applications in comparative genomics, functional genomics andphylogenetics.Over 30 databases attempt to describe orthologous relationships(http://questfororthologs.org/orthology databases)
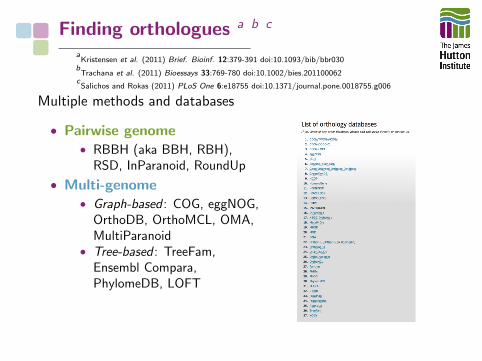
Finding orthologues a b c
aKristensen et al. (2011) Brief. Bioinf. 12:379-391 doi:10.1093/bib/bbr030
bTrachana et al. (2011) Bioessays 33:769-780 doi:10.1002/bies.201100062
cSalichos and Rokas (2011) PLoS One 6:e18755 doi:10.1371/journal.pone.0018755.g006
Multiple methods and databases
• Pairwise genome• RBBH (aka BBH, RBH),
RSD, InParanoid, RoundUp
• Multi-genome• Graph-based : COG, eggNOG,
OrthoDB, OrthoMCL, OMA,MultiParanoid
• Tree-based : TreeFam,Ensembl Compara,PhylomeDB, LOFT
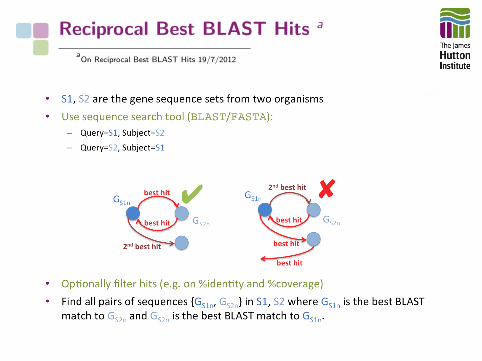
Reciprocal Best BLAST Hits a
aOn Reciprocal Best BLAST Hits 19/7/2012
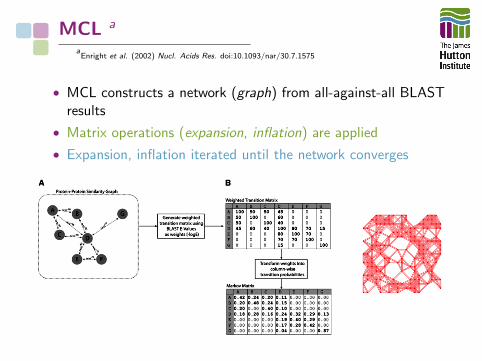
MCL a
aEnright et al. (2002) Nucl. Acids Res. doi:10.1093/nar/30.7.1575
• MCL constructs a network (graph) from all-against-all BLASTresults
• Matrix operations (expansion, inflation) are applied
• Expansion, inflation iterated until the network converges
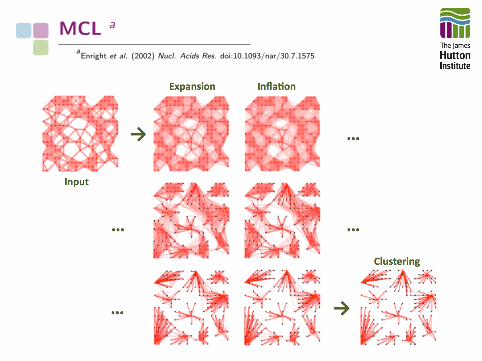
MCL a
aEnright et al. (2002) Nucl. Acids Res. doi:10.1093/nar/30.7.1575
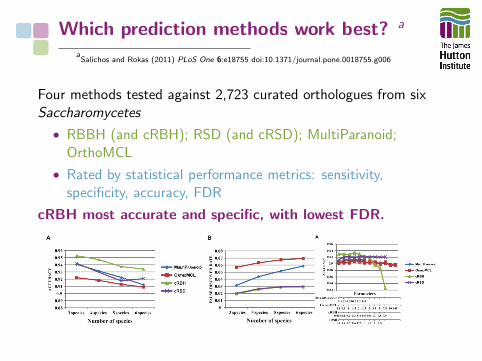
Which prediction methods work best? a
aSalichos and Rokas (2011) PLoS One 6:e18755 doi:10.1371/journal.pone.0018755.g006
Four methods tested against 2,723 curated orthologues from sixSaccharomycetes
• RBBH (and cRBH); RSD (and cRSD); MultiParanoid;OrthoMCL
• Rated by statistical performance metrics: sensitivity,specificity, accuracy, FDR
cRBH most accurate and specific, with lowest FDR.
Which prediction methods work best? a
b
aWolf and Koonin (2012) Genome Biol. Evol. 4:1286-1294 doi:10.1093/gbe/evs100
bAltenhoff and Dessimoz (2009) PLoS Comp. Biol. 5:e1000262 doi:10.1371/journal.pcbi.1000262
• Performance varies by choice of method, and interpretation of“orthology”
• Biggest influence is genome annotation quality
• Relative performance varies with choice of benchmark
• (clustering) RBH outperforms more complex algorithmsunder many circumstances
How orthologues help
Defining core groups of genes as “orthologues” allows analysis ofgroups of genes by:
• synteny/collocation
• gene neighbourhood changes (e.g. genome expansion)
• pan genome (core/accessory genomes)
and of individual genes within those groups, by:
• multiple alignment
• domain detection
• identification of functional sites
• inference of directional selection (stabilising/positive selection)
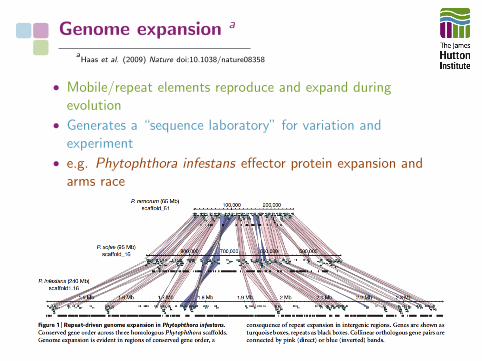
Genome expansion a
aHaas et al. (2009) Nature doi:10.1038/nature08358
• Mobile/repeat elements reproduce and expand duringevolution
• Generates a “sequence laboratory” for variation andexperiment
• e.g. Phytophthora infestans effector protein expansion andarms race
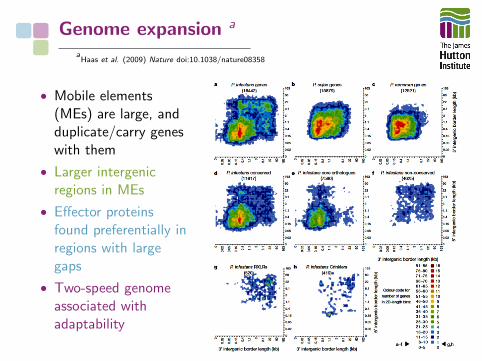
Genome expansion a
aHaas et al. (2009) Nature doi:10.1038/nature08358
• Mobile elements(MEs) are large, andduplicate/carry geneswith them
• Larger intergenicregions in MEs
• Effector proteinsfound preferentially inregions with largegaps
• Two-speed genomeassociated withadaptability
The Pangenome
The Core Genome Hypothesis:“The core genome is the primary cohesiveunit defining a bacterial species”
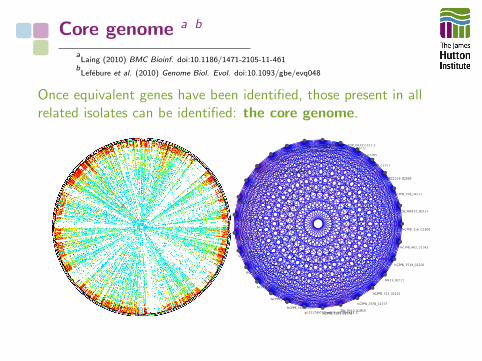
Core genome a b
aLaing (2010) BMC Bioinf. doi:10.1186/1471-2105-11-461
bLefebure et al. (2010) Genome Biol. Evol. doi:10.1093/gbe/evq048
Once equivalent genes have been identified, those present in allrelated isolates can be identified: the core genome.
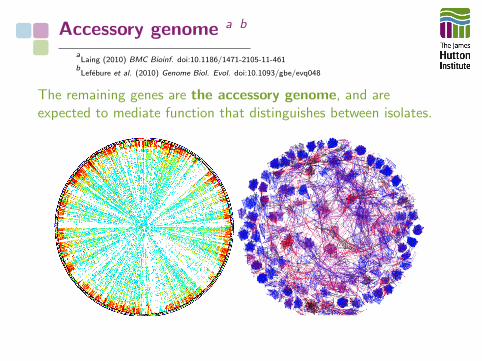
Accessory genome a b
aLaing (2010) BMC Bioinf. doi:10.1186/1471-2105-11-461
bLefebure et al. (2010) Genome Biol. Evol. doi:10.1093/gbe/evq048
The remaining genes are the accessory genome, and areexpected to mediate function that distinguishes between isolates.
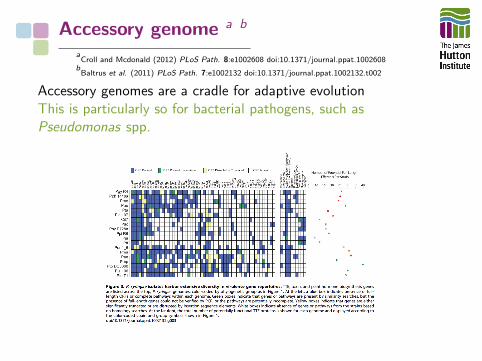
Accessory genome a b
aCroll and Mcdonald (2012) PLoS Path. 8:e1002608 doi:10.1371/journal.ppat.1002608
bBaltrus et al. (2011) PLoS Path. 7:e1002132 doi:10.1371/journal.ppat.1002132.t002
Accessory genomes are a cradle for adaptive evolutionThis is particularly so for bacterial pathogens, such asPseudomonas spp.
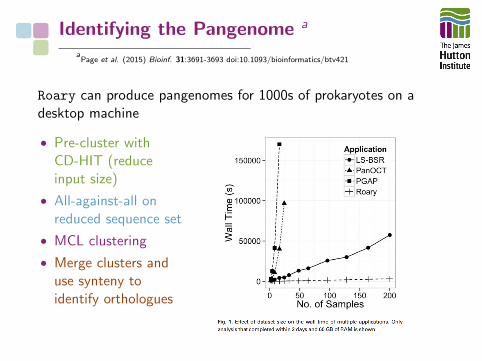
Identifying the Pangenome a
aPage et al. (2015) Bioinf. 31:3691-3693 doi:10.1093/bioinformatics/btv421
Roary can produce pangenomes for 1000s of prokaryotes on adesktop machine
• Pre-cluster withCD-HIT (reduceinput size)
• All-against-all onreduced sequence set
• MCL clustering
• Merge clusters anduse synteny toidentify orthologues
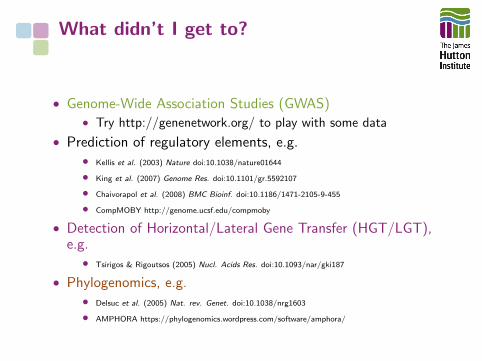
What didn’t I get to?
• Genome-Wide Association Studies (GWAS)• Try http://genenetwork.org/ to play with some data
• Prediction of regulatory elements, e.g.• Kellis et al. (2003) Nature doi:10.1038/nature01644
• King et al. (2007) Genome Res. doi:10.1101/gr.5592107
• Chaivorapol et al. (2008) BMC Bioinf. doi:10.1186/1471-2105-9-455
• CompMOBY http://genome.ucsf.edu/compmoby
• Detection of Horizontal/Lateral Gene Transfer (HGT/LGT),e.g.
• Tsirigos & Rigoutsos (2005) Nucl. Acids Res. doi:10.1093/nar/gki187
• Phylogenomics, e.g.• Delsuc et al. (2005) Nat. rev. Genet. doi:10.1038/nrg1603
• AMPHORA https://phylogenomics.wordpress.com/software/amphora/
Messages to take away
• Comparative genomics is a powerful set of techniques for:• Understanding and identifying evolutionary processes and
mechanisms• Reconstructing detailed evolutionary history• Identifying and understanding common genomic features• Providing hypotheses about gene function for experimental
investigation
Messages to take away
• Comparative genomics is comparisons• What is similar between two genomes?• What is different between two genomes?
• Comparative genomics is evolutionary genomics• Lots of scope for improvement in tools
• Tools that ‘do the same thing’ can give different output• BLAST vs MUMmer• RBBH vs MCL• The choice of application matters for correctness and
interpretation
Licence: CC-BY-SA
By: Leighton Pritchard
This presentation is licensed under the Creative CommonsAttribution ShareAlike licensehttps://creativecommons.org/licenses/by-sa/4.0/