Comparative fluctuating asymmetry of spotted barb (Puntius ...
20
Computational Ecology and Software, 2017, 7(1): 8-27 IAEES www.iaees.org Article Comparative fluctuating asymmetry of spotted barb (Puntius binotatus) sampled from the Rivers of Wawa and Tubay, Mindanao, Philippines C.C. Cabuga Jr. 0,1 , R.R.Q. Apostado 0,1 , J.J.Z. Abelada 0,1 , L.B. Calagui 1 , C.J. R. Presilda 1 , M.K.A. Angco 1 , J.L. Bual 1 , J. E. O. Lador 1 , J.H. Jumawan 1 , J.C. Jumawan 1 , H.C. Havana 2 , E.A. Requieron 3 , M.A.J. Torres 4 0 Graduate School, Caraga State University-Main Campus-Ampayon, Butuan City 8600, Philippines 1 Biology Department, College of Arts and Sciences, Caraga State University- Main Campus-Ampayon, Butuan City 8600, Philippines 2 Cagbas Elementary School, Bayugan City, Agusan Del Sur, 8502, Philippines 3 Science Department, College of Natural Sciences and Mathematics, Mindanao States University – General Santos City Campus, 9500 Fatima, General Santos City, Philippines 4 Department of Biological Sciences, College of Science and Mathematics, Mindanao State University - Iligan Institute of Technology, Iligan City, Philippines E-mail: [email protected] Received 10 October 2016; Accepted 18 November 2016; Published 1 March 2017 Abstract Fluctuating Asymmetry (FA) commonly uses to evaluate environmental stress and developmental variability of different biotic elements. This study aims to describe the possible effects of pollutants on the body shapes of spotted barb (Puntius binotatus) with notes of physico-chemical parameters of Wawa River, Bayugan City, Agusan del Sur and Tubay River, Tubay, Agusan del Norte, Philippines. There were a total of 80 samples (40 females & 40 males) collected from each sampling areas. Digital imaging was prepared and the acquired images were loaded into tpsDig2 program. Standard landmarks on fish morphometric were employed. Using thin-plate spline (TPS) series, landmark analysis were completed and subjected to symmetry and asymmetry in geometric data (SAGE) software. Results in Procrustes ANOVA showed high significant differences of (P<0.0001) in the three factors analyzed: the individuals; sides; and the interaction of individuals and sides; indicating high fluctuating asymmetry. In Tubay River, the level of asymmetry in females were 79.06% and in males 71.69% while in Wawa River, the level of asymmetry in females were 76.60% and in males 62.64%. Therefore, indicating high level of asymmetry denotes environmental alterations. On the other hand, physico- chemical parameters were also determined in the two sampling areas. The results of One-way ANOVA showed that the mean parameters in Wawa River has significant difference of (P<0.0001), while Tubay River has no significant difference. Results of Pearson-correlation of fluctuating asymmetry between physico- chemical parameters shows no correlation which suggests that water components is not directly influenced by the fluctuating asymmetry. The approach of FA and physico-chemical parameters were significant for evaluating environmental condition as well as species state of well-being. Keywords fluctuating asymmetry; physico-chemical; spotted barb; Puntius binotatus; Wawa River; Tubay River. Computational Ecology and Software ISSN 2220721X URL: http://www.iaees.org/publications/journals/ces/onlineversion.asp RSS: http://www.iaees.org/publications/journals/ces/rss.xml Email: [email protected] EditorinChief: WenJun Zhang Publisher: International Academy of Ecology and Environmental Sciences
Transcript of Comparative fluctuating asymmetry of spotted barb (Puntius ...
Computational Ecology and Software, 2017, 7(1): 8-27
IAEES www.iaees.org
Article
Comparative fluctuating asymmetry of spotted barb (Puntius binotatus)
sampled from the Rivers of Wawa and Tubay, Mindanao, Philippines C.C. Cabuga Jr.0,1, R.R.Q. Apostado0,1, J.J.Z. Abelada0,1, L.B. Calagui1, C.J. R. Presilda1, M.K.A. Angco1, J.L. Bual1, J. E. O. Lador1, J.H. Jumawan1, J.C. Jumawan1, H.C. Havana2, E.A. Requieron3, M.A.J. Torres4 0Graduate School, Caraga State University-Main Campus-Ampayon, Butuan City 8600, Philippines 1Biology Department, College of Arts and Sciences, Caraga State University- Main Campus-Ampayon, Butuan City 8600,
Philippines 2Cagbas Elementary School, Bayugan City, Agusan Del Sur, 8502, Philippines
3Science Department, College of Natural Sciences and Mathematics, Mindanao States University – General Santos City Campus,
9500 Fatima, General Santos City, Philippines 4Department of Biological Sciences, College of Science and Mathematics, Mindanao State University - Iligan Institute of
Technology, Iligan City, Philippines
E-mail: [email protected]
Received 10 October 2016; Accepted 18 November 2016; Published 1 March 2017
Abstract Fluctuating Asymmetry (FA) commonly uses to evaluate environmental stress and developmental variability of different biotic elements. This study aims to describe the possible effects of pollutants on the body shapes of spotted barb (Puntius binotatus) with notes of physico-chemical parameters of Wawa River, Bayugan City, Agusan del Sur and Tubay River, Tubay, Agusan del Norte, Philippines. There were a total of 80 samples (40 females & 40 males) collected from each sampling areas. Digital imaging was prepared and the acquired images were loaded into tpsDig2 program. Standard landmarks on fish morphometric were employed. Using thin-plate spline (TPS) series, landmark analysis were completed and subjected to symmetry and asymmetry in geometric data (SAGE) software. Results in Procrustes ANOVA showed high significant differences of (P<0.0001) in the three factors analyzed: the individuals; sides; and the interaction of individuals and sides; indicating high fluctuating asymmetry. In Tubay River, the level of asymmetry in females were 79.06% and in males 71.69% while in Wawa River, the level of asymmetry in females were 76.60% and in males 62.64%. Therefore, indicating high level of asymmetry denotes environmental alterations. On the other hand, physico-chemical parameters were also determined in the two sampling areas. The results of One-way ANOVA showed that the mean parameters in Wawa River has significant difference of (P<0.0001), while Tubay River has no significant difference. Results of Pearson-correlation of fluctuating asymmetry between physico-chemical parameters shows no correlation which suggests that water components is not directly influenced by the fluctuating asymmetry. The approach of FA and physico-chemical parameters were significant for evaluating environmental condition as well as species state of well-being. Keywords fluctuating asymmetry; physico-chemical; spotted barb; Puntius binotatus; Wawa River; Tubay River.
Computational Ecology and Software ISSN 2220721X URL: http://www.iaees.org/publications/journals/ces/onlineversion.asp RSS: http://www.iaees.org/publications/journals/ces/rss.xml Email: [email protected] EditorinChief: WenJun Zhang Publisher: International Academy of Ecology and Environmental Sciences

Computational Ecology and Software, 2017, 7(1): 8-27
IAEES www.iaees.org
1 Introduction
The shape and shape change has been a fundamental prerequisite to biological anthropology at the same time
detecting shapes and copying metric observations is a challenge to distinguish the manner in which biological
forms diverse from one another (Richtsmeier et al., 2002).
Fish was highly recognized as an environmental biomarker for different types of the stressor. It has been
used for several scientific investigations as it provides reliable evidence of occurring pollutants. Indeed, fish
serve as useful genetic models for the evaluation of pollution in the aquatic ecosystem (Mitchell and Kennedy,
1992). Along its presence, it also works as the reliable bio-indicator from many effluents and plays important
role for bio-monitoring. Pollution coming from anthropogenic activities, agricultural runoff and disposing of a
huge amount of waste into the aquatic ecosystem can be detrimental to the environment (Natividad et al.,
2015). Hence, it may cause impairment and later affects the quality and quantity of the organisms (Duruibe et
al., 2007). Thus, unbalanced state of environment merely affects the total morphology of the organisms and
likely disturbed its overall symmetry (Daloso, 2014). Freshwater ecosystem plays an important role for
biodiversity and as of today, it has been considered the most affected from various pollution. As well as, this
type of ecosystem underneath threat and may pose a risk to the organisms. Moreover, it has been top of the list
to be endangered (Jumawan et al., 2016).
Fluctuating Asymmetry (FA) was employed to evaluate the flux of pollutants in the aquatic environment
and its effects on the organism. This mechanism provides the dependable result as it repeatedly used by
numerous studies around the world. FA said to be an excellent means for determining environmental health
(Lecera et al., 2015). It is also an effective type of approach and less expensive in evaluating the condition of
the environment and the organisms (Angtuaco and Leyesa, 2004). Fluctuating Asymmetry or FA extensively
used as a potential indicator for describing developmental instability (Ducos and Tabugo, 2015). The
procedure of using geometric morphometrics in outlining feature FA has been recognized in several studies
(Klingenberg and McIntyre, 1998; Savriama et al., 2012; Hermita et al., 2013). On the other hand, FA plays an
important mechanism for distinguishing morphological similarity and differences (David Polly, 2012). As well
as, FA is known to be a marker of the well-being both of the environment and organisms as it discloses
morphological dissimilarities (Swaddle, 2003). It is also a significant instrument in the field of biology as it
reveals a population’s state of adaptation and co-adaptation (Jumawan et al., 2016). Furthermore, fluctuating
asymmetry identified to be an efficient tool for giving a vital information over another biomarker of
developmental variability (Clarke, 1993).
The sampling areas might experiencing environmental disturbances that could affect its health condition
as well as the inhabitants. The Wawa River situated were constant soil erosion occur along its riverbanks that
causes siltation, immediate changes of the water level and also it undertaken several anthropogenic activities
while Tubay River became a primary recipient of chemical effluents coming from households and the mining
activities. These scenarios might be a reason that these rivers would be unsuitable for the many fish species
and likely affects its morphological feature. Alongside, physico-chemical parameters were also determined in
the study to further analyze its water components. The species of spotted barb (P. binotatus) were subjected to
investigation as it is readily available and commonly found in the two sampling areas. Indeed, P. binotatus has
been used as an essential bio-marker to environmental stress or the health condition of the aquatic habitat
(Baumgartner, 2005; Mat Isa et al., 2010; Zakeyudin et al., 2012). Hence, it is important to apply scientific
methods as it helps to explain the state of well-being both of the environment and the organisms. This study
aims to identify the possible effects of pollutants on the morphology of P. binotatus and to evaluate the
condition of the two rivers using physico-chemical parameters. Thus, the outcome of this study would be
significant due to on-going developments in the areas and may further aggravate the rivers condition.
9

Computational Ecology and Software, 2017, 7(1): 8-27
IAEES www.iaees.org
2 Materials and Methods
2.1 Study area
This study was conducted in the two sampling areas: Wawa River, Bayugan City, Agusan del Sur and Tubay
River, Tubay, Agusan del Norte, Philippines. The fish collection was done in the month of August and
September 2016.
Fig. 1 Map showing A. Philippines B. Tubay River, Tubay Agusan del Norte. C. Wawa River, Bayugan City, Agusan del
Sur, Philippines.
2.2 Fluctuating asymmetry of spotted barb (Puntius binotatus)
2.2.1 Sample processing
Eighty samples of P. binotatus (40 males and 40 females) were collected in each sampling areas. The fish
samples was then placed in a flat Styrofoam for the pinning of its fins to make it wider and to visibly see the
samples point of origin for the land-marking procedures. A 10% Formalin was applied in all the fins of the
sampled fish to make it hardened with the aid of small brush. Digital imaging was done with Canon digital
camera (Pixma, 14 megapixels). To acquire the length of individuals, the left and right lateral side of each
sample was taken using a ruler (Natividad et al., 2015).
10

Computational Ecology and Software, 2017, 7(1): 8-27
IAEES www.iaees.org
2.2.2 Sex Determination
Sex identification of the samples was done through its genitalia. The presence of eggs and ovaries in general
yellow or orange with granular texture were females while the presence of testes which were normally non-
granular in texture, whitish and smooth were males (Requiron et al 2010).
2.2.3 Landmark selection and digitization
Images captured were then sorted with accordance to its sex and converted into TPS file format using tpsUtil.
Land-marking of samples was done using tpsDig2 (version 2, Rohlf 2004). A total of sixteen anatomical
landmark points (Table 1) were used to digitize the symmetrical body shape of the samples (Fig. 2).
Table 1 Description of the landmark points adapted from Paña et al. (2015).
Coordinates Locations
1 Snout tip
2 Posterior end of nuchal spine
3 Anterior insertion of dorsal fin
4
5
Posterior insertion of dorsal fin
Dorsal insertion of caudal fin
6 Midpoint or lateral line
7 Ventral insertion of caudal fin
8 Posterior insertion of anal fin
9 Anterior insertion of anal fin
10 Dorsal base of pelvic fin
11 Ventral end of lower jaw articulation
12 Posterior end of the premaxilla
13 Anterior margin through midline of orbit
14 Posterior margin through midline of orbit
15 Dorsal end of operculum
16 Dorsal base of pectoral fin
Fig. 2 Landmark points of P. binotatus (top) female (bottom) male.
11

Computational Ecology and Software, 2017, 7(1): 8-27
IAEES www.iaees.org
2.2.4 Shape analysis
The digitation for Left-Right of the fish samples undergone tri-replicated images through tpsDig2. The
coordinate data was then subjected to (SAGE) Symmetry and Asymmetry in Geometric Data (version 1.04
Marquez, 2007) software (Fig. 3) and also to obtain the principal components of individual symmetry which
denotes by deformation grid (Natividad et al 2015). Procrustes ANOVA test was performed to determine the
significant difference in the symmetry of the three factors considered – individual, sides and interaction of
individuals and side. The significance level was confirmed at P<0.0001. The differences among the side and
the measure of directional asymmetry also specifies. The percentage (%) of FA were acquired and compared
between the sexes (Natividad et al., 2015).
2.2.5 Physico-chemical parameters
The water parameters that comprises temperature, total dissolve solids (TDS), conductivity, pH, Dissolve
Oxygen (DO) and salinity, were evaluated with the same date mentioned above during the fish collection. In
each sampling areas three sites was established along with three replicates and randomly selected for the
measurements. This was done using the multi-parameter water quality meter (EUTECH PCD). Data was
presented as mean ± standard error mean (SEM) and was calculated using Paleontological Statistics and
Software (PAST).One-way Analysis of Variance (ANOVA) was also used for testing the significant difference
of physico-chemical parameters between the sampling areas.
2.2.6 Correlation of fluctuating asymmetry and physico-chemical parameters.
The correlation between fluctuating asymmetry and water parameters were also determined. Using the mean
values of physico-chemical and the percentage of fluctuating asymmetry was subjected to analysis. Pearson
correlation coefficient was used to analyze the relationship between fluctuating asymmetry and water
parameters. All data were analyzed using Graph Pad Prism 5.
3 Results and Discussion
3.1 Fluctuating Asymmetry
To describe the individual shape fluctuations Procrustes ANOVA was used. The comparison of individual
symmetry of Left-Right shape and size was analyzed (Tables 2a & 2b). Three factors were analyzed: the
Fig. 3 Overview of the schematic flow of shape analysis using SAGE.
12

Computational Ecology and Software, 2017, 7(1): 8-27
IAEES www.iaees.org
individuals; sides; and the interaction of individuals and sides. Both sexes (male and female) of the fish
samples was applied for the analysis. The results indicated fluctuating asymmetry along the three factors and
between the female and male (P<0.0001). It was observed that highly significant difference occurs in the
individual fish resulting fluctuating asymmetry when one of the fish samples compared into another. Its sides
also showed highly significant variance signifying fluctuating asymmetry in its left and right sides of the
samples. In general, the relation among the individuals and sides also exhibited highly significant difference
which suggested fluctuating asymmetry influenced amongst the interaction of individuals and sides. Thus,
fluctuating asymmetry of all the factors was detected in both female and male fishes.
The data illustrated that the samples of P. binotatus collected along the two sampling areas were
experienced asymmetrical in the aspects of comparison as an individual, both of the left and right side
morphology, and the interaction of its individuals and sides. It was also observed that when female and male
combined the results suggest asymmetry within its factors (individuals, sides and individual and sides). Since,
asymmetry in the morphology of the female and male fish samples were observed, it might be a sign that
fishes in the two sampling areas underneath environmental disturbances. Under normal situation, symmetrical
in its morphology could be manifested. Nonetheless, seeing fluctuating asymmetry would be an indication that
the existence of pollutants within its habitat affects its morphology. The continuity of the fishes in the polluted
and disturbed environment causes asymmetry. By this, P. binotatus will also undergone asymmetrical in
appearance when extended exposure to effluents in the sampling areas. ). In addition, organisms that give high
FA parallels with the stressors present in the environment (Hermita et al., 2013).
Table 2a Procrustes ANOVA on body shape of P. binotatus in terms of sexes from Wawa River, Bayugan City, Agusan del Sur,
Philippines.
Factors SS DF MS F P-VALUE
Female
Individuals 0.1299 1092 0.0001 2.7808 0.0001**
Sides 0.034 28 0.0012 28.4209 0.0001**
Individual x Sides 0.0467 1092 0 7.1498 0.0001**
Measurement Error 0.0268 4480 0 -- --
Male
Individuals 0.1763 10922 0.0002 5.0868 0.0001**
Sides 0.0466 28 0.0017 52.4557 0.0001**
Individual x Sides 0.347 1092 0 3.6106 0.0001**
Measurement Error 0.0394 4480 0 -- --
** (P<0.0001) highly significant.
The data shows the indication for FA of the fishes that can be accredited to a stressed environment
probably from different types of aquatic pollutants. As a result, the ecosystem that is polluted will eventually
cause morphological variation as these effluents interfere during its growth and development (Bonada and
Williams, 2002). Therefore, displaying asymmetry is a sign that species is incompetent to counteract and
shield from any environmental disorders (Van Valen, 1962). Hence, the developmental variability of P.
binotatus will lead to fluctuating asymmetry.
13

Computational Ecology and Software, 2017, 7(1): 8-27
IAEES www.iaees.org
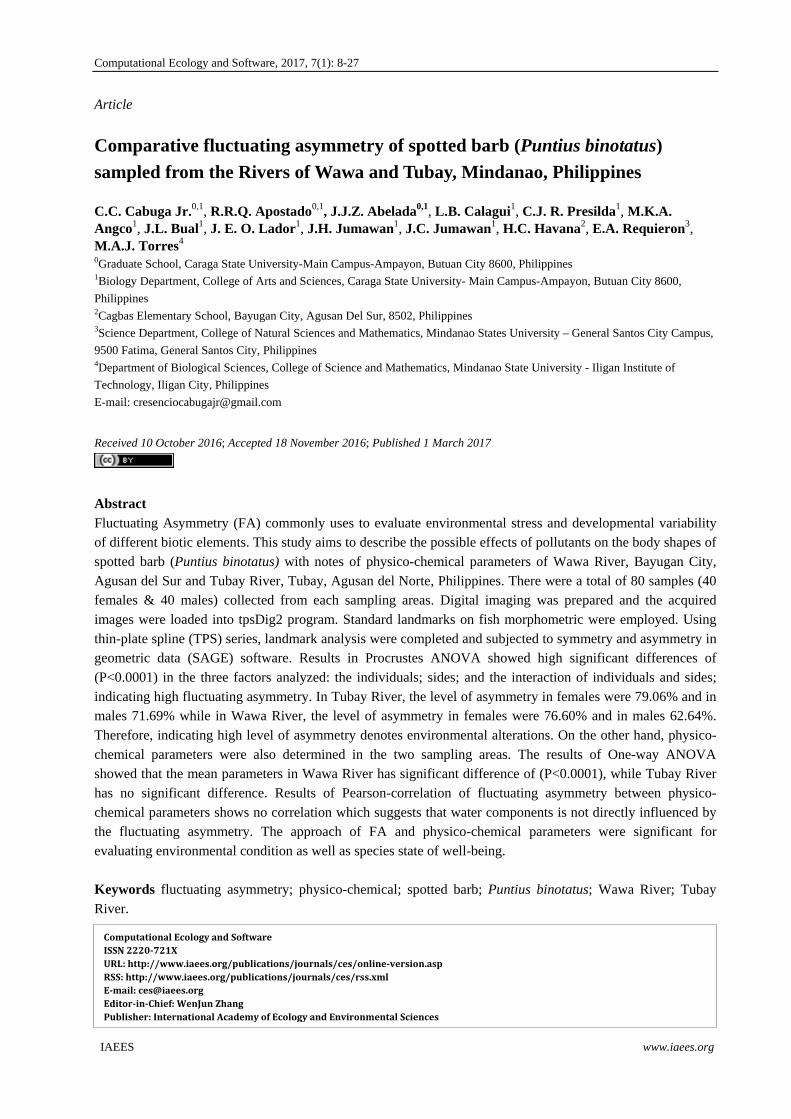
Principal component analysis (PCA) was applied in order to define the affected landmarks using the
symmetry and asymmetry scores. There were four principal components (PC) considered in female and male
samples. The four highest PC scores determined landmarks which were frequently affected in fluctuating
asymmetry of the samples (Tables 3a & 3b). Skewness of the histogram was reflected in every PC score
alongside with the deformation grid to determine affected landmarks (Figs 4a, 4b and 5a, 5b).
In the female samples from Wawa River, has four principal components (PC) constituted 81.76% of the
cumulative variation while female samples from Tubay River, has 80.34% of the five principal components.
PC 1 from Wawa River has the highest variation accounted to 41.26% while in Tubay River has 44.36%. The
commonly affected landmarks in female samples to the four PC score from Wawa River were landmarks 3, 4,
6, 8, and 10 while the affected landmark common to the five PC score from Tubay River were: 3, 4, 9 and 16
(Tables 3a and 3b).These were portion of the anterior and posterior insertion of dorsal fin, midpoint or lateral
line, posterior and anterior insertion of anal fin, dorsal base of pelvic and pectoral fin. In male samples from
Wawa River, the four PC constituted to 87.31% of the cumulative variation while males from Tubay River has
76.72%. PC 1 from Wawa River contributed the highest variation with 52% while from Tubay River
accounted to 46.46%. The commonly affected landmarks in male samples to the four PC score from Wawa
River were landmarks 1, 3, 4, 5, 7, 8 9, 10, 11, 12, and 16 while the affected landmarks from Tubay River were:
3, 4 9, 10 and 16 (Tables 3a and 3b). These landmarks were mainly of the snout tip, anterior and posterior
insertion of dorsal pin, dorsal and ventral insertion of caudal fin, posterior and anterior insertion of anal fin,
dorsal base of pelvic and pectoral fin, ventral end of lower jaw articulation, and posterior end of the premaxilla.
Table 2b Procrustes ANOVA on body shape of P. binotatus in terms of sexes from Tubay River, Tubay, Agusan del Norte,
Philippines.
Factors SS DF MS F P-VALUE
Female
Individuals 0.1802 1092 0.0002 2.23 0.0001**
Sides 0.0454 28 0.0016 21.894 0.0001**
Individual x Sides 0.0808 1092 0.0001 3.4156 0.0001**
Measurement Error 0.0971 4480 0 -- --
Male
Individuals 0.3041 1092 0.0003 3.9827 0.0001**
Sides 0.0321 28 0.0011 16.4117 0.0001**
Individual x Sides 0.764 1092 0.0001 4.5469 0.0001**
Measurement Error 0.0689 4480 0 -- --
It was detected that female samples from Tubay River has the highest PC compared to Wawa River while
male samples from Wawa River has the highest PC compared to Tubay River (Tables 3a and 3b). On the other
hand, the highest percentage of FA recorded from Tubay River compared to Wawa River. It might because
samples from Tubay River were already affected by various aquatic pollutants since the river situated were
runoff of effluents coming from households and considerably from mining industries. The presence of these
aquatic pollutants will likely affect fish morphology. Such, females in particular were vulnerable for
14

Computational Ecology and Software, 2017, 7(1): 8-27
IAEES www.iaees.org
fluctuations as they were adaptive for environmental modifications. Indeed, study shows that females were
competent to buffer ecological modifications; thus keeping its homeostasis and metabolic frequency for
reproduction (Cabuga et al., 2016). It was also identified that affected landmarks were almost similar and these
were further shown in deformation grid and histogram of the values revealed skewness proposing asymmetry
in body form (Figs 4a, 4b & 5a, 5b).
Table 3a Principal component scores showing the values of symmetry and asymmetry scores with the summary of the affected
landmarks from Wawa River, Bayugan City, Agusan del Sur, Philippines.
PCA Individual
(Symmetry)
Sides
(Directional
asymmetry)
Interaction
(Fluctuating
asymmetry)
Affected
landmarks
Female
PC1 41.2644% 100% 47.8175% 1,3,4,5,6,7,8,9,10,11,12,14,16
PC2 20.9153% 13.6766% 8,10
PC3 10.3516% 9.801% 2,3,4,5,6,8,10
PC4 9.2301% 5.3071% 2,3,4,6,7,9,11,12,13,14
81.7614% 76.6022%
Male
PC1 51.996%
17.757%
100% 25.2923%
16.6716%
1,2,4,5,6,7,8,9,10,11,12,13,16
PC2 1,3,4,5,7,8,9,10,11,12,
13,14,16
PC3 11.4987% 11.3548% 3,4,6,7,8,9,10,15,16
PC4 6.0557% 9.3235% 3,4,5,11,14
87.3074% 62.6422%
Table 3b Principal component scores showing the values of symmetry and asymmetry scores with the summary of the affected
landmarks from Tubay River, Tubay, Agusan del Norte, Philippines.
PCA Individual
(Symmetry)
Sides
(Directional
asymmetry)
Interaction
(Fluctuating
asymmetry)
Affected
landmarks
Female
PC1 44.3632% 100% 53.8937% 1,2,3,4,5,6,7,8,9,10,11,12,13,16
PC2 12.8096% 10.0211% 3,4,5,8,9,10
PC3 10.0718% 6.0222% 4,10,16
PC4 7.8632% 4.6034% 1,3,4,5,6,7,8,9,11,12,15,16
PC5 5.2307% 4.5155% 1,2,3,4,9,12,15,16
80.3385% 79.0559%
Male
PC1 46.4605%
13.7935%
9.4761%
6.987%
100% 48.3352%
11.7068%
6.3728%
5.2805%
1,2,3,4,5,6,9,10,11,12,13,16
PC2
PC3
PC4
1,2,3,4,5,6,7,8,9,10,11,12,1,3,14,
15,16
4,7,9,10,16
3,4,8,9,10
76.7171% 71.6953%
15
Computational Ecology and Software, 2017, 7(1): 8-27
IAEES www.iaees.org
Fig. 4a Principal Component (PC) implied deformation grid and histogram of individual (symmetric) of female P. binotatus
collected from Wawa River, Bayugan City, Agusan del Sur, Philippines.
16

Computational Ecology and Software, 2017, 7(1): 8-27
IAEES www.iaees.org
Fig. 4b Principal Component (PC) implied deformation grid and histogram of individual (symmetric) of male P. binotatus
collected from Wawa River, Bayugan City, Agusan del Sur, Philippines.
17

Computational Ecology and Software, 2017, 7(1): 8-27
IAEES www.iaees.org
Fig. 5a Principal Component (PC) implied deformation grid and histogram of individual (symmetric) of female P. binotatus
collected from Tubay River, Tubay, Agusan del Norte, Philippines.
The present study identifies the high fluctuating asymmetry among the samples of P. binotatus and might
the current status of the sampling areas influences its asymmetry. Study shows that greater fluctuating
asymmetry is the outcome of the species towards environmental situation (Ducos and Tubago, 2015).
Differences in the percentage of FA may be attributed to the ability of the traits to buffer developmental
alterations (Graham et al., 1993; Lens et al., 2002). Therefore, environmental condition takes part for the
overall condition of the species and may enhance its fitness to resist alterations.
18

Computational Ecology and Software, 2017, 7(1): 8-27
IAEES www.iaees.org
Fig. 5b Principal Component (PC) implied deformation grid and histogram of individual (symmetric) of male P. binotatus
collected from Tubay River, Tubay, Agusan del Norte, Philippines..
19

Computational Ecology and Software, 2017, 7(1): 8-27
IAEES www.iaees.org
Fig. 6a Actualized picture of digitized female and male P. binotatus collected from Wawa River with affected landmarks shown
in PCA-deformation grid for PC1 and PC2.
20

Computational Ecology and Software, 2017, 7(1): 8-27
IAEES www.iaees.org
Fig. 6b Actualized picture of digitized female and male P. binotatus collected from Tubay River with affected landmarks shown
PCA-deformation grid for PC1 and PC2.
3.2 Physico-chemical parameters
The determination of different water parameters were also determined and shown in Table 4. The mean values
of water physico-chemical parameters in two sampling areas presented in the Tables 5a & 5b. The obtained
values were compared to the standards recommended by the Water Watch Australia National Technical
Manual 2002. Among the two rivers analyzed, Wawa River has the highest mean values for the following
parameters: temperature (32 ± 0.057), conductivity (291.32 ± 7.896), pH (8.27 ± 0.145), Dissolve Oxygen (DO)
(4.811 ± 0.044) and Salinity (266.011 ± 6.389). While Total Dissolve Solids (TDS) has a mean value of
(434.633 ± 96.466) which is recorded from Tubay River (Fig. 8a).
The results of One-way ANOVA showed that the mean values in Wawa River has significant difference of
21

Computational Ecology and Software, 2017, 7(1): 8-27
IAEES www.iaees.org
(P<0.05) while Tubay River has no significant difference. Although, Wawa River recorded the highest mean
values it doesn’t exceeded to the water quality standards.
Table 4 Physico-chemical parameters and its particular method of analysis.
Table 5a Mean values of physico-chemical parameters from Wawa River, Bayugan City, ADS, Philippines.
Parameters
Standard
Water Watch
Australia
National
Technical
Manual
(2002)
Site 1
Mean ± SEM
Site 2
Mean ± SEM
Site 3
Mean ± SEM
Mean
Mean ± SEM
Temperature 30C risea 31.9 ± 0.058 32 ± 0 32.1 ± 0.379 32 ± 0.057*
TDS <1000mg/L 13.703 ± 0.012 12.856 ± 0.023 13.563 ± 0.379 13.37 ± 0.26*
Conductivity
pH
0-800 µS/cm 301.6 ± 1.510 275.8 ± 0.289 295.566 ± 0.775 291.32 ± 7.896*
6.5-8.5 8.33 ± 0 8.48 ± 0.006 7.99 ± 0.082 8.27 ± 0.145*
DO >5mg/L 4.767 ± 0.088 4.9 ± 0.058 4.767 ± 0.120 4.811 ± 0.044*
Salinity <5ppt 0.272 ± 0.000 0.253 ± 0.000 0.272 ± 0.000 0.266 ± 0.006*
*Significant (P<0.05)
Parameters Unit Method of Sample Volume
Analysis
Conductivity µS/cm Direct method Det. on site
(Electrode)
Temperature 0C Direct method Det. on site
(Electrode)
Total Dissolve
Solids (TDS)
mg/L Direct method Det. on site
(Electrode)
pH Range (0-14) Direct method
(Electrode)
Det. on site
Dissolve
Oxygen (DO)
mg/L Direct method Det. on site
(Electrode)
Salinity mg/L Direct method
(Electrode)
Det. on site
22

Computational Ecology and Software, 2017, 7(1): 8-27
IAEES www.iaees.org
Table 5b Mean values of physico-chemical parameters from Tubay River, Tubay, ADN, Philippines.
Parameters
Standard
Water Watch
Australia
National
Technical
Manual (2002)
Site 1
Mean ± SEM
Site 2
Mean ± SEM
Site 3
Mean ± SEM
Mean
Mean ± SEM
Temperature 30C risea 30.7 ± 0.058 29.7 ± 0.058 30.167 ± 0.524 30.189 ± 0.289
TDS <1000mg/L 242.433 ± 1.071 516.2 ± 4.557 545.267 ± 0.994 434.633 ± 96.466
Conductivity
pH
0-800 µS/cm 5.278 ± 0.057 11.857 ± 0.047 11.887 ± 0.024 9.674 ± 2.198
6.5-8.5 7.52 ± 0.084 7.437 ± 0.121 7.423 ± 0.003 7.46 ± 0.030
DO >5mg/L 4.567 ± 0.033 4.667 ± 0.088 4.5 ± 0.058 4.578 ± 0.048
Salinity <5ppt 0.005 ± 0.000 0.013 ± 0.000 0.013 ± 0.000 0.010 ± 0.002
According to Ajibade et al. (2008), water temperature likely depends on the water column, climatic &
topographic changes. Where, conductivity influenced by total dissolve solids & salinity; thus the higher the
conductivity, the higher the salts and electrical conductivity (EC) (Lawson, 2011). The pH constitutes the
acidity and basicity of aquatic environment consequently the lower the pH, likely will become acidic thus,
affecting the growth and diversity of the aquatic environment. Study shows that pH is utilized to determine the
alkalinity and basicity of a substance ranking the scale from 1.0-14.0 (US EPA, 1997).The Dissolve Oxygen
(DO), in water is very important for aquatic species. DO, likely affects the growth, survival, distribution,
behavior and physiology of all aquatic organisms (Solis, 1988 & Sharma et al, 2013). Indicating a very low
value of DO (<4 mg/L) is not appropriate for aquatic life; this may be attributed to microbial decomposition
from sewages (Pathak et al, 2012).The Total Dissolve Solids (TDS) is used to analyze the presence of organic
salts and organic substances in the water (Lawson, 2011). Moreover, TDS is also a way of indicating an array
of chemical effluents within the body of water (US EPA, 1997).
The conservation of strong aquatic ecosystem is determined on the physico-chemical components and the
biotic factors (Venkatesharaju et al., 2010). In addition, vegetated riparian zones also exhibits strong influence
into the chemical substances of nearby streams, lakes and rivers specifically in reducing the influx of various
nutrients coming from agricultural uplands (Dosskey, 2001, Hefting et al, 2005, Baker et al 2006). Indeed, the
assessment on its parameters is important as it gives indication on the current standing, productivity and
sustainability (Djukie et al., 1994). Therefore, richness and distribution of a biota is dependent to the physical
and chemical aspects of water body (Unanam and Akpan, 2006).
On the other hand, chemical effluents are major contributors of water pollutions that established in the
event of water movement from geological processes (Kataria et al., 2011). In addition, pesticides and fertilizers
are main factors to water contamination; anthropological activities, rocks weathering, soil leaching, and the
mining processing these are the many ways for affecting aquatic natural resources (Manjare et al 2010).
Furthermore, the pyhsico-chemical parameters assist the current condition of aquatic environment with respect
to the values obtained.
23

Computational Ecology and Software, 2017, 7(1): 8-27
IAEES www.iaees.org
3.3 Correlation between fluctuating asymmetry and physico-chemical parameters
Pearson-correlation revealed that fluctuating asymmetry and physico-chemical parameters shows negatively
correlated (Fig. 8b). Result indicates that Tubay River has a value of (r = -0.1963) while Wawa River has a
value of (r = -0.2862) this indicates that fish samples and the water components were not directly correlated.
Such, that water parameters were not the direct factor that initiates asymmetry in the morphology of P.
binotatus. Indeed, the mean values obtained from physico-chemical parameters were in the range recommend
by water quality standards. In contrast, the incidence of FA in P. binotatus might be due to its developmental,
metabolic and homeostatic processes. The mobility of the fishes is considerably a key mechanism to buffer
environmental variations. In addition, Ducos and Tabugo (2015) theorized that stressed environment together
with genomic aspects can build up FA, which denotes a potential weakening during developmental
homeostasis of the organisms.
Fig. 7a Comparison of physico-chemical mean values between two sampling areas
Fig. 7b Scatter plot showing the correlation of FA and Physico-chemical parameters (Right) Tubay River, Tubay,
Agusan del Norte, (Left) Wawa River, Bayugan City, Agusan del Sur, Philippines.
Per
cent
of
FA
24
Computational Ecology and Software, 2017, 7(1): 8-27
IAEES www.iaees.org
4 Conclusion
Fluctuating asymmetry was employed to P. binotatus collected from the two sampling areas in order to
identify the possible effects of aquatic pollutants in its morphology. Alongside. physico-chemical parameters
were also established to assess the water quality in the two rivers. Procrustes ANOVA shows high FA in
Tubay River compared to Wawa River. The results of One-way ANOVA showed that physico-chemical
parameters in Wawa River has significant difference of (P<0.05) while Tubay River has no significant
difference. Pearson-correlation revealed that fluctuating asymmetry and physico-chemical parameters shows
negatively correlated. This study identifies the importance of evaluating environmental condition as well as the
state of well-being of a species through fluctuating asymmetry and physico-chemical analysis.
Acknowledgement
The researchers would like to extend their gratitude to Responsible Mining Aquatic Biodiversity Project for
providing the instrument during the physico-chemical water analysis.
References
Ajibade WA, Ayodele IA, Agbede SA. 2008. Water quality parameters in the major rivers of Kainji Lake,
National Park, Nigeria. African Journal of Environmental Science and Technology, 2(7): 185-196
Angtuaco SP, Leyesa M. 2004. Fluctuating asymmetry: an early warning indicator of environmental stress.
Asian Journal of Biology Education, 2: 3-4
Bonada N, Williams DD. 2002 Exploration of utility of fluctuating asymmetry as an indicator of river
condition using larvae of caddisfly Hydropsychemorosa (Trichoptera: Hydropsychidae). Hydrobiologia,
481: 147-156
Baumgartner L. 2005. Fish in Irrigation Supply Offtakes- A Literature Review. NSW Department of Primary
Industries – Fisheries Research Report Series: 11, Department of Primary Industries, New South Wales,
Australia
Cabuga CC Jr, Masendo CBE, Hernando BJH, et al. 2016. Relative warp analysis in determining
morphological variation and sexual dimorphism between sexes of flathead goby (Glossogobius giuris).
Computational Ecology and Software, 6(3): 109-119
Clarke GM. 1993. Fluctuating asymmetry of invertebrate populations as a biological indicator of
environmental quality. Environmental Pollution, 82: 207-211
Daloso DM. 2014. The ecological context of bilateral symmetry of organ and organisms. Natural Science, 6(4):
184-190
David PP. 2012. Geometric Morphometrics. Biology and Anthropology University, Department of Ecology,
Indiana, USA
Djukie N, Maletin S, Pujin V, Ivane A, Milajonovie B. 1994. Ecological assessment of water quality of Tizse
by physico-chemical and biological parameters. Tisca Szeged, 281(1): 37-40
Dorado E, Torres MA, Demayo C. 2012. Describing body shapes of the white goby, Glossogobius giuris of
Lake Buluan in Mindanao, Philippines using landmark-based geometric morphometric analysis.
International Research Journal of Biological Sciences, 1(7): 33-37
Ducos MB, Tabugo SRM. 2015. Fluctuating asymmetry as bioindicator of stress and developmental instability
in Gafrarium tumidum (ribbed venus clam) from coastal areas of Iligan Bay, Mindanao, Philippines.
AACL Bioflux, 8(3): 292-300
25

Computational Ecology and Software, 2017, 7(1): 8-27
IAEES www.iaees.org
Duruibe JO, Ogwuegbu MOC, Egwurugwu JN. 2007. Heavy metal pollution and human biotoxic effects.
International Journal of Physical Sciences, 2(5): 112-118
Hermita JM, Gorospe JG, Torres MAJ, Lumasag JL, Demayo CG. 2013..Fluctuating asymmetry in the body
shape of the mottled spinefoot fish, Siganus fuscescens (Houttuyn, 1782) collected from different bays in
Mindanao Island, Philippines. Science International (Lahore), 25(4): 857-861
Graham JH, Freeman DC, Emlem JM. 1993 Antisymmetry, directional symmetry and dynamic morphogenesis.
Genetica, 89: 121-173
Kataria HC, Gupta MK, Kushwaha S, Kashyap S, Trivedi S, Bhadoriya R, Bandewar NK. 2011. Study of
physico-chemical parameters of drinking water of Bhopal city with Reference to Health Impacts.
Current World Environment, 6(1): 95-99
Klingenberg CP, McIntyre GS. 1998. Geometric morphometrics of developmental instability: analysing
patterns of fluctuating asymmetry with Procrustes methods. Evolution, 52(5): 1363-1375
Lawsons EO. 2011. Physico-chemical parameters and heavy metal contents of water from the mangrove
swamps of Lagos Lagoon, Lagos, Nigeria. Advances in Biological Research, 5(1): 8-21
Lecera JMI, Pundung NAC, Banisil MA, et al. 2015. Fluctuating asymmetry analysis of trimac Amphilophus
trimaculatus as indicator of the current ecological health condition of Lake Sebu, South Cotabato,
Philippines. AACL Bioflux, 8(4): 507-516
Lens L, Van Dongen S, Kark S, Matthysen E. 2002. Fluctuating asymmetry as an indicator of fitness: can we
bridge the gap between studies. Biological Reviews of the Cambridge Philosophical Society, 77(1): 27-
38.
Manjare SA, Vhanalakar SA, Muley DV. 2010. Analysis of water quality using physico-chemical parameters
tamdalge tank in kolhapurdistrict, Maharashtra. International Journal of Advanced Biotechnology and
Research, 1(2): 115-119
Marquez E. 2007. Sage: Symmetry and Asymmetry in Geometric Data Version 1.05 (compiled 09/17/08).
http://www.personal.umich.edu/~emarquez/morph/
Mat Isa M, Md Rawi CS, Rosla R, Mohd Shah SA, Md Shah ASR., 2010. Length-weight relationships of
freshwater fish species in Kerian River Basin and Pedu Lake, Research Journal of Fisheries and
Hydrobiology, 5(1): 1-8
Mitchell S, Kennedy S. 1992. Tissue concentrations of organochlorine compounds in common seals from
the coast of Northern Ireland. Science of the Total Environment, 115: 235-240
Natividad EMC, Dalundong ARO, Ecot J, et al. 2015. Fluctuating asymmetry as bioindicator of ecological
condition in the body shapes of Glossogobius celebius from Lake Sebu, South Cotabato, Philippines.
AACL Bioflux, 8(3): 323-331
Paña, BH, Lasutan LG, Sabid J, Torres MAJ, Requiron EA. 2015. Using Geometric Morphometrics to study
the population structure of the silver perch, Leiopotherapon plumbeus, from Lake Sebu, South Cotabato,
Philippines. AACL Bioflux, 8(3): 352-361
Pathak H, Pathak D, Limaye SN. 2012. Studies on the physico-chemical status of two water bodies at Sagar
City under anthropogenic influences. Advances in Applied Science Research, 3(1): 31-44
Requieron E, Torres MAJ, Manting MME, Demayo CG. 2010. Relative warp analysis of body shape variation
in three congeneric species of ponyfishes (Teleostei: Perciformes: Leiognathidae). ICSCT, 2: 301-305
Richtsmeier JT, Deleon VB, Lele SR. 2002. The Promise of Geometric Morphometrics. Yearbook of Physical
Anthropology, 45: 63-91
Rohlf FJ. 2004. TpsDig Version 2.0. Department of Ecology and Evolution, State University of New York,
USA
26
Computational Ecology and Software, 2017, 7(1): 8-27
IAEES www.iaees.org
Savriama Y, Gomez JM, Perfectti F, Klingenberg CP. 2012. Geometric morphometrics of corolla shape:
dissecting components of symmetric and asymmetric variation in Erysimum mediohispanicum
(Brassicaceae). New Phytologist, 196: 945-954
Sharma AK, Sharma N, Sharma R. 2013. Study of Physico-chemical characteristics of water quality of
Yamuna River at Mathura, India. Bulletin of Environmental Pharmacology and Life Science, 2(10): 131-
134
Solis NB. 1988. Biology and Ecology of Penaeus monodon. In: Biology and Culture of Penaeus monodon
SEAFDEC. 3-36, Aqualculture Department, Tigbuan Iloilo, Philippines
Swaddle JP. 2003. Fluctuating asymmetry, animal behavior and evolution. Advances in the Study of Behavior,
32: 169-205
Unanam AE, Akpan AW. 2006. Analysis of physicochemical characteristics o some freshwater bodies in
Essien Udim Local Government area of Akwa Ibom State, Nigeria. In: Proceeding of the 21st Annual
Conference of the Fisheries Society of Nigeria (FI50N) Calabar. Nigeria
US EPA, 1997. Office of Water, 4503 FEPA-841-B-97-003. USA
Venkatesharaju K, Ravikumar P, Somashekar RK, Prakash KL. 2010. Physico-chemical and bacteriological
investigation on the river Cauvery of Kollegal stretch in Karnataka. Kathmandu University Journal of
Science, Engineering and Technology, 6(1): 50-59
Van VL. 1962. A study of fluctuating asymmetry. Evolution, 16: 125-142
Water Watch Australia, Technical Manual 2002. Physical and Chemical Parameters, Module 4. Australia
Zakeyudin MS, Isa MM, Md Rawi CS, and Md Shah AS. 2012. Assessment of suitability of Kerian River
tributaries using length-weight relationship and relative condition factor of six freshwater fish species,
Journal of Environmental. Earth Science, 2: 52-60
27