Comparative Evaluation of Variation in Heart Rate ...jmscr.igmpublication.org/v2-i6/26 jmscr.pdfDr....
21
Dr. Sanhita Rajan Walawalkar JMSCR Volume 2 Issue 6 June 2014 Page 1467 JMSCR Volume||2||Issue||6||Page 1467-1487||June 2014|ISSN:2347-176X 2014 Comparative Evaluation of Variation in Heart Rate Variability with Change in Posture in Young Adult Indian Males and Females Author Dr. Sanhita Rajan Walawalkar Associate Professor Email: [email protected] Abstract Context: An important component of Cardiovascular Adaptation is the ability of the cardiovascular system to adapt to physiological changes caused by physical challenges such as change in posture, gender etc, causing its adaptation response. If these parameters remain within sub- normal range for a long duration, then this could mean a sign of cardiovascular dysfunction, which may point toward poor physical health or onset of a cardiovascular disorder. Heart rate variability (HRV) is an important and widely-used measure of autonomic functioning, especially to assess cardiac activity. Few studies have focused on the impact of change in posture and gender on cardiac autonomic modulation in Indian context, so the rationale behind the present study was to systematically investigate the effect of postural change and gender on various HRV parameters using frequency domain measures of HRV in healthy young adult Indian population. Aim: To record, compare and evaluate HRV in different postures in young adult Indian males and females. Settings and Design: The study was conducted on 100 young adults (50 males and 50 females). Methods and Material: Their Height, Weight, Pulse rate & Blood Pressure were noted.HRV was recorded with the help of Anu photo rheograph using frequency domain method in supine, sitting and standing postures. Statistical analysis used: The data was analysed using SPSS 17.0 statistical package. Comparison between groups (supine, sitting and standing) was done using one way ANOVA followed by Tuckey’s POST HOC test and Independent t-test. The statistical significance level was established at 5% (P < 0.05) and 1% (P < 0.01). Results: The present study shows that, HRV parameters, such as TP, VLF and LF were higher in males, which www.jmscr.igmpublication.org Impact Factor 1.1147 ISSN (e)-2347-176x
Transcript of Comparative Evaluation of Variation in Heart Rate ...jmscr.igmpublication.org/v2-i6/26 jmscr.pdfDr....

Dr. Sanhita Rajan Walawalkar JMSCR Volume 2 Issue 6 June 2014 Page 1467
JMSCR Volume||2||Issue||6||Page 1467-1487||June 2014|ISSN:2347-176X
2014
Comparative Evaluation of Variation in Heart Rate Variability with Change
in Posture in Young Adult Indian Males and Females
Author
Dr. Sanhita Rajan Walawalkar
Associate Professor
Email: [email protected]
Abstract
Context: An important component of Cardiovascular Adaptation is the ability of the cardiovascular
system to adapt to physiological changes caused by physical challenges such as change in posture, gender
etc, causing its adaptation response. If these parameters remain within sub- normal range for a long
duration, then this could mean a sign of cardiovascular dysfunction, which may point toward poor
physical health or onset of a cardiovascular disorder. Heart rate variability (HRV) is an important and
widely-used measure of autonomic functioning, especially to assess cardiac activity. Few studies have
focused on the impact of change in posture and gender on cardiac autonomic modulation in Indian
context, so the rationale behind the present study was to systematically investigate the effect of postural
change and gender on various HRV parameters using frequency domain measures of HRV in healthy
young adult Indian population.
Aim: To record, compare and evaluate HRV in different postures in young adult Indian males and
females.
Settings and Design: The study was conducted on 100 young adults (50 males and 50 females).
Methods and Material: Their Height, Weight, Pulse rate & Blood Pressure were noted.HRV was recorded
with the help of Anu photo rheograph using frequency domain method in supine, sitting and standing
postures.
Statistical analysis used: The data was analysed using SPSS 17.0 statistical package. Comparison
between groups (supine, sitting and standing) was done using one way ANOVA followed by Tuckey’s
POST HOC test and Independent t-test. The statistical significance level was established at 5% (P < 0.05)
and 1% (P < 0.01).
Results:
The present study shows that, HRV parameters, such as TP, VLF and LF were higher in males, which
www.jmscr.igmpublication.org Impact Factor 1.1147
ISSN (e)-2347-176x

Dr. Sanhita Rajan Walawalkar JMSCR Volume 2 Issue 6 June 2014 Page 1468
JMSCR Volume||2||Issue||6||Page 1467-1487||June 2014|ISSN:2347-176X
2014
reflect sympathetic dominance in males. HF was significantly higher in females, which demonstrates
parasympathetic dominance in females. Mean RR interval was significantly higher in males than females
in lying and standing position but not in sitting position. With changes in posture (lying-sitting-standing),
mean RR interval decreased. Both genders demonstrated significant decrease of mean RR interval with
change of posture from sitting to standing, but it was not significant from lying to sitting, which may be
explained by increased sympathetic tone with change in posture from sitting to standing.
TP decreased with postural changes in males and females but not significantly. Significant difference in
TP between males and females in sitting and standing positions could be explained on the basis of greater
parasympathetic dominance in females and greater sympathetic dominance in males. In our study no
significant difference in VLF could be observed either with change in posture, or between genders.VLF
indicates influence of long-term regulatory mechanisms. So, our study which consisted of short time
recordings does not reflect the influence of such mechanisms.
The difference in LF was significant in lying position only. In both genders, there was a significant
increase of LF with change in posture from lying to sitting. But with change of posture from sitting to
standing, LF decreased not significantly. These findings can be explained by increase of sympathetic tone
with lying-sitting change in posture. And decrease of sympathetic influence with sitting-standing change in
posture could be related to recovery process trying to find a balance in a new standing condition. The
difference in HF between males and females was significant in supine and sitting postures but not in
standing position. When postures were changing from lying to sitting and to standing, HF decreased in
both sexes. It correlates with decreased parasympathetic and increased sympathetic tone with postural
changes from lying to sitting and to standing.
Keywords- heart rate variability, change in posture, gender, young adult Indian males and females,
comparison
INTRODUCTION
Heart rate variability (HRV) is a valuable and
extensively used tool to assess autonomic
functioning, especially cardiac health. HRV is the
variation in beat-to-beat intervals of the human
heart that allows the organ to react to stimuli. (1) A
plethora of studies indicate that increased variability
in the heart’s interbeat interval is physiologically
desirable. (2)
A depressed HRV usually points towards an
underlying pathology such as coronary artery
disease, heart failure, diabetes and hypertension.
HRV is also a predictor of left ventricular
dysfunction following myocardial infarction and is a
risk factor for morbidity and mortality. (1)
Apart from the autonomic nervous system (ANS),
the external factors, like body posture also change
the spectral characteristics of HRV. In the supine
posture, the parasympathetic influence is dominant
resulting in stronger high-frequency heartbeat
fluctuations. In contrast, decreased parasympathetic
function occurs in the standing position. (3) Postural
effects have been attributed to hydrostatic
influences affecting the amount of blood in the
splanchnic area, the blood pressure in the head and
different amounts of static muscular contraction
needed to maintain the different postures. A few
reports on gender-related differences in cardiac
autonomic modulation reveal that, in normal
population, parasympathetic tone dominates over

Dr. Sanhita Rajan Walawalkar JMSCR Volume 2 Issue 6 June 2014 Page 1469
JMSCR Volume||2||Issue||6||Page 1467-1487||June 2014|ISSN:2347-176X
2014
sympathetic in women and vice versa in men. (4)
Gender differences in the ANS may be present
because of developmental variations or due to the
effect of varied concentrations of male and/or
female sex hormones. (5)
One of the best ways to assess the autonomic
function is HRV analysis. The HRV analysis is non
invasive, powerful, very accurate, reliable,
reproducible, yet simple to do. (6)
HRV can be assessed by time domain or frequency
domain indices. Frequency domain measures of
HRV provide information on the frequency
distribution of the components of HRV using power
spectral density analysis. (2)
Spectral analysis of HRV is characterized by four
main components:
Total power - a power spectrum of RR intervals
calculated for a frequency range from 0.0033 Hz to
0.4 Hz. It represents effect of the autonomic
regulation on cardiovascular function.
The high frequency (HF) component (0.15Hz -0.40
Hz) measures the influence of the vagus nerve in
modulating the sinoatrial node and the inspiratory
inhibition of the vagal tone.
The low frequency (LF) component (0.04Hz-0.15
Hz) - influenced by baroreceptor-mediated
regulation of blood pressure and reflect
predominantly sympathetic activity.
The very low frequency (VLF) component
(0.003Hz -0.04 Hz) reflects the influence of several
factors on the heart, including chemoreceptors,
thermoreceptors, the renin-angiotensin system, and
other non-regular factors.
The purpose of the present study was to
systematically investigate the effect of gender and
different postural changes in both a healthy female
and a male population using frequency domain
measures of HRV.
SUBJECTS AND METHODS
A total of 100 healthy young adults (50 males and
50 females) were included in this study with age
range from 18 to 25 years.
The study was conducted in the Department of
Physiology at a Medical College.
The non smoker, non alcoholic, non diabetic, having
normal pulse rate, blood pressure, normal heart
sounds and having no evidence of illness and
having perfect physical, mental and psychological
well being were included in the study.
A brief history was taken and general physical
examination of all the volunteers was done with
main emphasis on cardiovascular diseases, renal
diseases. None of the subjects took any medication
at the time of study. All the tests were carried out
between 11 am to 4 pm. The procedure was
explained and informed consent was obtained after
the subjects had read a description of the
experimental protocol, which was approved by the
ethical committee of the college. The height, weight
and blood pressure of the subject was measured
with measuring tape, weighing machine and
sphygmomanometer respectively. On auscultation,
the heart sounds were found to be normal.
The experiment consisted of 3 recordings and each
performed in a sequence: lying position, sitting
position and standing position. During the data

Dr. Sanhita Rajan Walawalkar JMSCR Volume 2 Issue 6 June 2014 Page 1470
JMSCR Volume||2||Issue||6||Page 1467-1487||June 2014|ISSN:2347-176X
2014
collection, the volunteers were instructed not to
speak or move. To evaluate the autonomic HR
modulation response in relation to the supine,
standing and sitting postures, data were recorded for
a 5-minute period at rest for each condition
respectively, with spontaneous breathing. Initially
the subject was asked to lie down over a bench in
horizontal supine position and relax. The probe of
pulse oxymeter was clipped to the subject’s index
finger and care was taken that subject did not move
his hand. The probe was connected to the Anu-
photo-rheograph which was in turn connected to
personal computer with application software
(Variability Analyzer 2008). Record in lying
position was taken.
After the first record, the subject was asked to get
up and sit in a chair with hands placed on the bench
at the level of her thorax and the probe of pulse
oxymeter was attached to the index finger. Subject
was asked to relax and record in sitting position was
taken. At last the subject was asked to stand up with
hands by the side of the body and the record was
taken in standing position.
The recorded HRV raw data was analyzed in the
frequency domain to get HRV graph and FFT power
spectrum. Very low frequency (VLF), low
frequency (LF), high frequency (HF) spectral
powers were determined by integrating power
spectrum between 0.00-0.04 Hz, 0.04-0.15 Hz and
0.15-0.4 Hz respectively and expressed in
normalized units (nu). Total power was calculated
between 0.00-0.5 Hz and expressed in absolute unit
of millisecond squared.
The statistical analysis of the significance on the
data was done using one way ANOVA followed by
Tuckey’s POST HOC test and independent t-test.
The statistical significance level was established at
5% (p < 0.05) and 1% (p < 0.01).
RESULTS
Table 1. Physical Characteristics of Male and Female Subjects
Physical Characteristics
Gender
Statistics Parameter
Age Height Weight
Mean 20.08 165.36 63.94
Male Std. Deviation 2.89 7.29 7.13
Female Mean 19.12 156.21 54.86
Std. Deviation 2.04 22.71 7.00

Dr. Sanhita Rajan Walawalkar JMSCR Volume 2 Issue 6 June 2014 Page 1471
JMSCR Volume||2||Issue||6||Page 1467-1487||June 2014|ISSN:2347-176X
2014
Table 2. Descriptive Statistics and One Way Anova (In Males)
Table 3. Multiple Comparisons (Tucky’s HSD) (In Males)
#: Statistically significant at 5%level of significance i.e. P-value < 0.05
*: Statistically significant at 1%level of significance i.e. P-value < 0.01
Parameter Posture Posture Mean Difference P- value
Mean RR Interval
Lying Sitting 0.04840 0.131
Standing 0.13380
0.000*
Sitting Lying -0.0480 0.131
Standing 0.08540 0.002*
Standing Lying -0.13380 0.000*
Sitting -0.08540 0.002*
Total Power
Lying Sitting 11.06000 1.000
Standing 372.96000 0.644
Sitting Lying 11.06000- 1.000
Standing 361.90000 0.661
Standing Lying -372.96000 0.644
Sitting -361.90000 0.661
Very Low Frequency
Lying Sitting -0.28188 0.989
Standing -1.14480 0.827
Sitting Lying 0.28188 0.989
Standing -0.86292 0.898
Standing Lying 1.14480 0.827
Sitting 0.86292 0.898
Parameter Posture Mean Standard
Deviation
F-stat DF P
value
Mean RR Interval Lying 0.82 0.15 14.748 2,147 0.00*
Sitting 0.78 0.12
Standing 0.69 0.10
Total Power Lying 2264.80 2381.18 0.519 2,147 0.596
Sitting 2253.74 2385.17
Standing 1891.84 1285.78
Very Low
Frequency
Lying 19.04 11.16 0.187 2,147 0.83
Sitting 19.32 9.20
Standing 20.18 8.72
Low Frequency Lying 27.76 8.40 6.894 2,147 0.001#
Sitting 34.28 9.08
Standing 30.73 8.87
High Frequency Lying 20..00 11.30 7.66 2,147 0.001#
Sitting 14.20 8.76
Standing 13.32 7.31

Dr. Sanhita Rajan Walawalkar JMSCR Volume 2 Issue 6 June 2014 Page 1472
JMSCR Volume||2||Issue||6||Page 1467-1487||June 2014|ISSN:2347-176X
2014
Low Frequency
Lying Sitting -6.51986
0.001*
Standing -2.97252 0.212
Sitting Lying 6.51986 0.001*
Standing 3.54734 0.112
Standing Lying -2.97252 0.212
Sitting -3.54734 0.112
High Frequency
Lying Sitting 5.79444 0.006*
Standing 6.68042 0.001*
Sitting Lying -5.79444 0.006*
Standing 0.88598 0.882
Standing Lying -6.68042 0.001*
Sitting -0.88598 0.882
#: Statistically significant at 5%level of significance i.e. P-value < 0.05
*: Statistically significant at 1%level of significance i.e. P-value <0.01
Table 4. Descriptive Statistics and One Way Anova (In Females)
*: Statistically significant at 1%level of significance i.e. P-value < 0.01
Table 5. Multiple Comparisons (Tucky’s HSD) (In Females)
Parameter Posture Posture Mean Difference P- value
Mean RR Interval
Lying Sitting 0.01361 0.795
Standing 0.09810* 0.000*
Sitting Lying -0.01361 0.795
Standing 0.08449* 0.000*
Standing Lying -0.09810* 0.000*
Sitting -0.08449* 0.000*
Lying Sitting 122.36735 0.862
Parameter Posture Mean Standard Deviation F-stat DF P value
Mean RR Interval Lying 0.75 0.13 12.983 2,147 0.000*
Sitting 0.74 0.11
Standing 0.66 0.08
Total Power Lying 1483.00 1759.75 0.562 2,147 0.571
Sitting 1360.63 684.34
Standing 1235.69 746.22
Very Low Frequency Lying 18.20 13.79 0.269 2,147 0.764
Sitting 18.06 7.79
Standing 16.83 8.41
Low Frequency Lying 20.20 8.37 15.480 2,147 0.000*
Sitting 31.11 9.59
Standing 28.44 12.19
High Frequency Lying 26.46 16.59 12.470 2,147 0.000*
Sitting 21.25 8.21
Standing 14.89 8.11

Dr. Sanhita Rajan Walawalkar JMSCR Volume 2 Issue 6 June 2014 Page 1473
JMSCR Volume||2||Issue||6||Page 1467-1487||June 2014|ISSN:2347-176X
2014
Total Power
Standing 247.31373 0.540
Sitting Lying -122.36735 0.862
Standing 124.94638 0.855
Standing Lying -247.31373 0.540
Sitting -124.94638 0.855
Very Low Frequency
Lying Sitting 0.14319 0.997
Standing 1.37482 0.783
Sitting Lying -0.14319 0.997
Standing 1.23163 0.823
Standing Lying -1.37482 0.783
Sitting -1.23163 0.823
Low Frequency
Lying Sitting -10.90886* 0.000*
Standing -8.24299* 0.000*
Sitting Lying 10.90886* 0.000*
Standing 2.66587 0.393
Standing Lying 8.24299* 0.000*
Sitting -2.66587 0.393
High Frequency
Lying Sitting 5.20641 0.071
Standing 11.57180* 0.000*
Sitting Lying -5.20641 0.071
Standing 6.36539#
0.019
Standing Lying -11.57180* 0.000*
Sitting -6.36539#
0.019
#: Statistically significant at 5%level of significance i.e. P-value < 0.05
*: Statistically significant at 1%level of significance i.e. P-value <0.01
Table 6
#: Statistically significant at 5% level of significance i.e. p-value < 0.05.
*: Statistically significant at 1% level of significance i.e. p-value < 0.01.
Descriptive Statistics and Independent Sample t-test
Position - Lying
Parameter Gender Mean Std.
Deviation
Mean
Difference
t-
stat
DF p-
value
Mean R-
R Interval
M
F
0.82
0.75
0.15
0.13
0.0716# 2.57 98 0.012#
Total
Power
M
F
2264.80
1483.00
2381.18
1759.75
781.8000 1.87 98 0.065
VLF M
F
19.04
18.20
11.16
13.79
0.8353 0.33 98 0.740
LF M
F
27.76
20.20
8.40
8.37
7.5580* 4.51 98 0.000*
HF M
F
20.00
26.46
11.30
16.59
-6.4616# -
2.27
98 0.025#

Dr. Sanhita Rajan Walawalkar JMSCR Volume 2 Issue 6 June 2014 Page 1474
JMSCR Volume||2||Issue||6||Page 1467-1487||June 2014|ISSN:2347-176X
2014
Table7.
Descriptive statistics and independent sample t-test
Position: Sitting
Parameter Gender Mean Std. Deviation Mean
Difference
t-stat DF p-
value
Mean RR Interval Male
Female
0.776
0.740
0.120
0.108
0.037 1.611 98 0.110
Total Power Male
Female
2253.740
1360.633
2385.174
684.341
902.720# 2.573 98 0.012#
Very low
frequency
Male
Female
19.321
18.061
9.202
7.793
1.518 0.884 98 0.379
Low Frequency Male
Female
34.279
31.110
9.083
9.585
3.471 1.845 98 0.068
High Frequency Male
Female
14.205
21.254
8.758
8.208
-6.994* -4.138 98 0.000*
#: Statistically significant at 5% level of significance i.e. p-value < 0.05.
*: Statistically significant at 1% level of significance i.e. p-value < 0.01.
Table 8.
Descriptive statistics and independent sample t-test
Position: Standing
Parameter Gender Mean Std.
Deviation
Mean
Difference
t-stat DF p-
value
Mean RR
Interval
Male
Female
0.691
0.653
0.096
0.075
0.038 2.19 98 0.031#
Total Power Male
Female
1891.84
1242.80
1285.78
752.047
649.04 3.08 98 0.003*
Very low
frequency
Male
Female
20.184
17.062
8.717
8.324
3.1217 1.83 98 0.070
Low
Frequency
Male
Female
30.731
28.694
8.871
12.186
2.038 0.96 98 0.341
High
Frequency
Male
Female
13.319
14.817
7.313
8.177
-1.498 -
0.966
98 0.337
#: Statistically significant at 5% level of significance i.e. p-value < 0.05.
*: Statistically significant at 1% level of significance i.e. p-value < 0.01.

Dr. Sanhita Rajan Walawalkar JMSCR Volume 2 Issue 6 June 2014 Page 1475
JMSCR Volume||2||Issue||6||Page 1467-1487||June 2014|ISSN:2347-176X
2014

Dr. Sanhita Rajan Walawalkar JMSCR Volume 2 Issue 6 June 2014 Page 1476
JMSCR Volume||2||Issue||6||Page 1467-1487||June 2014|ISSN:2347-176X
2014

Dr. Sanhita Rajan Walawalkar JMSCR Volume 2 Issue 6 June 2014 Page 1477
JMSCR Volume||2||Issue||6||Page 1467-1487||June 2014|ISSN:2347-176X
2014
ANALYSIS OF RESULTS:
The mean RR Interval for males in lying, sitting and
standing positions was 0.82 ± 0.15, 0.78 ± 0.12 and
0.69 ± 0.10 respectively. The result shows that the
mean RR interval for males in three postures was
significantly different (F (2,147) = 14.748, p <
0.05). The mean total power (TP) for males in lying,
sitting and standing positions was 2264.80 ±
2381.18, 2253.74 ± 2385.17 and 1891.84 ± 1285.78
respectively. The result shows that the mean total
power for males in three postures was not
significantly different (F (2,147) = 0.519, p> 0.05).
The mean very low frequency (VLF) for males in
lying, sitting and standing positions was found to be
19.04 ± 11.16, 19.32 ± 9.20 and 20.18 ± 8.72
respectively. The mean VLF for males in three
postures was not significantly different (F (2,147) =
0,187, p > 0.05).
The mean very low frequency (VLF) for males in
lying, sitting and standing positions was found to be
19.04 ± 11.16, 19.32 ± 9.20 and 20.18 ± 8.72
respectively. The mean VLF for males in three
postures was not significantly different (F (2,147) =
0,187, p > 0.05).
The mean low frequency (LF) for males in lying,
sitting and standing positions was found to be 27.76
± 8.40, 34.28 ± 9.08 and 30.73 ± 8.87 respectively.
The mean LF for males in three postures was
significantly different (F (2,147) = 6,894, p < 0.05).
The mean high frequency (HF) for males in lying,
sitting and standing positions was found to be 20.00
± 11.30, 14.20 ± 8.76 and 13.32 ± 7.31 respectively.
The mean HF for males in three postures was
significantly different (F (2,147) = 7.66, p < 0.05).
The mean difference in RR Interval for males
between lying and sitting positions was 0.0484 [not
significantly different (p > 0.05)]. The mean
difference in RR Interval for males between lying
Dr. Sanhita Rajan Walawalkar JMSCR Volume 2 Issue 6 June 2014 Page 1478
JMSCR Volume||2||Issue||6||Page 1467-1487||June 2014|ISSN:2347-176X
2014
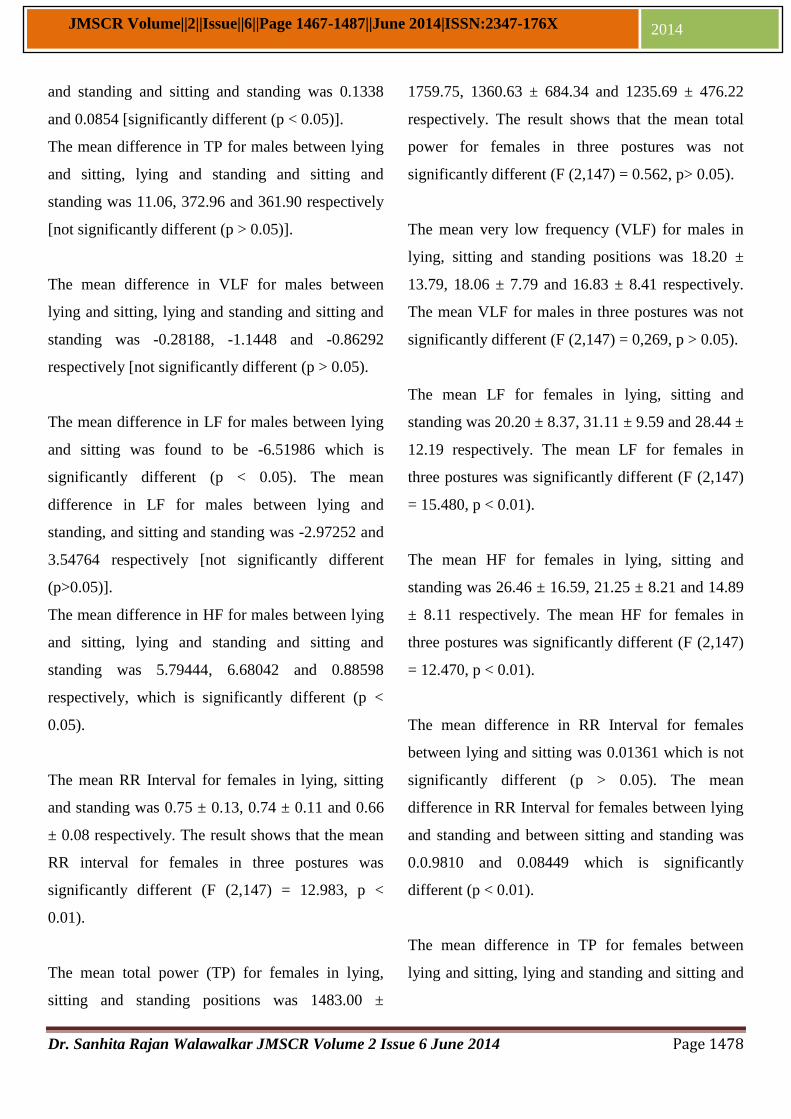
and standing and sitting and standing was 0.1338
and 0.0854 [significantly different (p < 0.05)].
The mean difference in TP for males between lying
and sitting, lying and standing and sitting and
standing was 11.06, 372.96 and 361.90 respectively
[not significantly different (p > 0.05)].
The mean difference in VLF for males between
lying and sitting, lying and standing and sitting and
standing was -0.28188, -1.1448 and -0.86292
respectively [not significantly different (p > 0.05).
The mean difference in LF for males between lying
and sitting was found to be -6.51986 which is
significantly different (p < 0.05). The mean
difference in LF for males between lying and
standing, and sitting and standing was -2.97252 and
3.54764 respectively [not significantly different
(p>0.05)].
The mean difference in HF for males between lying
and sitting, lying and standing and sitting and
standing was 5.79444, 6.68042 and 0.88598
respectively, which is significantly different (p <
0.05).
The mean RR Interval for females in lying, sitting
and standing was 0.75 ± 0.13, 0.74 ± 0.11 and 0.66
± 0.08 respectively. The result shows that the mean
RR interval for females in three postures was
significantly different (F (2,147) = 12.983, p <
0.01).
The mean total power (TP) for females in lying,
sitting and standing positions was 1483.00 ±
1759.75, 1360.63 ± 684.34 and 1235.69 ± 476.22
respectively. The result shows that the mean total
power for females in three postures was not
significantly different (F (2,147) = 0.562, p> 0.05).
The mean very low frequency (VLF) for males in
lying, sitting and standing positions was 18.20 ±
13.79, 18.06 ± 7.79 and 16.83 ± 8.41 respectively.
The mean VLF for males in three postures was not
significantly different (F (2,147) = 0,269, p > 0.05).
The mean LF for females in lying, sitting and
standing was 20.20 ± 8.37, 31.11 ± 9.59 and 28.44 ±
12.19 respectively. The mean LF for females in
three postures was significantly different (F (2,147)
= 15.480, p < 0.01).
The mean HF for females in lying, sitting and
standing was 26.46 ± 16.59, 21.25 ± 8.21 and 14.89
± 8.11 respectively. The mean HF for females in
three postures was significantly different (F (2,147)
= 12.470, p < 0.01).
The mean difference in RR Interval for females
between lying and sitting was 0.01361 which is not
significantly different (p > 0.05). The mean
difference in RR Interval for females between lying
and standing and between sitting and standing was
0.0.9810 and 0.08449 which is significantly
different (p < 0.01).
The mean difference in TP for females between
lying and sitting, lying and standing and sitting and

Dr. Sanhita Rajan Walawalkar JMSCR Volume 2 Issue 6 June 2014 Page 1479
JMSCR Volume||2||Issue||6||Page 1467-1487||June 2014|ISSN:2347-176X
2014
standing was 122.36735, 247.31373 and 124.94638
respectively [not significantly different (p > 0.05)].
The mean difference in VLF for females between
lying and sitting, lying and standing and sitting and
standing was -0.14319, 1.37482 and 1.23163 [not
significantly different (p > 0.05)].
The mean difference in LF for females between
lying and sitting, lying and standing was 10.90886, -
8.24299 [significantly different (p < 0.01)]. But that
between sitting and standing was 2.66587 [not
significantly different (p > 0.05)].
The mean difference in HF for females between
lying and sitting was 5.20641 [not significantly
different (p > 0.05)]. The mean difference in HF for
females between lying and standing and sitting and
standing was 11.57180 and 6.36539 which is
significantly different (p<0.01).
The mean RR interval in lying position for males
was found to be 0.82 ± 0.15, and for females it was
0.75 ± 0.13. The mean difference in mean RR
interval between males and females in lying
position was 0.0716 which is significant at 5% level
of significance (t (98) = 2.57, p < 0.05). The result
is shown in graph 1.
The mean TP in lying position for males was found
to be 2264.80 ± 2381.18, and for females it was
1483.00 ± 1759.75. The mean difference in mean
TP between males and females was 781.8 which is
not significant statistically (t (98) = 1.87, p > 0.05).
The result is shown in graph 2.
The mean VLF in lying position for males was
found to be 19.04 ± 11.16, and for females it was
18.20 ± 13.79. The mean difference in mean VLF
between males and females was 0.8353 which is not
significant statistically (t (98) = 0.33, p > 0.05). The
result is shown in graph 3.
The mean LF in lying position for males was 27.76
± 8.40, and for females it was 20.20 ± 8.37. The
mean difference in mean LF between males and
females in lying position was 7.558 which is
significant at 1% level of significance (t (98) = 4.51,
p < 0.01). The result is shown in graph 4.
The mean HF in lying position for males was found
to be 20.00 ± 11.30, and for females it was 26.46 ±
16.59. The mean difference in mean HF between
males and females in lying position was -6.4616
which is significant at 5% level of significance
(t(98) = -2.277, p < 0.05). The result is shown in
graph 5.
The mean RR interval in sitting position for males
was found to be 0.776 ± 0.12, and for females it was
0.74 ± 0.108. The mean difference in mean RR
interval between males and females in sitting
position was 0.037 which is significant at 5% level
of significance (t (98) = 1.611, p < 0.05). The result
is shown in graph 1.

Dr. Sanhita Rajan Walawalkar JMSCR Volume 2 Issue 6 June 2014 Page 1480
JMSCR Volume||2||Issue||6||Page 1467-1487||June 2014|ISSN:2347-176X
2014
The mean TP in sitting position for males was found
to be 2253.74 ± 2385.174, and for females it was
1360.633 ± 684.341. The mean difference in mean
TP between males and females was 902.72 which is
significant at 5% level of significance (t (98) =
2.573, p < 0.05). The result is shown in graph 2.
The mean VLF in sitting position for males was
found to be 19.321 ± 9.202, and for females it was
18.061 ± 7.793. The mean difference in mean VLF
between males and females was 1.518 which is not
significant statistically (t (98) = 0.884, p > 0.05).
The result is shown in graph 3.
The mean LF in sitting position for males was
34.279 ± 9.083, and for females it was 31.110 ±
9.585. The mean difference in mean LF between
males and females in sitting position was 3.471
which is not significant statistically (t (98) = 1.845,
p > 0.05). The result is shown in graph 4.
The mean HF in sitting position for males was
found to be 14.205 ± 8.758, and for females it was
21.254 ± 8.208. The mean difference in mean HF
between males and females in sitting position was -
6.994 which is significant at 1% level of
significance (t (98) = -4.138, p < 0.01). The result is
shown in graph 5.
The mean RR interval in standing position for males
was found to be 0.691 ± 0.096, and for females it
was 0.653 ± 0.075. The mean difference in mean
RR interval between males and females in standing
position was 0.0378 which is significant at 5% level
of significance (t (98) = 2.19, p < 0.05). The result
is shown in graph 1.
The mean TP in standing position for males was
found to be 1891.84 ± 1285.78, and for females it
was 1242.80 ± 752.05. The mean difference in
mean TP between males and females was 649.04
which is significant at 1% level of significance (t
(98) = 3.08, p < 0.01). The result is shown in graph
2.
The mean VLF in standing position for males was
found to be 20.184 ± 8.717, and for females it was
17.062 ± 8.324. The mean difference in mean VLF
between males and females was 3.1217 which is not
significant statistically (t (98) = 1.83, p > 0.05). The
result is shown in graph 3.
The mean LF in standing position for males was
30.731 ± 8.871, and for females it was 28.694 ±
12.186. The mean difference in mean LF between
males and females in standing position was 2.0377
which is not significant statistically (t (98) = 0.96, p
> 0.05). The result is shown in graph 4.
The mean HF in standing position for males was
found to be 13.319 ± 7.313, and for females it was
14.817 ± 8.177. The mean difference in mean HF
between males and females in standing position was
-1.498 which is not significant statistically (t (98) =
-0.966, p > 0.05). The result is shown in graph 5.
Mean RR interval was significantly higher in males
than females in lying and standing position but not

Dr. Sanhita Rajan Walawalkar JMSCR Volume 2 Issue 6 June 2014 Page 1481
JMSCR Volume||2||Issue||6||Page 1467-1487||June 2014|ISSN:2347-176X
2014
in sitting position. With changes in posture (lying-
sitting-standing), decrease of mean RR interval was
observed. Both genders demonstrated significant
decrease of mean RR interval with change of
posture from sitting to standing, but it was not
significant from lying to sitting. This finding is
explained by increase in sympathetic tone with
postural changes.
HRV parameters, such as TP, VLF and LF were
higher in males, which reflect sympathetic
dominance in males. HF was significantly higher in
females, which demonstrates parasympathetic
dominance in females.
TP decreased with postural changes in males and
females but not significantly. Significant difference
in TP between males and females in sitting and
standing positions could be explained on the basis
of greater parasympathetic dominance in females
and greater sympathetic dominance in males. In our
study no significant difference in VLF could be
observed either with change in posture, or between
two genders. VLF indicates influence of long-term
regulatory mechanisms. So, our study which
consisted of short time recordings does not reflect
the influence of such mechanisms.
LF was higher in males than females due to greater
sympathetic tone in males. This difference was
significant in lying position only, in sitting and
standing postures LF was not significantly higher in
males. In both genders, there was a significant
increase of LF with change in posture from lying to
sitting. But with change of posture from sitting to
standing, LF decreased not significantly. These
findings can be explained by increase of
sympathetic tone with lying-sitting change in
posture. And decrease of sympathetic influence with
sitting-standing change in posture could be related
to recovery process trying to find a balance in a new
standing condition.
HF was higher in females than males; it proves
parasympathetic dominance in females. This
difference was significant in supine and sitting
postures but not in standing position. When postures
were changing from lying to sitting and to standing
there was decrease of HF in males and females. This
correlates with decreased parasympathetic and
increased sympathetic influence with postural
changes from lying to sitting to standing positions.
DISCUSSION
Genetic characteristics, anthropometrics (body mass
and height), age, gender, hormonal and emotional
factors, status of physical and mental health are
some of the factors that influence HRV at rest. The
analysis of HRV through postural tests can be
studied to observe the impact of such factors. (8)
Influence of postural changes on HRV parameters
in males and females –
1] Response of R-R interval to postural changes -
In present study, mean RR interval decreases with
change in posture in both, males and females (Table
2, 4, graph 1). In both genders, decrease of RR
interval with change in posture from lying to sitting
is not significant statistically; but when posture
changes from sitting to standing, decrease of RR
interval is significant in both (Table 3, 5).
In this study, the basal recording showed that mean
RR interval was higher in males in all three

Dr. Sanhita Rajan Walawalkar JMSCR Volume 2 Issue 6 June 2014 Page 1482
JMSCR Volume||2||Issue||6||Page 1467-1487||June 2014|ISSN:2347-176X
2014
postures. The difference in mean RR interval
between males and females was statistically
significant in lying and standing but not in sitting
posture. (Table 6, 7, 8)
It has been reported in the literature that adjustments
in Heart Rate modulation from supine to sitting and
standing posture are due to hydrostatic deviations
caused by the displacement of blood from the
central region to the lower regions, which decreases
the cardiac output, systemic arterial pressure and
activation of the arterial and cardiopulmonary
receptors.
Similar results were obtained in a study by Zuttin R.
S. et al. Their results of analysis of RR interval
showed that heart rate was greater in the sitting
posture than in the supine posture (7).
The results of the study by Joyce M. Evans showed
that men and women demonstrated statistically
significant differences in indexes of sympathetic
and parasympathetic autonomic activity with men
showing greater sympathetic influence whereas
women showing parasympathetic preponderance.
(8)
The mechanisms of the differences in RR interval
dynamics due to gender variation are not known.
Possible effects of sex hormones and differences in
baseline variables, such as blood pressure have been
speculated. It was suggested that the mechanisms
behind gender-related differences in autonomic
modulation of heart rate are probably more closely
related to hormonal or genetic factors.
However, there were no significant differences
between genders in mean heart rate in the study by
Ryan A.D. et al (9).
2] Total power response to postural changes -
HRV analysis of this study showed that the total
power for males in three postures was not
significantly different (Table 2, 3, graph 2).
Similarly for females, the total power in three
postures was not significantly different (Table 4, 5,
graph 2).
The basal level of TP was higher in males than in
females (Graph 2). TP was significantly higher in
males in sitting and standing posture. In supine
position, difference in TP between males and
females was not statistically significant. (Table 6, 7,
8)
The results on total power are even more varied;
from a decrease with tilt (Pagani et al.) through no
difference with tilt (Vybiral et al. 1989) to an
increase with tilt (Lipsitz et al.). (1, 10, 11)
Total power reflects overall influence of
parasympathetic and sympathetic effect on cardiac
function. (6)
Significant difference in TP between males and
females in sitting and standing positions could be
explained on the basis of greater parasympathetic
dominance in females and greater sympathetic
dominance in males.
3] Very low frequency response to postural changes
-
In males VLF was slightly increasing with changes
in posture but it was not significantly different in all
three postures (Table 2, 3, graph 3). In females,
VLF was slightly decreasing with changes in
posture but difference in VLF in three positions was
not significant statistically (Table 4, 5, graph 3).

Dr. Sanhita Rajan Walawalkar JMSCR Volume 2 Issue 6 June 2014 Page 1483
JMSCR Volume||2||Issue||6||Page 1467-1487||June 2014|ISSN:2347-176X
2014
Mean VLF was higher in males than females but in
all three postures difference in VLF between males
and females was not significant statistically (Table
6, 7, 8).
The result of our study was similar to the result of
study by Ryan AD et al. They did not observe any
significant differences between genders in total
power or distribution of power of very low
frequency bands. At the same time, they did observe
a significant difference in the distribution of power
between males and females (LF and HF), with
significantly less high-frequency power
(parasympathetic activity) in males (9).
In contrast, in the study by Shemalia Saleem et al
(12), the frequency domain indices like TP and VLF
were found attenuated in females as compared to the
males, but the difference was not statistically
significant.
VLF component of HRV analysis reflects the
influence of several factors on the heart, such as
chemoreceptors, thermoreceptors, the renin-
angiotensin system, and other non-regular factors.
The physiological interpretation of VLF has still not
been universally accepted. With longer recordings,
it is considered to represent sympathetic tone as
well as slower hormonal and thermoregulatory
effects (4).
There are some findings indicating that in shorter
recordings VLF has fair representation of various
mental stress factors (negative emotions, worries,
rumination etc.
In our study no significant difference in VLF
component could be observed either with change in
posture, or between males and females. The factors
described above influence the cardiac function as
long-term regulatory mechanisms. So, the present
study which consists of three recordings of 5
minutes each (total 15 minutes) hence does not
reflect the influence of above mentioned factors.
4] Low frequency response to postural changes -
In present study, in males mean LF increases
significantly with change in posture from lying to
sitting. When males changed posture from sitting to
standing, there was decrease of LF band of power
spectra but not significant statistically. In males, LF
was higher in standing position than in supine, but
difference was not significant statistically. (Table 2,
3, graph 4)
Similarly in females, mean LF increases
significantly with change in posture from lying to
sitting. Then when posture changed from sitting to
standing, there was decrease of LF but it was not
significant statistically. Females demonstrated
higher LF in standing position than in lying and
difference is significant statistically. (Table 4, 5,
graph 4)
The base line of LF was higher in males than in
females in all three postures (Graph 4), but there
was statistically significant difference in LF
between males and females in supine posture only.
LF was not significantly different between genders
in sitting position and standing position. (Table 6, 7,
8)
The results of the present study match with results
of study by Zuttin RS et al. They observed that for
the supine posture in relation to the sitting posture,
the HF was greater, the LF was lower and the
LF/HF ratio was lower. This reflected the finding

Dr. Sanhita Rajan Walawalkar JMSCR Volume 2 Issue 6 June 2014 Page 1484
JMSCR Volume||2||Issue||6||Page 1467-1487||June 2014|ISSN:2347-176X
2014
that the HRV decreased significantly from the
supine posture to the sitting posture (7).
The results of study by Sirkku Pikkujamsa et al (10)
also indicate that there are sex-related differences in
cardiovascular autonomic regulation. The heart rate
response to an abrupt rise in blood pressure and the
LF are lower in women than in men, whereas the
HF is higher in women.
In contrast to our study, Ryan A.D. et al (9) did not
observe significant differences between genders in
mean heart rate, respiratory frequency, total power
or distribution of power in low and very low
frequency bands. They examined the effect of
changing body position on HRV in 24 subjects and
did observe a significant difference in high-
frequency power between males and females.
Results of our study correlate with a study by
Ramaekers D. et al (13). They noted a highly
significant gender difference in heart rate and heart
rate variability. Heart rate variability indices,
denoting vagal activity, were not significantly
different between men and women, whereas the
spectral indices such as LF and LF/HF ratio were
significantly higher in men. These findings may
reflect a higher sympathetic activity in men
compared to women.
In another study by Pomeranz B. et al (14) it was
found that low-frequency fluctuations (below
0.12Hz) are increased by standing and are jointly
mediated by the sympathetic and parasympathetic
nervous systems. Higher-frequency fluctuations are
decreased by standing and are mediated solely by
the parasympathetic system.
Changing a body posture from lying position to
sitting or standing position causes blood mass to
rush down to lower extremities due to gravitational
pull. This causes an increase in arterial and venous
pressure in the lower body and decrease in blood
mass returned to the heart. Therefore the central
venous pressure drops causing decrease in stroke
volume and cardiac output. In response to decreased
blood pressure in large arteries, an internal
regulatory mechanism turns on to avoid dizziness or
even passing out due to a limited blood supply of
the brain. (6)
The sitting-lying difference is due to hydrostatic
influence acting mainly, if not wholly, through the
carotid sinus reflex. (15)
Once mean pressure drops due to standing up,
stimulation of baroreceptors increases, so they begin
sending signals to vasomotor center located in the
brainstem. Increased stimulation of this center
causes immediate drop in parasympathetic tone and
rapid increase in sympathetic tone.
A combination of decreased parasympathetic tone
and increased sympathetic tone causes rapid
increase in heart rate, contractility of the heart
muscle and peripheral arterial vasoconstriction. This
all leads to increase in the stroke volume, cardiac
output and mean arterial pressure. Thus the body
achieves compensation of the cardiovascular
deficiency caused by standup maneuver. (6)
Analysis of results of present study shows that LF
component of HRV, which is associated with
sympathetic tone, is higher in males than females.
With a change of posture from lying to sitting, there

Dr. Sanhita Rajan Walawalkar JMSCR Volume 2 Issue 6 June 2014 Page 1485
JMSCR Volume||2||Issue||6||Page 1467-1487||June 2014|ISSN:2347-176X
2014
is an increase of sympathetic effect on HRV in both,
males and females.
In present study, the sitting-standing difference in
males and females is characterized by decreasing
influence of sympathetic tone. Once the
compensation has been achieved, the body begins a
recovery process trying to find a balance in a new
standing condition. The organism tries to gradually
find a new equilibrium, lowering heart rate, stroke
volume and arterial blood pressure without
compromising on adequate blood supply to the vital
organs.
The decreased level of mean arterial pressure lowers
stimulation of baroreceptors, which reduces
stimulation of vasomotor center in the brainstem
and causes decrease in sympathetic activity. This
finally leads to gradual decrease of heart rate and
contractility, which reduces stroke volume, cardiac
output and mean arterial pressure to the level
adequate to new body condition. (6)
5] High frequency response to postural changes -
In present study, in males mean HF decreases
significantly with change in posture from lying to
sitting. Decrease of mean HF in males from sitting
position to standing is not significant statistically.
(Table 2, 3, graph 5)
In females, mean HF also decreases with change in
posture from lying to sitting but decrease is not
significant. Decrease of mean HF in females from
sitting to standing is significant statistically. (Table
4, 5, graph 5)
In our study, the base line of mean HF is higher in
females, in contrast to other parameters, which are
higher in males. (Graph 5)
In lying and sitting position, the difference of HF
between males and females is significant
statistically. In standing position, HF is higher in
females than males but not significantly. (Table 6,
7, 8)
In contrast to our study, results of the study by
Shemalia Saleem et al (14) demonstrate that in
healthy Pakistani population, heart rate variability is
low in women than men. It reflects sympathetic
dominance in women in the population.
Various combinations of vagal and sympathetic
activation are characteristic for different body
postures. Cacioppo et al. have suggested that vagal
activity is the highest and sympathetic activity is the
lowest in the supine posture. The reverse occurs in
the standing posture, and a combination is
characteristic for the sitting posture. (16)
CONCLUSIONS
This study shows that, change in body posture
changes the spectral characteristics of HRV. The
parasympathetic activity decreases and sympathetic
dominance increases with posture change from
supine to sitting to standing in both genders. Males
show sympathetic dominance whereas females
show parasympathetic dominance. Lower
sympathetic activity may be the reason behind
lower cardiovascular risk in females, in
premenopausal age group.

Dr. Sanhita Rajan Walawalkar JMSCR Volume 2 Issue 6 June 2014 Page 1486
JMSCR Volume||2||Issue||6||Page 1467-1487||June 2014|ISSN:2347-176X
2014
ACKNOWLEDGEMENT
I am indebted to Dr. R.S.Inamdar, Professor and
Head, Department of Physiology, MGM Medical
College, Navi Mumbai, for his guidance and
support, to Miss Katherine Liashko (MSc student)
for her assistance in carrying out this study, to non-
teaching staff of Department of Physiology, for their
assistance and to all the volunteers for their active
participation.
REFERENCES
[1] Pagani M, Lombardi F, Guzzetti S, Rimoldi O,
Furlan R, Pizzinelli P. Power spectral analysis of
heart rate and arterial pressure variabilities as a
marker of sympatho-vagal interaction in man and
conscious dog. Circ Res. 1986; 59: 178-193.
[2] Jindal GD, Ananthakrishnan TS, Kataria SK and
Deshpande AK. Medical analyzer for the study of
physiological variability and disease
characterization.
[3] Castiglioni P, Rienzo M Di. Gender related
differences in scaling structure of heart-rate and
blood-pressure variability as assessed by detrended
fluctuation analysis. Computing in Cardiology.
2010; 137-140.
[4] Moodithaya S, Avadhany S. Gender differences
in age-related changes in cardiac autonomic nervous
function. Journal of Aging Research. 2012; art ID
679345.
[5] Dart AM, Du XJ and Kingwell BA. Gender, sex
hormones and autonomic nervous control of the
cardiovascular system. Cardiovascular research.
2002; 53: 678-687.
[6] Biocom Technologies. Heart rhythm scanner.
Professional edition. Comprehensive health
assessment system. Practical use manual, 2011.
[7] Zuttin GD, Moreno MA, Martins LE, Catai AM,
Silva E. Evaluation of autonomic heart rate
modulation among sedentary young men, in sitting
and supine postures. Rev Braz Fisioter. 2008; 12
(1): 7-12.
[8] Evans J M, Ziegler MG, Patwardhan AR, Ott
JB, Kim CS, Leonelli FM and Knapp CF. Gender
differences in autonomic cardiovascular regulation:
spectral, hormonal and hemodynamic indexes. J
Appl Physiol. 2001; 91: 2611-2618.
[9] Ryan A D, Larsen P D and Galletly D C.
Comparison of heart rate variability in supine, and
left and right lateral positions. Anaesthesia. 2003;
58: 432-436.
[10] Pikkujamsa S. Heart rate variability and
baroreflex sensitivity in subjects without heart
disease. Effect of age, sex and cardiovascular risk
factors. Academic dissertation, Oulu University
Library, 1999.
[11] Lipsitz L A, Mietus J, Moody G B and
Goldberger A L. Spectral characteristics of heart
rate variability before and during postural tilt.

Dr. Sanhita Rajan Walawalkar JMSCR Volume 2 Issue 6 June 2014 Page 1487
JMSCR Volume||2||Issue||6||Page 1467-1487||June 2014|ISSN:2347-176X
2014
Relations to aging and risk of syncope. Circulation.
1990; 81: 1803-1810.
[12] Shemaila Saleem, Muhammad M H,
Muhammad A K and Syed M I M. Gender
differences of heart rate variability in healthy
volunteers. JPMA. 2012; 62: 422.
[13] Ramaeakers D, Ector H, Aubert A E, Rubens A
and Werf F V d. Heart rate variability and heart rate
in healthy volunteers. Eur Heart J. 1998; 19: 1334-
1341.
[14] Pomeranz B, Macaulay R J, Caudill M A,
Kutz I, Adam D, Gordon D et al. Assessment of
autonomic function in humans by heart rate spectral
analysis. Am J Physiol heart Circ Physiol. 1985;
248: H151-H153.
[15] Mac William J A. Postural effects on heart rate
and blood pressure. Experimental Physiology. 1993;
23: 1-33.
[16] Martinmaki K, Rusko H, Libbe K, Kettunen J
and Saalasti S. Intraindividual validation of heart
rate variability indexes to measure vagal effects on
hearts. Am J Physiol Heart Circ Physiol. 2006; 290:
H640-H647.