Comparative Coarsening Kinetics of Gamma Prime .../67531/metadc699871/m2/1/high... ·...
164
APPROVED: Rajarshi Banerjee, Major Professor James C. Williams, Committee Member Narendra B. Dahotre, Committee Member Marcus Young, Committee Member Sundeep Mukherjee, Committee Member Nigel Shepherd, Chair of the Department of Materials Science Costas Tsatsoulis, Dean of the College of Engineering Mark Wardell, Dean of the Toulouse Graduate School COMPARATIVE COARSENING KINETICS OF GAMMA PRIME PRECIPITATES IN NICKEL AND COBALT BASE SUPERALLOYS Subhashish Meher, B.Tech. Dissertation prepared for the Degree DOCTOR OF PHILOSOPHY UNIVERSITY OF NORTH TEXAS August 2014
Transcript of Comparative Coarsening Kinetics of Gamma Prime .../67531/metadc699871/m2/1/high... ·...

APPROVED: Rajarshi Banerjee, Major Professor James C. Williams, Committee Member Narendra B. Dahotre, Committee Member Marcus Young, Committee Member Sundeep Mukherjee, Committee Member Nigel Shepherd, Chair of the Department of
Materials Science Costas Tsatsoulis, Dean of the College of
Engineering Mark Wardell, Dean of the Toulouse Graduate
School
COMPARATIVE COARSENING KINETICS OF GAMMA PRIME PRECIPITATES IN
NICKEL AND COBALT BASE SUPERALLOYS
Subhashish Meher, B.Tech.
Dissertation prepared for the Degree
DOCTOR OF PHILOSOPHY
UNIVERSITY OF NORTH TEXAS
August 2014

Meher, Subhashish. Comparative Coarsening Kinetics of Gamma Prime Precipitates
in Nickel and Cobalt Base Superalloys. Doctor of Philosophy (Materials Science and
Engineering), August 2014, 149 pp., 7 tables, 47 figures, chapter references.
The increasing technological need to push service conditions of structural materials to
higher temperatures has motivated the development of several alloy systems. Among them,
superalloys are an excellent candidate for high temperature applications because of their ability
to form coherent ordered precipitates, which enable the retention of high strength close to their
melting temperature. The accelerated kinetics of solute diffusion, with or without an added
component of mechanical stress, leads to coarsening of the precipitates, and results in
microstructural degradation, limiting the durability of the materials. Hence, the coarsening of
precipitates has been a classical research problem for these alloys in service. The prolonged hunt
for an alternative of nickel base superalloys with superior traits has gained hope after the recent
discovery of Co-Al-W based alloys, which readily form high temperature γ’ precipitates, similar
to Ni base superalloys.
In the present study, coarsening behavior of γ’ precipitates in Co-10Al-10W (at. %) has
been carried out at 800°C and 900°C. This study has, for the first time, obtained critical
coarsening parameters in cobalt-base alloys. Apart from this, it has incorporated atomic scale
compositional information across the γ/γ’ interfaces into classical Cahn-Hilliard model for a
better model of coarsening kinetics. The coarsening study of γ’ precipitates in Ni-14Al-7 Cr
(at. %) has shown the importance of temporal evolution of the compositional width of the γ/γ’
interfaces to the coarsening kinetics of γ’ precipitates.
This study has introduced a novel, reproducible characterization method of
crystallographic study of ordered phase by coupling of orientation microscopy with atom probe

tomography (APT). Along with the detailed analysis of field evaporation behaviors of Ni and Co
superalloys in APT, the present study determines the site occupancy of various solutes within
ordered γ’ precipitates in both Ni and Co superalloys.
This study has explained the role of structural and compositional gradients across the
precipitates (γ’)/matrix (γ) interfaces on the coarsening behavior of coherent precipitates in both
Ni and Co-base superalloys. The observation of two interfacial widths, one corresponding to a
structural order-disorder transition, and the other to the compositional transition across the
interface, raises fundamental questions regarding the definition of the interfacial width in such
systems. The comparative interface analysis in Co and Ni superalloy shows significant
differences, which gives insights to the coarsening behaviors of γ’ precipitates in these alloys.
Hence, the principal goal of this work is to compare and contrast the Co and Ni superalloys and
also, to accommodate atomic scale information related to transitions across interfaces to
coarsening models for a better practical applicability of coarsening laws to various alloys.

Copyright 2014
by
Subhashish Meher
ii

iii
ACKNOWLEDGEMENTS
I express my sincere gratitude to my advisor, Dr. Rajarshi Banerjee, for providing me
opportunity to pursue PhD under his guidance. Without his supervision and constant help this
dissertation would not have been possible. I would like to thank him very much for his support
and understanding me over these past four years.
I would like to show gratitude to my committee, including Dr. James C. Williams, Dr.
Narendra B. Dahotre, Dr. Marcus Young and Dr. Sundeep Mukherjee. I would also like to
acknowledge Dr. Thomas Scharf , Dr. Jincheng Du and Dr. Srinivasan Srivilliputhur for their
timely support in graduate coursework. I am thankful to Dr. Junyeon Hwang and Dr. Soumya
Nag for providing advice many times during my PhD.
My sincere thanks also go to Dr. Hamish Fraser at the Ohio State University, for
providing me opportunity to work on collaborative projects. I would like to thank Dr. David Dye,
at Imperial College, London for collaborative projects. I am also thankful to Dr. Jaimie Tiley, the
AFRL program manager of ISES, for providing financial support throughout last four years.
Getting through my dissertation required more than academic support, and I thank to my group
members and friends for it. I am very much thankful to the MTSE staff for handling all paper
work in a timely manner.
Last but not the least; I would like to thank my family: my parents Kartikeswar Meher
and Suryakanti Meher, and my brother Devashish Meher for supporting me spiritually
throughout my life.

iv
TABLE OF CONTENTS
Page
ACKNOWLEDGEMENTS ........................................................................................................... iii LIST OF TABLES ....................................................................................................................... viii LIST OF FIGURES ....................................................................................................................... ix CHAPTER 1 INTRODUCTION ................................................................................................... 1
1.1 Background ................................................................................................................... 1
1.2 Motivation and Aim ................................................................................................ 3
1.3 Thesis Structure ...................................................................................................... 4
1.4 Publications ............................................................................................................. 6
1.5 References ............................................................................................................... 6 CHAPTER 2 LITERATURE REVIEW ....................................................................................... 9
2.1 The Concept of Superalloys .................................................................................... 9
2.2 Precipitate Strengthened Superalloys ................................................................... 10
2.2.1 Structure and Chemistry of the γ’ Phase ................................................... 11
2.3 Novel Cobalt-base γ - γ’ Alloys ............................................................................ 12
2.4 Coarsening of Precipitates .................................................................................... 13
2.5 Factors Affecting Coarsening ............................................................................... 15
2.5.1 Volume Fraction of Precipitates ............................................................... 15
2.5.2 Elastic Interactions .................................................................................... 16
2.6 Role of Order-Disorder Interfaces in Coarsening Mechanism ............................. 17
2.7 References ............................................................................................................. 17 CHAPTER 3 METHODS AND TECHNIQUES ........................................................................ 20
3.1 Alloy Preparation .................................................................................................. 20
3.2 Heat Treatments .................................................................................................... 20
3.3 Characterization Tools .......................................................................................... 21
3.3.1 Scanning Electron Microscopy (SEM) ..................................................... 21
3.3.2 Electron Backscatter Diffraction (EBSD) ................................................. 21
3.3.3 Dual Beam Focused Ion Beam Microscope (FIB) .................................... 22
3.3.4 Transmission Electron Microscopy (TEM) .............................................. 22

v
3.3.5 Atom Probe Tomography (APT) .............................................................. 23
3.4 Coupling of Orientation Microscopy with APT for Crystallographic Study ........ 24
3.4.1 Geometrical Aspect of Atom Probe Tip and Spatial Resolution ................. 24
3.5 References ............................................................................................................. 27 CHAPTER 4 COARSENING KINETICS OF γ’ PRECIPITATES IN COBALT-BASE ALLOYS ....................................................................................................................................... 28
4.1 Introduction ........................................................................................................... 28
4.2 Materials and Methods .......................................................................................... 30
4.3 Results ................................................................................................................... 32
4.3.1 Water Quenched Condition Prior to Annealing ........................................ 32
4.3.2 Morphological Changes During Isothermal Annealing ............................ 34
4.3.3 Compositional Changes Across γ/γ’ Interface During Isothermal Annealing .................................................................................................. 36
4.3.4 Interfacial Energy From the Cahn-Hilliard Approximation ..................... 40
4.3.5 Coarsening Rate Constants Based on LSW Theory ................................. 42
4.3.6 Determination of the Activation Energy ................................................... 46
4.3.7 Determination of γ/γ’ Interfacial Energy and the Gradient Energy Coefficient................................................................................................. 46
4.3.8 Inter-precipitate Distances and Coalescence of γ’ Precipitates ................ 47
4.4 Discussion ............................................................................................................. 49
4.5 Summary and Conclusions ................................................................................... 52
4.6 References ............................................................................................................. 54 CHAPTER 5 PARTITIONING AND SITE PREFERENCES IN CO-BASE γ-γ’ ALLOYS ..... 56
5.1 Introduction ........................................................................................................... 56
5.2 Materials and Methods .......................................................................................... 57
5.3 Results and Discussion ......................................................................................... 59
5.3.1 Analysis of a Co-Al-W Alloy ................................................................... 59
5.3.2 Analysis of a Co-Al-W-Ni Alloy .............................................................. 60
5.3.3 Analysis of a Co-Al-W-Ta Alloy ............................................................. 62
5.4 Conclusions ........................................................................................................... 66
5.5 References ............................................................................................................. 67

vi
CHAPTER 6 COARSENING OF γ’ PRECIPITATES IN NI-BASE ALLOYS ........................ 69
6.1 Introduction ........................................................................................................... 69
6.2 Materials and Methods .......................................................................................... 70
6.3 Coarsening Kinetics of γ’ Precipitates at 800°C ................................................... 71
6.3.1 Structural Evolution of γ’ Precipitates ...................................................... 71
6.3.2 The Kinetics of Precipitates Coarsening ................................................... 74
6.3.3 Temporal Evolution of Composition of Phases and Interface Profile ...... 75
6.4 Coarsening Kinetics of γ’ Precipitates at 650°C ................................................... 79
6.5 Conclusions ........................................................................................................... 82
6.6 References ............................................................................................................. 82 CHAPTER 7 FIELD EVAPORATION BEHAVIOR IN SUPERALLOYS .............................. 84
7.1 Introduction ........................................................................................................... 84
7.2 Materials and Methods .......................................................................................... 87
7.3 Results ................................................................................................................... 88
7.3.1 Effect of Orientation Offset ...................................................................... 88
7.3.2 Effect of Type of Material ........................................................................ 94
7.3.3 Effect of Temperature ............................................................................... 97
7.3.4 Effect of Crystallography .......................................................................... 98
7.4 Discussion ........................................................................................................... 103
7.5 Outlook ............................................................................................................... 105
7.6 Conclusions ......................................................................................................... 106
7.7 References ........................................................................................................... 107 CHAPTER 8 SITE OCCUPANCY DETERMINATION IN CO AND NI-BASE ALLOYS USING ATOM PROBE TOMOGRAPHY ................................................................................ 111
8.1 Introduction ......................................................................................................... 111
8.2 Materials and Methods ........................................................................................ 112
8.3 Results ................................................................................................................. 113
8.3.1 Site Occupancy in Cobalt-base Alloys ................................................... 113
8.3.2 Site Occupancy in Nickel-Base Alloys ................................................... 123
8.4 Conclusions ......................................................................................................... 126
8.5 References ........................................................................................................... 126

vii
CHAPTER 9 STRUCTURAL AND COMPOSITIONAL ANALYSIS OF γ/γ’ INTERFACES IN NI AND CO-BASE ALLOYS............................................................................................... 129
9.1 Introduction ......................................................................................................... 129
9.2 Background and Approaches .............................................................................. 130
9.3 Materials and Methods ........................................................................................ 131
9.4 Interface Analysis in a Co-Base Alloys .............................................................. 132
9.5 Interface Analysis in a Ni-Base Alloy ................................................................ 138
9.6 Discussion ........................................................................................................... 143
9.7 Conclusions ......................................................................................................... 144
9.8 References ........................................................................................................... 145 CHAPTER 10 CONCLUSION AND FUTURE WORK .......................................................... 147

viii
LIST OF TABLES
Page
Table 4.1: Comparison of the average γ’ precipitate sizes with annealing time for 800°C and 900°C ............................................................................................................................................ 36
Table 5.2 Measured composition of the alloys and their annealing conditions. ........................... 58
Table 5.3 Average compositions of the γ and γ′ phases calculated from 3DAP tomography. ..... 63
Table 6.4 Average alloy compositions and respective composition of γ and γ′ phases. ............. 74
Table 6.5 : Average alloy compositions and respective composition of γ and γ′ phases. ............ 79
Table 6.3 Temporal evolution of γ' size scale ............................................................................... 80
Table 8.7 : Average alloy compositions and respective composition of γ and γ′ phases. .......... 112

ix
LIST OF FIGURES
Page
Fig. 2.1 Materials distribution in a jet engine [2] ......................................................................... 10
Fig. 2.2 Binary Ni-Al phase diagram [3] ..................................................................................... 11
Fig. 2.3 Isothermal Section of Co-Al-W phase diagram at 900°C [5] .......................................... 13
Fig. 3.1 Schematic of evaporation process of a nano-scale tip in atom probe tomography ........ 23
Fig. 3.2 A schematic of a hemispherical atom probe tip with possible two possible arrangement of a set of atomic planes with a particular crystallographic direction .......................................... 25
Fig. 4.1 (a) Selected area diffraction (SAD) pattern along the <110> zone axis (b) the corresponding dark field image showing fine scale γ' precipitates ............................................... 32
Fig. 4.2 (a) Clipped APT reconstruction showing γ ' precipitates delineated with 10 at. % W isosurface (b) proximity histogram shows compositionally diffused γ/ γ ' interface with partitioning of elements (c) proxigram shows the solute content in γ matrix near the interface .. 33
Fig. 4.3 Typical γ- γ ' microstructure in Co-10Al-10W (at.%), subjected to various annealing period at both 800°C and 900 °C .................................................................................................. 35
Fig. 4.4 Proxigrams corresponding to 9 at. % W shows the partitioning across the γ/ γ ' interface in samples subjected to 1 and 4h of annealing at 900°C ............................................................... 37
Fig. 4.5 Proxigrams corresponding to 9 at. % W isosurface in samples subjected to 16 and 64 h. of annealing along with the APT reconstruction .......................................................................... 39
Fig. 4.6 Proxigram corresponding to 9 at. % W isosurface in samples subjected to isothermal annealing at 800°C with the corresponding APT reconstructions ................................................ 40
Fig. 4.7 (a) Plot of log (radius) vs. log (annealing time) for both 800°C and 900°C giving temporal growth exponent of γ' precipitates, which correspond to classical LSW growth exponent. (b) Plot showing linear fit of precipitate size (r3 in nm) vs. annealing time (t) during 800°C and 900°C along with respective LSW rate constants ....................................................... 44
Fig. 4.8 (a) Magnified SEM image with measured average inter-precipitate distance in the sample subjected to 256 h of annealing at 900°C (b) magnified SEM image with measured average inter-precipitate distance in the sample subjected to 256 h of annealing at 900°C ......... 48
Fig. 5.1 (a) Selected portion of an APT reconstruction with 7at. % W isosurface along with Co and W ions in Co-7at %Al-7at.%W alloy (b) Proxigram showing the composition profiles of Co, Al and W atom across γ/γ’ interfaces ............................................................................................ 60

x
Fig. 5.2 (a) Backscattered SEM micrograph showing γ + γ’ microstructure in Co-6.3Al-6.4W-18.1Ni (at. %) alloy, inset shows grain boundary precipitates (b) APT reconstruction showing γ’ precipitate delineated with 7at % W isosurface in γ matrix (c) Proxigram showing the compositional profile of Co, Al and W atoms across γ/ γ’ interfaces .......................................... 61
Fig. 5.3 (a) Backscattered SEM micrograph showing γ+γ’ microstructure in Co-8.4Al-4.7W-1.7Ta (at. %), inset shows grain boundary precipitates (b) APT reconstruction showing γ’ precipitates delineated with 7at % W isosurface in a γ matrix (c) Proxigram showing the composition profile of Al, W and Ta across the interfaces of primary γ’ precipitates (d) Proxigram showing the composition profile of Al, W and Ta across the interfaces of secondary γ’ precipitates. ................................................................................................................................... 63
Fig. 5.4 (a) Selected region (Blue) for 2D compositional contour calculation with 5at % W isosurface in Co-8.4Al-4.7W-1.7Ta (at. %) (b) Shows 2D composition contour maps with respect to Al (c) Selected region (Blue) for 2D compositional contour calculation with 7 at. % W isosurface in Co-6.3 Al-6.4 W-18.1 Ni (at. %) (d) Shows 2D compositional contour maps with respect to Al .................................................................................................................................. 65
Fig. 6.1 Isothermal sections of Ni-rich Ni-Al-Cr phase diagram ................................................. 71
Fig. 6.2 Centered Dark field micrographs showing γ’ in Ni-14Al-7Cr(at.%), isothermally aged at 800°C for (a) 0 h (b)0.25 h (c) 1 h (d) 4 h (e) 64 h and (f) 256 h conditions .............................. 72
Fig. 6.3 Particle size distribution for different ageing time (a) 0.25hr (b) 1 hr (c) 4 hrs (d) 256hrs and (e) Linear fit of precipitate size (nm) vs. cube root of annealing time ................................... 73
Fig. 6.4 APT reconstruction delineated with 14% Al iso-surface showing coalescence of γ’ in Ni-14Al-7Cr (at.%) isothermally aged at 800°C for (a) 0 h (b) 0.25 h (c)1 h (d)16 h (e) 64 h (f) 256 h......................................................................................................................................... 76
Fig. 6.5 Composition profile and interface width across γ/γ’ in Ni-14Al-7Cr(at.%) annealed at 800°C for (a) 0 h (b)0.25 h (c) 1 h (d) 16 h (e) 64 h and (f) 256 h ............................................. 78
Fig. 6.6 Centered Dark field micrographs showing γ’in Ni-14Al-7Cr(at.%), isothermally aged at 800°C for (a) 0 h (b)0.25 h (c) 1 h (d) 4 h (e) 64 h and (f) 256 h conditions .............................. 80
Fig. 6.7 Linear fit of precipitate size (nm) vs. cube root of annealing time ................................ 81
Fig. 6.8 Composition profile across γ/ γ ' interface in Ni-Al-Cr sample, annealed at 650°C for 256 h.............................................................................................................................................. 81
Fig. 7.1 (a) Backscattered SEM micrograph showing dispersion of spatially correlated γ’ precipitates in a γ matrix (b) EBSD pole figure showing that the dual-beam FIB lift-out is closer to <001> axis with an offset of 12° (c) the pre-final tip prepared using dual-beam FIB shows alignment of precipitates in the near vertical direction, off by ~12° (d) 2D desorption image show poles and zone lines with central <001> pole, having a four-fold symmetry (e) APT reconstruction show γ’ precipitates in a γ matrix which are 18° off to the <001> direction ........ 89

xi
Fig. 7.2 (a) EBSD pole figure showing that the grain, from which the the dual-beam FIB lift-out is prepared, is closer to <001> axis with an offset of 1 ° (b) the pre-final tip prepared using dual-beam FIB shows alignment of precipitates along <001> with minimal offset (c) 2D desorption image show poles and zone lines with central <001> pole, having an four-fold symmetry (d) APT reconstruction show a near horizontal γ-γ’ interface. ........................................................... 91
Fig. 7.3 (a) Schematic of a L12 ordered precipitate, Co3(Al, W) showing the arrangement of element in alternating planes along <001> direction (b-c) lattice planes of Co and (Al + W) atoms respectively in a region down the [002] pole in a APT reconstruction for Co -10Al-10W (at %) sample having an offset of 12° to <001> direction (d) Z- Spatial distribution map (SDM) for Co-Co interactions showing lattice planes of Co along <001> direction which are 0.4 nm widely spaced (e) lattice planes of Co atoms in a region down the <001> pole in a APT reconstruction for Co-10Al-10W sample having an offset of 1 ° to <001> direction (f-g) z-SDMs for Co-Co interactions showing lattice planes of Co along <001> direction for samples evaporated at 60 K and 40 K (In both cases, the unstable pure Co atoms planes are missing) .... 93
Fig.7.4 Lattice plane and corresponding SDMs of Ni and Co ions in Ni-14Al-7Cr and Co-10Al-10W (at. %) alloys respectively .................................................................................................... 96
Fig. 7.5 The arrangement of atomic planes of Ni down the [002] pole at various temperature of operation while keeping other experimental conditions same ...................................................... 99
Fig. 7.6 Backscattered SEM micrograph showing dispersion of spatially correlated γ’ precipitates in a γ matrix (b) EBSD pole figure showing the dual-beam FIB lift-out to be closer to <001> axis with an offset of 2° (c) the pre-final tip prepared using dual-beam FIB shows alignment of precipitates along <001> with an offset of 2° (d) 2D desorption image show poles and zone lines with central [002] pole, having an fourfold symmetry (e) APT reconstruction show γ’ precipitates in a γ matrix where the interface is nearly horizontal (f) Lattice planes of Co atoms in a region down the <001> pole in a APT reconstruction for Co-10Al-10W-2Ta (at %) sample having an offset of 2° to <001> direction (g) Z- Spatial distribution map (SDM) for Co-Co interactions showing lattice planes of Co along <001> direction which are 0.4 nm widely spaced .......................................................................................................................................... 101
Fig. 7.7 EBSD pole figure showing the dual-beam FIB lift-out to be closer to <111> axis (b) the pre-final tip prepared using dual-beam FIB shows alignment of precipitates (c) 2D desorption image show poles and zone lines with central <111> pole, having an six-fold symmetry (d) APT reconstruction show γ’ precipitates in a γ matrix (e) Lattice planes of Co atoms in a region down the <111> pole in a APT reconstruction for Co-10Al-10W-2Ta (at %) sample (f) z-spatial distribution map (SDM) for Co-Co interactions showing lattice planes of Co along <111> direction which are about 0.2 nm widely spaced. ...................................................................... 102
Fig. 8.1 Backscattered SEM micrograph showing the γ + γ’ microstructure in Co-10Al-10W, Co-10Al-10W-2 Ta and Co-10Al-10W-3Ta (all in at. %) alloys. .............................................. 113
Fig. 8.2 (a-b) APT reconstructions with only Al and W ions respectively to show the partitioning behavior and identification of accurate γ/γ’ interface in Co-Al-W alloy (c) APT reconstruction
xii
showing γ′ precipitates delineated with a 9 at.% W isosurface in a γ matrix (d) proxigram showing the composition profiles of solutes across the γ/γ’ interface ........................................ 115
Fig. 8.3 a) Schematic of a L12 ordered precipitate, Co3(Al, W) showing the arrangement of element in alternating planes along <001> direction (b) Planar reconstructions showing atomic planes down the analysis axis which is closer to <001> crystallographic direction for Co-10Al-10W (at. %) alloy (c) xz- Spatial distribution map (xy-SDM) for Co showing the mixed planes along <001> direction which are 0.4 nm widely spaced (d) Z- Spatial distribution map (SDM) for Co showing the peaks of mixed planes along <001> direction which are 0.4 nm widely spaced .......................................................................................................................................... 117
Fig. 8.4 (a) Proximity histogram showing the composition profiles of solutes across the γ/γ’ interface for Co-10Al-10W-2Ta (at. %), along with respective APT reconstructions. (b) Planar reconstructions showing atomic planes down the analysis axis which is closer to <001> crystallographic direction............................................................................................................ 119
Fig. 8.5 (a) Proximity histogram showing the composition profiles of solutes across the γ/γ′ interface for Co-10Al-10W-3Mo (at. %), along with respective APT reconstructions. (b) Planar reconstructions showing atomic planes down the analysis axis which is closer to <001> crystallographic direction............................................................................................................ 121
Fig. 8.6 (a) Backscattered SEM micrograph of Ni-14Al-7Cr (at %) showing γ’ precipitates in a γ matrix (b) EBSD pole figure showing the dual-beam FIB lift-out to be closer to <001> axis with an offset of 2° (c) the pre-final tip prepared using dual-beam FIB shows alignment of precipitates along <001> direction with minimal offset (d) 2D desorption image show poles and zone lines with central <001> pole, having an four-fold symmetry ............................................................ 124
Fig. 8.7 (a) A schematic of Ni3Al structure (b) Lattice planes of Al atoms in a region down the <001> pole in an APT reconstruction for Ni-14Al-7Cr (at %) sample (c) xz- Spatial distribution map (SDM)s for Ni-Ni, Al-Al and Cr-Cr interactions, down the analysis axis (d) z- SDM for Ni-Ni, Al-Al and Cr-Cr interactions along <001> direction in the γ’ precipitate ............................ 125
Fig. 8.8 1-D composition profile along <001> direction within a γ' precipitate ........................ 126
Fig. 9.1 Concentration profile across the coherent (100) γ / γ’ interface obtained by Monte Carlo simulations at 700 K. .................................................................................................................. 130
Fig. 9.2 (a) STEM image showing typical γ + γ ' microstructure in Co-10Al-10W (at. %) alloy, subjected to 64 h of isothermal annealing at 900°C (b) HRSTEM image along <001> zone showing the interface between γ and γ’ phase (c) a schematic of L12 Co3(Al, W) structure ..... 133
Fig. 9.3 (a) A clipped region of HRSTEM image for interface analysis (b) the plot between average atomic column intensity with corrosponding distance in the HRSTEM image (c) a plot of progressive column intensity vs. corrosponding distance in the HRSTEM image ................ 134
Fig. 9.4 (a) EBSD pole figure showing that the grain, from which the dual-beam FIB lift-out is prepared, is closer to <001> axis with an offset of 1 ° (b) the pre-final tip prepared using dual-

xiii
beam FIB shows alignment of precipitates along <001> with minimal offset (c) 2D desorption image shows poles and zone lines with central <001> pole, having an four-fold symmetry (d) APT reconstruction shows a near horizontal γ- γ’ interface (e) Proxigram shows the compositional width of the interface in Co-10Al-10W (at. %) alloy ........................................ 136
Fig. 9.5 (a) STEM image showing typical γ +γ’ microstructure in Co-10Al-10W (at. %) alloy, subjected to 64 h of isothermal annealing at 900 C (b) HRSTEM image along <001> zone showing the interface between γ and γ’ phase (c) a schematic of L12 Co3(Al, W) structure ..... 139
Fig. 9.6 (a) A clipped region of HRSTEM image for interface analysis (b) the plot between average atomic column intensity with corresponding distance in the HRSTEM image (c) a plot of progressive column intensity vs. corresponding distance in the HRSTEM image ..................... 140
Fig. 9.7 (a) EBSD pole figure showing the dual-beam FIB lift-out to be closer to <001> axis with an offset of 2° (b) the pre-final tip prepared using dual-beam FIB shows alignment of precipitates along <001> direction with minimal offset (c) 2D desorption image shows pole and zone lines with central [002] pole, having an four-fold symmetry (d) APT reconstruction shows a near horizontal γ- γ’ precipitate (e) Proxigram shows the compositional width of the interface as 2.6 nm. ........................................................................................................................................ 142

1
CHAPTER 1
INTRODUCTION
1.1 Background
The higher efficiency of an engine at higher operating temperature serves as the scientific
basis for development of high-performance materials such as superalloys [1]. The vital criteria in
terms of material selection are the high temperature stability with respect to mechanical stress
along with environmental extremes. The secret to high performance of precipitate strengthened
superalloys lies in the natural formation of homogeneously distributed, stable ordered γ’
precipitates, which possess lattice coherency with the face centered cubic matrix [1]. Further, the
high temperature capabilities of these alloys are increased by thermal barrier coatings and
intentionally developed oxide layers on surface help in high temperature oxidation resistance
[2-4]. Nickel based superalloys have found applications in the hot section of jet engines,
industrial gas turbines etc.
The continuous effort on alloy design has produced various generations of superalloys,
with enhanced high temperature durability, over the time. The key factors, based on
thermodynamics and kinetics principles, for alloy development are enhanced γ’ precipitate
solvus temperature, reduced diffusivity of solute elements and better phase stability of γ’
precipitates [5]. There has been a substantial amount of effort directed towards the development
of single crystal superalloys to eliminate high temperature microstructural instability at grain
boundaries, which find specific application for turbine blade of aircrafts [6-7]. Along with
extensive experimental works, simulations like phase field modeling give insights to the whole
regime of nucleation, growth and coarsening of γ’ precipitates. With increase in the size scale of
these precipitates and change in the shape, elastic stress start to increase between the phases and

2
that leads to microstructural degradation, also this effect is severe in case of external applied
stress. Hence, the microstructural degradation during coarsening of precipitates has been a
classical problem for these alloys in service. Ostwald ripening, which is the classical mechanism
of precipitate coarsening, assumes that the diffusion of solute through the matrix is the rate-
limiting step during the coarsening of the precipitates [8-15]. The other factors influencing the
coarsening mechanism are the chemistry and morphology of the precipitates, including the
chemical gradients across the interfaces. A new coarsening model has been recently proposed
where diffusion of solute atoms through the diffuse and partially ordered γ/γ’ interface is
considered the rate-limiting step. This model has been designated as trans-interface diffusion
controlled (TIDC) coarsening model [16-19]. There is experimental evidence which supports the
TIDC coarsening [20, 21]. While many investigators have performed outstanding research in
attempts to develop an understanding of the role of interface on coarsening mechanisms and
kinetics, their efforts have been limited by the sophistication of the materials characterization
tools available at the time the research was conducted. Despite the recent development of better
and more advanced characterization tools, the dependency of coarsening on the atomic scale
nature of the interface in rather poorly understood.
The prolonged hunt for an alternative of Ni base superalloys with superior traits has
gained hope after the recent discovery of Co-Al-W based (or in general cobalt-base alloys) [22],
which readily form high temperature γ’ precipitates, similar to Ni base superalloys [23-24].
Although Co-base alloys typically exhibit higher solidus and liquidus temperature than Ni-base
superalloys, there have been continuing efforts towards increasing the γ’ precipitates solvus
temperature for energy-efficient applications [25-28]. With better wear resistance than Ni base
alloys, Co-base alloys have already been commercialized and have found application as a tool
3
material for the friction stir welding (FSW) process [29]. With a wide scope of alloy
development in γ/γ’ Co-base alloys, there is extensive research taking place across globe to
enhance its high temperature operational capability [30-39]. With a limited current progress in
this new class of superalloy, the high temperature properties are comparable with only that of
first generation of Ni- base superalloys.
1.2 Motivation and Aim
The principal motivation of this work is to investigate in detail the role of structural and
compositional gradients across the precipitate/matrix interface on the coarsening behavior of
coherent precipitates in both Ni and Co-base superalloys. This investigation is expected to have a
direct impact on the accelerated development of high temperature metallic alloys.
Recent experimental studies involving the coupling of high angle annular dark-field high
resolution scanning transmission electron microscopy (HAADF-HRSTEM) with atom probe
tomography (APT), has revealed that the order/disorder interface in a nickel base alloys is not
atomically abrupt but has a transition width, in agreement with prior atomistic simulations [41-
42]. The observation of two interfacial widths, one corresponding to a structural order-disorder
transition, and the other to the compositional transition across the interface, raises fundamental
questions regarding the definition of the interfacial width in such systems. The key
microstructural parameters such as lattice misfit and coherency strains, which control the
coarsening rate of γ’ precipitates are directly related to the structural and compositional
diffuseness of the interface. Thus, the strengthening mechanisms and deformation behavior at
elevated temperatures are directly related to the atomic scale behavior across these interfaces.
The atomic-scale knowledge of structure and chemical composition is vital for a fundamental
4
physically-based understanding of these interfaces and for subsequently resolving the
controversy regarding the atomistic mechanism of precipitate coarsening.
Although there have been some studies [28, 40], where Ni is added to Co base alloys
progressively or vice-versa and changes in properties are realized, but the corresponding
comprehensive atomistic structure –property correlation providing critical inputs for further alloy
development is still lacking. So, the ultimate goal of this work is to compare and contrast the Co
and Ni superalloys and also, to accommodate atomic scale information related to transitions
across interfaces to coarsening models for a better practical applicability of coarsening laws to
various alloys.
1.3 Thesis Structure
This thesis consists of ten chapters, focused on coarsening kinetics of γ’ precipitates in
Nickel and Cobalt superalloys and their characterization using advanced tools. The introductory
chapter describes the motivation and ultimate goal of this work with practical scope of novel
characterization methods.
The chapter 2 consists of comprehensive literature review of precipitate coarsening
behavior and their applications to coherent precipitates in superalloys. It also gives an overview
of novel Co-base γ- γ’ alloys and the importance of atomic scale information in determining the
coarsening behavior.
The methodology, used in this study, has been described in chapter 3. With brief
introduction on every processing and characterization tools, this chapter introduces a novel,
reproducible characterization method of crystallographic study of ordered phase by correlative
microscopy.

5
The chapter 4 describes a comprehensive coarsening kinetics of γ’ prime precipitates in
Co-base superalloys. Based on information on isothermal annealing at 800°C and 900°C, this
study has, for the first time, obtained critical coarsening parameters in Cobalt base alloys. Apart
from this, it has incorporated atomic scale compositional information across the γ/γ’ interfaces
into classical Cahn-Hilliard model for a better model of coarsening kinetics.
The chapter 5 gives brief overview of the solute partitioning and site preference in γ’
precipitates in newly discovered Co-base superalloys. It also demonstrates the solute segregation
at interface in one of the alloys.
The coarsening of γ’ precipitates in Ni-base superalloy have been included in chapter 6.
With the details of isothermal annealing at 650° C and 800° C, this study discusses the
importance of temporal evolution of the compositional width of the γ/γ’ interfaces to the
coarsening kinetics of γ’ precipitates.
The chapter 7 consists of the details of field evaporation behaviors of superalloys in atom
probe tomography. This chapter discusses the different parameters which affect the spatial
resolution in characterization of superalloys. The site occupancy of solute atoms in γ’
precipitates in Co and Ni superalloys have been determined, by utilizing the outcome of these
analyses and are presented in chapter 8.
The chapter 9 advanced the understanding of the role of interface on coarsening
mechanisms and kinetics, by utilization of advanced materials characterization tools like
HAADF-HRSTEM and APT. The comparative interface analysis in Co and Ni superalloy shows
significant differences, which gives insights to the coarsening behaviors of γ’ precipitates in
these alloys. Chapter 10 summarizes the results and gives future prospective to the present work.

6
1.4 Publications
This thesis is largely a compilation of multiple published papers in peer-reviewed
journals including some recent ones that have been submitted and are presently under review.
• S. Meher, H.Y. Yan, S. Nag, D. Dye, R. Banerjee: Solute Partitioning and Site Preference in γ/γ′ Cobalt-base alloys, Scripta Materialia, 67 (2012) p 850-853
• S. Meher, S. Nag, J. Tiley, A. Goel, R. Banerjee: Coarsening kinetics of γ′ precipitates in cobalt-base alloys, Acta Materialia, 61 (2013) p 4266-4276
• S. Meher, T. Rojhirunsakool, J.Y. Hwang, S. Nag, J. Tiley, R. Banerjee: Coarsening Behavior of Gamma Prime Precipitates and Concurrent Transitions in the Interface Width in Ni-14 at.% A1-7 at.% Cr, Philosophical Magazine Letters, 93 (2013) p 521-530
• S. Meher, R. Banerjee: Partitioning and Site Occupancy of Ta and Mo in Co-base γ/γ' alloys studied by Atom Probe Tomography, Intermetallics, 49 (2014) p 138-142
• S. Meher, P. Nandwana, T. Rojhirunsakool, J. Tiley, R. Banerjee: Probing the crystallography of ordered phases by coupling of orientation microscopy and atom probe tomography, submitted to Ultramicroscopy
1.5 References
[1] R.C. Reed, The Superalloys, Fundamentals and Applications, Cambridge University Press, 2006.
[2] N. Padture, M. Gell, E. H. Jordan, Science, 296, (2002) 280-284
[3] S. Hao, X. Zhang, X. Mei, T. Grosdidier, C. Dong, Materials Letters, 62 (2008) 414-417
[4] D.R. Clarke, C.G.Levi, Annu. Rev. Mater. Res. 33(2003) 383-417
[5] P. Caron, The Minerals, Metals & Materials Society, (2000),727-746
[6] P.Caron, T.Khan, Aerospace Sci. and Tech. 3(1999) 513-523
[7] M.gaumann, C. Bezencon, P. Canlsi, W. Kruz, Acta Mat. 49(2001) 1051-1062
[8] I.M. Lifshitz and V.V. Slyozov, J. Phys. Chem. Solids 19 (1961) p.35.
[9] C. Wagner, Z. Elektrochem. 65 (1961) p.581.
[10] C.K.L. Davies, P. Nash and R.N. Stevens, Acta Metall. 28 (1980) p.179.

7
[11] A.J. Ardell, Acta Metall. 20 (1972) p.61.
[12] A.J. Ardell and R.B. Nicholson, J. Phys. Chem. Solids 27 (1966) p.1793.
[13] P.W. Voorhees, J Stat Phys 38(1985) 231
[14] D. McLean, Met. Sci. 18 (1984) p.249.
[15] A.J. Ardell, Scr. Metall. Mater. 24 (1990) p.343
[16] A.J. Ardell and V. Ozolins, Nat. Mater. 4 (2005) p.309.
[17] A.J. Ardell Scr Mater 66 (2012) 423.
[18] A.J. Ardell, Acta Mater, 61(2013),7749-7754
[19] A.J. Ardell, Acta Mater, 61(2013),7828-7840
[20] J. Tiley, G.B. Viswanathan, R. Srinivasan, R. Banerjee, H.L. Fraser, Acta Mater. 57(2009) 2538.
[21] C.G. Garay-Reyes, F.H. Santiago, N.C. Castro, V.M. Lopez-Hirata, J.G. Rocha, J.L.H. Rivera, H.J.D. Rosales, J.J. Cruz-Rivera, Materials Charac. 83(2013) 35-42
[22] J. Sato,T. Omori, K. Oikawa, I. Ohnuma, R. Kainuma, K. Ishida, Science 312(2006) 90.
[23] A. Bauer, S. Neumeier, F. Pyczak, M. Goken, Scripta Mater. 63 (2010) 1197.
[24] A. Suzuki, T.M. Pollock, Acta Mater. 56 (2008) 1288.
[25] M. Titus, A. Suzuki, T.M. Pollock, Scripta Mater. 66 (2012) 574.
[26] G. Feng, H. Li, S.S. Li, J.B. Sha, Scr Mater 67(2012) 499.
[27] K. Tannaka, M. Ooshima, N. Tsuno, A. Sato, H. Inui, Phil. Mag., 92 (2012) 4011-4027.
[28] K. Shinagawa, T. Omori, J. Sato, K. Oikawa, I. Ohnuma, R. Kainuma, K. Ishida, Mater. Trans. 49 (2008) 1474.
[29] S. Park, S. Hirano, S. Imano, J. Sato, H. Kokawa, Y. Sato, K. Ishida, T. Omori, (2013) US Patent publication no. US8408444 B2
[30] Y.J. Wang, C.Y. Wang, Appl Phys Lett 94(2009) 261909.
[31] S. Meher, H.Y. Yan, S. Nag, D. Dye, R. Banerjee, Scr. Mater. 67 (2012) 850-853.
[32] S. Meher, S. Nag, J. Tiley, A. Goel, R. Banerjee, Acta Materialia. 61 (2013) 4266-4276.

8
[33] P.J. Bocchini, E.A. Lass, K. Moon, M.E. Williams, C.E. Campbell, U.R. Kattner, D.C. Dunand, D.N. Seidman, Scr. Mater. 68 (2013) 563-566.
[34] J.E. Saal, C. Wolverton, Acta Mater. 61(2013), 2330-2338.
[35] T.M. Pollock, J. Dibbern, M. Tsunekane, J. Zhu, A. Suzuki, J Mater 62(2010) 58.
[36] H.Y. Yan, V.A. Vorontsov, J. Coakley, N.G. Jones, H.J. Stone, D. Dye, Superalloys 78(2012) 705.
[37] H.-Y. Yan, V.A. Vorontsov, D. Dye, Intermetallics, 48(2014) 44-53
[38] S. Meher, R. Banerjee, Intermetallics, 49 (2014) 138-142
[39] A. Heckl, S. Neumeier, M.Goken, R.F. Singer Mat Sci. and Engg. A 528 (2011) 3435-3444
[40] A. Suzuki, M.F. X. Gigliotti, (2002) US Patent Application No. 20100291406 A1
[41] Y. Mishin, Acta Mater.52(2004) 1451 -1467
[42] R. Srinivasan, R. Banerjee, J.Y. Hwang, G.B. Viswanathan, J. Tiley and H.L. Fraser, Phys.
Rev. Lett. 102 (2009) p.086101.
9
CHAPTER 2
LITERATURE REVIEW
2.1 The Concept of Superalloys
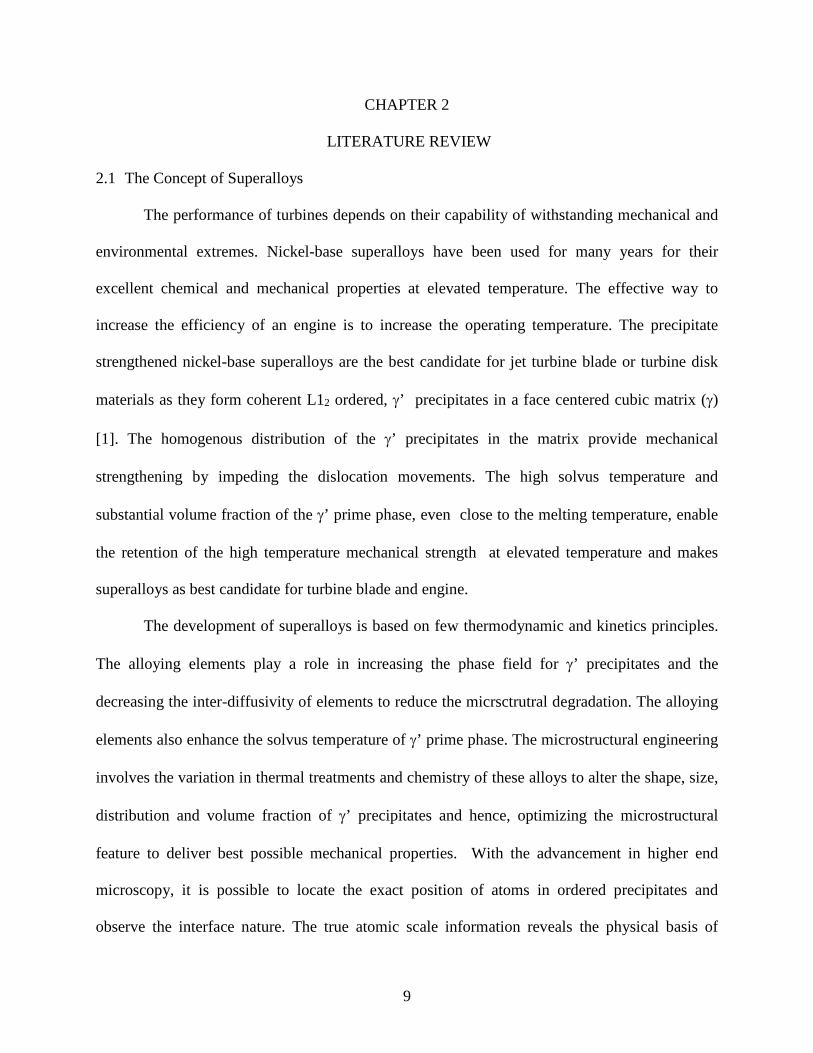
The performance of turbines depends on their capability of withstanding mechanical and
environmental extremes. Nickel-base superalloys have been used for many years for their
excellent chemical and mechanical properties at elevated temperature. The effective way to
increase the efficiency of an engine is to increase the operating temperature. The precipitate
strengthened nickel-base superalloys are the best candidate for jet turbine blade or turbine disk
materials as they form coherent L12 ordered, γ’ precipitates in a face centered cubic matrix (γ)
[1]. The homogenous distribution of the γ’ precipitates in the matrix provide mechanical
strengthening by impeding the dislocation movements. The high solvus temperature and
substantial volume fraction of the γ’ prime phase, even close to the melting temperature, enable
the retention of the high temperature mechanical strength at elevated temperature and makes
superalloys as best candidate for turbine blade and engine.
The development of superalloys is based on few thermodynamic and kinetics principles.
The alloying elements play a role in increasing the phase field for γ’ precipitates and the
decreasing the inter-diffusivity of elements to reduce the micrsctrutral degradation. The alloying
elements also enhance the solvus temperature of γ’ prime phase. The microstructural engineering
involves the variation in thermal treatments and chemistry of these alloys to alter the shape, size,
distribution and volume fraction of γ’ precipitates and hence, optimizing the microstructural
feature to deliver best possible mechanical properties. With the advancement in higher end
microscopy, it is possible to locate the exact position of atoms in ordered precipitates and
observe the interface nature. The true atomic scale information reveals the physical basis of

10
superalloys and provide scientific pathway for tailoring the properties and subsequent
development of superalloys. The atomic structure and their influence on physical properties will
also accelerate the development of newly discovered cobalt-base γ- γ’ alloys.
Fig. 2.1 Materials distribution in a jet engine [2]
2.2 Precipitate Strengthened Superalloys
Current turbine blade and polycrystalline turbine disk are based on Ni-Al based
multicomponent alloys [1]. Al is the main alloying element which promotes the precipitation of
order γ’ phase in the γ phase. The phase diagram of binary Ni-Al show the composition range,
where the γ+ γ’ phase field occur [3]. In this binary alloy, the γ+ γ’ phase field is narrow at
higher temperature. The γ +γ’ phase field is substantially increased, with the addition of Cr to Ni-
Al, as reported earlier [4].

11
Fig. 2.2 Binary Ni-Al phase diagram [3]
2.2.1 Structure and Chemistry of the γ’ Phase
The Ni-rich γ matrix is a disordered solid solution, which is face centered cubic in
structure. The γ’ phase which precipitate out homogenously in γ matrix is L12 ordered in nature.
The γ’ phase, with pm3�m space group, is essentially cubic in structure, where Ni occupies the
face center position and Al occupies the corners, giving the stoichiometry of Ni3Al. Due to very
less difference in lattice parameter of these phases, the precipitates exhibits a cube-cube
orientation with the γ matrix, where {100} γ // {100} γ’ and <010> // <010> γ’. Under the
practical high temperature mechanical stress during operation, the strength of the alloy is
retained by the formation of superdislocation in γ’ precipitates. The coherency strengthening and
yield strength anomaly, imparted by γ’ precipitates, favors superalloys as the high-temperature
materials. Depending on thermal treatment condition and degree of solute supersaturation, there

12
is possibility of different size scale of γ’ precipitate distribution in the γ matrix. The peculiar way
of size distribution of small secondary γ’ precipitate within the inter-precipitate distance of
primary γ’ precipitates, enhance the resistance of dislocation motion through small precipitates
and effective mechanical strength of the alloy increases.
Towards the development of superalloy for higher capability, suitable alloying elements
are added to increase the solvus temperature and reduce solute diffusivity in the matrix at high
temperature. Cobalt, chromium, molybdenum, rhenium etc. are found to partition towards γ
matrix, while aluminum, tantalum, titanium, niobium etc. are γ’ phase stabilizers. Moreover,
trace amount of boron, carbon etc. leads to grain boundary strengthening [5].
2.3 Novel Cobalt-base γ - γ’ Alloys
The conventional Cobalt-base alloys possess promising oxidation and wear resistance.
But the ordered L12 γ’ strengthened Co-base superalloy, which resemble Ni superalloy in
microstructure, was discovered recently by Sato et. al [6]. Co-base system form closed-packed
structure like Co3W in Co-W binary alloy, which has DO19 structure [7]. Co-Al system forms
metastable Co3Al, which has L12 structure [8, 9]. So, it has been found that, with addition of W
in Co-Al binary, it forms stable L12 precipitate with Co3(Al, W) chemistry. The Co-Ge-Al based
alloy also form stable L12 Co3(Ge,Al) precipitates [10].The ternary Co-Al-W phase diagram,
shown in Figure 2.3, indicates a very small γ + γ’ phase field [5]. This phase field has been
expanded by addition of Ni in Co-Al-W base alloys [11].
The higher γ’ solvus temperature is critical for creep strength of superalloys. The alloy additions
like Ta, Ti, Nb, V etc. increase the volume fraction and solvus temperature of γ’ precipitates
[12]. The mechanical properties of Co-base have been studies extensively [13-15].The

13
quaternary Co-Al-W-Ta which has been found to possess best mechanical strength among other
quaternary, form a/2 <101> dislocations and γ’ precipitates are sheared by a/3<112>
superpartials [13]. These superpartial, resulting from reactions of a/2 <101> dislocations in the
matrix or the interface, form superintrisic stacking fault (SISF).
There has been research on effect of trace elements in Co-superalloys. Boron has been
found to accumulate in the inner oxide layer, which improve the oxidation adhesion [16]. Boron
also improves the grain boundary fracture as well as the ductility [17].
Fig. 2.3 Isothermal Section of Co-Al-W phase diagram at 900°C [5]
2.4 Coarsening of Precipitates
According to Gibbs-Thompson theory, the small particles in the system have higher
surface area to volume ratio, as compared to that of larger particles and they increases solute
solubility in the system higher than the equilibrium value. Under thermodynamic consideration, a
T = 900°C

14
driving force rises for release of excess interfacial energy by dissolution of smaller particle in the
matrix and increase in the size of larger particle. This whole phenomenon is called as coarsening
of particles.
The classical coarsening theory by Lifshitz and Slyozov [18] and Wagner [19],
collectively known as LSW theory, has served as the basis of modified coarsening models. LSW
theory has some assumptions as follow:
(i) Both the phases present in the systems are dilute solutions, and their thermodynamics can be explained by a dilute solution model
(ii) The volume fraction of the precipitate phase is close to zero so that there is no inter-precipitate interactions
(iii) The system is at equilibrium stage where there is no solute supersaturation
Based on these assumptions, The LSW theory concludes the following temporal laws:
r3 − r03 = Kr. t (1)
NV − NV,0 = KN. t−1 (2)
△ C −△ C0 = KC. t−1/3 (3)
where r is the mean particle size at time t, ro is the mean particle size at annealing time, t = 0 and
Kr =coarsening rate constant. Similarly, NV is the number density of precipitates and △C is
the change in solute supersatuaration in the matrix. KN and KC are the rate constants for number
density and solute supersaturation respectively.
The rate constant of precipitate coarsening in LSW theory is given by,
Kr = 8DσCeVm9RT
(4)
where D is the diffusion coefficient of solute in the matrix, Ce is the solubility (in atomic
fraction) of solute in equilibrium with the precipitate, σ is the precipitate/matrix interfacial

15
energy, Vm is the molar volume of the precipitate, R is the universal gas constant and T is the
absolute temperature.
Over the course of time, the classical LSW theory has been modified to be more reliable
to real system with finite volume fraction. Calderon et al. [20] has incorporated the effect of
volume fraction of precipitate in coarsening behavior and has modified the basic rate constant
equation, for a ideal solution, as follow:
K = 8DCe(1−Ce )Vmσ
9RT(Ceγ′−Ce)2
(5)
Ceγ’ is the equilibrium solubility of W in the γ’ precipitates and the other parameter has same
meaning as above.
For non-ideal solution, Davies et al. has given the following equation [21]:
K = 8DCeVmσ
9Gγ′′(Ceγ′−Ce)2
(6)
𝐺𝐺𝛾𝛾′′ is the double derivative of free energy of the matrix with respect to composition and the other
parameter has same meaning as above.
2.5 Factors Affecting Coarsening
There are some additional factors, which are ignored in classical LSW theory, can
influence the microstructure depending on the alloy system. These factors are explained below.
2.5.1 Volume Fraction of Precipitates
The classical LSW theory considers no overlap of diffusion field between the precipitates
but in real alloy systems, volume fraction of precipitates is usually more than 60 percent. So this
LSW assumption does not hold true, as there is possibility of overlap of diffusion field at high

16
volume fraction. There has been various researches which has largely found that the volume
fraction does not have effect on the temporal coarsening rate (r3 α t) and (number density of
precipitates α t-1), but the Particle size distribution (PSD) broadens than that predicted by
classical theory [21]. In many solid solutions, the high volume fraction of precipitates, leads to
joining of precipitates and this phenomenon is known as coalescence. But, this coalescence is
somewhat restricted in ordered precipitates due to presence of anti-phase boundaries (APB). In
Ni-Al alloy, there is 0.25 probability of γ’ precipitate are out of phase. As the interfacial energy
of these coherent precipitates are very small (~ 10 mJ/m2) [22] as compared to that of the APB
(~220 mJ/m2) [23], it is very unlikely that γ’ precipitates will coalescence to each other due to
high volume fraction.
2.5.2 Elastic Interactions
Ni superalloys are elastically inhomogeneous due to difference in elastic constant
between γ’ precipitates and the matrix. Due to this inhomogeneity in elastic constant the
precipitates align themselves along elastically soft <001> direction, when they have high volume
fraction. Because of elastic interactions, coupled with the lattice mismatch effect, the γ’
precipitates form rafted microstructure under application of external stress [24].these
observations can be rationalized by the reduction of the total energy of the system. The
interaction energy can arise due to lattice misfit, difference in elastic modulus of precipitate and
matrix, precipitate orientation with respect to crystallographic direction, size of precipitates and
inter-precipitate distances [25].

17
2.6 Role of Order-Disorder Interfaces in Coarsening Mechanism
The experimentally observed volume fraction independent coarsening kinetics in Ni
superalloy has been explained recently by Ardell–Ozolins [26] is called trans-interface diffusion-
controlled (TIDC) theory. The diffusion of solute atoms is much slower in the ordered phase than
in the disordered phase. As the order-disorder interface between γ’ precipitate and γ matrix has
been shown to be diffuse and partially order both experimentally and by simulations, it can act
as a barrier to diffusion of solute from matrix to precipitate and can be the rate limiting factors.
The kinetics in TIDC theory is different than that observed in classical LSW theory. The
temporal coarsening rate and the solute depletion rate are shown below:
r2 − r02 = Kr. t (7)
△ C −△ C0 = KC. t−1/2 (8)
All the parameters has same meaning to equation 1-3.
There are some recent experimental observations in Ni-base alloys, where the coarsening of γ’
precipitates follow TIDC theory [27, 28].
2.7 References
[1] R.C. Reed, The Superalloys, Fundamentals and Applications, Cambridge University Press, 2006.
[2] http://www.globalspec.com/reference/30804/203279/chapter-6-superalloys
[3] M. F. Singleton, J. L. Murray, and P. Nash, ASM Handbook, 10th ed. ASM
International: Materials Park, OH, 1990.
[4] C.K. Sudbrack, K. E. Yoon, R.D. Noebe, D.N. Siedman Acta Mater. 54 (2006) 3199-3210
[5] C.T. Sims, N.S. Stolo, W.C. Hagel. Superalloys II: High temperature materials for aerospace and industrial power. John Wiley & Sons, 2nd edition 1987
[6] J. Sato, T. Omori, K. Oikawa, I. Ohnuma, R. Kainuma, K. Ishida, Science 312(2006) 90.

18
[7] S. V. Nagender Naidu, A. M. Sriramamurthy, P. Rama Rao, in Binary Alloy Phase Diagrams, T. B. Massalski et al., Eds. (ASM International, ed. 2, 1970), pp. 1257–1259.
[8] A. J. Bradley, G. C. Seager, J. Inst. Met. 64, 81 (1939).
[9] O. S. Edwards, J. Inst. Met. 67, 67 (1941).
[10] H.Chinen, J.Sato, T.Omari, I. Ohnuma, R. kainuma, K. Ishida, Scripta Mate. 56 (2006) 141-143
[11] K. Shinagawa, T. Omori, J. Sato, K. Oikawa, I. Ohnuma, R. Kainuma, K. Ishida, Mater. Trans. 49 (2008) 1474.
[12] F. Pyczak, A. Bauer, M. Goken, S. Neumeier, U . Lorenz, M. Oehring, N. Schell, A. Schreyer, A. Stark, F. Symanzik, Mat Sci. &Engg. A 571 (2013) 13-18
[13] A. Suzuki, T.M. Pollock, Acta Mater. 56 (2008) 1288.
[14] M. Titus, A. Suzuki, T.M. Pollock, Scripta Mater. 66 (2012) 574.
[15] K. Tannaka, M. Ooshima, N. Tsuno, A. Sato, H. Inui, Phil. Mag., 92 (2012) 4011-4027.
[16] L. Klein, Y. Shen, M.S. Killian, S. Virtanen Corrosion Sci. 53 (2011) 2713-2720
[17] K. Shinagawa, T. Omori, K. Oikawa, R. Kainuma, K. Ishida Scripta Mat. 61 (2009) 612-615
[18] I.M. Lifshitz and V.V. Slyozov, J. Phys. Chem. Solids 19 (1961) p.35.
[19] C. Wagner, Z. Elektrochem. 65 (1961) p.581.
[20] H.A. Calderon HA, P.W. Voorhees PW, J.L. Murray JL, G. Gkostorz G, Acta Metall., 42, 991(1994)
[21] C.K.L. Davies, P. Nash, R.N. Stevens, Acta Metall. 28 (1980) 179
[22] C.K.L. Davies, P.Nash, R.N. Stevens, J. Mater. Sci. 15 (1980) 1521
[23] F.A. Flinn, Trans. AIME 218 (1960) 145
[24] R.A. Mackay, L. J. Ebert., Met Trans. 16A (1985) 1969
[25] G. Muralidharan, H. Chen, Sci & Tech. of Adv. Mat. 1 (2000) 51-62
[26] A.J. Ardell and V. Ozolins, Nat. Mater. 4 (2005) p.309.
[27] J. Tiley, G.B. Viswanathan, R. Srinivasan, R. Banerjee, H.L. Fraser, Acta Mater. 57(2009) 2538.

19
[28] C.G. Garay-Reyes, F.H. Santiago, N.C. Castro, V.M. Lopez-Hirata, J.G. Rocha, J.L.H. Rivera, H.J.D. Rosales, J.J. Cruz-Rivera, Materials Charac. 83(2013) 35-42

20
CHAPTER 3
METHODS AND TECHNIQUES
3.1 Alloy Preparation
For better physical understanding of superalloys, representative model alloys of Nickel
and Cobalt superalloys were considered in this study. The model alloys were prepared by
conventional arc melting process at Air Force Research Laboratory, Ohio. The composition of
Nickel model alloy was chosen to be Ni-14Al-7Cr (at. %), based on previous reported alloy
compositions where the lattice misfit between the γ’ precipitate and γ matrix were kept to
minimum value with high volume fraction of precipitates [1]. The alloy compositions of various
Cobalt alloys were systematically selected to study the effects of alloying elements. The
compositions of the Co-base alloys are Co-10Al-10W, Co-10Al-10W-2Ta, Co-10Al-10W-3Mo
(all in at. %).
3.2 Heat Treatments
The heat treatments of both Ni and Co-base alloys were performed in tube and box
furnaces. The samples were encapsulated with quartz tubes-backfilled with argon. The arc
melted samples were cut and prepared into desired shapes for further heat treatments and for
microscopy using a Mitsubishi FX 10 Wire Electric Discharge Machine (EDM). The various
conditions of the heat treatment for isothermal annealing and furnace cooling are mentioned in
the respective chapters of this thesis.

21
3.3 Characterization Tools
For better understanding of microstructure from micro to nano scale, various
characterization tools have been used in this work. Standard metallographic techniques were
employed for scanning electron microscopy (SEM) and orientation microscopy (OM) studies
using electron backscatter diffraction (EBSD). The desired surfaces of the sample were first
polished on silicon Caride (SiC) emery paper upto 1200 grit paper, followed by cloth polishing
using alumina solution. Further polishing was done on Beuehler VibroMet2 with alumina
suspension for 5 h.
3.3.1 Scanning Electron Microscopy (SEM)
The structural and size scale evolution study for γ’ precipitates in both Co and Ni base
superalloys, in particular to later stage of annealing, were carried out with help of FEI Nova
NanoSEM 230TM equipped with a field emission gun (FEG).The surface analysis is done with
the help of Everhardt Thornley Secondary Electron detector (ETD). The SEM micrographs for
size scale measurement were taken with the help of the back scatter electron detector (BSED).
The Compositional analyses of the samples were carried out using SiLi energy dispersive
detector (EDS). The size scale of the precipitates were measured using the software Image JTM .
3.3.2 Electron Backscatter Diffraction (EBSD)
The orientation microscopy was required to improve sample preparation methods in
many cases. This was carried out in FEI Nova NanoSEM 230TM fitted with EDAX DigiView IV
electron back scatter detector (EBSD).The EBSD data were obtained using the OIM Data
22
collection software. The obtained orientation microscopy information were analysis using TSL
OIM Data Analysis 5.3 software.
3.3.3 Dual Beam Focused Ion Beam Microscope (FIB)
The dual beam FEI Nova 200 NanoLab Focused Ion Beam Microscope was an important
tool for this study for preparation of site–specific samples for both Transmission electron
microscopy and atom probe tomography. The orientation microscopy was done in this dual-beam
microscope, which is fitted with a with EDAX DigiView IV electron back scatter detector
(EBSD). The gas injection system is used here to deposit Platinum (Pt) for welding purposes and
the precise milling is done with the help of Gallium (Ga) ion source. The in-situ work is carried
out with the help of Omniprobe AutoprobeTM nano manipulator.
3.3.4 Transmission Electron Microscopy (TEM)
Transmission Electron Microscopy is a critical tool for this study as it helps in coarsening
study of γ’ precipitates by determining the size scale of the precipitates. Moreover, the atomic
scale structural transition across the matrix/ precipitate interface in Co-and Ni base alloys has
been established with the help of sub-angstrom resolution capability of TEM. In the present
study, two types of TEM have been utilized for various purposes. The dark field imaging for γ’
precipitate size determination was carried out using 200KV FEI Tecnai G2 F20 S-Twin. The
detailed atomic scale information in Ni and Co-base alloys were obtained using FEI TitanTM 80-
300 microscope, equipped with a CEOS probe aberration corrector.
Conventional TEM samples were prepared from 3mm thin foils of ~ 70 micron thickness.
Then these disks were subjected to dimple grinding on Gatan Dimple GrinderTM. Then the

23
samples were ion milled, as the last the step of TEM sample preparation, using Gatan Precision
Ion polisher (PIPS) or Fishione 1010. The TEM samples required for analysis in aberration
corrected HRSTEM were subjected to additional low energy milling in Fishione 1040
nanomillTM.
3.3.5 Atom Probe Tomography (APT)
Atom probe tomography, a derivative of field ion microscopy (FIM), has gained
importance as a characterization tool for solving various materials science problems. It is an
innovative instrument, which contain a time of flight mass spectrometer, fast laser and voltage
pulsing systems, position sensitive single atom detector. The data obtained are analyzed using
sophisticated software.
Fig. 3.1 Schematic of evaporation process of a nano-scale tip in atom probe tomography
Fig. 3.1 shows a schematic of working principle of atom probe tomography and the
associated components in it for single ion detection. The nano-scale conical specimens, prepared

24
either by electropolishing method or focused ion beam, are subjected high pulsating electric
field. After threshold energy, the surface atoms get ionized and they pass through the aperture in
the local-electrode (LE), and then the time of flight is measured by the mass spectrometer. The
signals from the multichannel are possessed to the position-sensitive detector. The lateral
resolution of the ion is determined by the position sensitive detector and the depth resolution is
determined by time of flight mass spectrometer. Then the recorded data are analyzed for three
dimensional spatial and chemical information, using softwares.
3.4 Coupling of Orientation Microscopy with APT for Crystallographic Study
A novel reproducible approach has been presented in this chapter to extract
crystallographic information using APT from highly alloyed materials, by synergistic coupling of
orientation microscopy with APT. which has been demonstrated for Co-base and Ni-base
superalloys in later chapters. In this approach, as a first step, orientation microscopy is used to
determine the site-specific crystallographic orientation of the region from which the atom probe
samples are subsequently extracted. Hence, the identification of poles in the 2D desorption
image becomes possible in spite of its poor visibility, which in turn permits crystallographic
information to be determined from the APT reconstructions.
3.4.1 Geometrical Aspect of Atom Probe Tip and Spatial Resolution
Atom probe tomography works on the principle of field evaporation where atoms from
the surface of a nano-scale hemispherical apex are ionized under a high pulsating electric field
[2]. The ions are desorbed and subsequently detected by a multichannel plate based detector
atomic layer by layer, which results in the depth resolution of this tomography tool better than an

25
inter-planar spacing. On the other hand, the lateral resolution is lower due to the trajectory
aberration being one of the primary reasons [3]. Although the best depth and lateral resolution in
APT have been evaluated as 0.06 nm and 0.2 nm respectively in pure W [4], the degradation of
spatial resolution in practical systems makes the imaging of a complete lattice still a challenge.
But, the high depth resolution has allowed for exploration of structural information in a wide
variety of materials. Recently, Moody et al. have discussed that the highest resolution of atomic
planes is achieved when the normal to the atomic planes is exactly parallel to the tip axis [5]. On
the other hand, when the normal to the atomic planes is at a solid angle to the tip axis, there will
be a loss of spatial resolution along the direction normal to the atomic planes.
Fig. 3.2 A schematic of a hemispherical atom probe tip with possible two possible arrangement of a set of atomic planes with a particular crystallographic direction
Fig. 3.2 shows a schematic of the hemispherical apex of an atom probe tip, which
describes the geometric sensitivity of the spatial resolution based on a simple arithmetic
treatment, similar to previously reported methods [6]. The schematic shows two cases: 1) when
the normal to a certain set of crystallographic planes is exactly parallel to the tip axis, and 2)
when the same set of crystallographic planes are at an angle to the tip axis.
d<hkl>
θ Case 1
Case 2

26
Using simple geometric considerations [6], the resolution along any particular direction
in APT can be expressed as
∆ = ∆ Z cos θ + ∆ L sin θ (1)
Where ∆ = the spatial resolution under the operating conditions in a certain material
∆ Z = intrinsic depth resolution
∆ L = intrinsic lateral resolution
θ = the angle between the normal to atomic planes and tip axis
If the normal to the crystallographic planes under investigation is parallel to the tip axis,
then θ = 0. Under this condition, the spatial resolution along the tip axis is theoretically the
highest as there is no contribution from lateral resolution and all the contribution is from the
depth resolution, which tends to be higher than the lateral resolution as discussed earlier. Thus,
the real challenge comes in the choice of optimal region where the highest resolution can be
achieved under the operating condition for a desired set of crystallographic planes. Previously,
APT studies on single crystal materials with known crystallography [6] as well as the technique
of coupling FIM with APT [7], have provided the information on the crystallography of the atom
probe tip prior to its evaporation. The present method uses sample preparation in a dual-beam
dual-beam FIB, equipped with a EBSD detector, for making site-specific lift-outs from grains of
different orientations, for preparing atom probe samples. This method also allows for a clear
determination of the actual angular offset of the specific planes of interest in the atom probe tip.
The present reproducible methodology, utilizing the crystallographic aspects in site
specific sample preparation, has the following salient features:
i) This approach enables the selection of particular features in a microstructure in a site-specific fashion and orients these features along the axis of the atom probe tip. This approach can eliminate the contributions from limited lateral resolution, and increase the contribution from the substantially higher depth resolution.

27
ii) In principle, desired sets of crystallographic planes can be made parallel to the detector for highest depth resolution.
3.5 References
[1] C.K. Sudbrack, R.D. Noebe, D.N. Seidman, Acta Mat. 55 (2007) 119-130
[2] B. Gault, M.P. Moody, J.M. Cairney, S.P. Ringer, Atom Probe Microscopy, 2012, Springer
[3] D. Blavette. Science, 286(1999) 2317 -2319.
[4] F. Vurpillot, A. Bostel, E. Cadel, D. Blavette, Ultramicroscopy, 84 (2000) 213 - 224.
[5] M.P. Moody, F. Tang, B. Gault, S.P. Ringer, J.M. Cairney JM, Ultramicroscopy, 111 (2011) 493 - 499. [6] F. Vurpillot, L. Renaud, D. Blavette, Ultramicroscopy 95 (2003) 223 -229.
[7] K. Hono, A. Chiba, T. Sakurai, S. Hanada, Acta Metallurgica et Materialia 40 (1992) 419 - 425.

28
CHAPTER 4
COARSENING KINETICS OF γ’ PRECIPITATES IN COBALT-BASE ALLOYS*
4.1 Introduction
A typical microstructure containing thermodynamically stable, coherent L12-ordered γ′
precipitates, in a disordered face centered cubic γ matrix, constitutes the basis of various metallic
systems for high temperature applications, including nickel base superalloys. After the recent
discovery of L12 precipitate, Co3(Al,W) in cobalt base alloys by Sato et al. [1], these alloys have
gained substantial interest due to their potential as a new generation of superalloys. Both
experimental [2, 3] and computational efforts [4] report that the high temperature properties of
these Co base alloys are comparable with those of present generation Ni base superalloys. There
have been some recent studies on the structural stability of the Co3(Al,W) phase in Co base
alloys [5] as well as the effect of alloying elements on the microstructure [6,7].
The stability of the γ−γ’ microstructure at elevated temperatures depends on the
resistance to coarsening of γ’ precipitates, leading to enhanced creep properties. The kinetics of
this coarsening process of γ’ precipitates and the associated mechanisms have been extensively
studied in case of nickel base superalloys [8-17]. Most of these previous studies on coarsening
have reported that γ’ precipitates coarsening in nickel base alloys follows classical Ostwald
ripening based on theory developed by Lifshitz-Slyozov [8] and independently by Wagner [9]
collectively known as the LSW theory. The basis of Ostwald ripening or the LSW model is that
solute diffusion through the matrix is the rate-limiting step governing the coarsening of
* The entire chapter is reproduced from ‘Coarsening kinetics of γ’ precipitates in cobalt-base alloys’, S. Meher, S. Nag,J. Tiley, A. Goel, R. banerjee, Acta Materialia vol 61 (2013) p 4266-4276, with permission from Elsevier.

29
precipitates. This theory has assumptions such as (i) near zero solubility of solute in the matrix
and that the precipitates are solely made of solute atoms (ii) a low volume fraction ofprecipitates
or a dilute solid solution, and, (iii) no precipitate-precipitate interactions. In commercial nickel
base superalloys, the volume fraction of γ’ precipitates is typically about 70-80%. To overcome
the assumption of a dilute solution in the classical LSW model, Calderon et.al [17] have
modified the coarsening rate equation to incorporate substantial solute solubility in both the
matrix and precipitate phases. More recently, it has been proposed that rather than solute
diffusion through the matrix, solute diffusion across the disorder-order γ/γ’ interface can could be
the rate-limiting step in coarsening of γ’ precipitates, leading to the development of a new
coarsening model, the trans-interface diffusion controlled (TIDC) coarsening model [10].
Recently, Ardell [16] has extended the conceptual basis of decomposition of a
supersaturated solid solution, originally developed by Cahn and Hilliard [18,19], to
compositionally diffuse and coherent interface between the matrix and γ’ precipitates in case of
nickel base alloys. This extension has permitted a better evaluation of the γ/γ’ interfacial energy
and its relationship to the concentration gradient across the interface. The latter parameter can be
experimentally measured at high spatial resolution with present generation techniques such as
atom probe tomography (APT) and Ardell [16] has used previously reported experimental data to
derive the gradient energy coefficient, based on the original Cahn-Hilliard formulation [18,19],
for γ/γ’ interfaces. Moreover, the gradient energy coefficient, is also an integral input for phase-
field simulations of microstructural evolution in these alloys.
Atom probe tomography (APT) has been proved as an invaluable tool for sub nanometer
scale understanding of three dimensional morphology and chemical composition in Nickel base
superalloys as summarized in some excellent review articles [20-22]. Further, APT analysis has

30
been extended to Co base γ−γ’ alloys very recently [23,24] where solute partitioning and their
site preference in γ’ has been discussed. Although there have been research on directional
coarsening of γ’ precipitates during creep test in Co-Al-W base alloys [3], understanding of
coarsening kinetics of γ’ precipitates based on solely solute diffusion is vital for expeditious
maturation of Co base alloys.
The present study focuses on the coarsening behavior of γ’-Co3(Al,W) precipitates in a
model Co-10Al-10W (all in at.%) alloy subjected to isothermal annealing at both 800°C and
900°C. The specific objectives of this study are listed below:
(i) Experimental determination of the temporal evolution of γ’ precipitate size and morphology during isothermal annealing at 800°C and 900°C.
(ii) Evaluation of the γ/γ’ interfacial energies at the above mentioned annealing temperatures by employing the Cahn-Hilliard formulation along with the experimentally determined coarsening rate constants and the equilibrium γ matrix compositions.
(iii) Estimation of the energy gradient coefficient from the concentration profile across γ/γ’ interface, experimentally determined from APT results.
(iv) Assessing the role of inter-precipitate distance on the extent of coalescence of γ’ precipitates.
4.2 Materials and Methods
As-cast Co-10Al-10W (all in at %) alloy was encapsulated in a quartz tube that was
backfilled with argon and was super-solvus solution treated in a vacuum furnace at 1320°C for
12 hours, followed by water quenching to dissolve any existing γ’ phase. The homogenized
samples were then aged for 1, 4, 16, 64, 256 hrs at both 800°C and 900ºC and finally water
quenched.

31
Standard metallographic techniques were used to mount and polish the heat treated
samples. Scanning electron microscopy (SEM) studies were done using FEI Nova230
NanoSEMTM microscope, equipped with a backscatter detector. Samples were prepared using
standard metallurgical techniques, with final polishing using 0.05 alumina in a vibromet polisher.
The same instrument was used to determine the composition of the alloy using a ZAF-corrected
EDS detector.
TEM samples were prepared via conventional routes, consisting of mechanical grinding
and polishing of 3 mm diameter discs, followed by dimple grinding, and, final ion-beam milling
to electron transparency. Ion beam milling was conducted on a Fischione Model 1010TM ion
milling system, operated at 6 kV. TEM analysis was conducted on a FEI Tecnai F20TM
microscope operated at 200 KV. The γ’ precipitate sizes and their volume fraction in each
sample were obtained by applying standard protocols to the TEM micrographs using IMAGE
JTM software.
Samples for APT studies were prepared by focused ion beam milling technique. For this
purpose, samples were prepared by dual-beam focused ion beam (FIB) instrument (FEI Nova
Nanolab 200TM) system using Ga ion beam. The ion beam thinning was carried out in multiple
steps, starting with 30 kV ions and finally finishing with 5 kV ions to reduce the surface damage
caused by the higher energy ions [25]. The final tip diameter of the atom probe specimens was ~
50 – 80 nm. The APT experiments were carried out using a LEAP 3000XTM local electrode atom
probe system from Cameca Instruments Inc. All atom probe experiments were carried out in the
laser evaporation mode at a temperature of 40K, with the evaporation rate varying from 0.5– 0.7
%. The laser pulse energy was set at 0.4 nJ while the pulse frequency was 160 kHz. Data
analysis was performed using IVAS 3.6.2TM software.
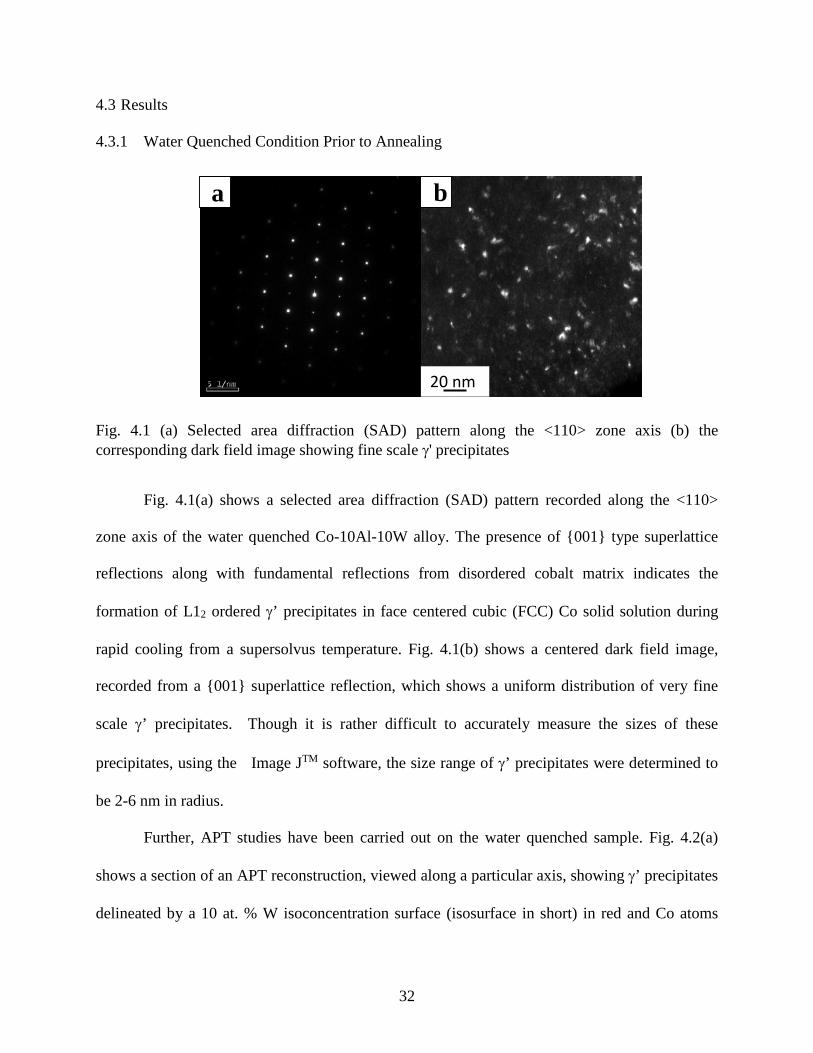
32
4.3 Results
4.3.1 Water Quenched Condition Prior to Annealing
Fig. 4.1 (a) Selected area diffraction (SAD) pattern along the <110> zone axis (b) the corresponding dark field image showing fine scale γ' precipitates
Fig. 4.1(a) shows a selected area diffraction (SAD) pattern recorded along the <110>
zone axis of the water quenched Co-10Al-10W alloy. The presence of {001} type superlattice
reflections along with fundamental reflections from disordered cobalt matrix indicates the
formation of L12 ordered γ’ precipitates in face centered cubic (FCC) Co solid solution during
rapid cooling from a supersolvus temperature. Fig. 4.1(b) shows a centered dark field image,
recorded from a {001} superlattice reflection, which shows a uniform distribution of very fine
scale γ’ precipitates. Though it is rather difficult to accurately measure the sizes of these
precipitates, using the Image JTM software, the size range of γ’ precipitates were determined to
be 2-6 nm in radius.
Further, APT studies have been carried out on the water quenched sample. Fig. 4.2(a)
shows a section of an APT reconstruction, viewed along a particular axis, showing γ’ precipitates
delineated by a 10 at. % W isoconcentration surface (isosurface in short) in red and Co atoms
a b
20 nm

33
(black). It is difficult to determine the morphology and size scale of γ’ precipitates in this three
dimensional (3D) volume reconstruction due to both their relatively small size as well as the
overlap of the compositional fields associated with these precipitates. The precipitate size and
morphology obtained from Fig. 4.2(a) reasonably matches with the TEM observations.
Fig. 4.2 (a) Clipped APT reconstruction showing γ ' precipitates delineated with 10 at. % W isosurface (b) proximity histogram shows compositionally diffused γ/ γ ' interface with partitioning of elements (c) proxigram shows the solute content in γ matrix near the interface
The proximity histogram (or proxigram) construct generated using the IVAS software, can be
used to quantify the concentration gradient across the γ-γ’ interface by selecting a suitable
composition value for the corresponding isoconcentration surface (or isosurface) which clearly
delineates the γ/γ’ interface in three-dimensions [26,27]. Fig. 4.2(b) shows a proxigram
constructed using interfaces created with a 10 at % W isosurface. This proxigram shows
0102030405060708090
-5 -4 -3 -2 -1 0 1 2
Con
cent
ratio
n (a
t%)
Distance (nm)
4
6
8
10
12
14
16
-5 -4 -3 -2 -1 0 1 2
Con
cent
ratio
n (a
t%)
Distance (nm)
10 nm
a
b
c
γ’ γ
γ γ’

34
partitioning of solutes across a compositionally diffuse, order-disorder interface. Both
experimental and computational efforts have led to a detailed understanding of structural and
compositional transitions across similar interfaces in nickel base superalloys [10, 28]. The
proxigram shown in Fig. 4.2(b) reveals that W partitions into γ’ whereas Co partitions into γ.
Interestingly, Al does not appear to exhibit any substantial tendency to partition. The summation
of Al content (~10 at %) and W content (~13.5 at.%) in the γ′ phase is ~23.5%, very close to the
25 at % expected for a stoichiometric Co3(Al,W) phase.
The proximity histogram shown in Fig. 4.2 (c) more clearly shows the partitioning
behavior of only Al and W across the γ/γ’ interface. The local depletion of solute in the γ matrix
adjacent to the interface due to matrix diffusion limited growth is clearly visible. While W
exhibits a very strong tendency to partition to the γ′ phase, Al appears to exhibit a very weak
tendency to partition to the γ′ phase.
4.3.2 Morphological Changes During Isothermal Annealing
The morphological evolution of the L12 γ′ precipitates has been extensively studied in
nickel base superalloys [29-30]. It has been generally concluded that the competing factors of
γ/ γ’ interfacial energy and the elastic strain energy arising from γ/γ’ lattice parameter mismatch
determines the equilibrium shape of the γ’ precipitates as a function of their size. Furthermore,
the favorable growth of γ’ precipitates along low energy {001} type planes of the matrix γ phase
along with elastic interactions among these precipitates leads to specific spatial correlations
between the precipitates. The evolution of the shape and configuration of γ’ precipitates during
isothermal annealing at 800°C and 900°C in the Co-10Al-10W alloy has been investigated in
detail via both SEM and TEM studies. Fig. 4.3(a), shows a centered dark field TEM micrograph

35
and Figs. 4.3(b) and (c) show backscattered SEM micrographs, of the γ-γ’ microstructure during
isothermal annealing at 800°C subsequent to solution treatment.
Fig. 4.3 Typical γ- γ ' microstructure in Co-10Al-10W (at.%), subjected to various annealing period at both 800°C and 900 °C Similarly, temporal evolution at 900°C is revealed by Fig. 4.3(d), a dark-field TEM micrograph
and Figs. 4.3(e) and (f), SEM micrographs. While it may not the most accurate measurement, for
the sake of convenience, the equivalent radius of more cuboidal γ’ precipitates have been defined
as half of the cube edge. Both the equivalent radius and equilibrium volume fraction of γ’ have
50 nm
a d
50 nm
200 nm 200 nm
200 nm 200 nm
c f
b e
800°C 900°C
1 ho
ur64
hrs
256
hrs

36
been measured using the Image JTM software. Table 4.1 gives the radius value of γ’ precipitates
at both annealing time. Irrespective of annealing temperature, Fig. 4.3 confirms that γ’
precipitates exhibited a morphological transition from near spherical to cuboidal shape, at an
early stage of growth/coarsening coupled with the development of a spatial co-relation among
the precipitates.
Table 4.1: Comparison of the average γ’ precipitate sizes with annealing time for 800°C and 900°C
Annealing Time(hr)
Average radius(nm) 800ºC 900ºC
1 7 17 4 10 - 16 - 37 64 27 64 256 40 109
The expected high volume fraction of precipitates resulting from higher solute
supersaturation at the lower annealing temperature of 800°C as compared to 900°C is clearly
revealed by comparing Figs. 4.3(c) and (f). Also comparing these figures, it is evident that there
is a substantial difference in the extent of coalescence of precipitates between 800°C and 900°C.
4.3.3 Compositional Changes Across γ/γ’ Interface During Isothermal Annealing
The proxigrams as shown in Figs. 4.4 and 4.5, have been constructed from various
interfaces generated using a 9 at.% W isosurface, and reveal the composition profile across the
γ/γ’ interface in samples subjected to isothermal annealing at 900°C for various time periods
(mentioned in the respective figures). Corresponding to each of the proxigrams shown in Fig. 4,
the respective APT reconstruction containing γ’ precipitates (delineated by 9at %W isosurface in
red) within the Co matrix (black ions), has been shown as an inset. Fig. 4(a) reveals similar

37
compositional partitioning of Al and W as compared to that of the water quenched sample. The
local depletion of W in the γ matrix near the γ/γ’ interface, as revealed in Fig. 4(a), can be
rationalized based on the matrix diffusion-limited growth of the γ’ precipitates. Thus, during
their growth, while W diffuses into these precipitates, the limited diffusivity of this heavy solute
in the Co matrix presumably results in local equilibrium to be established near the interface
while far-field equilibrium in the γ matrix is still not achieved as clearly shown in Fig. 4.4(b).
Since the far field γ composition retains a supersaturation of W, there is sufficient driving force
for further growth of precipitates.
Fig. 4.4 Proxigrams corresponding to 9 at. % W shows the partitioning across the γ/ γ ' interface in samples subjected to 1 and 4h of annealing at 900°C
2
4
6
8
10
12
14
-5 -4 -3 -2 -1 0 1 2 3 4 5
Al
W
0
2
4
6
8
10
12
14
-10 -9 -8 -7 -6 -5 -4 -3 -2 -1 0 1 2 3 4 5
Al
W
2
4
6
8
10
12
14
-5 -4 -3 -2 -1 0 1 2 3 4 5
Al
W
2
4
6
8
10
12
14
-10 -9 -8 -7 -6 -5 -4 -3 -2 -1 0 1 2 3 4 5
Al
W
900°C
Con
cent
ratio
n(at
%)
1 hr
10 nm
a 4 hr
10 nm
c
1 hrb 4 hrd
Distance (nm)
γ’ γ
γ’ γ
γ’ γ
γ’ γ

38
After 4 hours annealing, the local W depletion near the γ/γ’ interface disappears, as revealed by
Fig. 4.4(c), and the composition within the γ matrix is relatively uniform as revealed by Fig.
4.4(d). This indicates that the solute supersaturation in the matrix has been consumed and
therefore, further increase in the precipitate size is solely due to coarsening. With continued
annealing up to 16 hours and 64 hrs, there is no significant change in composition, as shown in
Fig. 4.5(a) and (b) respectively. Assuming that the compositions of the γ and γ’ phases are near-
equilibrium after an annealing period of 64 hrs at 900°C, the equilibrium partitioning co-efficient
of W, Kγ’/γ can be calculated as 2.66. In contrast, the partitioning coefficient for Al has not been
calculated because of the insignificant partitioning of this solute between the two phases. While
the lack of any significant partitioning of Al between γ and γ’ phases is rather unusual, it
indicates that the equilibrium compositions of these two phases at 900°C presumably contain
equal amounts of Al. The compositions of γ and γ’ after 64 hours of annealing are mentioned in
Table 4.2.
Similarly, the compositional partitioning across γ/γ’ interfaces for different isothermal
annealing time periods at 800°C, are shown via proxigrams, created from 9 at.% W isosurfaces
in Fig. 4.6. The corresponding APT reconstructions are also shown as insets. Fig. 4.6(a),
corresponding to an annealing time period of 1 h, shows local equilibrium of W near the γ/γ’
interface while long range equilibrium has yet been achieved and a W supersaturation is retained
within the γ matrix. The equilibrium compositions of both γ and γ’ phases after long term (64
hrs) at 800ºC have been listed in Table 4.2. The partitioning coefficient of W, Kγ’/γ ~ 4 is higher
as compared to that observed at 900ºC. This difference in partitioning behavior can be
rationalized based on the phase equilibria as a function of temperature. The curvature of the
single phase γ and γ’ phase boundaries, separating these phases from the two-phase γ + γ’ region,

39
is usually concave indicating that with increasing temperature, the relative difference in solute
content of these two phases decreases. Furthermore, it should be noted that the gradual increase
in partitioning of W across the γ/γ’ interface, with annealing time, affects the misfit between
these two phases and the resultant strain energy, in turn affects the morphological evolution.
Fig. 4.5 Proxigrams corresponding to 9 at. % W isosurface in samples subjected to 16 and 64 h. of annealing along with the APT reconstruction
2
4
6
8
10
12
14
-5 -4 -3 -2 -1 0 1 2 3 4 5
W
Al
2
4
6
8
10
12
14
-5 -4 -3 -2 -1 0 1 2 3 4 5
Al
W
Con
cent
ratio
n (a
t%)
Distance (nm)
900°C
64 hr
16 hr
20 nm
20 nm
a
b
γ’ γ
γ’ γ

40
Fig. 4.6 Proxigram corresponding to 9 at. % W isosurface in samples subjected to isothermal annealing at 800°C with the corresponding APT reconstructions
Table 4.2 Equilibrium composition of γ and γ’ measured from APT.
Temperature (°C)
Compositions (at %) γ γ’
800 Co-10Al-3.5W Co-10Al-14 W 900 Co-10Al-4.5 W Co-10Al-12 W
4.3.4 Interfacial Energy From the Cahn-Hilliard Approximation
Ardell [16] in a recent paper has associated the γ/γ’ interfacial energy with the
concentration gradient across this coherent interface via the concept of a gradient energy term,
0
2
4
6
8
10
12
14
16
18
-5 -4 -3 -2 -1 0 1 2 3 4 5
W
Al
0
2
4
6
8
10
12
14
16
18
-5 -4 -3 -2 -1 0 1 2 3 4 5
Al
W
Distance (nm)
Con
cent
ratio
n (a
t%)
800°C
20 nm
20 nm
b
a1 hr
64 hrs
γ’ γ
γ’ γ

41
originally proposed by Cahn and Hilliard [18, 19]. The interfacial energy (σ) is related to the
gradient energy coefficient (χ) and the concentration gradient across the interface (dC/dx) as
follows [18]:
σ = 2χ ∫ �𝑑𝑑𝑑𝑑𝑑𝑑𝑑𝑑�
𝑑𝑑𝛾𝛾′𝑑𝑑𝛾𝛾
𝑑𝑑𝑑𝑑 (1)
The proximity histograms obtained from APT which show the concentration profile across the
interface with sub-nanometer resolution, can be described by sigmoid functions and can be used
to directly determine the average change in concentration over the width of the interface,
(dC/dx)avg and the difference in solute content between the two phases, △C for evaluating the
interfacial energy.
According to Ardell [16], interfacial energy is related to gradient energy coefficient and
interface width (δ) as follows:
σ = 4𝜒𝜒△𝑑𝑑2
3𝛿𝛿 (2)
and moreover, if the compositional profile across the interface is fitted to a sigmoid function, the
interface width can be calculated as [16] :
𝛿𝛿 = △𝑑𝑑
�𝑑𝑑𝑑𝑑𝑑𝑑𝑑𝑑�𝑚𝑚𝑚𝑚𝑥𝑥
(3)
Hence, the interfacial energy can be rewritten as:
σ =4𝜒𝜒△𝑑𝑑�𝑑𝑑𝑑𝑑𝑑𝑑𝑑𝑑�𝑚𝑚𝑚𝑚𝑥𝑥
3 (4)
While in the original formulation by Cahn and Hilliard, the maximum concentration
gradient across the interface was used for evaluating equation (4), it should be noted that the
experimentally determined concentration gradient obtained from APT is not very smooth due to
its very high spatial resolution. Consequently, using the maximum gradient (dc/dx)max in the
formulation proposed by Cahn and Hilliard, can lead to errors in the numerical evaluation of σ

42
resulting from local fluctuations in the composition profile. Therefore, in the present study,
(dc/dx)max has been replaced by (dc/dx)avg, which is an average value of concentration gradient
over 1 nm across the local region around (dc/dx)max . Moreover, Cahn and Hilliard [18,19] have
mentioned that gradient energy coefficient can be regarded as being independent of temperature
for regular solutions. Hence, the ratio of the interfacial energies for the two annealing
temperatures can be expressed as:
σ1σ2
=△C
1.�𝐝𝐝𝐝𝐝𝐝𝐝𝐝𝐝�𝐚𝐚𝐚𝐚𝐚𝐚𝐚𝐚
△C2.�𝐝𝐝𝐝𝐝𝐝𝐝𝐝𝐝�𝐚𝐚𝐚𝐚𝐚𝐚𝐚𝐚
(5)
where △C is the difference in equilibrium concentration of the solute in both phases and �dCdx�avg
is the average concentration gradient over 1 nm across the (dc/dx) max at the interface. The
calculated values of (dc/dx)avg are 3.49 and 2.57 and the composition difference of W between
the two phases are 10.5 and 7.5 at.% for samples annealed for 64 hours at 800ºC and 900ºC
respectively. So substituting these values in equation (5), the value of σ1/ σ2 has been calculated
to equal1.91. These results clearly indicate that the γ/γ’ interfacial energy changes with respect to
temperature.
4.3.5 Coarsening Rate Constants Based on LSW Theory
There has been extensive research work that demonstrates that the coarsening of γ’
precipitates in a γ matrix typically follows a matrix diffusion-controlled growth behavior,
explained by classical LSW coarsening model. Recently, a second coarsening model, the trans-
interface diffusion controlled (TIDC) coarsening model [10] has been proposed. The basis for
this second model is that in certain cases, especially in systems involving order/disorder
interfaces such as γ/γ’ interfaces, the diffusion of solute across a partially ordered interface can

43
be rate limiting rather than solute diffusion through the disordered matrix [10]. The temporal
exponent of coarsening roughly determines the coarsening mechanism: it is expected to be 3 for
LSW coarsening and 2 for TIDC coarsening. To determine the operative mechanism of
coarsening of γ’ precipitates in the Co-10Al-10W (at.%), a plot of the logarithm of average
precipitate radius (log r) versus the logarithm of ageing time in seconds (log t) for both
temperatures (800°C and 900°C) is shown in Fig. 7(a). The slope of a linear fit to the data points
yields the inverse of the temporal exponent that is 0.33 and nearly equal for both temperatures
(Table 4.3). Therefore, the experimentally determined temporal exponent of coarsening indicates
that LSW is the dominant coarsening mechanism indicating that solute (W in this case) diffusion
through the γ matrix diffusion is the rate-controlling step.
In case of matrix diffusion-limited coarsening, the temporal evolution of average
precipitate size follows the following law:
r3 − r03 = K . t (6)
Where rt is the mean particle size at time t, ro is the mean particle size at annealing time, t = 0
and K=coarsening rate constant
The average precipitate sizes for different annealing time periods at both temperatures
have been plotted on a graph of precipitate size (equivalent radius raised to the third power) vs.
annealing time (t) as shown in Fig. 4.7(b). Linear fits to these plots for the respective datasets,
yield slopes that give the rate constants, K= 0.07 x 10⁻²⁷ m3/sec and 1.41 x 10⁻²⁷ m3/sec for 800ºC
and 900ºC respectively (Table 4.3). With an increase in annealing temperature of 100ºC, the
coarsening rate appears to increase nearly 20 times.

44
Fig. 4.7 (a) Plot of log (radius) vs. log (annealing time) for both 800°C and 900°C giving temporal growth exponent of γ' precipitates, which correspond to classical LSW growth exponent. (b) Plot showing linear fit of precipitate size (r3 in nm) vs. annealing time (t) during 800°C and 900°C along with respective LSW rate constants
One of the drawbacks of the original LSW model of coarsening is its applicability to only
dilute solution containing small volume fraction of precipitates as well as a near zero solubility
of the solute in the matrix. Subsequently, modifications have been proposed to the original

45
coarsening model to overcome this and other assumptions. Since the γ’ volume fraction observed
in the Co-10Al-10W (at.%) is relatively large and far-from a dilute solution, the experimental
data presented in this paper has been analyzed based on the description of coarsening kinetics
referred to as the modified form of LSW model by Calderon et al.[17]. This modification takes
into account significant solute solubility in the γ matrix as experimentally observed in many
alloy systems and the corresponding rate equation has dependence on the solute content of both
matrix and precipitate phases.
Table 4.3 Calculated temporal exponent and LSW rate constant based on linear fit
Temperature ( °C)
Temporal exponent(n-1) Rate constant, K (m3/sec)
800 0.323 0.07*10-27 900 0.329 1.41*10-27
Assuming that the diffusion of W in the γ matrix as the rate-limiting step for precipitate
coarsening (assumption based on APT observations) the LSW rate constant, K, can be
determined as follows:
K = 8DCe(1−Ce )Vmσ
9RT(Ceγ′−Ce)2
(7)
where D is the diffusion coefficient of W in the matrix, Ce is the solubility (in atomic fraction) of
W in equilibrium with the precipitate, Ceγ’ is the equilibrium solubility of W in the γ’
precipitates, σ is the precipitate/matrix interfacial energy, Vm is the molar volume of the
precipitate, R is the universal gas constant (=8.31 Jmol-1K-1) and T is the absolute temperature.
The reported lattice parameter of cubic Co3(Al,W), based on DFT calculations is 3.55Å [4],
yielding a molar volume of these precipitates as 6.8 x 10⁻⁶ m3/mol.

46
4.3.6 Determination of the Activation Energy
The diffusivity of W in the γ matrix can be expressed as
D = D0 exp �−Q R. T
� (8)
where D0 is the diffusion coefficient for W = 10-3 m2/sec [32] and Q is the activation energy for
W diffusion in the γ matrix. Using equations 7 and 8 for two different temperatures, an
expression for determination of activation energy can be written which employs experimentally
determined parameters as follows:
ln �KT �Ce
γ′ − Ce�2
Ce(1 − Ce )σ� = Constant −
Q RT
(9)
Equation 9 has been used to determine the activation energy for diffusion of W in the γ
matrix by comparing data on annealing at both 800ºC and 900ºC. Using the value in Tables 1
and 3 and values obtained from equation 9, Q was calculated to be 295 kJ/mol. Previously,
values of Q in binary Co-10 at.%W alloys was reported as 310 ± 11 kJ/mol [31] which is very
close to the value reported in the present study. Substituting the value of Q = 295 kJ/mol in
equation 3, the diffusivity of W in the γ matrix, D, can be calculated to be 4.387 x 10⁻¹⁸ m2/sec
and 7.28 x 10⁻¹⁷ m2/sec at 800ºC and 900ºC respectively.
4.3.7 Determination of γ/γ’ Interfacial Energy and the Gradient Energy Coefficient
Historically, the coarsening data for γ’ precipitates in nickel base alloys has been used to
experimentally determine the γ/γ’interfacial energy in these alloys [14,30]. The values reported
in the literature, based on such coarsening data vary over a wide range, from 10 mJ/m2 to 100

47
mJ/m2 [30]. This variation is expected due to variations in alloy compositions and experimental
conditions, as well as application of different precipitate coarsening models to analyze the data.
A similar approach is being employed in the present case to determine the γ/γ’ interfacial
energy in the Co-10Al-10W alloy. Thus, substituting the experimentally determined K, D and Ce
values in equation 2, the values of σ have been evaluated as 10 and 19 mJ/m2 at 900°C and
800°C respectively. Substituting the experimentally determined value of γ/γ’ interfacial energy at
900°C in equation 4, the gradient energy coefficient has been evaluated as 5 X 10⁻⁹ J/m for the
Co-Al-W system.
4.3.8 Inter-precipitate Distances and Coalescence of γ’ Precipitates
Comparing Figs. 4.3(c) and (f), a significant difference in the extent of coalescence of γ’
precipitates during the microstructural evolution at two different temperatures can be observed.
Higher magnification SEM images showing the γ’ precipitates after annealing for 256 hours at
800°C and 900°C are shown in Figs. 4.8(a) and (b) respectively. The average inter-precipitate
distance after annealing at 800°C for 256 hours is ~ 25nm which is about half that after
annealing at 900°C for the same time period (~55 nm). The Image J software was used for
measuring the inter-precipitate distance and a large dataset, corresponding to multiple images
such as the ones shown in Figs. 4.8(a) and (b), has been used to minimize the statistical
inaccuracy in these measurements. The lower inter-precipitates distance at 800°C can be
attributed to the higher volume fraction of precipitates at this temperature as compared to 900°C,
and consequently can lead to a higher propensity for precipitate coalescence at 800°C.
The driving force for coalescence of γ’ precipitates has been previously attributed, in case
of nickel base superalloys, to the removal of the elastically strained γ matrix between two

48
precipitates, dominant in systems exhibiting a high γ/γ’ lattice mismatch [8,9]. However, the
coalescence of these ordered γ’ precipitates is often limited by the high energy of the anti-phase
domain boundary, APB ~220 mJ/m2 [32], that forms when two out-of-phase ordered precipitates
come in proximity. The APB energy is usually very high as compared to the γ/γ’ interfacial
energy. There are four different crystallographic variants of γ’ precipitates that can form during
the 𝛾𝛾 → 𝛾𝛾′ + 𝛾𝛾 precipitation reaction. Statistically, there is only a 25% probability that two
adjacent and independently nucleated γ’ precipitates belong to the same crystallographic variant.
Consequently, the degree of coalescence remains rather limited even in systems containing a
high volume fraction of γ’ precipitates. The experimentally observed coalescence of the γ’
precipitates in case of the Co-10Al-10W alloy in the present study is rather interesting
considering that the γ/γ’ interfacial energy is quite low ~19 mJ/m2.
Fig. 4.8 (a) Magnified SEM image with measured average inter-precipitate distance in the sample subjected to 256 h of annealing at 900°C (b) magnified SEM image with measured average inter-precipitate distance in the sample subjected to 256 h of annealing at 900°C
~25 nm ~55 nm
a b

49
While the APB energy in this system is presently not known, it is difficult to justify that the APB
energy would be lower than the γ/γ’ interfacial energy. Furthermore, it should be noted that while
the higher magnification SEM image shown in Fig. 4.8(a), exhibits close proximity of the γ’
precipitates, a thin wetting layer of γ matrix between the precipitates is also observed in multiple
cases. A more detailed analysis of the statistics of coalescence of γ’ precipitates in the Co-10Al-
10W alloy is required in order to rationalize this phenomenon.
4.4 Discussion
Similar to nickel base superalloys, Co-Al-W alloys also exhibit the presence of coherent
ordered γ’ precipitates within the disordered γ matrix and therefore are being actively
investigated for potential high temperature applications. While the high temperature mechanical
properties and deformation behavior of Co-Al-W alloys are promising, recent studies indicate
that the additions of alloying elements such as Ta, enhance these properties even further as
compared to the base ternary alloy [2]. Some initial investigations have also been carried out on
solute partitioning and site preferences within the γ’ precipitates in these alloys [23]. The focus
of the present study is a detailed investigation of the coarsening kinetics of γ’ precipitates in a
ternary Co-10Al-10W base alloy. The temporal evolution of precipitate size, along with the
concentration profile in the γ matrix adjacent to the γ/γ’ interface, suggest that solute diffusion of
W through the matrix is the rate-limiting phenomenon governing the coarsening of the γ’
precipitates (Oswald ripening or LSW model). The experimentally determined coarsening rate in
the Co-10Al-10W alloy in the present study, indicates a slower γ’ coarsening rate as compared to
that previously reported in commercial Nickel base alloys like Nimonic 115 at the same

50
temperature [33]. The slower coarsening rate of γ’ precipitates in case of the Co-10Al-10W alloy
can be attributed to the very low diffusivity of W in this alloy.
The strain induced at the γ/γ’ interface by the lattice misfit within the coherency limit can
affect the interfacial energy which inturn will affect the morphology and coarsening kinetics of
γ’ precipitates. There is very limited reported data on γ/γ’ lattice misfit in case of Cobalt base
alloys. Sato et al. has reported the value of γ’/γ lattice misfit as 0.53% for Co-9Al-9W (at)%
alloy, subjected to annealing at 900°C[1]. A recent report has mentioned positive γ/γ’ lattice
mismatch of 0.34% and 0.78%, respectively, for Co-8Al-8W-25Ni (at %) and Co-10Al-5W-2Ta
(at %) [34]. Also, the effect on this positive misfit during high temperature creep has been
discussed in Co base alloys [3]. It has been reported by Suzuki et al. that Co-Al-W alloys shows
temperature dependent flow stress behavior similar to that in commercial Ni superalloys[2]. Co-
Al-W alloys show increased flow stress with increase in deformation temperature. The
commercial Nickel superalloys like Rene 88DT has very less lattice misfit (0.05 %), the
coarsening rate of γ’ precipitate appears to be slower and it has a value of 0.0157x 10⁻²⁷[35].In
Ni-7.5Al-8.5Cr (at%), the γ’/γ lattice mismatch has been reported to be 0.27 % and the
coarsening rate of γ’ precipitates as 1.84 X10⁻³¹ m3/s at 600°C [36]. The very early stage
morphological transition of γ’ precipitates in the alloy of present study suggest a significant
lattice misfit within coherency limit. The future aim of cobalt base alloy design is to develop
microstructure with negative misfit which can impart enhanced creep strength. Further reduction
in the γ/γ’ lattice mismatch by suitable alloying can lower the interfacial energy, leading to
enhanced microstructural stability against γ’ precipitate coarsening.
Using the experimental coarsening data for γ’ precipitates within the framework of the
modified LSW model for non-dilute solutions, the diffusivity of the rate-limiting solute, W, and

51
the γ/γ’ interfacial energy, has been determined for the Co-10Al-10W alloy. Additionally, by
incorporating the Cahn-Hilliard approximation, the relative values of the γ/γ’ interfacial energy
at the annealing temperatures of 800°C and 900°C has also been estimated. The application of
the Cahn-Hilliard approximation requires the compositional profile across the γ/γ’ interface, and
this has been experimentally determined in the present study at high spatial resolution from APT
investigations. The resultant γ/γ’ interfacial energy at 800°C and 900°C was determined to be 19
and 10 mJ/m2 respectively, and is comparable to values reported in the literature for γ/γ’
interfaces in nickel base superalloys. The sensitivity of the calculated value of the γ/γ’ interfacial
energy for the Co-10Al-10W alloy depends on the accuracy of the experimentally determined
matrix and precipitate compositions, as well as the calculated rate constants based on the
coarsening data. A high degree of confidence can be placed on the value of the phase
compositions since these values have been determined using APT which has been proven as an
accurate tool for such analysis. Statistical inaccuracies arising from the measurement of the
precipitate sizes from the SEM and TEM images is expected to be relatively small since a large
dataset has been used to determine the average values. Thus, the error in the value of interfacial
energy is expected to be relatively small. The only discrepancy in the quantification of interfacial
energy can arise from the value of diffusion exponent that has been adopted from the published
literature [31].
Additionally, the coupling of Cahn-Hilliard approximation with concentration profile
across the γ/γ’ interface obtained from APT has provided the gradient energy coefficient (χ)
which forms an integral part of phase field simulations of precipitation processes. The estimated
value of χ in the present study nearly matches with that evaluated earlier [16] for coherent γ/γ’
interfaces in case of nickel base alloys.

52
There is an experimentally observed difference in the inter-precipitate distances between
γ’ precipitates at 800°C and 900°C, resulting from the change in volume fraction of precipitates
at these two annealing temperatures (Figs. 4.3(c) and (f) and Figs. 4.8(a) and (b)). This is
coupled with enhanced partitioning of W between the γ and γ’ phases at the lower annealing
temperature (800°C), as indicated by APT results, leading to a higher degree of lattice mismatch
between the two phases. Within the limits of γ-γ’ coherency regime, the larger lattice mismatch
results in higher strain energy in the inter-leaving γ matrix. Hence, a combined effect of narrower
inter-precipitate distances and higher elastic strain energy leads to enhanced coalescence of γ’
precipitates at 800°C, presumably removing the elastically strained matrix between two
precipitates.
Apart from a detailed characterization of the γ/γ’ microstructure and associated solute
partitioning between the two phases at elevated temperatures, this article quantifies the
coarsening kinetics of γ’ precipitates at the annealing temperatures of 800°C and 900°C in a Co-
10Al-10W alloy. Furthermore, this paper presents calculations of the γ/γ’ interfacial energy as
well as the gradient energy term associated with these interfaces within the framework of the
Cahn-Hilliard approximation. These results serve as critical inputs for both models of
microstructural evolution as well as the future development of Co base alloys with further
reduced γ’ coarsening rates and optimized microstructures.
4.5 Summary and Conclusions
Based on systematic experimental analysis of isothermal annealing at 800°C and 900°C
of a Solutionised and quenched Co-10Al-10W (at.%) alloy, the following conclusions can be
drawn:

53
1. The coarsening kinetics of γ’ precipitates appears to in accordance with the classical
LSW coarsening model as suggested from the temporal exponent of growth (~0.33) at both
annealing temperatures. Following the modified LSW rate law for non-dilute solutions, the
coarsening rate constants at 800°C and 900°C have been determined. The coarsening rate of γ’
precipitates at 900°C appears to be nearly 20 times that at 800°C.
2. The γ’ compositions at both annealing temperatures, as revealed by APT analysis,
indicates a stoichiometry of Co3(Al,W) suggesting that W occupies exclusively the Al sites in the
L12 lattice. Experimentally determined compositional profiles across the γ/γ’ interface, show that
W partitioning decreases with increasing temperature, resulting in a lowering of the γ/γ’ lattice
mismatch. Interestingly, Al partitioning across the same interface is negligible at both
temperatures indicating that W diffusion in the matrix is the rate-limiting factor governing
precipitate coarsening. Additionally, the experimentally observed local depletion of W in the
vicinity of the γ/γ’ interface is in agreement with this coarsening model.
3. Incorporating the Cahn-Hilliard approximation that allows for estimating the
interfacial energy for coherent interfaces from the compositional gradient across the interface,
into the modified LSW rate law, the activation energy for diffusion of W in the γ matrix has been
determined to be 295 KJ/mol.
4. Based on the calculated values of the LSW coarsening rate constants and the
activation energy for diffusion of W in the γ matrix, the γ/γ’ interfacial energy was calculated to
be 19 and 10 mJ/m2 at 800ºC and 900ºC respectively. Furthermore, based on the Cahn-Hillard
approximation, the gradient energy coefficient (χ) for these interfaces in the Co-Al-W system
was determined to be 5X10⁻⁹ J/m assuming a regular solution model. χ is a critical parameter
used as an input for phase-field simulation models of microstructural evolution.

54
5. The higher γ’ volume fraction and extent of solute (W) partitioning between γ and γ’
phases at 800°C as compared to 900°C, results in smaller inter-precipitate distances as well as a
higher lattice mismatch at the lower temperature. Consequently, highly elastically strained
γ channels are likely to form during the coarsening process at 800°C resulting in a higher
propensity for precipitate coalescence as indicated by the experimental results.
4.6 References
[1] J. Sato J, T. Omori T, K. Oikawa K, I. Ohnuma I , R. Kainuma R, K.Ishida K , Science 312 (2006) 90.
[2] A. Suzuki A , T.M. Pollock TM, Acta Mater. 56 (2008) 1288.
[3] M. Titus M, A. Suzuki A, T.M. Pollock TM, Scripta Mater. 66 (2012) 574.
[4] Y.J. Wang YJ, C.Y. WangCY, Appl. Phys. Lett. 94 (2009) 261909.
[5] Q. Yao Q, H. Xing H, J. Sun J, Appl. Phys. Lett. 89 (2006) 161906.
[6] T.M. Pollock TM,J. Dibbern J, M. Tsunekane M, J. Zhu J, A. Suzuki A, J. Mater. 62 (2010) 58.
[7] G. Feng G, H. Li H,S.S. Li SS, J.B. Sha JB, Scripta Mater., 67( 2012)499
[8] I.M. Lifshitz IM, V.V. Slyozov VV, J. Phys. Chem. Solids 19(1961) 35.
[9] C. Wagner C, Z. Elektrochem. 65 (1961) 581.
[10] A.J. Ardell AJ, V. Ozolins V, Nat Mater 2005;4:309.
[11] A.J. Ardell AJ, Acta Metall 1972;20:61
[12] A.J. Ardell AJ , R.B. Nicholson RB, J Phys Chem Solids 1966;27:1793
[13] P.W. Voorhees PW, J Stat Phys 1985;38:231.
[14] D. McLean D,Metal Sci 1984;18:249.
[15] A.J. Ardell AJ , Scripta Metall Mater 1990;24:343
[16] A.J. Ardell AJ. Scripta Mater. 66(2012)423

55
[17] H.A. Calderon HA, P.W. Voorhees PW, J.L. Murray JL, G. Gkostorz G, Acta Metall., 42, 991(1994)
[18] J.W. Cahn JW, J.E. Hilliard JE, J. Chem. Phys. 28 (1958) 258.
[19] J.W. Cahn JW, J.E. Hilliard JE, J. Chem. Phys. 31 (1959) 688.
[20] D. Blavette D, E. Cadel E,B. Deconihout B, Mater Charact 2000;44:133–57
[21] M.K. Miller MK, Micron 2001;32: 757–64
[22] D.N. Seidman DN,C.K. Sudbrack CK,K.E. Yoon KE, JOM 2006;58: 34–9.
[23] S. Meher S, H.Y. Yan HY, S. Nag S, D. Dye D, R. Banerjee R, Scripta Mater. 67(2012)850
[24] P.J. Bocchini PJ, E.A. Lass EA ,K.W.Moon KW,E.W. Maureer EW,C.E. Campbell CE, U.R. Kattner UR, D.C. Dunand DC, D.N. Siedman DN Scripta Mat 68 (2013) 563-566
[25] K . Thompson K,D. Lawrence D, D.J Larson DJ, J.D. Olson JD,T.F. Kelly TF, and, B. Gorman B, Ultramicroscopy, 2007; 107: 131.
[26] K.E. Yoon KE, R.D. Noebe RD, O.C. Hellman OC, D.N. Seidman DN, Surf. Interface Anal. 36 (2004) 594.
[27] M.K. Miller MK, Surf. Interface Anal.31 (2001) 593.
[28] R. Srinivasan R, R. Banerjee R, J.Y.Hwang JY, G.B.Viswanathan GB,J. Tiley J,H.L. Fraser HL, Phys Rev Lett 2009;102:086101.
[29] Y.S. Yoo YS, D.Y. Yoon DY,M.F. Henry MF, metals and mat. 1(1995), 47
[30] V. Vaithyanathan V, L.Q. Chen LQ, Acta Mat. 50 (2002) 4061
[31] R. Ravi R, A.Paul A, Intermetallics 19 (2011) 426
[32] F.A. Flinn FA, Trans. AIME 218 (1960) 145
[33] X. Li X,N. Saunders N, A.P. Miodownik AP, Metall. and Met. Trans A 33A(2002)
[34] J.Tiley J, G.B.Viswanathan GB, R. Srinivasan R, R. Banerjee R, H.L.Fraser HL, Acta Mat. 57(2009) 2538
[35] H.Y. Yan HY, V.A. Vorontsov VA, J. Coakley J, N.G. Jones NG, H.J.Stone HJ, D. Dye D, Superalloys 2012, 705
[36] C. Booth-Morrison C, J. Weninger J,C. Sudbrack C, Z. Mao Z, R. Noebe R, D.N. Seidman DN, Acta mat. 56 (2008)3422

56
CHAPTER 5
PARTITIONING AND SITE PREFERENCES IN CO-BASE γ-γ’ ALLOYS2
5.1 Introduction
A typical microstructure containing thermodynamically stable, coherent L12-ordered γ′
precipitates, in a disordered face centered cubic γ matrix, as previously observed in nickel base
superalloys, constitutes the basis of various metallic systems for high temperature applications.
In the Co-Al-W ternary, a new stable L12-ordered γ′ precipitate, Co3(Al,W) has been discovered
by Sato et al.[1], leading to rapidly growing interest in this as a basis for a new generation of
high temperature materials. The high temperature properties of these Co base alloys have been
found to be comparable with those of present generation Ni base superalloys, but the former are
capable of operating at higher temperatures [2,3].The structural stability of Co3(Al,W) [4] and
the influence of various alloying additions on the microstructure and γ′ solvus temperature have
also been investigated [5,6].
The expeditious development and maturation of Co base alloys will ideally require a
coupling of experimental and computational efforts. Experimental results regarding the
partitioning of the various alloying elements between these two phases are critical for the
following:
a. Development and validation of thermodynamic models for the γ and γ’ phases that can predict their respective thermodynamic properties as well as lattice parameters.
b. Designing alloy compositions wherein the γ/γ′ lattice parameter misfit can be minimized in order to reduce the γ/γ′ interfacial energy and consequently enhance the creep resistance.
2 The entire chapter is reproduced from ‘ Solute partitioning and site preference in γ/ γ’ cobalt base alloys', S. Meher, H.Y. Yan, S. Nag, D. Dye, R. Banerjee, Scripta Materialia, vol 67 (2012) p. 850-853, with permission from Elsevier

57
c. Development of constitutive relationships associating the compositions of these phases and their mechanical properties that can be experimentally validated via mechanical testing of single phase (and if required single crystal) samples.
While atom probe tomography (APT) has been an invaluable tool in developing a better
understanding of precipitation processes in Ni base alloys [7,8], the application of this tool to Co
base alloys has been rather limited to date.
Although there have been some recent first-principles computations regarding
partitioning and the site preference of different alloying elements in Co-base γ/γ′alloys [9, 10],
there are still no clear experimental results validating these computations. It has been reported
earlier that substitution of Co by comparable atomic size Ni in Co-Al-W increases the γ-γ′ phase
field and the γ′ solvus temperature [11] as well as the substitution of γ′ former W with
comparable atomic size Ta has interesting impact on partitioning behavior based on competing
energetics for same site preference in Nickel superalloys [12].Previous reports on phase
equilibrium on Co base γ/γ′ alloy [11, 13] have put insight into partitioning behavior of
constituent elements but the present study focuses on a detailed APT investigation of sub-
nanometer scale solute partitioning across the γ/γ′ interface and site preferences of alloying
elements in the ordered γ′ structure in alloys with nominal compositions of Co-7Al-7W (all
at.%), and two quaternary alloys, Co-8Al-8W-25Ni and Co-10Al-5W-2Ta.
5.2 Materials and Methods
50g finger-shaped polycrystalline ingots were obtained by vacuum arc melting under a
back-filled low pressure Ar atmosphere. A Co-10W (at.%) master alloy was used along with
pure elemental pellets of Co, Al, Ni and Ta. The as-cast ingots were then vacuum solution heat
treated at 1300°C for 24hrs, encapsulated in rectilinear mild steel cans with Ti powder packing
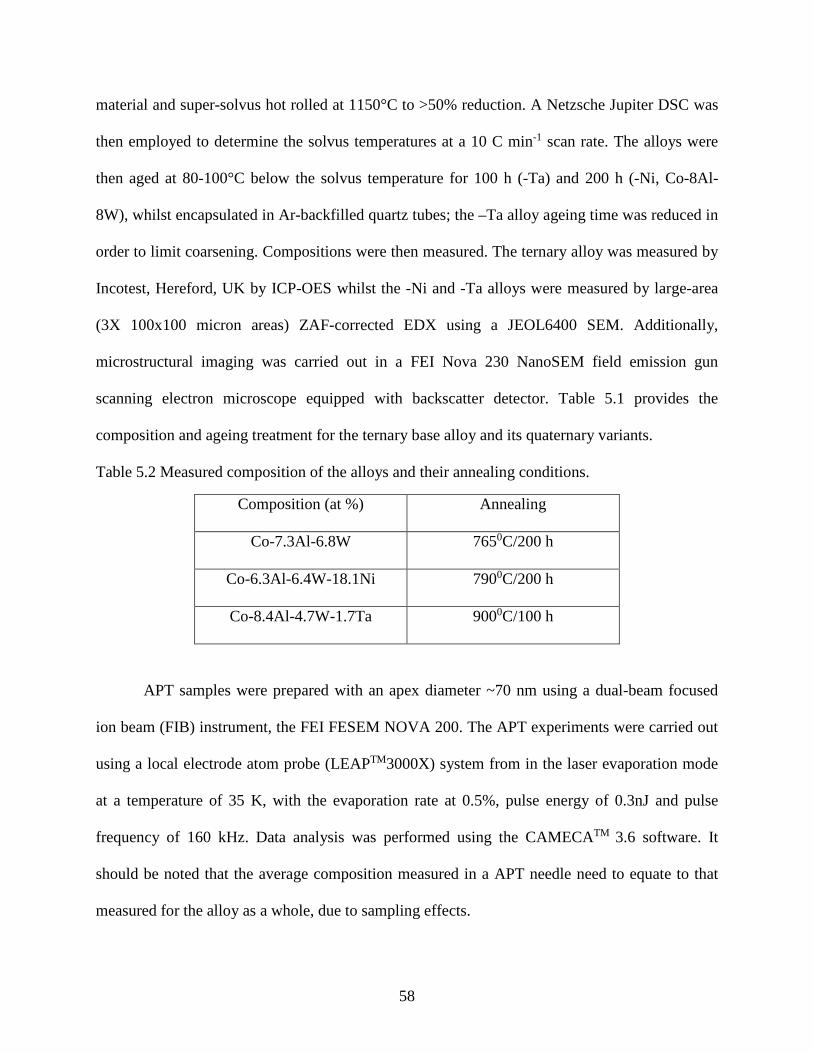
58
material and super-solvus hot rolled at 1150°C to >50% reduction. A Netzsche Jupiter DSC was
then employed to determine the solvus temperatures at a 10 C min-1 scan rate. The alloys were
then aged at 80-100°C below the solvus temperature for 100 h (-Ta) and 200 h (-Ni, Co-8Al-
8W), whilst encapsulated in Ar-backfilled quartz tubes; the –Ta alloy ageing time was reduced in
order to limit coarsening. Compositions were then measured. The ternary alloy was measured by
Incotest, Hereford, UK by ICP-OES whilst the -Ni and -Ta alloys were measured by large-area
(3X 100x100 micron areas) ZAF-corrected EDX using a JEOL6400 SEM. Additionally,
microstructural imaging was carried out in a FEI Nova 230 NanoSEM field emission gun
scanning electron microscope equipped with backscatter detector. Table 5.1 provides the
composition and ageing treatment for the ternary base alloy and its quaternary variants.
Table 5.2 Measured composition of the alloys and their annealing conditions.
Composition (at %) Annealing
Co-7.3Al-6.8W 7650C/200 h
Co-6.3Al-6.4W-18.1Ni 7900C/200 h
Co-8.4Al-4.7W-1.7Ta 9000C/100 h
APT samples were prepared with an apex diameter ~70 nm using a dual-beam focused
ion beam (FIB) instrument, the FEI FESEM NOVA 200. The APT experiments were carried out
using a local electrode atom probe (LEAPTM3000X) system from in the laser evaporation mode
at a temperature of 35 K, with the evaporation rate at 0.5%, pulse energy of 0.3nJ and pulse
frequency of 160 kHz. Data analysis was performed using the CAMECATM 3.6 software. It
should be noted that the average composition measured in a APT needle need to equate to that
measured for the alloy as a whole, due to sampling effects.

59
5.3 Results and Discussion
5.3.1 Analysis of a Co-Al-W Alloy
The γ/γ′ lattice mismatch, which depends on the composition of these phases, is the
primary governing factor determining the precipitate morphology, as well as the coarsening and
creep strength at high temperature for these alloys [1]. This motivates the detailed investigation
of partitioning behavior of alloying elements. The APT reconstructions shown in Figs. 5.1(a) and
(b) clearly exhibit cuboidal γ′ precipitates of size 20-30 nm in the Co-7Al-7W alloy, and the
opposite trend of partitioning of W(Red) and Co(Black) ions between the γ and γ′ phases. In
addition to the Co and W ions, iso-concentration surfaces (or iso-surfaces in short) corresponding
to 7at.% W have been plotted in Fig. 5.1(b). The Co,Al and W composition profiles,
corresponding to the same 7 at.% W iso-surface, and including multiple γ′ precipitates, are
shown in Fig. 5.1(c) as proximity histograms or proxigrams [14,15], generated using the IVAS™
reconstruction software. These proxigrams reveal a compositionally diffuse γ/γ′ interface with
partitioning of both Al and W to the γ′ phase.
If the composition of the γ′ phase is considered as an ideal stoichiometry of
Co3Al (Co sites : Al sites = 3:1) , the result obtained from APT (Table 5.2) can be used for site
preference analysis. Table 5.2 enlists γ′ composition for alloys under investigation and the
elements substituting to Al site summing their concentration ~25 at.% has been discussed in
manuscript in various sections. Similar approach for site preference in Ni3Al structure in Ni
superalloy has been reported earlier [16]. For Co-7Al-7W, the summation of Al content (~9.2 at
%) and W content (~14.9 at.%)in the γ′(listed in Table 5.2) is 24.1%, very close to the 25 at %
expected for a stoichiometric Co3(Al,W) phase. Based on this γ′ composition, it can be

60
concluded that both Al and W occupy the same sub-lattice in the ordered L12 structure, which
can be referred to as the Al sub-lattice based on a typical Ni3Al type structure.
Fig. 5.1 (a) Selected portion of an APT reconstruction with 7at. % W isosurface along with Co and W ions in Co-7at %Al-7at.%W alloy (b) Proxigram showing the composition profiles of Co, Al and W atom across γ/γ’ interfaces
5.3.2 Analysis of a Co-Al-W-Ni Alloy
The backscatter scanning electron microscope (SEM) image in Fig. 5.2(a) shows the
typical γ+γ′ microstructure in the Co-8Al-8W-25Ni (at.%) alloy with a γ′ of size in the range of
50-80 nm. The lower magnification inset in the same figure shows grain boundary precipitates
50-80 nm. The lower magnification inset in the same figure shows grain boundary precipitates
belonging to at least two different phases (visible from the contrast difference in the backscatter
SEM image). Such grain boundary phases in Co base alloys of similar composition have recently
been discussed in the published literature [17] but do not constitute the focus of the present
study.
35 nm
30 n
m
a b
γ
γ’

61
Fig. 5.2 (a) Backscattered SEM micrograph showing γ + γ’ microstructure in Co-6.3Al-6.4W-18.1Ni (at. %) alloy, inset shows grain boundary precipitates (b) APT reconstruction showing γ’ precipitate delineated with 7at % W isosurface in γ matrix (c) Proxigram showing the compositional profile of Co, Al and W atoms across γ/ γ’ interfaces
The APT reconstruction (Fig 5.2(b)) showing a 7 at.% W isosurface (red)and Co ions in black,
delineates narrow γ channels between γ′ precipitates. The proxigram shows that all three
elements (Ni, Al and W) partition towards γ′.The sum of the Al(~10.7at.%) and W(~10.6 at.%)
contents in γ′is~21at.%, while the Ni content is ~27.2 at.%. Based on these values, it is expected
that all the Al and W preferentially partition to the Al sub-lattice of the ordered L12 structure,
while Co and Ni occupy the other Co sub-lattice. As the Al+W content in γ′ is ~21at.%, Ni may
50 n
m
75 nm
b
a
c
γ γ’
0
5
10
15
20
25
30
-5 -4 -3 -2 -1 0 1 2 3 4 5
Con
cent
ratio
n (a
t%)
Distance (nm)
W
Ni
Al

62
have a site substitution effect on (Al, W) sublattice site as reported earlier [11]. Here, the
nominal stoichiometry of the γ′ phase can be deduced as (Co,Ni)3(Al,W).
5.3.3 Analysis of a Co-Al-W-Ta Alloy
Fig. 5.3(a) shows a backscatter SEM micrograph exhibiting theγ+γ′microstructure in the
Co-10Al-5W-2Ta alloy with a γ′ precipitate of size in the range of 160-200 nm. Additionally, the
inset in the same figure shows grain boundary precipitates of a similar nature as seen earlier in
case of the Co-8Al-8W-25Ni alloy, Fig. 2(a). Fig 3(b) shows an APT reconstruction consisting
of a 7 at.% W isosurface together with the Co ions in black. This reconstruction shows two
different size scales of γ′ precipitates. Such multimodal γ′ precipitation and coarsening has been
previously reported and extensively studied in Ni base superalloys and has been proved
beneficial for mechanical properties [18-20]. However, this is possibly the first report of such
multimodal γ′ precipitation in Co base alloys. While the mechanistic details associated with the
formation of such multimodal precipitate distributions is not the subject of this study, the
generally accepted model is that such microstructures results from multiple nucleation bursts
during continuous cooling and the different generations of precipitates subsequently grow and
coarsen during isothermal annealing. As this alloy has a high solvus temperature ~980°C [21],
during furnace cooling after solutionizing, presumably multiple γ′nucleation bursts can take
place. Even though other two alloys were subjected to the same nominal continuous cooling rate
after ageing, the absence of multiple nucleation bursts can be attributed to both lower solvus
temperatures and lower solute contents (e.g. Al).The compositional profiles (proxigrams)
corresponding to the primary γ′ precipitates, Fig 5.3(c), reveal a strong partitioning of W and Ta
towards γ′.
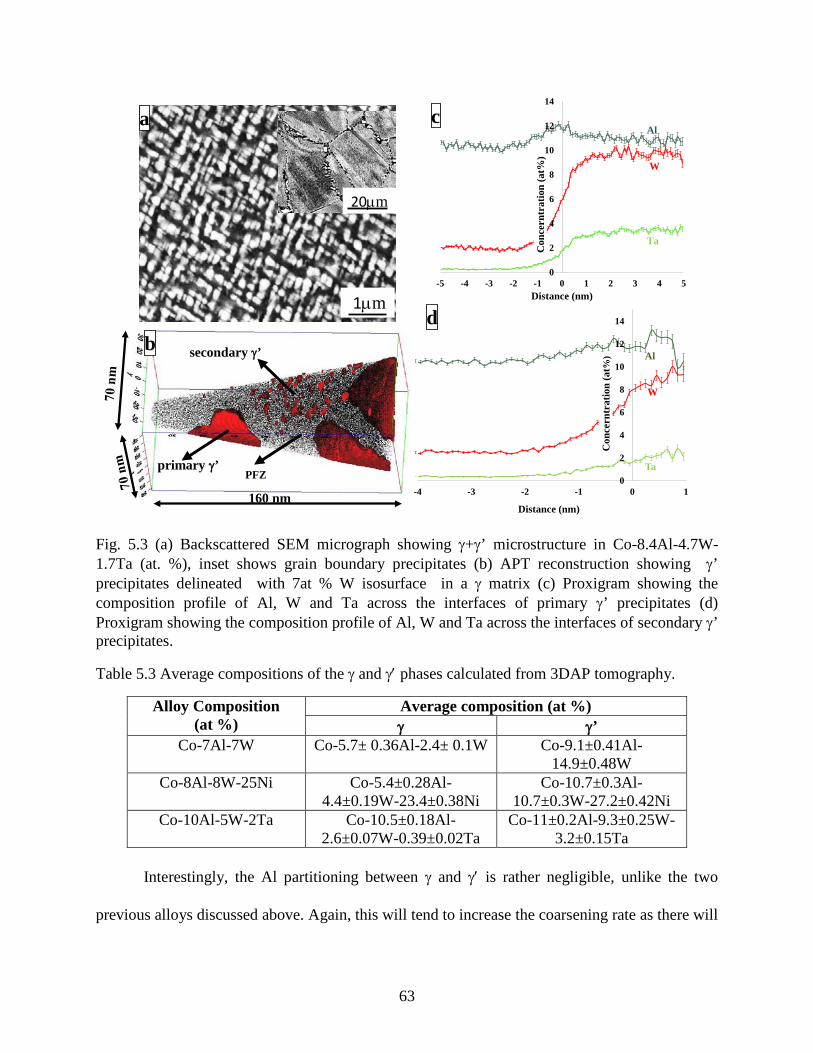
63
Fig. 5.3 (a) Backscattered SEM micrograph showing γ+γ’ microstructure in Co-8.4Al-4.7W-1.7Ta (at. %), inset shows grain boundary precipitates (b) APT reconstruction showing γ’ precipitates delineated with 7at % W isosurface in a γ matrix (c) Proxigram showing the composition profile of Al, W and Ta across the interfaces of primary γ’ precipitates (d) Proxigram showing the composition profile of Al, W and Ta across the interfaces of secondary γ’ precipitates.
Table 5.3 Average compositions of the γ and γ′ phases calculated from 3DAP tomography.
Alloy Composition (at %)
Average composition (at %) γ γ’
Co-7Al-7W Co-5.7± 0.36Al-2.4± 0.1W Co-9.1±0.41Al-14.9±0.48W
Co-8Al-8W-25Ni Co-5.4±0.28Al-4.4±0.19W-23.4±0.38Ni
Co-10.7±0.3Al-10.7±0.3W-27.2±0.42Ni
Co-10Al-5W-2Ta Co-10.5±0.18Al-2.6±0.07W-0.39±0.02Ta
Co-11±0.2Al-9.3±0.25W-3.2±0.15Ta
Interestingly, the Al partitioning between γ and γ′ is rather negligible, unlike the two
previous alloys discussed above. Again, this will tend to increase the coarsening rate as there will
0
2
4
6
8
10
12
14
-4 -3 -2 -1 0 1
Con
cern
trat
ion
(at%
)
Distance (nm)
W
Ta
Al
0
2
4
6
8
10
12
14
-5 -4 -3 -2 -1 0 1 2 3 4 5
Con
cern
trat
ion
(at%
)
Distance (nm)
W
Ta
Al
160 nm
primary γ’
secondary γ’
PFZ
1µm
20µm
a
b
c
d

64
be a reduced difficulty in diffusing Al through the matrix phase. Moreover, there is an interfacial
pile-up of Al as revealed in the compositional profile. This suggests that the equilibrium Al
content in the γ′ reduced from that occurring at the ageing temperature, resulting in the rejection
of Al from the interface on cooling. The experimentally observed trends in terms of partitioning
and segregation of Al, W, and Ta, raise some fundamental questions regarding the relative site
preferences of these elements. Summing the Al, W, and Ta contents in the γ’ phase gives a total
of 24.1 at.% indicating that the γ′ stoichiometry in this case is Co3(Al,W,Ta) with Al, W, and Ta
all occupying the same sub-lattice positions in the ordered L12 structure. However, the
composition profiles corresponding to these elements, shown in Fig. 5.3(c), clearly indicate that
as compared to W and Ta, Al has a lower preference for partitioning to the γ′ phase. While this is
a rather interesting observation, the underlying thermodynamic rationale is presently unknown
and requires further investigation. Similar trends in solute partitioning and segregation have also
been observed in case of the fine scale secondary γ′precipitates, Fig. 5.3(d).Table 5.2 lists the
average composition of both the γ matrix and the γ′ precipitates for the three different alloys
investigated. These compositions are expected to be close to equilibrium for the respective
annealing temperatures, since these alloys were annealed for prolonged time periods.
Analysis of the spatial changes in composition in two dimensions (2D) within the γ′
precipitates and the partitioning across the γ′/γ interface has been carried out by plotting 2D
composition contour maps, shown in Fig. 5.4. The specific volume of the Co-10Al-5W-2Ta APT
reconstruction used for the 2D contour mapping is of dimensions 24 nm x 15 nm x 2 nm
(thickness) and is shown in Fig. 5.4(a). This volume captures both the γ matrix and the γ′
precipitates. Fig. 5.4(b) shows the Al compositional spread in the form of a 2D contour map. The
segregation behavior of Al at the γ′/γ interface of Co-10Al-5W-2Ta is clearly visible. A similar

65
APT reconstruction, showing the box corresponding to the specific volume used for 2D contour
mapping of Al, and the corresponding contour map for the Co-8Al-8W-25Ni alloy, are shown in
Figs. 5.4(c) and (d) respectively. A recent report has mentioned a γ′/γ lattice mismatch of 0.34 %
and 0.78% respectively for similar Co-base alloys containing 25at.%Ni and 2at.%Ta, subjected
to similar annealing treatments [21].
Fig. 5.4 (a) Selected region (Blue) for 2D compositional contour calculation with 5at % W isosurface in Co-8.4Al-4.7W-1.7Ta (at. %) (b) Shows 2D composition contour maps with respect to Al (c) Selected region (Blue) for 2D compositional contour calculation with 7 at. % W isosurface in Co-6.3 Al-6.4 W-18.1 Ni (at. %) (d) Shows 2D compositional contour maps with respect to Al
γ/γ’interface
a b
c d
45 nm
60 n
m
γ
γ’
γ
γ’
50 nm
70 n
m
11-1210-119-10< 9
Region at% Al
9-108-97-8< 7
Region at% Al

66
The high γ′/γ lattice mismatch in case of the Ta containing alloy is expected to enhance the
interfacial energy, and hence the equilibrium segregation of Al to the interface can be speculated
to reduce the interfacial energy which in turn will affect the coarsening rate of these precipitates.
Further detailed investigations on segregation behavior of Al with respect to curvature of γ′
precipitates are required in order to rationalize the thermodynamics of interfacial segregation of
Al in these Co-base alloys using tools such as the Gibbsian interfacial excess of solute [22].
5.4 Conclusions
The present study provide the first experimental results of solute partitioning across the
compositionally-diffuse γ′/γ interface, and the site preferences of various alloying additions in
the γ′ phase of the base ternaryCo-7Al-7W (all at.%) alloy and two other quaternary alloys
containing Ni and Ta respectively. Based on the APT results, the following conclusions can be
drawn:
1. W, Al, and Ni exhibit strong tendencies for partitioning to the γ′ phase in the Co-7Al-
7W and Co-8Al-8W-25Ni alloys, whereas only W and Ta strongly partition to the γ′ phase in the
Co-10Al-5W-2Ta alloy, while Al partitions equally between γ and γ′ phases in the Ta containing
alloy. The addition of Ni to the γ also increased the solubility of W in the matrix phase.
2. Based on the γ′ compositions measured using APT in case all three alloys, the relative
stoichiometries (and sub-lattice or site occupancies of various alloying elements) have been
determined to be Co3(Al,W), (Co,Ni)3(Al,W), and Co3(Al,W,Ta) indicating that Ni and Co
occupy the same sub-lattice, while Al, W, and Ta occupy the same sub-lattice in the ordered L12
structure.

67
3. A distinct pile-up of Al is observed, even after long term annealing, at the γ′/γ
interface in case of the Co-10Al-5W-2Ta alloy. Additionally, Al appears to partition equally
between γ and γ′ phases in this alloy, unlike the other two alloys.
While these preliminary results of solute partitioning and sub-lattice preferences within
the γ′ phase of Co-base alloys are quite interesting, they also emphasize the need for more
detailed and systematic investigations of not only the solute partitioning behavior as a function of
alloy composition and annealing temperature, but also the need for accurate thermodynamic
modeling of the free energies of these phases.
5.5 References
[1] J. Sato, T. Omori, K. Oikawa, I. Ohnuma, R. Kainuma, K. Ishida, Science 312 (2006) 90.
[2] A. Suzuki, T.M. Pollock, Acta Mater. 56 (2008) 1288.
[3] M. Titus, A. Suzuki, T.M. Pollock, Scripta Mater. 66 (2012) 574.
[4] Q. Yao, H. Xing, J. Sun, Appl. Phys. Lett. 89 (2006) 161906.
[5] A. Bauer, S. Neumeier, F. Pyczak, M. Göken, Scripta Mater.63 (2010) 1197.
[6] T.M. Pollock, J. Dibbern, M. Tsunekane, J. Zhu, A. Suzuki, J. Mater. 62 (2010) 58.
[7] Y. Amouyal,Z. Mao, D.N. Seidman, Acta Mater. 58 (2010)5898.
[8] J.Y. Hwang, S. Nag, A.R.P. Singh, R. Srinivasan,J.Tiley, H.L. Fraser, R. Banerjee, Scripta Mater. 61 (2009) 92.
[9] M. Chen, C.Y. Wang, Scripta Mater. 60 (2009) 659.
[10] M. Chen, C.Y. Wang, J. Appl. Phys. 107 (2010) 093705.
[11] K. Shinagawa, T. Omori, J. Sato, K. Oikawa, I. Ohnuma, R. Kainuma, K. Ishida, Mater. Trans. 49 (2008) 1474
[12] Y.Amouyal, Z. Mao, C.Booth-Morrison,D. Seidman Appl.Phys. lett. 94,041917(2009)
[13] Y.F.Cui, X.Zhang, G.L.Xu, W.J.Zhu, H.S.Lie, Z.P.JinJ Mater Sci(2011) 46:2611-2621
68
[14] K.E. Yoon, R.D. Noebe, O.C. Hellman, D.N. Seidman, Surf. Interface Anal.36 (2004) 594.
[15] M.K. Miller,Surf. Interface Anal. 31 (2001) 593.
[16] Y Zhou,Z. Mao,C.Booth-Morrison,D. Seidman Appl.Phys. lett. 93, 171905(2008)].
[17] Y. Tsukamato, S. Kobayashi, T. Takasugi, Mater. Res. Soc. Symp. Proc. 1295 (2011).
[18] M.P. Jackson, R.C. Reed, Mater.Sci.Eng.A 259 (1999) 85.
[19] J.Y. Hwang, S. Nag, A.R.P. Singh, R. Srinivasan, J. Tiley,G.B.Viswanathan, H.L. Fraser, R. Banerjee, Metall. Mater. Trans.A40 (2009) 3059.
[20] J. Coakley, H. Basoalto, D. Dye,Acta Mater.58 (2010) 4019.
[21] H.Y. Yan, V.A. Vorontsov, J. Coakley, N.G. Jones, H.J. Stone, D. Dye, Accepted for publication in Superalloys 2012.TMS, Warrendale, PA, USA.
[22] A. Biswas, D.J. Siegel, D.N. Seidman, Phys. Rev. Lett. 105 (2010) 076102.

69
CHAPTER 6
COARSENING OF γ’ PRECIPITATES IN NI-BASE ALLOYS
6.1 Introduction
Nickel base superalloys typically consist of thermodynamically stable coherent L12-
ordered γ’ precipitates in a disordered FCC γ matrix. The change in morphology and size
distribution of the precipitates due to exposure to high temperature impacts their mechanical
properties [1].The coarsening behavior of γ’ precipitates during service is vital for mechanical
properties and extensive research work has been done to determine the mechanism and kinetics
of this coarsening process [2-10]. The classical coarsening theory developed by Lifshitz-
Slyozov[2] and independently by Wagner [3] collectively known as the LSW theory, assumes
solute diffusivity within the parent matrix as the rate-limiting step and also assumes no
precipitate-precipitate interactions. Davies et al. modified the basic mean-field nature of the
LSW theory and developed Lifshitz-Slyozov encounter modified (LSEM) [4] theory with the
assumption of instantaneous coalescence of particles due to overlapping of their diffusion field
during growth, resulting in a modification of the basic LSW rate law with a volume dependent
rate constant and a broader particle size distribution. Developing a better mechanistic
understanding of coarsening critically depends on a more detailed understanding of the
precipitate/matrix interface since fundamentally the total reduction of interfacial and elastic
energy is the thermodynamic driving force coarsening. Most previous phase field simulations of
coarsening kinetics have employed a computed interface width rather than a directly measured
physical width [11,12. Recently, Wen et al. [13] have incorporated local effects like dynamically
changing composition in the γ/γ’ interface region to model the coalescence kinetics

70
in a Ni-Al-Cr alloy. The rate of solute diffusivity across the γ/γ’ interface can also change the
coarsening mechanism, as recently proposed in the trans-interface diffusion controlled (TIDC)
coarsening model [5]. The application and relevance of the TIDC model [5] is critically
dependent on a detailed understanding of the nature of structural and compositional transitions
across the interface as highlighted in recent studies using high-resolution scanning transmission
electron microscopy (HRSTEM) and atom probe tomography (APT) [14]. This study shows that
the interface width measured from both of these complementary techniques are in excellent
agreement.
The present experimental study couples the dynamically changing width and composition
profile across the γ/γ’ interface with the kinetics of growth and coarsening of γ’ precipitates
during ageing of Ni-14Al-7Cr (at.%) alloy and 800°C, with a high γ’ volume fraction. It also
discusses the structural and compositional changes of the system during isothermal annealing at
650°C.
6.2 Materials and Methods
The as-cast Ni-14Al-7Cr (at.%) alloy was homogenized at 1200°C for 30 min followed
by water quenching. Quartz encapsulated samples with argon atmosphere were aged for 0.25, 1,
4, 16, 64, 256 h at 650ºC and 800ºC and finally water quenched. The rationale for selecting two
different isothermal temperatures for isothermal annealing is to compare and contrast the γ’
precipitate coarsening behavior with respect to compositional and structural aspects. Fig. 6.1
shows the isothermal sections of Ni- rich Ni-Al-Cr phase diagram, created using PANDATTM
software, where the expansion of phase field at lower temperature (650ºC) is clearly seen.

71
Fig. 6.1 Isothermal sections of Ni-rich Ni-Al-Cr phase diagram
Transmission electron microscopy (TEM) samples were prepared from mechanically
polished 3mm disk samples, subsequently reduced to 20 µm thickness using a dimple grinder,
and finally argon ion milled using a Fishione Model 1010 system. The centered dark field images
were obtained using a FEI Tecnai F20 microscope operating at 200 kV. Precipitate sizes and
circularity values were obtained by applying standard protocols to these images using the
IMAGEJTM software. APT samples were prepared with an apex diameter ~70 nm using a dual-
beam focused ion beam (FIB) instrument, the FEI FESEM NOVA 200. The APT experiments
were carried out using a CAMECA local electrode atom probe (LEAPTM3000X) system from in
the laser evaporation mode at a temperature of 35 K, with the evaporation rate at 0.5%, pulse
energy of 0.3 nJ and pulse frequency of 160 kHz. Data analysis was performed using the IVAS
3.6.2 software.
6.3 Coarsening Kinetics of γ’ Precipitates at 800°C
6.3.1 Structural Evolution of γ’ Precipitates
The centered dark field TEM images of typical γ+γ’microstructures observed in the Ni-
650°C 800°C

72
14Al- 7Cr(at.%) alloy, after isothermal annealing at 800°C for various time periods, are shown in
Fig. 6.2. An accelerated growth and coarsening of spherical γ’ precipitates is clearly visible in
the early stages of annealing (Fig.6.2 (a), (b) and (c)). Upon further annealing, the morphology
tends change towards a cuboidal type with spherical edges as shown in Figs. 6.2(d), (e) and (f ).
Fig. 6.2 Centered Dark field micrographs showing γ’ in Ni-14Al-7Cr(at.%), isothermally aged at 800°C for (a) 0 h (b)0.25 h (c) 1 h (d) 4 h (e) 64 h and (f) 256 h conditions
This change in morphology can be attributed to the anisotropic elastic properties of these
precipitates, resulting in a strong spatial alignment along elastically soft <100> direction, as
50 nm
50 nm
200 nm200 nm
200 nm
c
a
d
b
e f

73
described in detail elsewhere [15]. The precipitate size distributions (PSD), for four of the
annealing time periods, measured using multiple dark-field images for each case (using the
IMAGEJTM software), have been summarized in Fig. 6.3(a-d). The number of precipitates used
in these analyses ranged from 50-100. Additionally, a comparison of the average precipitate sizes
and circularity values, as a function of annealing time, is given in Table 6.1.
Fig. 6.3 Particle size distribution for different ageing time (a) 0.25hr (b) 1 hr (c) 4 hrs (d) 256hrs and (e) Linear fit of precipitate size (nm) vs. cube root of annealing time
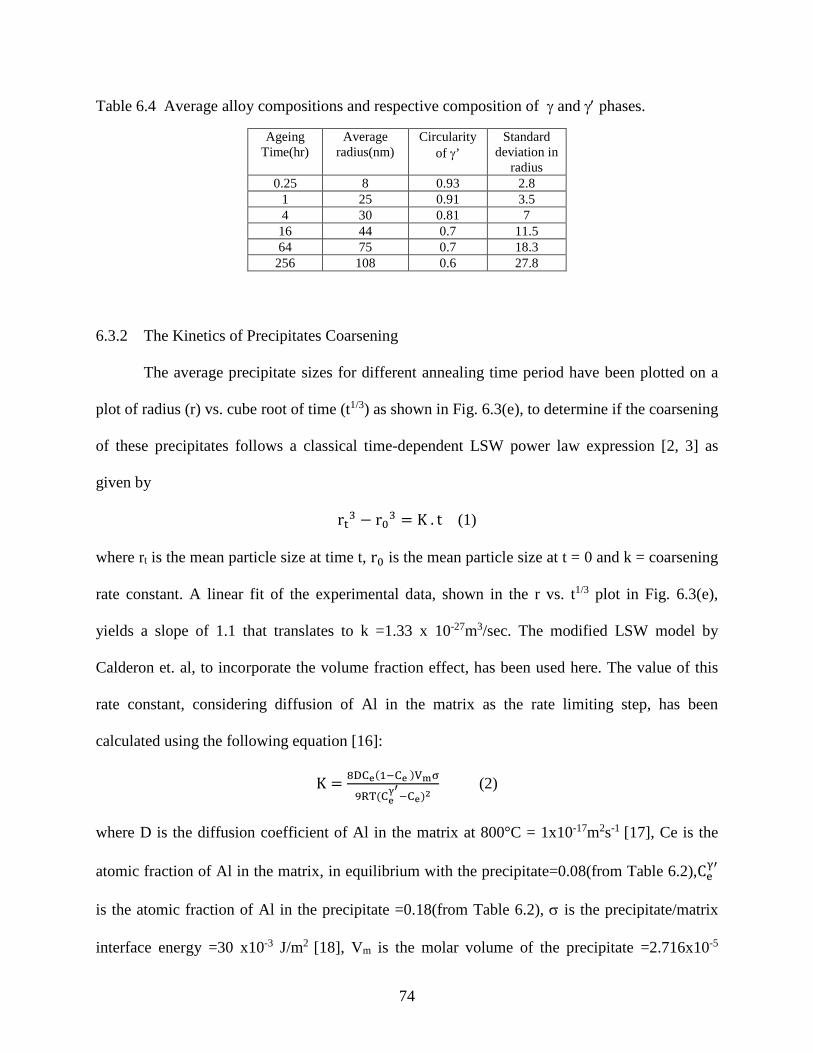
74
Table 6.4 Average alloy compositions and respective composition of γ and γ′ phases.
Ageing Time(hr)
Average radius(nm)
Circularity of γ’
Standard deviation in
radius 0.25 8 0.93 2.8
1 25 0.91 3.5 4 30 0.81 7
16 44 0.7 11.5 64 75 0.7 18.3
256 108 0.6 27.8
6.3.2 The Kinetics of Precipitates Coarsening
The average precipitate sizes for different annealing time period have been plotted on a
plot of radius (r) vs. cube root of time (t1/3) as shown in Fig. 6.3(e), to determine if the coarsening
of these precipitates follows a classical time-dependent LSW power law expression [2, 3] as
given by
rt3 − r03 = K . t (1)
where rt is the mean particle size at time t, r0 is the mean particle size at t = 0 and k = coarsening
rate constant. A linear fit of the experimental data, shown in the r vs. t1/3 plot in Fig. 6.3(e),
yields a slope of 1.1 that translates to k =1.33 x 10⁻²⁷m3/sec. The modified LSW model by
Calderon et. al, to incorporate the volume fraction effect, has been used here. The value of this
rate constant, considering diffusion of Al in the matrix as the rate limiting step, has been
calculated using the following equation [16]:
K = 8DCe(1−Ce )Vmσ
9RT(Ceγ′−Ce)2
(2)
where D is the diffusion coefficient of Al in the matrix at 800°C = 1x10-17m2s-1 [17], Ce is the
atomic fraction of Al in the matrix, in equilibrium with the precipitate=0.08(from Table 6.2),Ceγ′
is the atomic fraction of Al in the precipitate =0.18(from Table 6.2), σ is the precipitate/matrix
interface energy =30 x10-3 J/m2 [18], Vm is the molar volume of the precipitate =2.716x10⁻⁵

75
m3mol-1 [19], R is the universal gas constant=8.31Jmol-1K-1and T is the absolute temperature
=1073 K. Putting all these values in the above mentioned equation gives the value of k to be
6.5 x 10⁻²⁷ m3/sec, that is in reasonable agreement with the experimental determined value noted
above. The difference between these two values of k can be possibly attributed to the
inaccuracies associated with the values of D, σ, as well as the measurement of the precipitate
sizes from the TEM dark-field images. It should be noted that while the points on the plot shown
in Fig. 2(e), corresponding to the longer annealing time periods, are in good agreement with the
linear fit, the temporal power law exponent has been calculated to be 0.318 from a log r vs. log t
plot, and consequently appear to follow classical LSW coarsening. The two points corresponding
to the early stage of annealing show substantial departure from the LSW prediction. Therefore, it
appears that there is a period of rapid increase in the average precipitate size at the early stages of
annealing that can be attributed to a high degree of γ’ precipitate coalescence. According to the
LSW model, the maximum allowed normalized PSD is 1.5. Excluding the early stage of
annealing, i.e. at 0.25 hr showing a maximum normalized PSD value of 1.76 (refer to Fig.
6.3(a)), for longer annealing times, these values range from 1.5 to 1.6, which is very close to the
allowed upper limit based on the LSW model. The high value of PSD at 0.25 h can be attributed
to high degree of precipitate coalescence, broadening its tail. So it is conclusive from time
invariant PSDs onwards 1 h of annealing that the matrix diffusion limited microstructural
evolution is self-similar.
6.3.3 Temporal Evolution of Composition of Phases and Interface Profile
Fig. 6.4 shows the APT reconstructions of γ + γ’ microstructure in samples annealed at
800°C for various time periods, created by the 14 at. % Al isoconcentration surfaces. The blue

76
regions in the figure are the γ’ precipitates. Fig. 6.4(a) and (b) represents the water quenched and
1h annealed sample, where there are significant amount of coalescence of γ’ precipitates, similar
to the TEM results. In the later stage of annealing (Fig. 6.4(c-f)), APT capture only partial γ’
precipitates.
Fig. 6.4 APT reconstruction delineated with 14% Al iso-surface showing coalescence of γ’ in Ni-14Al-7Cr (at.%) isothermally aged at 800°C for (a) 0 h (b) 0.25 h (c)1 h (d)16 h (e) 64 h (f) 256 h.
The Al and Cr composition profiles, corresponding to the 14at.% Al isosurface, for all the
annealing conditions have been shown in Fig. 6.5 as proximity histograms or proxigrams
[20,21], generated using the IVAS™ reconstruction software. The elemental partitioning across
the γ/γ’ interface and the compositional width, corresponding to Al partitioning, have also been
summarized in Table 6.2. Additionally, local and far-field γ matrix compositions for the different
a
fed
cb11
0 nm
350
nm
250
nm
90 n
m
100
nm
80 n
m

77
annealing times have been included in the same table. Recently, Ardell [20] has discussed the
calculation of the width of coherent γ/γ’ interfaces from diffuse concentration profiles across the
interface, using the concept of a gradient energy term, originally developed by Cahn and Hilliard
[22]. Here, the compositional width of the interface has been estimated based on the approach
suggested by Ardell [23]. The quantitative data shown in Table 6.2 and the proxigrams shown in
Fig. 6.5 substantiate this clear distinction between the early stages (time period from 0 to 1 h)
where concomitant growth and coarsening occurs, and the later stages from 4hrs to 256 h where
steady-state coarsening appears to take place. Table 6.2 shows that the interface width changes
from 3.5 nm to 2.5 nm during the early stages of annealing. At the same time the Al content in
the γ matrix decreases from 9.5 to 8.6 at.% with increasing distance from the γ/γ’ interface. This
gradual change in matrix composition is an indication of far-field non-equilibrium compositions.
The compositionally diffuse nature of the interface coupled with the high volume fraction
of γ’, results in rather small inter-precipitate distances, favoring local phenomena like
coalescence of precipitates to decrease interfacial energy. The opposite trend can be observed in
case of the Cr composition profile as shown in Fig. 6.5 as well as reflected in the values in Table
6.2. These results indicate that local effects associated with the interface, such as elemental
partitioning and variation in the compositional width, are responsible for the high degree of
precipitate coalescence, leading to a high rate of increase in precipitate size during the early
stages. Zhu et al.[11] has discussed the accelerated coalescence of neighboring γ’ precipitates
with large interface widths based on simulation studies. Additionally, previous experimental
study [24] has also reported a higher coarsening rate than that predicted by the LSW model, has
also reported a higher coarsening rate than that predicted by the LSW model, due to coalescence.
The present experimental studies also exhibit a transient depletion of Al and enrichment of Cr,

78
adjacent to the γ/γ' interface, during the early stages of annealing, as shown in Figs. 6.5(a), (b)
and (c) and listed in Table 6.2.
Fig. 6.5 Composition profile and interface width across γ/γ’ in Ni-14Al-7Cr(at.%) annealed at 800°C for (a) 0 h (b)0.25 h (c) 1 h (d) 16 h (e) 64 h and (f) 256 h

79
Table 6.5 : Average alloy compositions and respective composition of γ and γ′ phases.
Ageing Time (hr.)
Far field γ comp (at %)
Local equilibrium
γ comp (at %)
γ’ comp (at %)
Interface width,δ (nm)
Al Cr Al Cr Al Cr
0 9.5 7.5 9.1 8.4 18.8 5.7 3.5
0.25 9.2 8.7 8.9 8.9 18.2 5.6 3
1 8.6 8.4 8.0 8.6 18 5.6 2.5
4 8 8.5 8 8.5 17.3 5.9 2.1
16 8.3 8.3 8.3 8.3 18 5.8 2
64 8.3 8.2 8.3 8.2 17.5 5.6 2
256 8.0 8.5 8.0 8.5 18 5.9 2
These transient compositional effects can be attributed to diffusion-limited growth as explained
elsewhere [29]. Also, the gradual increase in solute partitioning across the γ/γ’ interface, with
annealing time, affects the misfit between these two phases and the resultant strain energy, and
consequently the circularity values change as shown in Table 6.1.
6.4 Coarsening Kinetics of γ’ Precipitates at 650°C
Fig. 6.6 shows the temporal radius evolution of γ’ precipitates at 650°C. Upto 4 h of
annealing, there is no spatial correlation of precipitates. But, with increase in size scale at 64 h,
the precipitates develop elastic interactions to create spatial correlation. The average size scales
of the precipitates are given in Table 6.3.

80
Fig. 6.6 Centered Dark field micrographs showing γ’in Ni-14Al-7Cr(at.%), isothermally aged at 800°C for (a) 0 h (b)0.25 h (c) 1 h (d) 4 h (e) 64 h and (f) 256 h conditions
Table 6.3 Temporal evolution of γ' size scale
Ageing Time(hr) Average radius(nm) 1 1.1 4 6.4 64 10.4 256 17.8
Fig. 6.7 shows a linear fit between precipitate size and cube root of annealing time.
Similar to early stage of coarsening behavior at 800°C, there is evidence of accelerated
coarsening at early stage of annealing at 650°C. Using the values in this plot, the coarsening rate
constant (K) was determined to be k =6x 10-30 m3/sec. The accelerated growth rate at early stage
of annealing, as shown in Fig. 6.7, can be attributed to the high degree of precipitate coalescence.
20 nm 20 nm
50 nm 20 nm
256 h64 h
4 h1 ha
d
b
c

81
Fig. 6.7 Linear fit of precipitate size (nm) vs. cube root of annealing time
Fig. 6.8 shows the proximity histogram created from 14 at.% isosurfaces. The
composition of γ’ precipitate is Ni-17.2 ± 0.3 Al -5.9 ± 0.2 Cr (at.%) and for γ matrix is Ni-6.2
± 0.2 Al-9.4 ± 0.2 Cr (at.%). Although the composition of γ’ precipitate is almost same at 650°C
and 800°C, the γ matrix has higher Cr at 650°C than that at 800°C. The reasoning comes from
expansion of γ + γ’ phase field at lower temperature, as shown by isothermal section of phase
diagram in Fig. 6.1.
Fig. 6.8 Composition profile across γ/ γ ' interface in Ni-Al-Cr sample, annealed at 650°C for 256 h.
y = 0.1821x - 0.0779
0
5
10
15
20
0 20 40 60 80 100 120Time( t 0.33)
Radi
us (n
m)
4
6
8
10
12
14
16
18
20
-6 -4 -2 0 2 4 6
25 nm
γ’γ
256 h800°C

82
6.5 Conclusions
Based on experimental results of isothermal annealing of Ni-14Al-7Cr, the following
conclusions have been made.
1. The early stage of coarsening mechanism, at both 650°C and 800°C appears to be
dominated by precipitate coalescence leading to a more rapid coarsening rate as compared to the
classical LSW theory (or Ostwald ripening).
2. This non-classical coalescence-dominated coarsening behavior is accompanied by a
gradual reduction in the compositional width of the γ/γ’ interfaces from 3.5 to 2 nm.
3. There is a transition from the non-classical coalescence-dominated coarsening
behavior to more traditional LSW coarsening at longer time periods of annealing during which
the compositional width of the γ/γ’ interfaces achieves an equilibrium value.
6.6 References
[1] R.C. Reed, The superalloys, fundamentals and applications. Cambridge: Cambridge University Press; 2006.
[2] I.M. Lifshitz, V.V. Slyozov, J Phys Chem Solids 19 (1961) 35
[3] C. Wagner, Z Elektrochem 65 (1961) 581
[4] C.K.L. Davies, P. Nash, R.N. Stevens, Acta Metall. 28 (1980) 179.
[5] A.J. Ardell, V. Ozolins, Nat Mater. 4 (2005) 309
[6] A.J. Ardell, Acta Metall. 20 (1972) 61
[7] A.J. Ardell, R.B. Nicholson, J Phys Chem Solids 27 (1966) 1793
[8] P.W. Voorhees, J Stat Phys 38 (1985) 231
[9] D. McLean, Metal Sci. 18 (1984) 249.
[10] A.J. Ardell, Scripta Metall. Mater. 24(1990) 343

83
[11] J.Z. Zhu, T. Wang, A.J. Ardell, S.H. Zhou, Z.K. Liu, L.Q. Chen, Acta Mater. 52 (2004) 2837
[12] S.G. Kim, W.T. Kim, T. Suzuki, Phys Rev E 60 (1999) 7186
[13] Y.H. Wen, J.P. Simmons, C. Woodward, Modelling Simul. Mater. Sci. Eng. 18 (2010) 055002
[14] R. Srinivasan, R. Banerjee, J.Y. Hwang, G.B. Viswanathan, J. Tiley, H.L. Fraser , Phys Rev Lett. 102 (2009) 086101
[15] Y. Wang, A.G. Khachaturyan, Acta Metall. Mater. 43 (1995) 1837
[16] H.A. Calderon HA, P.W. Voorhees PW, J.L. Murray JL, G. Gkostorz G, Acta Metall., 42, 991(1994)
[17] W.F. Gale, T.C. Totemeier, Smithell’s handbook. 8th ed. Oxford: Butterworth-Heinemann; 2004
[18] A.J. Ardell, J Mater Sci. 46 (2011) 4832
[19] D. McLean, Metal Sci. 18 (1984) 249
[20] K.E. Yoon, NoebeRD, HellmanOC and Seidman DN.Surf. Interface Anal., 36 (2004), p. 594
[21] M.K. Miller, Surf. Int. Anal., 31 (2001), 593
[22] J.W. Cahn, J.E. Hilliard, J. Chem. Phys. 28 (1958) 258
[23] A.J. Ardell, Scripta Mater. 66 (2012) 423-426
[24] A.A. Hoopgood , J.W. Martin, Mat. Sci. Eng. 2 (1986) 543
[25] C.K. Sudbrack, R.D. Noebe, D.N. Seidman, Solid-Solid Phase Transformations in Inorganic Materials, 2 (2005) 54
84
CHAPTER 7
FIELD EVAPORATION BEHAVIOR IN SUPERALLOYS3
7.1 Introduction
The progress of design and fabrication in materials science demands simultaneous
advancement in higher-end microscopy to understand the true atomic scale architecture
of materials. A comprehensive understanding of materials at the atomic level by
advanced microscopy along with modeling tools can determine the underlying science of
the observed performance. Advancements in transmission electron microscopy, such as
three-dimensional (3D) tomography and aberration corrected techniques have enabled the
extraction of structural and compositional information in materials with very high
resolution (in some cases approaching sub-angstrom resolution). However, this technique
has mass sensitivity for beam diffraction, and hence has limited light element
detectability [1]. Along with that, this technique is restricted in the characterization of
embedded nano-scale features, within the sample thickness, as the beam pass through
multiple phases [2]. On the other hand, atom probe tomography (APT) works on the
principle of evaporating materials in a controlled, atomic layer by atomic layer manner,
to generate three dimensional (3D) compositional maps with the highest spatial resolution
as compared to that in other tomography tools and does not suffer from the above
mentioned problem. However, it should be noted that the limited efficiency of detectors
used in present generation APT instruments, results in a substantial loss of information,
consequently resulting in a loss in spatial resolution. There are numerous efforts currently
3 A part of this chapter is reproduced from ‘Probing the crystallography of ordered phases by coupling of orientation microscopy and atom probe tomography’ S. Meher, P. Nandwan, T. Rojhirunsakool, J. Tiley, R. Banerjee, Ultramicroscopy, vol. 148 (2015), p. 67-74, with permission from Elsevier

85
underway to both improve the efficiency of detectors, [3] as well as model the positions of the
missing atoms using advanced computational tools [4].
Superalloys are a class of materials that possess stable microstructures at elevated
temperatures due to the presence of coherent L12 γ’ precipitates spatially aligned along
elastically soft directions in a face centered cubic (FCC) γ matrix [5]. Nickel-base superalloys are
used in a variety of applications such as in turbine blades of aircraft engines and land-based
turbine engine [5]. The recent discovery of novel Co-base alloys [6], which also form γ−γ’
microstructures, similar to nickel base superalloys, has led to rapid research in these alloys as
potential next generation superalloys [7-9]. The structural and compositional information
obtained by APT has given insights to the atomistic behavior of nickel and cobalt-base
superalloys [10-13]. The observation of lattice planes in the APT reconstruction allows for
characterization of the ordered precipitates in terms of site occupancy of solute atoms within the
precipitates [14-16]. Recent studies on quantification of the compositional width of γ/γ’
interfaces by APT have associated the energetics of the interface with the coarsening of γ’
precipitates [11,17-20]. Apart from these studies, APT in conjunction with modeling tools has
accurately quantified and rationalized segregation of elements at interphase interfaces in various
systems [21-23].
There is an increasing effort towards obtaining crystallographic information at the highest
possible resolution using APT [15, 25-27]. Novel techniques developed towards this end, are
being employed for three-dimensional (3D) orientation mapping of grain boundaries in nano-
crystalline materials and sub-lattice occupancy of trace and solute atoms [24,27]. The
hemispherical surface of the atom probe tip cuts multiple planes of different crystallographic
orientations, and subsequent ionization of the same surface results in the presence of multiple

86
crystallographic poles in the two dimensional (2D)-desorption image. The desorption image
obtained in APT is analogous to that obtained in field ion microscopy (FIM) and ion desorption
microscopy [28,29]. The arrangement of poles in a 2D desorption image is used to understand
the 3D crystallography of the materials where individual lattice planes are resolved in both
metals and semiconductors [16, 30]. Due to trajectory aberrations associated with field
evaporation of ions, the crystallographic poles appear to be joined by zone lines. However, to a
large extent, crystallographic studies using APT have been limited to pure metals or dilute alloys
where individual poles and zone lines are clearly visible even within a limited field of view [27,
31]. The algorithms like Fourier transforms and Hough transforms have been used to index the
poles in the desorption image [24, 32]. However, highly alloyed materials, typically yield low
contrast in 2D-desorption images due to the large differences in the evaporation fields associated
with multiple elements. Consequently, the identification of multiple crystallographic poles in
these desorption images becomes rather challenging. Hence, crystallographic studies using the
present generation techniques have been very difficult for such multi-component systems [33].
The factors that can deteriorate the spatial resolution in APT and consequently limit the
crystallographic information, especially in superalloys, have been discussed:
(i) orientation offset of the desired crystallographic plane in the atom probe tip with respect to the detector
(ii) the type of material
(iii)operating temperature
(iv) the Miller indices of the specific crystallographic plane under investigation

87
7.2 Materials and Methods
The as-cast Co-10Al-10W (at. %) and Co-10Al-10W-2Ta (at %) alloys were
encapsulated in a quartz tube which was vacuumed and backfilled with argon. The alloys were
supersolvus solution treated in a vacuum furnace at 1250°C in the single γ phase field for 12 hrs.
to dissolve any existing γ’, followed by water quenching. Then, quartz encapsulated
homogenized sample with argon atmosphere was aged for 256 hrs. at 900ºC and finally water
quenched. The annealed samples were then prepared by conventional metallographic studies for
orientation microscopy studies using electron backscatter diffraction (EBSD) .Electron
backscatter diffraction studies were carried out in a dual-beam focused ion beam (dual-beam
FIB) instrument, the FEI FESEM NOVA 200, retrofitted with EDAX DigiView IV EBSD
camera. TSL OIM Data Collection and TSL OIM Data Analysis 5.3 software were used for data
acquisition and analyses respectively. The microscope stage was tilted to 61o for EBSD data
collection. The angle of tilt was limited by the allowed tilt in the microscope. The sample surface
was then scanned in a systematic manner from one edge to the other, with each scan covering an
approximate area of 500 µm x 500 µm with a step size of 10 µm. Once the desired {001} plane
was obtained in the scan, another high resolution scan with a step size of 0.5 µm was carried out
in the interested grain, and pole figures were plotted to confirm the grain orientation. Once
identified, the boundaries of the grain were marked by trenches cut using the ion beam by tilting
the stage back to 52o at the same time keeping the scanned region in focus. This tilt was also
aided by the hydrocarbon deposits on the sample surface that occur during the EBSD scan. The
stage was then tilted back to 22o, and site specific APT samples were prepared using the dual-
beam FIB lift-out process. Experiments were carried out using a local electrode atom probe
(LEAPTM 3000X) system in the voltage evaporation mode at a temperature range of 40 to 60 K,

88
with the evaporation rate at 0.5% and pulse frequency of 200 kHz. Data analysis was performed
using IVAS 3.6.6.
7.3 Results
The applicability of APT to superalloys critically depends on the understanding of factors
governing the spatial resolution. In the following sub-sections, the effects of various factors on
spatial resolution have been discussed.
7.3.1 Effect of Orientation Offset
In the following case study on a multi-component cobalt-base alloy, site-specific lift-outs
with two different offsets to <001> direction have been chosen to study the impact of the
orientation of these planes on the spatial resolution.
Fig. 7.1(a) is a backscattered SEM micrograph, which shows the typical dispersion of
cuboidal γ’ precipitates along elastically soft <001> directions in a γ matrix in Co-10Al-10W (at
%) alloy. The size scale of γ’ precipitates ranges from 200-250 nm. Using EBSD-assisted dual-
beam FIB, as described in previous experimental section of this paper, site-specific samples were
lifted out from a γ grain whose <001> crystallographic direction was nearly perpendicular to the
sample surface. Fig. 7.1(b) shows the corresponding pole figure (PF) that indicates the
orientation of the grain is 12° off from the <001> direction. Fig. 7.1 (c) shows a secondary SEM
micrograph obtained during the sample preparation in the dual-beam FIB, which confirms that
the alignment of the γ’ precipitates in the near vertical direction, off by ~12°, so that the
{002} lattice planes are nearly normal to the tip axis. However, it should be noted that the
macroscopic measurement of this mis-orientation ~ 12° is only approximate since the actual mis-

89
orientation of the γ/γ’ interfaces may differ. Fig. 7.1(d) represents the 2D desorption image from
the APT data, which shows a central <001> pole with four other poles around it, maintaining the
expected four-fold symmetry. The identification of other poles is not relevant to this study.
Fig. 7.1 (a) Backscattered SEM micrograph showing dispersion of spatially correlated γ’ precipitates in a γ matrix (b) EBSD pole figure showing that the dual-beam FIB lift-out is closer to <001> axis with an offset of 12° (c) the pre-final tip prepared using dual-beam FIB shows alignment of precipitates in the near vertical direction, off by ~12° (d) 2D desorption image show
b
c
12°
d
[001]
1 µm
e
18°
γ’
γ

90
poles and zone lines with central <001> pole, having a four-fold symmetry (e) APT reconstruction show γ’ precipitates in a γ matrix which are 18° off to the <001> direction The position of the central pole relative to the center of the desorption image is also a good
indicator of the offset of the planes relative to the detector. Fig. 7.1(e) represents the ionic APT
reconstruction exhibiting only W ions and also showing the γ/γ’ interfaces, created using an
isoconcentration surface (9 at %) of the strongly partitioning element W. The APT reconstruction
shows that the offset of the <001> crystallographic direction with respect to the tip axis is ~18°.
In another test case, the desired plane of lift-out was chosen to be nearest to <001>
direction from a different grain using the same methodology so that the lift-out has near zero
offset. The inverse pole figure (IPF) corresponding to this grain, from the OIM data, has been
shown in Fig. 7.2(a), which indicates only a 1° offset of the pole from the <001> orientation. The
SEM micrograph, obtained during sample preparation in the dual-beam FIB, as shown in Fig.
7.2(b) also confirms the alignment of γ’ precipitates along the tip axis with minimal offset as
compared to that in Fig. 7.2(c). Fig. 7.2(c) shows the 2D desorption image, which contains the
crystallographic feature corresponding to the four-fold symmetry of poles around the central
<001> pole. Fig. 7.2(d) shows the corresponding APT reconstruction where a near horizontal γ-
γ’ interface is observed, which confirms the accuracy of the reconstruction procedure.
Previous observations of lattice planes in atom probe reconstructions largely relied on random
sampling to obtain certain sets of crystallographic planes which are nearly parallel to the detector
in a polycrystalline material [31]. In most of the cases, the depth resolution along any direction is
obtained by tilting the selected area in X and Y directions so that the selected region cuts lattice
planes in perpendicular directions. If the selected area has to be tilted in X and Y directions, the
overall resolution will have contributions from the limited lateral resolution of this technique.
The coupling with orientation microscopy (OM) permits the unique identification and indexing
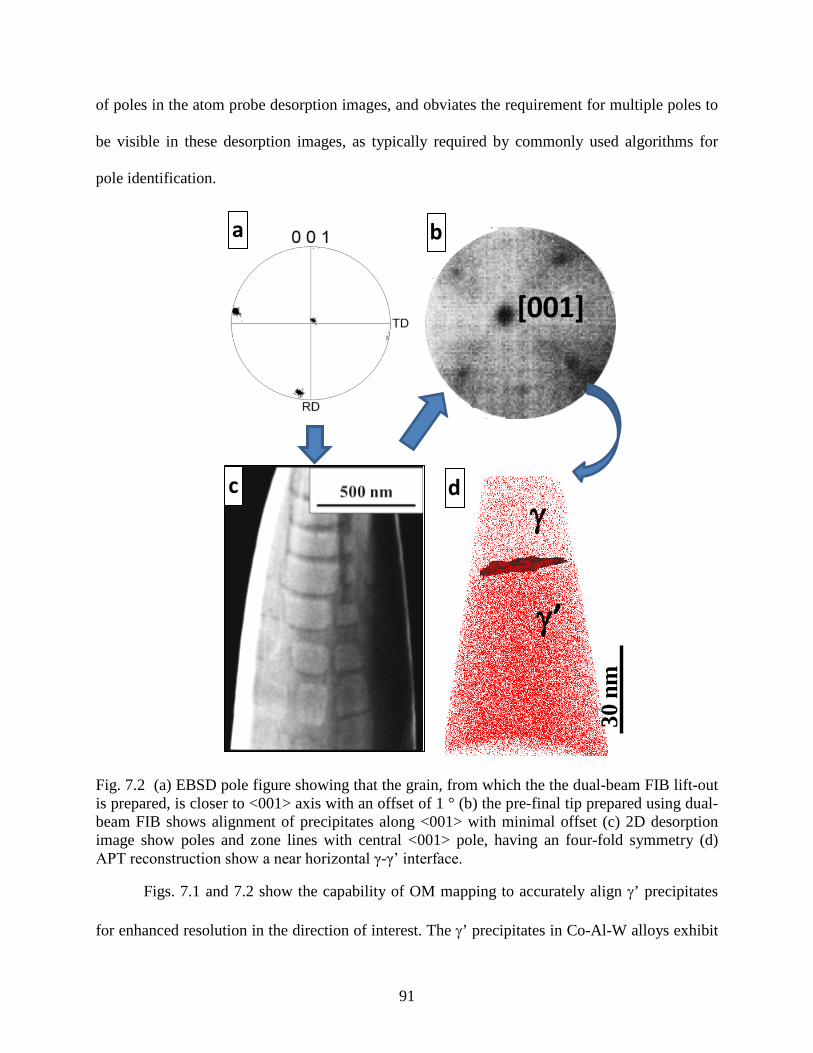
91
of poles in the atom probe desorption images, and obviates the requirement for multiple poles to
be visible in these desorption images, as typically required by commonly used algorithms for
pole identification.
Fig. 7.2 (a) EBSD pole figure showing that the grain, from which the the dual-beam FIB lift-out is prepared, is closer to <001> axis with an offset of 1 ° (b) the pre-final tip prepared using dual-beam FIB shows alignment of precipitates along <001> with minimal offset (c) 2D desorption image show poles and zone lines with central <001> pole, having an four-fold symmetry (d) APT reconstruction show a near horizontal γ-γ’ interface.
Figs. 7.1 and 7.2 show the capability of OM mapping to accurately align γ’ precipitates
for enhanced resolution in the direction of interest. The γ’ precipitates in Co-Al-W alloys exhibit
γ’
γc d
ba
[001]
30 n
m

92
the L12 crystal structure, as shown in Fig. 7.3(a). The Co atoms are present at face centers
(green) and Al, W shares the cube corner (yellow), which maintains the basic Co3(Al, W)
stoichiometry. So the {002} planes comprise of only the Co atoms while Al and W, along with
Co are present in every {001} plane, which is a mixed atom plane. Usually the undistorted lattice
planes in the APT reconstruction are visible down the crystallographic poles that can extend
throughout the reconstruction. Figs. 7.3(b-c) represent enlarged sections of an APT
reconstruction showing the {001} lattice planes of Co and (Al + W) ions respectively in the Co-
Al-W alloy. The samples were evaporated at a temperature of 60 K. The reconstructions show
that the lattice planes are oriented at an angle of 12 o to the tip axis, as described in Fig. 7.1.
With the prior knowledge of inter-planar spacing of (001) planes in Co-Al-W alloy as 0.36 nm
[40], the image compression factor (ICF) in the reconstruction has been adjusted to the value of
1.5 to obtain the theoretical inter-planar spacing in the reconstruction. The same method has been
used to calibrate all the reconstructions in this paper. In the present study, spatial distribution
maps (SDM), the commonly used algorithm for structural analysis, have been used [33]. SDM is
essentially a combination of two radial distribution functions: one represents the distribution of
inter-atomic separations in the z-direction and the other one being a 2D map describes the atomic
positions in the corresponding x-y lateral plane. Fig. 7.3(d) shows the z-SDM for Co-Co
interactions, which was created by precisely adjusting the region of interest in the perpendicular
direction to the crystallographic planes. This SDM shows the presence of peaks separated by a
distance of 0.36 nm. The width of the peaks in the SDM is indicative of the spatial resolution, the
details of which can be found elsewhere [3]. To obtain the spatial resolution in this experimental
condition, the central peak of Co ions was fitted to a Gaussian curve whose width was calculated
to be about 0.36 nm. Interestingly, the (002) planes, which consist purely of Co atoms, are not
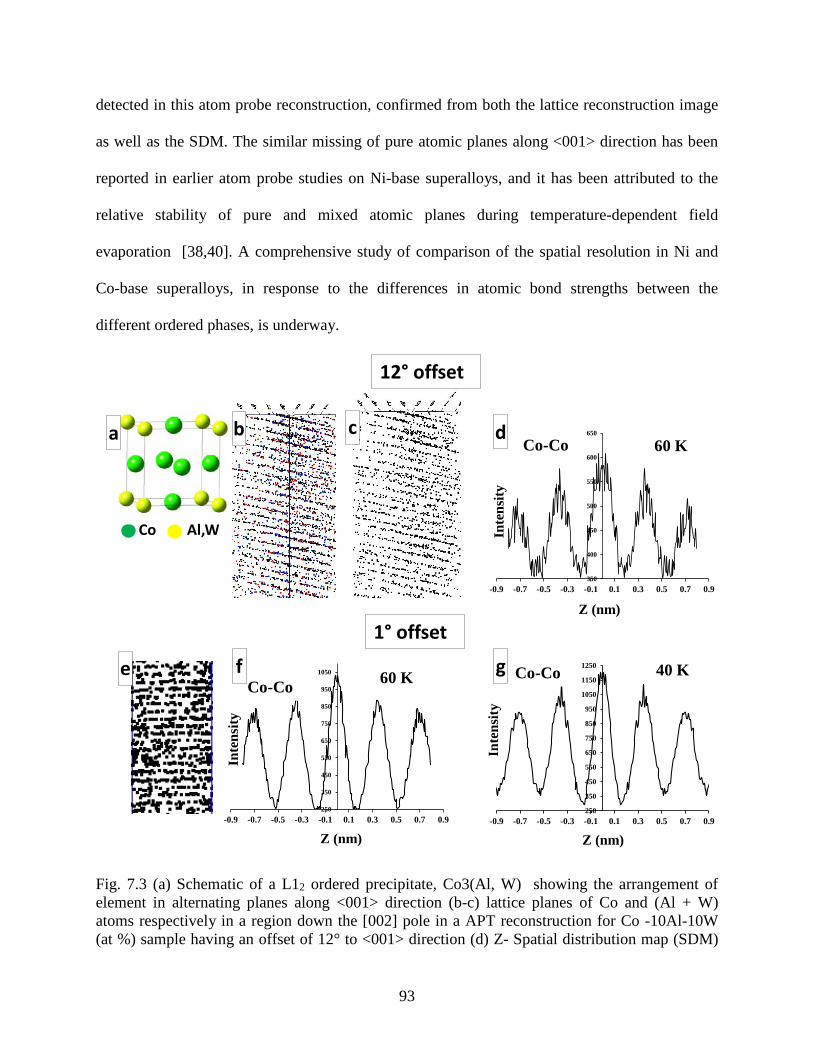
93
detected in this atom probe reconstruction, confirmed from both the lattice reconstruction image
as well as the SDM. The similar missing of pure atomic planes along <001> direction has been
reported in earlier atom probe studies on Ni-base superalloys, and it has been attributed to the
relative stability of pure and mixed atomic planes during temperature-dependent field
evaporation [38,40]. A comprehensive study of comparison of the spatial resolution in Ni and
Co-base superalloys, in response to the differences in atomic bond strengths between the
different ordered phases, is underway.
Fig. 7.3 (a) Schematic of a L12 ordered precipitate, Co3(Al, W) showing the arrangement of element in alternating planes along <001> direction (b-c) lattice planes of Co and (Al + W) atoms respectively in a region down the [002] pole in a APT reconstruction for Co -10Al-10W (at %) sample having an offset of 12° to <001> direction (d) Z- Spatial distribution map (SDM)
1° offset
350
400
450
500
550
600
650
-0.9 -0.7 -0.5 -0.3 -0.1 0.1 0.3 0.5 0.7 0.9
aCo-Co 60 K
b c d
250
350
450
550
650
750
850
950
1050
-0.9 -0.7 -0.5 -0.3 -0.1 0.1 0.3 0.5 0.7 0.9250
350
450
550
650
750
850
950
1050
1150
1250
-0.9 -0.7 -0.5 -0.3 -0.1 0.1 0.3 0.5 0.7 0.9
40 K60 K Co-CoCo-Co
f ge
12° offset
Z (nm)Z (nm)
Z (nm)
Inte
nsity
Inte
nsity
Inte
nsity
Al,WCo

94
for Co-Co interactions showing lattice planes of Co along <001> direction which are 0.4 nm widely spaced (e) lattice planes of Co atoms in a region down the <001> pole in a APT reconstruction for Co-10Al-10W sample having an offset of 1 ° to <001> direction (f-g) z-SDMs for Co-Co interactions showing lattice planes of Co along <001> direction for samples evaporated at 60 K and 40 K (In both cases, the unstable pure Co atoms planes are missing) Fig. 7.3(e) shows the lattice reconstruction with Co ions in the sample orientated 1 o off the
<001> pole (refer to Fig.. 7.2), which was evaporated at 60K. The corresponding z-SDM of Co-
Co interactions (Fig.. 7.3(f)) shows the peaks corresponding to the (001) planes. The width of the
central peak is 0.32 nm, which is slightly lower as compared to that observed in Fig. 7.3(d). Fig.
7.3(g) shows the SDM corresponding to the sample, evaporated at a lower temperature of 40 K,
which still does not show the (002) planes of pure Co. These results clearly validate that with a
decrease in the mis-orientation of the <001> pole with respect to the sample axis, the spatial
resolution of the APT reconstruction increases. But it is to be noted that even small changes in
the mis-orientation can result in considerable loss of spatial resolution, as demonstrated by this
example. It has been reported that tilt of 25° can result in 0.2 nm degradation in depth resolution,
so there is a possibility of not resolving 002 planes [34]. Therefore, the conventionally employed
sample preparation techniques, without coupling with EBSD-OM, are likely to result in
substantially higher misorientations, which in turn will degrade the resolution along the analysis
direction due to a greater contribution from limited lateral resolution. Moreover, the departure of
crystallographic pole from reconstruction center associated with higher orientation offset, leads
to observation of the lattice planes in limited depth in the APT reconstruction due to limited
field of view.
7.3.2 Effect of Type of Material
The influence of material type on spatial resolution has been carried out by comparing the
results from the Co-Al-W alloys with γ -γ’ Ni-Al-Cr alloys. Fig. 7.4(a) shows an enlarged

95
section of the APT reconstruction from the Ni-14Al-7Cr alloy, which was prepared using the
EDSB and APT coupling technique. It was evaporated at 40K in atom probe, which shows the
lattice planes of Ni atoms within the γ’ precipitate, perpendicular to the <001> pole. The L12 γ’
precipitates in Ni-Al-Cr alloys have only Ni atoms at the face center position and Ni + Al/Cr
atoms at the corner locations of the cubic lattice. The lattice parameter of these γ’ precipitates
were determined to be 0.36 nm, very close to that observed in case of the Co-Al-W alloys. Thus,
based on the crystal structure of this ordered phase, {002} planes of pure Ni atoms are supposed
to be separated by 0.2 nm. Fig. 7.4(b) shows the z-SDM of Ni along the <001> direction on a
ICF calibrated reconstruction for a correct inter-planar spacing .The z-SDM shows the presence
of Ni on every 0.2 nm confirming the existence of both pure and mixed atomic planes of Ni in
the APT reconstruction. Fig. 7.4(c) and (d) shows the lattice planes of Co atoms and the
corresponding z-SDM respectively, as described earlier in Fig. 7.3.

96
Fig.7.4 Lattice plane and corresponding SDMs of Ni and Co ions in Ni-14Al-7Cr and Co-10Al-10W (at. %) alloys respectively
While both the Ni-Al-Cr and Co-Al-W alloys were evaporated in the atom probe under
identical experimental conditions, while the APT reconstruction exhibited the pure {002} Ni
planes within γ’ precipitates in case of Ni-Al-Cr, the pure {002} Co planes were not visible in
the APT reconstruction of the γ’ precipitates in the Co-Al-W alloy (Fig. 7.7(d)). The similar
missing of pure atomic planes along <001> direction has been reported in earlier atom probe
studies on Ni-base superalloys, and it has been attributed to the relative stability of pure and
mixed atomic planes during temperature-dependent field evaporation [35,36]. Due to high
negative enthalpy of mixing of the unlike elements in these L12 compounds, the mixed planes are
more stable than the adjacent pure elemental layers, along the <001> direction. Earlier
simulation efforts have also validated the dissimilar bond energies in alternate layers of Ni3Al
Inte
nsity
Z (nm)
Inte
nsity
Z (nm)
Ni-Ni
Co-Co
Ni ions
Co ions
40 K
ba
c d

97
compounds, where Ni-Al and Ni-Ni bond energies are -4.5 and -4.45 eV respectively [37].
Hence, the absence of the pure {002} layers, observed only in case of the Co-Al-W alloy,
indicates a difference in the relative stability of Co-Co and Ni-Ni bonds in their respective {002}
planes. Previously, theoretical efforts have determined the electronic cohesive energies of Co-Co
and Ni-Ni as -4.38 and -4.45 eV respectively [38]. Comparing the cohesive energies, it can be
deduced that the relatively weak Co-Co bonds are unstable and are subjected to a higher
evaporation rate during the atom probe experiments, and hence, are missing in the
reconstruction. Another possibility of missing of planes is that the detection rate determined by
present experimental target evaporation is insufficient to detect the ions from the weakly bonded
pure atomic layers. The absence of alternate elemental {002} planes in APT reconstructions
from L12 ordered phases, inherently degrades the spatial resolution along the <001> direction.
To rectify this loss in detection, the detection rate or pulse frequency can be increased so that the
possibility of ions being field evaporated between pulses is substantially reduced. Evaporating
Co alloys at even lower temperatures may also aid in reconstructing the pure {002} Co layers.
7.3.3 Effect of Temperature
Fig. 7.5 shows APT lattice reconstructions with Ni ions for the Ni-14Al-7Cr alloy
evaporated at two different temperatures. While the field evaporation at a temperature of 40 K
exhibited both pure and mixed {002} atomic planes within the γ’ precipitates, the reconstruction
generated from the same sample evaporated at 60K exhibits only mixed planes, while the pure
{002} Ni layers are missing. The field evaporation process is a temperature dependent process
[33]. Previous results indicate that the temperature dependent evaporation process does not
result in high difference in evaporation rates of alternating layers at lower temperature but there

98
is possibility of high difference in evaporation rate with increase in evaporating temperature [35].
This temperature induced difference in evaporation rate has resulted in the absence of pure {002}
Ni planes in the reconstruction from the Ni-Al-Cr sample evaporated at 60K. Theoretically, the
higher temperature is expected to degrade the spatial resolution due to thermal agitation.
However, the additional degradation in depth resolution in the present case in ordered L12 γ’
precipitates along the <001> direction, because of its inherent atomic architecture, indicates that
limitations can arise during field evaporation in APT based on the specific material, its crystal
structure (especially ordered structures), and the nature of inter-atomic bonds.
7.3.4 Effect of Crystallography
The comparative study of depth resolution in APT along different crystallographic
directions of γ’ precipitates in has been demonstrated using the example of a Co-10Al-10W-2Ta
(at %) alloy The samples were prepared using the above discussed FIB-EBSD method and
subsequent analysis was carried out along the <001> direction, similar to that in Ni and Co alloys
as discussed earlier in this paper.

99
Fig. 7.5 The arrangement of atomic planes of Ni down the [002] pole at various temperature of operation while keeping other experimental conditions same
Fig. 7.6(a) shows an increased volume fraction of γ’ precipitates in the Co-Al-W-Ta alloy as
compared to the Co-Al-W alloy, with precipitates ranging in size from 300-350 nm. The site-
specific FIB-lift out was prepared from a region with its normal close to the <001> direction.
Fig. 7.6(b) confirms that the lift-out is close to the <001> direction with an offset of about 2o.
Fig. 7.6(c) shows the secondary SEM image of the APT sample, prior to the final ion polishing
step, where the γ -γ’ microstructure is clearly visible and the alignment of the γ/γ’ interfaces
40 K
60 K
Ni ions
2500
2700
2900
3100
3300
3500
3700
3900
-1 -0.8 -0.6 -0.4 -0.2 0 0.2 0.4 0.6 0.8 1
2500
3000
3500
4000
4500
5000
5500
6000
6500
-0.9 -0.7 -0.5 -0.3 -0.1 0.1 0.3 0.5 0.7 0.9

100
indicates a proper alignment of the tip for optimal depth resolution, as discussed previously. Fig.
7.6(d) is the 2D-desorption image showing the central <001> pole together with four other poles
around clearly exhibiting the four-fold symmetry. Fig. 7.6(e) is the APT reconstruction
confirming the accuracy of the technique based on the horizontally aligned γ/γ’ interface, created
using an 8 at % W isosurface. Fig. 7.6(f) and (g) show the Co ionic reconstruction of (001)
planes and the corresponding z-SDM for Co respectively from the sample evaporated at 40K.
Both the ionic reconstruction and SDM confirm the absence of pure (002) Co atomic layers as
discussed earlier, which contributes to the degradation of the resolution. The width of the central
peak in the SDM is ~0.3 nm.
The same Co-Al-W-Ta alloy was also analyzed in the <111> direction. Fig. 7.7(a) shows
the pole figure of the lift-out of the sample for APT study that confirms that lift-out is closer to
<111> direction. The γ-γ’ microstructure is clearly seen in Fig. 7.7(b) with oblique γ matrix due
to annular milling on sample orientated along <111> directions during sample preparation. Fig.
7.7(c) is the desorption image of sample evaporated at 40 K that shows a faint central <111>
pole with 6 other dark poles around it in a six-fold symmetry. The APT reconstruction in Fig.
7.7(d) also shows the γ-γ’ microstructure where the partial γ’ precipitates are captured, and the
flatter portion of the interface, oriented along <001> direction. Fig. 7.7(e) shows the chemically
identical atomic planes of Co in <111> direction down the faint <111> pole in a narrow region.
The inset in the Fig. 7.7(e) shows a schematic of a L12 precipitate where the arrangement of
atoms in <111> directions is shown. The schematic depicts that {111} planes are mixed in nature
and all the elements in the alloy are present in any (111) same plane.

101
Fig. 7.6 Backscattered SEM micrograph showing dispersion of spatially correlated γ’ precipitates in a γ matrix (b) EBSD pole figure showing the dual-beam FIB lift-out to be closer to <001> axis with an offset of 2° (c) the pre-final tip prepared using dual-beam FIB shows alignment of precipitates along <001> with an offset of 2° (d) 2D desorption image show poles and zone lines with central [002] pole, having an fourfold symmetry (e) APT reconstruction show γ’ precipitates in a γ matrix where the interface is nearly horizontal (f) Lattice planes of Co atoms in a region down the <001> pole in a APT reconstruction for Co-10Al-10W-2Ta (at %) sample having an offset of 2° to <001> direction (g) Z- Spatial distribution map (SDM) for Co-Co interactions showing lattice planes of Co along <001> direction which are 0.4 nm widely spaced
-1 -0.8 -0.6 -0.4 -0.2 0 0.2 0.4 0.6 0.8 1
Co-Al-W-Ta
b
c e
a
1 µm
γ'
γ
d
[002]
f g Co-Co
20 n
m
Inte
nsity
Z (nm)

102
Moreover, the inter-planar spacing will be 1.73 times s maller than that in <001> direction. Fig.
7.7(e) shows the corresponding SDM which has a narrow peak width and the mixed atomic
planes are present in every 0.2 nm, in accord with the reported lattice size of γ’ precipitates in Co
superalloys.
Fig. 7.7 EBSD pole figure showing the dual-beam FIB lift-out to be closer to <111> axis (b) the pre-final tip prepared using dual-beam FIB shows alignment of precipitates (c) 2D desorption image show poles and zone lines with central <111> pole, having an six-fold symmetry (d) APT reconstruction show γ’ precipitates in a γ matrix (e) Lattice planes of Co atoms in a region down the <111> pole in a APT reconstruction for Co-10Al-10W-2Ta (at %) sample (f) z-spatial distribution map (SDM) for Co-Co interactions showing lattice planes of Co along <111> direction which are about 0.2 nm widely spaced.
400
900
1400
-1 -0.8 -0.6 -0.4 -0.2 0 0.2 0.4 0.6 0.8 1
[111]
ca
d
γ'γ
e f Co-Co
b
1 µm 20 n
m
Inte
nsity
Z (nm)
103
The sharpening of central peak in <111> orientated samples indicates a better depth
resolution as compared to that in <001> directions. This phenomenon has physical rationale in
the kink-site distribution and terrace size of FCC materials during field evaporation of samples
orientated in different directions. The APT tip is made in a hemispherical shape during sample
preparation or it attains this shape after certain evaporation. The nature in which the internal
atomic layers are cut on a hemispherical shape is different for different crystallographic direction
and corresponding terrace size is proportional to their inter-planar spacing [39]. The ions usually
get field evaporated at kink-sites first and the subsequent evaporation of ions at kink-sites
appears in concentric circles around a crystallographic pole in the desorption images, as reported
in both FIM and APT [35, 39]. As the (001) plane provides a wide terrace for field evaporation,
some non-kink atoms also get thermally evaporated along with kink atoms. This non-ideal
evaporation behavior leads to degradation of atomic positions in the reconstruction, which in turn
degrades the spatial resolution [40]. On the other hand, the (111) plane facing to the detector,
provides a smaller terrace and more kink-site, which in turn reduces the amount of non-kink site
evaporation and subsequently enhance the spatial resolution. Since the APT tips were prepared in
a controlled manner in dual-beam FIB, they are quite identical to each other, and hence, the
effect of radius of curvature of the tip for crystallographic study can be neglected [40].
7.4 Discussion
The existing literature regarding crystallography at the nano-scale using APT is based on
smooth evaporation sequences where the analysis is carried out by interpreting the pattern of
crystallographic poles and zone lines in the desorption image. But, in multicomponent materials,
the high difference in evaporation field of elements results in non-uniform ion evaporation,

104
which is reflected in the blurred desorption image. The current demonstration of crystallographic
study in superalloys, using APT in conjunction with orientation mapping, eliminates the
requirement of tedious and time consuming analysis of desorption image to obtain the
crystallographic information in the reconstruction. The precise orientation specific sample
preparation, which retains the crystallographic information prior to field evaporation, is
applicable to any crystalline material. This approach not only allows the visualization of any
desired crystallographic plane, but is also capable of aligning the desired internal features with
respect to the detector for a higher spatial resolution.
In the present study of superalloys, a comprehensive understanding of critical factors
affecting the spatial resolution in APT has been developed. Although APT claims a better depth
resolution than individual lattice plane, the loss of specific atomic planes can degrade the depth
resolution to a greater extent as shown in Co-base alloys. Although both superalloys have same
atomic architecture, their response to field evaporation is different under same experimental
conditions. The comparison of the depth resolution in Ni and Co-base superalloys elucidates that
the degradation of spatial resolution in superalloys is not only because of the operating
conditions, but also in response to the differences in atomic bond strength to the field
evaporation.
The lattice reconstructions along <001> direction has been used to determine the sub-
lattice occupancies of solute atoms in superalloys [13]. With the present understanding of
anomalous dependence of spatial resolution on the nature of chemical bonding in the system
under investigation along with the operating conditions during data acquisition, the [011]
direction in γ’ precipitates, which also possesses alternate pure and mixed atomic planes, is a
better candidate for site occupancy analysis. Moreover, the selected reconstructions in this paper

105
have captured only a single γ’ precipitate, so there is no possibility of local magnification effect
[41-43] and the aberrations associated with evaporation of two different grains are also absent.
In the present study, voltage-evaporation of ions from conducting materials has been
discussed. The other mode of evaporation i.e. laser-evaporation, has successfully characterized
non-conducting materials. The advancement in laser used in atom probe such as UV-laser has
resulted in higher mass resolution in the reconstructions [44] . So the present technique of sample
preparation together with field evaporation using advanced laser technique can be applied to a
wide variety of materials for crystallographic studies.
The atomistic insights provided by APT are being recognized in superalloys recently,
which are critical to their high temperature microstructural stability and mechanical properties.
APT has been coupled with high resolution scanning trans mission electron microscopy
(HRSTEM) to obtain atomic scale chemical and structural information across order-disorder γ’/ γ
interfaces in Ni-base superalloy [45]. A comparative study of interface nature in Ni and Co-base
superalloys using APT, together with HRSTEM, is underway. The compositional gradient across
the diffuse γ/γ’ interface in Co-base superalloy has provided estimation of interfacial energy by
using Cahn-Hilliad formulation [46] and it has been demonstrated in recent articles using
information obtained from APT [17,18]. Moreover, the APT study has provided the accurate
measurement of compositional width of γ/γ’ interfaces in Ni-base superalloy during isothermal
annealing, which in turn has direct role in coarsening of precipitates [19,20].
7.5 Outlook
The standard protocols like Fourier transforms and Hough transforms have successfully
identified crystallographic information in APT in pure or low alloyed systems. But these

106
protocols cannot be applied to high evaporating materials and highly alloyed systems because
multiple poles are not observed for a successful identification of them. The EBSD mediated
precise site-specific sample preparation is advancement over the current methods of
crystallographic study by the atom probe. The presently proposed technique offers the advantage
of selecting a prior desired crystallographic orientation of the material for a lift-out, which
enables the evaporation of material with known crystallographic poles. Although this technique
is applicable to any crystalline material, it stands out in cases of characterizing high evaporating
metallic system like superalloys where pole structure is not prominent. The structural
information obtained by APT coupled with other advanced microscopy tools or modeling has
given a new prospective to solve materials science problems. The true nature of atomic
architecture in superalloys is being recognized recently, and the advancement presented in the
current work with regards to crystallography in APT has immense potential in elucidating the
nature of buried interfaces and accurately determining the site occupancy of solute atoms within
the ordered structures.
7.6 Conclusions
In conclusion, the coupling of orientation mapping tool with APT has facilitated a new
dimension to crystallographic studies, which is applicable to a wide variety of materials.
1) Advancing beyond occasional visibility of lattice planes in atom probe reconstruction,
the present reproducible method assures the visibility as well as accurate alignment of
crystallographic plane in any crystalline material.

107
2) In the case study of Ni and Co-base superalloys, the retention of crystallographic
information during sample preparation has allowed the indexing of poles even in blurred
desorption images.
3) The degradation of spatial resolution in the stoichiometric γ’ precipitates have been
discussed on the basis of the orientation of lattice planes with respect to the detector.
4) The APT experiments carried out at 40K reveal the missing of pure {002} atomic
layer in γ’ precipitates in Co-base alloys, while that in Ni-base alloy are retained. This response
of atomic structure along <001> direction to the field evaporation process has been attributed to
the reported difference in cohesive binding energies of {002} planes in these superalloys.
5) The temperature dependent field evaporation process can degrade spatial resolution
by resulting the missing of pure atomic {002} planes at higher temperature, as demonstrated in
Ni-base superalloy, apart from the temperature induced lattice vibration.
6) The anomalous dependence of spatial resolution on crystallographic direction has
been demonstrated in a Co-base superalloy. The higher depth resolution along <111> direction,
compared to that in <001> direction, reveal the role of atomic terrace size and distribution of
kink-site available for a smooth field evaporation.
Together with a new methodology for structural analysis using APT, the comprehensive
understanding of dependence of spatial resolution in superalloys on various factors will unveil
buried information at atomic level leading to the tailoring of observed performance.
7.7 References
[1] H.H. Liu, S. Schmidt, H.F. Poulsen, A. Godfrey, Z.Q. Liu, J.A. Sharon,X. Huang Science 332 (2011) 833-834.
[2] E. Arzt: Acta Materialia 46 (1998), 5611-5626.

108
[3] T.F. Kelly, M.K. Miller, K. Rajan, S.P. Ringer Microscopy and Microanalysis 19 (2013), 652-664.
[4] M.P. Moody, B. Gault, L.T. Stephenson, R.K. Marceau, R.C. Powles, A.V. Ceguerra, A.J. Breen, S.P. Ringer Microsc.Microanal. (2011) 1-14.
[5] R.C. Reed, The superalloys, fundamentals and applications. Cambridge: Cambridge University Press; 2006.
[6] J. Sato, T. Omori, K. Oikawa, I. Ohnuma, R. Kainuma, K. Ishida Science 312 (2006), 90-91.
[7] A. Suzuki, T.M. Pollock Acta Materialia 56 (2008), 1288-1297.
[8] K. Tannaka, M. Ooshima, N. Tsuno, A. Sato,H. Inui 92 (2012) 4011-4027
[9] J.E. Saal, C. Wolverton T. Acta Materialia 61 (2013) 2330-2338.
[10] M.K. Miller Micron 32 (2001), 757-764.
[11] S. Meher, H.Y. Yan, S. Nag, D. Dye, R. Banerjee Scr. Mater. 67 (2012), 850 -853.
[12] D.N. Seidman: Annual Review of Materials Research 37 (2007), 127-158.
[13] D. Blavette, E. Cadel, B. Deconihout Mater Charact 44 (2000),133 -157.
[14] F. Vurpillot, G. Da Costa, A. Menand, D. Blavette J.Microsc. 203 (2001), 295-302.
[15] B. Gault , M.P. Moody , F. De Geuser , A. La Fontaine, L.T. Stephenson, D. Haley , S.P. Ringer Microsc.Microanal. 16 (2010) 99-110.
[16] P.J. Warren, A. Cerezo, G.D.W. Smith GDW, Ultramicroscopy 73 (1998) 261- 266.
[17] S. Meher, S. Nag, J. Tiley, A. Goel, R. Banerjee, Acta Materialia 61 (2013), 4266 -4276.
[18] A.J. Ardell: Scr.Mater. 66 (2012) 423-426.
[19] E.Y. Plotnikov, Z. Mao , R.D. Noebe, D.N. Seidman Scr.Mater. 70 (2014) 51-54
[20] S. Meher, T. Rojhirunsakool , J.Y. Hwang ,S. Nag , J. Tiley , R. Banerjee Phil Mag Lett, 93 (2013) 521-530
[21] A. Biswas, D.J. Siegel, D.N. Seidman, Phys.Rev.Lett. 105 (2010) 76102.
[22] B. Krakauer, D.N. Seidman . Physical Review B 48 (1993) 6724-6727.
[23] O.C. Hellman, D.N. Seidman Materials Science and Engineering: A 327 (2002) 24-28.
[24] V.J. Araullo-Peters, B. Gault, S.L. Shrestha, L. Yao, M.P. Moody, S.P. Ringer, J.M. Cairney Scr.Mater. 66 (2012) 907-910.

109
[25] B. Gault, M.P. Moody, J.M. Cairney, S.P. Ringer Materials Today 15 (2012) 378-386.
[26] A.V. Ceguerra, A.J. Breen, L.T. Stephenson, P.J. Felfer, V.J. Araullo-Peters, P.V. Liddicoat , X. Cui, L. Yao, D. Haley, M.P. Moody, et al.: Current Opinion in Solid State and Materials Science. 17 (2013) 24–235
[27] B. Gault, X.Y. Cui, M.P. Moody, F. De Geuser, C. Sigli, S.P. Ringer, A. Deschamps Scr.Mater. 66 (2012) 903-906.
[28] J.A. Panitz: Journal of Vacuum Science and Technology 11 (1974) 206.
[29] E. Müller, K. Bahadur, Physical Review 102 (1956) 624 -631.
[30] W.K. Yeoh, B. Gault, X.Y. Cui, C. Zhu, M.P. Moody,L. Li,R.K. Zheng ,W.X. Li, X.L. Wang,S.X. Dou, et al. Phys.Rev.Lett. 106 (2011) 247002.
[31] M.P. Moody, F. Tang, B. Gault B, S.P. Ringer SP, J.M. Cairney JM: Ultramicroscopy 111 (2011) 493 - 499.
[32] B.P. Geiser BP, T.F.Kelly TF, D.J. Larson DJ, J. Schneir J, J.P. Roberts JP: Microsc.Microanal. 13 (2007) 437-447.
[33] B.Gault, M.P. Moody, J.M. Cairney, S.P. Ringer, 2012, Springer
[34] Q. Yao, H. Xing, J. Sun, Appl.Phys.Lett. 89 (2006) 161906-161906-3.
[35] K. Hono, A. Chiba, T. Sakurai, S. Hanada Acta Metallurgica et Materialia 40 (1992) 419 - 425.
[36] N. Wanderka, U. Glatzel, Materials Science and Engineering: A 203 (1995) 69 -74.
[37] Y. Mishin, Acta Materialia 52 (2004)1451 -1467.
[38] G.P.P. Pun, Y. Mishin, Physical Review B 86 (2012) 134116.
[39] A.J.W. Moore, Journal of Physics and Chemistry of Solids 23 (1962) 907 -912.
[40] B. Gault,M.P. Moody, F. de Geuser, D. Haley, L.T. Stephenson, S.P. Ringer Appl.Phys.Lett. 95(2009) 034103.
[41] E.A. Marquis, J.M. Hyde Materials Science and Engineering: R: Reports 69 (2010)37 - 62.
[42] M.K. Miller, Hetherington Surf.Sci. 46 (1991) 442-449.
[43] F. Vurpillot, A. Bostel, D. Blavette, Appl.Phys.Lett. 76 (2000) 3127.
[44] Y. Amouyal, D.N. Seidman, Microsc.Microanal. (2012) 1-11.

110
[45] R. Srinivasan, R. Banerjee, J.Y. Hwang G.B. Viswanathan, J. Tiley,D. Dimiduk, H.L. Fraser, Phys.Rev.Lett. 102(2009) 086101
[46] J.W. Cahn J.E. Hilliard, J. Chem. Phys. 28(1958) 258

111
CHAPTER 8
SITE OCCUPANCY DETERMINATION IN CO AND NI-BASE ALLOYS USING ATOM
PROBE TOMOGRAPHY*
8.1 Introduction
The mechanistic understanding of atomic scale structure-property relationship of
superalloys is essential for further development. The mechanical properties of superalloys are
strongly influenced by sub-lattice occupancy of solute atoms within ordered precipitates. The Cr
sub-lattice occupancy within the γ’ precipitates have been reported earlier. The recently
discovered cobalt-base alloys [1], which readily form γ-γ’ microstructure and resemble nickel-
base superalloys, have gained rapid research interest as potential next generation superalloys [2-
6]. The maturation of these alloys with various alloying elements critically depends on a
comprehensive understanding of interactions between the solute atoms which results in their
equilibrium distribution between the γ and γ’ phases. Although there have been some
computational studies towards estimating the site preferences of various alloying elements in Co-
base alloys, the experimental efforts to verify those results have been rather limited. Atom probe
tomography (APT), which uses the principle of evaporating a nano-scale specimen in a pulsed
electric field, has proven to be a powerful technique to understand solute partitioning in both
nickel and cobalt-base alloys [7-9] . This technique has also been employed to determine the
occupancy of solute and trace atoms in various structures under certain assumptions [10-15]. Ta
and Mo are strong γ’ formers and raise the γ’ solvus temperature in Co-base alloys. While Ta has
* A part of this chapter is reproduced from ‘Partitioning and site occupancy of Ta and Mo Co-base γ/ γ’ alloys' S.Meher, R. Banerjee, Intermetallics vol. 49 (2014) p 138-142 , with permission from Elsevier

112
been found to be the most beneficial element for enhancement of high temperature creep
properties [2, 4], Mo helps in reducing the positive lattice misfit between γ and γ’ phases in a
multi-component Co-base alloy [6]. On the other hand, the solute site occupancy within γ’
precipitates in nickel superalloys have also been studied earlier, using atom probe tomography
[16, 17]. The present study focuses on the site occupancy and interaction of Ta and Mo with the
existing W and Al solute elements in stoichiometric Co3(Al, W) precipitates and their
partitioning between γ and γ’ phases. It also determines the site occupancy of Cr in Ni-14Al -7Cr
(at. %) alloy, utilizing the structural information from APT.
8.2 Materials and Methods
The as-cast nominal Co-10Al-10W (all in at.%) , Co-10Al-10W-2Ta and Co-9Al-10W-
3Mo alloys were encapsulated in quartz tubes backfilled with argon and were heated in a
furnace at 1320°C in the single γ phase field for 12 hours, followed by water quenching. The
homogenized samples were encapsulated again, annealed for 256 hours at 900ºC to achieve near
equilibrium phase compositions, and finally, water quenched. Microstructural imaging and bulk
composition determination were carried out in a FEI Nova 230NanoSEM field emission gun
scanning electron microscope equipped with backscatter detector and ZAF-corrected EDX. The
measured bulk compositions are listed in Table 8.1.
Table 8.7 : Average alloy compositions and respective composition of γ and γ′ phases.
Alloy Composition (measured in at. %)
Average composition (at. %) γ γ’
Co-10Al-10W Co- 9.66 ± 0.18 Al-5.8 ± 0.14 W Co-11 ± 0.21 Al-13.7 ± 0.23 W Co-10Al-10W-2Ta Co-10.5 ± 0.31 Al-4.3 ± 0.21 W-
0.44 ± 0.07 Ta Co-10.9 ± 0.34 Al-11.7 ± 0.34
W-2.41 ± 0.17 Ta Co-9Al-10W-3Mo Co-6.5 ± 0.3 Al-4.9 ± 0.26 W-
2.7 ± 0.19 Mo Co-9.9 ± 0.36Al-10.42 ± 0.37
W-3.4 ± 0.22 Mo
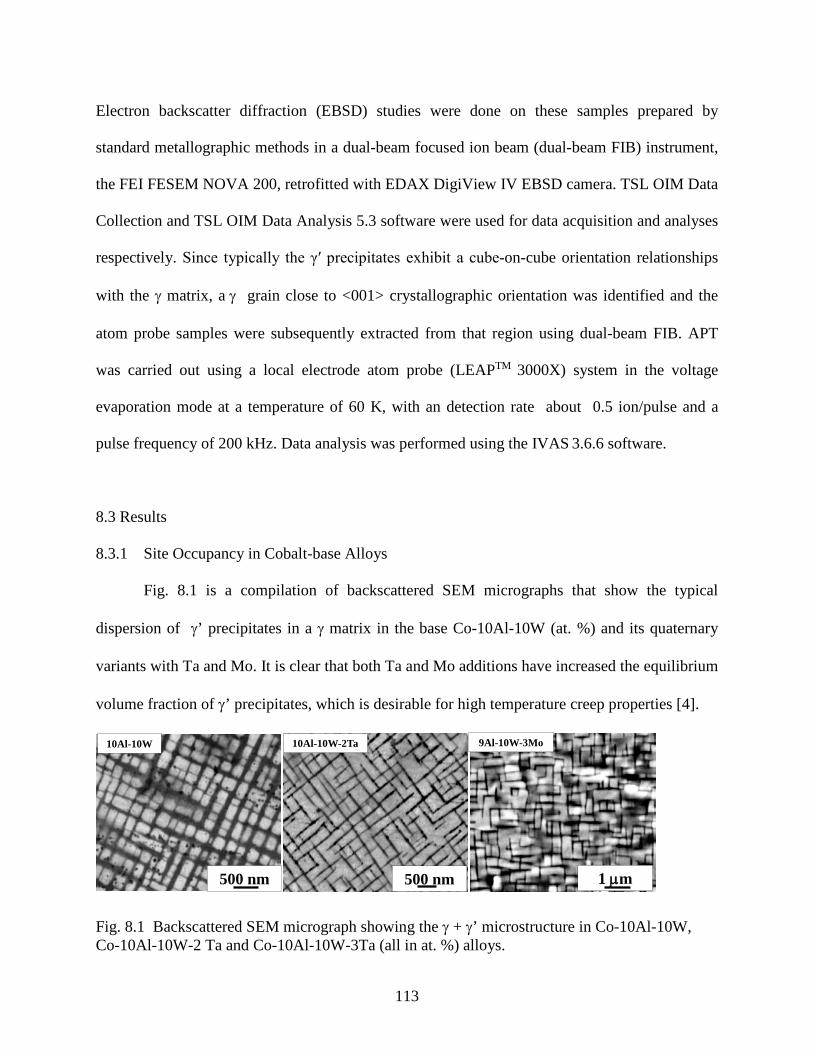
113
Electron backscatter diffraction (EBSD) studies were done on these samples prepared by
standard metallographic methods in a dual-beam focused ion beam (dual-beam FIB) instrument,
the FEI FESEM NOVA 200, retrofitted with EDAX DigiView IV EBSD camera. TSL OIM Data
Collection and TSL OIM Data Analysis 5.3 software were used for data acquisition and analyses
respectively. Since typically the γ′ precipitates exhibit a cube-on-cube orientation relationships
with the γ matrix, a γ grain close to <001> crystallographic orientation was identified and the
atom probe samples were subsequently extracted from that region using dual-beam FIB. APT
was carried out using a local electrode atom probe (LEAPTM 3000X) system in the voltage
evaporation mode at a temperature of 60 K, with an detection rate about 0.5 ion/pulse and a
pulse frequency of 200 kHz. Data analysis was performed using the IVAS 3.6.6 software.
8.3 Results
8.3.1 Site Occupancy in Cobalt-base Alloys
Fig. 8.1 is a compilation of backscattered SEM micrographs that show the typical
dispersion of γ’ precipitates in a γ matrix in the base Co-10Al-10W (at. %) and its quaternary
variants with Ta and Mo. It is clear that both Ta and Mo additions have increased the equilibrium
volume fraction of γ’ precipitates, which is desirable for high temperature creep properties [4].
Fig. 8.1 Backscattered SEM micrograph showing the γ + γ’ microstructure in Co-10Al-10W, Co-10Al-10W-2 Ta and Co-10Al-10W-3Ta (all in at. %) alloys.
500 nm 500 nm 1 µm
10Al-10W-2Ta 9Al-10W-3Mo10Al-10W

114
Fig. 8.2(a-b) show APT reconstructions of the Co-10Al-10W (at. %) alloy. Interestingly,
while it is difficult to identify the γ/γ’ interface based on the Al ion distribution (Fig. 8.2(a)), the
partitioning of W between γ and γ’ phases (Fig. 8.2(b)), clearly delineates the γ/γ’ interfaces.
Based on these observations, isoconcentration surfaces (or isosurfaces) of 9 at. % W have been
used for delineating the γ/γ’ interfaces as shown in Fig. 8.2(c). The spatial arrangement of γ’
precipitates closer to the axis of the tip confirms that the grain from which the atom probe tip is
lifted out is close to the <001> crystallographic direction.
The proximity histogram [18, 19] (or proxigram) analysis for Co, W, and Al, for the
interfaces created from these isosurfaces gives the compositions of γ and γ’ phases and their
partitioning across the interface. Fig. 8.2(d) shows the proxigram, in case of the Co-10Al-10W
alloy, which confirms the insignificant partitioning of Al and high degree of partitioning of W in
agreement with the APT ion maps shown in Fig. 8.2. Table 1 lists the γ and γ′ compositions
obtained from APT for the three alloys being investigated in the present study. The
determination of site preference of various elements in the ordered γ’ precipitates, by utilizing
the compositions obtained from APT, have been reported earlier in both Ni and Co-base alloys
[8, 19]. Employing the same methodology where the stoichiometry of Co3(W, Al) is assumed to
be ideal (Co sites: Al/W sites = 3:1), the addition of Al (∼10 at.%) and W (∼14 at.%) content in
the γ′ phase is 24 at.% (Table 1), close to the ideal 25 at.% expected in case of a stoichiometric
Co3(Al,W) phase. Therefore, it appears that both Al and W occupy the same sublattice in the
ordered γ’ phase.
APT works on the principle of field evaporation where atoms from the surface of a nano-
scale hemispherical apex are ionized under a high pulsed electric field [20]. The ions are
evaporated and subsequently detected by a multichannel detector one atomic layer at a time,

115
which results in the depth resolution of this tomography tool being of the order of the inter-
planar spacing.
Fig. 8.2 (a-b) APT reconstructions with only Al and W ions respectively to show the partitioning behavior and identification of accurate γ/γ’ interface in Co-Al-W alloy (c) APT reconstruction showing γ′ precipitates delineated with a 9 at.% W isosurface in a γ matrix (d) proxigram showing the composition profiles of solutes across the γ/γ’ interface
4
6
8
10
12
14
16
-5 -4 -3 -2 -1 0 1 2 3 4 5
727578818487
-5 -3 -1 1 3 5
Al
W
γ'γ
Coγ'γ
Al W
γ'
γ
W 9at% isosurface
<001>
a b c
d
Com
posi
tion
(at %
)
Distance (nm)

116
The observation of lattice planes in the APT reconstruction allows for characterization of the γ’
precipitates in terms of site occupancy of solute atoms within these precipitates. In the present
paper, a reproducible, EBSD-mediated precise site-specific sample preparation technique has
been employed to observe the desired atomic planes in the atom probe reconstruction. The
detailing of the sample preparation methodology is not the subject of the present study.
The schematic in Fig. 8.3 (a) shows the atomic structure of a L12 γ’ precipitate in a Co-
Al-W alloy. The Co atoms are located at the face center positions (black) and Al and W share the
cube corner positions (red) in this cubic lattice, which results in the Co3(Al,W) stoichiometry. So
the {002} planes comprise of only the Co atoms while Al and W, along with Co are present in
every {001}plane, which is a mixed plane. Usually the undistorted lattice planes in an APT
reconstruction are visible down the crystallographic poles that can extend throughout the
reconstruction. Fig. 8.3(b) represents enlarged sections of APT reconstructions with different
ions clearly exhibiting atomic planes within the Co3(Al,W) precipitates. Interestingly, all atomic
planes observed in the reconstruction contain every ion. Thus, it can be concluded that the
atomic planes in the reconstruction are compositionally mixed {001} planes. With the prior
knowledge that the inter-planar spacing of {001} planes in Co-Al-W alloy is 0.36 nm [5], the
image compression factor (ICF) in the reconstruction has been adjusted to the value of 1.5 to
obtain the theoretical inter-planar spacing in the reconstruction.
In addition to direct reconstruction of the atomic planes, spatial distribution maps (SDM),
a commonly used algorithm for structural analysis, has also been used in the present study [21].
The SDM maps are essentially a combination of two radial distribution functions: one represents
the distribution of inter-atomic separations in the z-direction and the other is a 2D map
describing the atomic positions in the corresponding x-y lateral plane. Fig. 8.3(c) shows the xz-

117
SDM for Co ions, which were created by precisely adjusting the region of interest in the
perpendicular direction to the crystallographic planes. The xz-SDM shows that Co atomic planes
are present in every 0.36 nm. Fig. 8.3 (d) shows the z-SDM for Co ions where the peaks of
mixed atomic planes are present 0.36 nm apart.
Fig. 8.3 a) Schematic of a L12 ordered precipitate, Co3(Al, W) showing the arrangement of element in alternating planes along <001> direction (b) Planar reconstructions showing atomic planes down the analysis axis which is closer to <001> crystallographic direction for Co-10Al-10W (at. %) alloy (c) xz- Spatial distribution map (xy-SDM) for Co showing the mixed planes along <001> direction which are 0.4 nm widely spaced (d) Z- Spatial distribution map (SDM) for Co showing the peaks of mixed planes along <001> direction which are 0.4 nm widely spaced
250
350
450
550
650
750
850
950
1050
1150
1250
-0.9 -0.7 -0.5 -0.3 -0.1 0.1 0.3 0.5 0.7 0.9
Co-Co
All Co Al +W
CoAlW
Planar Reconstructions
a b
dCo-Co
xz- SDM
z- SDMc
Al,WCo

118
Interestingly, the pure {002} planes of Co are not detected in atom probe reconstruction,
confirmed from both lattice reconstructions as well as SDM maps. The similar missing of pure
atomic planes along the <001> direction has been reported earlier in case of Ni-base superalloys,
and it has been attributed to the relative stability of pure and mixed atomic planes during
temperature dependent field evaporation [22,23]. Due to the high negative enthalpy of mixing of
these L12 stoichiometric compounds, the mixed planes are more stable than the adjacent pure
layers along the <001> direction. Hence the pure Co atomic layers presumably are subjected to a
higher evaporation rate during the field evaporation experiment, which leads to the missing of
pure Co atomic planes in the reconstruction and consequently degradation in z-resolution.
Together with the structural evidence of Al and W in the same mixed atomic planes, the
compositional analysis using proximity histograms confirms that both Al and W occupy the
same sub-lattice in the γ’ phase. Similarly, the site occupancy of Ta and Mo in γ’ precipitates, by
utilizing both structural and compositional information, has been determined and is described in
this paper. For the Co-10Al-10W-2Ta alloy, Fig. 8.4(a) shows the proxigram obtained from the 8
at. % W isosurface. The corrosponding APT reconstruction, shown as an inset, has a horizontal
γ/γ’ interface, which confirms that the atom probe tip is close to the <001> crystallographic
direction. The proxigram reveals strong partitioning of both W and Ta towards the γ’ phase
while the Al partitioning is still rather insignificant. As the Al (~10 at. %) and Co (~75 at. %)
content in γ’ in this alloy is unchanged as compared to that observed in case of the ternary Co-
Al-W alloy (Table 1), the accommodation of nearly all the Ta in the γ’ precipitates appears to
be by displacing an equal atomic percent of W into the γ matrix in order to maintain the
stoichiometry of γ’ precipitates as Co3(Al, W, Ta). The experimentally observed substitution of
2 at. % of W (reduction from 14 to 12 at. %) by 2 at. % Ta within the γ’ precipitates indicates the

119
occupancy of Ta in the W sub-lattice of the basic Co3(Al, W) structure. As the axis of the atom
probe sample is close to <001> direction, the {001} atomic planes are retained in the
reconstructions and are shown in Fig. 8.4 (b).
Fig. 8.4 (a) Proximity histogram showing the composition profiles of solutes across the γ/γ’ interface for Co-10Al-10W-2Ta (at. %), along with respective APT reconstructions. (b) Planar reconstructions showing atomic planes down the analysis axis which is closer to <001> crystallographic direction
0
2
4
6
8
10
12
14
-5 -4 -3 -2 -1 0 1 2 3 4 5
20 nm
γ'γ
Al
W
Ta
γ'γ
Com
posi
tion
(at %
)
a
Ta
CoAlW
b
Distance (nm)
All Co Al +W+Ta W+Ta
Planar Reconstructions

120
The pure atomic planes of Co are missing in the reconstruction even though the operating
temperature of this particular experiment was as low as 25K. The ionic reconstruction confirms
that Al, W and Ta occupy the mixed planes. Together with the equiatomic substitution of W by
Ta, the observation of W and Ta on the same plane confirms that Ta occupies the W sub-lattice
of the basic Co3(Al, W) structure.
Fig. 8.5(a) shows the proxigram obtained from a 8 at. % W isosurface in the case of the
Co-10Al-10W-3Mo alloy, which clearly shows the partitioning of W and Mo into the γ’
precipitates. The corresponding APT reconstruction, shown as an inset, has a near horizontal γ/γ’
interface, which confirms the atom probe tip is closer to <001> crystallographic direction.
Similar to the Ta containing alloy, Mo addition to Co-Al-W does not affect the Co and Al
content in the γ’ precipitates. Table 1 confirms that the 3 at. % Mo in the γ’ precipitates
displaces an equal amount of W in γ’ (from 14 at. % to 11 at. %) to form the stoichiometric
Co3(Al,W,Mo). Similar to the previous alloys discussed in the present study, the pure atomic
planes of Co are missing in the APT reconstruction of the Mo containing alloy. The ionic
reconstruction confirms that Al, W and Mo occupy the mixed planes. The equi-atomic
substitution of W by Mo, and the observation that W and Mo lie on the same plane, indicates that
Mo occupies the W sub-lattice of the Co3(Al, W) structure.
Interestingly, previous APT results in Ni-base γ/γ’ alloys have demonstrated an opposite
trend of Mo partitioning into γ phase. The reversal of Mo partitioning behavior in Ni-6.5Al-
9.9Mo (at. %) alloy [23], when contrasted with that in the present Co-10Al-10W-2Mo alloy, can
possibly be attributed to changes in energetics of phase partitioning caused by a higher amount
of Mo present in the alloy. Previously reported results in multi-component Ni [7] and Co-base
alloys [6] having Mo contents similar to the present Co-10Al-10W-2Mo alloy, indicate that Mo

121
partitions to the γ phase. This clearly indicates that site preference and phase partitioning of alloy
additions in theses γ/γ’ systems depend on the coupled effect of multiple solute elements.
Fig. 8.5 (a) Proximity histogram showing the composition profiles of solutes across the γ/γ′ interface for Co-10Al-10W-3Mo (at. %), along with respective APT reconstructions. (b) Planar reconstructions showing atomic planes down the analysis axis which is closer to <001> crystallographic direction
0
2
4
6
8
10
12
14
-5 -4 -3 -2 -1 0 1 2 3 4 5
20 nm
γ'γ
γ'γAl
WMo
All Co Al +W+Mo W+Mo
Mo
CoAlW
Com
posi
tion
(at %
)
Distance (nm)
a
b Planar Reconstructions
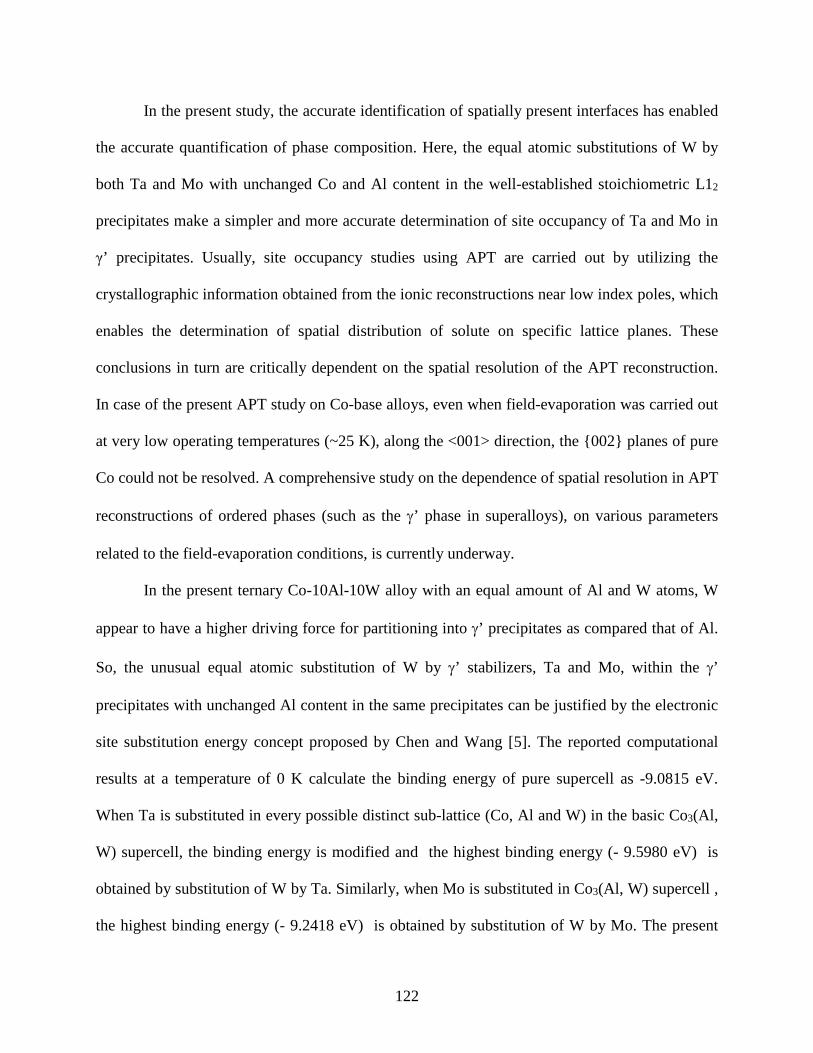
122
In the present study, the accurate identification of spatially present interfaces has enabled
the accurate quantification of phase composition. Here, the equal atomic substitutions of W by
both Ta and Mo with unchanged Co and Al content in the well-established stoichiometric L12
precipitates make a simpler and more accurate determination of site occupancy of Ta and Mo in
γ’ precipitates. Usually, site occupancy studies using APT are carried out by utilizing the
crystallographic information obtained from the ionic reconstructions near low index poles, which
enables the determination of spatial distribution of solute on specific lattice planes. These
conclusions in turn are critically dependent on the spatial resolution of the APT reconstruction.
In case of the present APT study on Co-base alloys, even when field-evaporation was carried out
at very low operating temperatures (~25 K), along the <001> direction, the {002} planes of pure
Co could not be resolved. A comprehensive study on the dependence of spatial resolution in APT
reconstructions of ordered phases (such as the γ’ phase in superalloys), on various parameters
related to the field-evaporation conditions, is currently underway.
In the present ternary Co-10Al-10W alloy with an equal amount of Al and W atoms, W
appear to have a higher driving force for partitioning into γ’ precipitates as compared that of Al.
So, the unusual equal atomic substitution of W by γ’ stabilizers, Ta and Mo, within the γ’
precipitates with unchanged Al content in the same precipitates can be justified by the electronic
site substitution energy concept proposed by Chen and Wang [5]. The reported computational
results at a temperature of 0 K calculate the binding energy of pure supercell as -9.0815 eV.
When Ta is substituted in every possible distinct sub-lattice (Co, Al and W) in the basic Co3(Al,
W) supercell, the binding energy is modified and the highest binding energy (- 9.5980 eV) is
obtained by substitution of W by Ta. Similarly, when Mo is substituted in Co3(Al, W) supercell ,
the highest binding energy (- 9.2418 eV) is obtained by substitution of W by Mo. The present

123
experimental study also demonstrates that Ta and Mo possibly exhibit a strong tendency for
replacing W within the γ’ phase at 900ºC, in accordance with the reported computation results. It
should be noted that the first principles based density functional theory (DFT) calculations were
carried out at 0 K, and consequently ignores the entropy contributions.
8.3.2 Site Occupancy in Nickel-Base Alloys
In this site occupancy study of Ni superalloy, the specific sub-lattice of Cr within the γ’
precipitates have been determined by using the structural information from APT. In this study,
orientation microscopy has been coupled with atom probe tomography, in similar methods
mentioned in chapter 3 and chapter 7. Fig. 8.6 shows the overall sample preparation technique
for this study. Fig. 8.6(a) shows γ- γ’ microstructure in Ni14Al-7Cr(at. %) alloy, annealed at
800°C for 256 h. Fig. 8.6(b) shows the pole figure of the grain, selected for the atom probe lift-
out. The pole figure suggests that the surface of the selected grain is very much close to <001>
direction, with an offset of 1°. Fig. 8.6(c) shows a pre-final atom probe tip where the orientation
of embedded γ’ precipitates are clearly parallel to the tip axis. Fig. 8.6(d) shows the two-
dimensional desorption image, formed by accumulation of several millions ions to the detector.
In this image, there seems to be a central crystallographic pole, surrounded by four other poles in
a four-fold symmetry. The four-fold symmetry correlate well with the <001> orientation of the
atom probe tip and the position of the central [002] pole, nearly at the centre of the desorption
map, indicate the minimal mis-orienataion of the tip from <001> direction.

124
Fig. 8.6 (a) Backscattered SEM micrograph of Ni-14Al-7Cr (at %) showing γ’ precipitates in a γ matrix (b) EBSD pole figure showing the dual-beam FIB lift-out to be closer to <001> axis with an offset of 2° (c) the pre-final tip prepared using dual-beam FIB shows alignment of precipitates along <001> direction with minimal offset (d) 2D desorption image show poles and zone lines with central <001> pole, having an four-fold symmetry
Fig. 8.7(a) shows a schematic of a L12 precipitate with stoichiometry of Ni3Al. Fig.
8.7(b) shows the Al atomic planes down the <001> crystallographic pole in APT reconstruction.
This indicates the high resolution in APT to resolute planes in z-direction. Fig. 8.7(c) shows the
x-z SDMs of individual atoms in this alloy. Here, it indicates that Ni atoms are present at every
(002) planes and spaced at 0.18 nm distance in z-direction, matching with the schematic of L12
precipitate. The xz-SDM of Cr ad Al indicates that present on planes, separated by 0.36 nm
distance along <001> direction. Fig. 8.7(d) shows the z-SDMs, where the Ni-Ni atom
interactions in Z-direction is about 0.18 nm, which corresponds to the structure of γ’ precipitate
and Al-Al atoms interactions is about 0.36 nm. Thus, the determination of occupancy of Cr in γ’
precipitate can be deduced from the Cr-Cr interaction distance. If it occupies Ni site, then it
should be present in every (002) plane i.e. 0.18 nm, and if occupies Al site, then it should be 0.36
nm part in z-direction. The Cr-Cr interaction distance at in the z-SDM is 0.36 nm, which
confirms that Cr occupy the Al sub-lattice in basic Ni3Al structure and make the stoichiometry as
Ni3(Al,Cr).

125
Fig. 8.7 (a) A schematic of Ni3Al structure (b) Lattice planes of Al atoms in a region down the <001> pole in an APT reconstruction for Ni-14Al-7Cr (at %) sample (c) xz- Spatial distribution map (SDM)s for Ni-Ni, Al-Al and Cr-Cr interactions, down the analysis axis (d) z- SDM for Ni-Ni, Al-Al and Cr-Cr interactions along <001> direction in the γ’ precipitate
Fig. 8.8 shows a linear concentration profile within a γ’ precipitate, with compositon of
each atomic plane. The linear profile was created in IVAS 3.6.6 with bin width of 0.5 nm, for
better resolution. In this figure, the variation of composition of Al and Cr are in same trend,
suggesting the same sub-lattice occupancy within the γ’ precipitates. Ni, on the other hand, has
lower concentration in planes where Al+Cr are high, in acccardance to the basic γ’ phase
stoichiometry.
AlNi
(001)
(002)
0.4
nm
z - Spatial Distribution Map (z-SDM)
2500
3000
3500
4000
-1 -0.9 -0.8 -0.7 -0.6 -0.5 -0.4 -0.3 -0.2 -0.1 0 0.1 0.2 0.3 0.4 0.5 0.6 0.7 0.8 0.9 1
50
100
150
200
250
-1 -0.9 -0.8 -0.7 -0.6 -0.5 -0.4 -0.3 -0.2 -0.1 0 0.1 0.2 0.3 0.4 0.5 0.6 0.7 0.8 0.9 1
0
10
20
30
40
50
60
70
80
-1 -0.9 -0.8 -0.7 -0.6 -0.5 -0.4 -0.3 -0.2 -0.1 0 0.1 0.2 0.3 0.4 0.5 0.6 0.7 0.8 0.9 1
Al-Al
Ni-Ni
Distance (nm)
Ion
coun
ts
Cr-Cr
Ni-Ni
Al-Al
Cr-Cr
Al ions
a
b
cd
x-z SDM
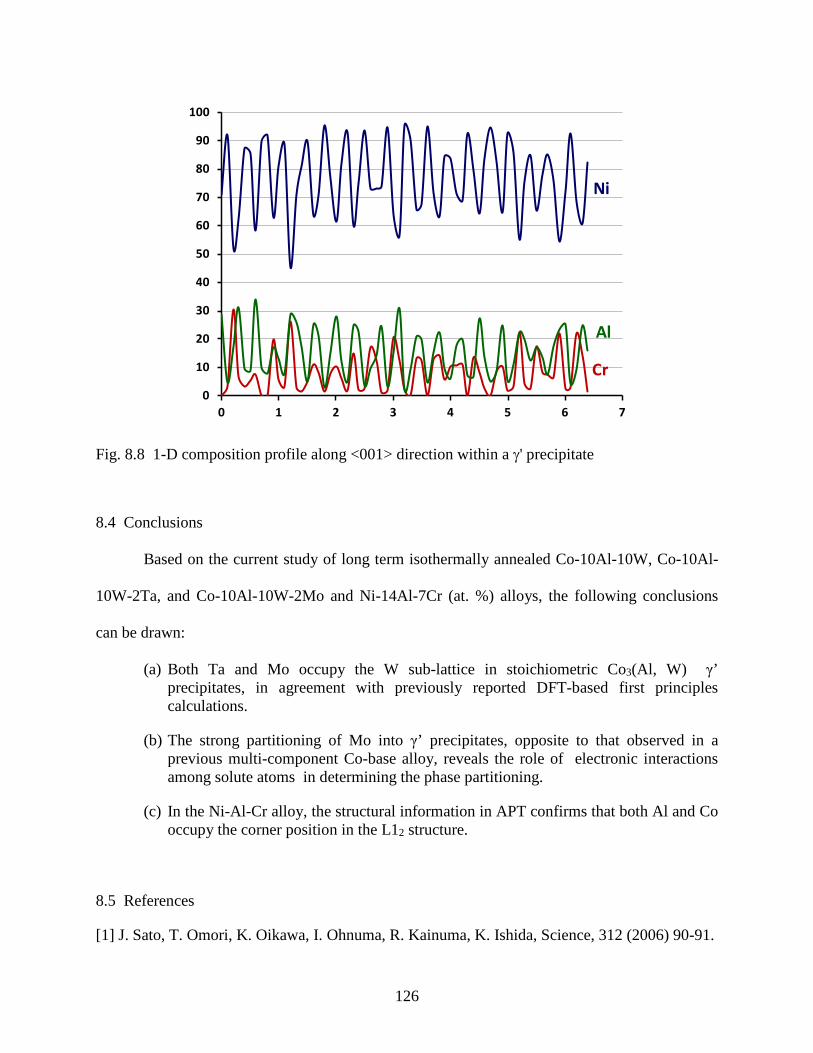
126
Fig. 8.8 1-D composition profile along <001> direction within a γ' precipitate
8.4 Conclusions
Based on the current study of long term isothermally annealed Co-10Al-10W, Co-10Al-
10W-2Ta, and Co-10Al-10W-2Mo and Ni-14Al-7Cr (at. %) alloys, the following conclusions
can be drawn:
(a) Both Ta and Mo occupy the W sub-lattice in stoichiometric Co3(Al, W) γ’ precipitates, in agreement with previously reported DFT-based first principles calculations.
(b) The strong partitioning of Mo into γ’ precipitates, opposite to that observed in a previous multi-component Co-base alloy, reveals the role of electronic interactions among solute atoms in determining the phase partitioning.
(c) In the Ni-Al-Cr alloy, the structural information in APT confirms that both Al and Co occupy the corner position in the L12 structure.
8.5 References
[1] J. Sato, T. Omori, K. Oikawa, I. Ohnuma, R. Kainuma, K. Ishida, Science, 312 (2006) 90-91.
0
10
20
30
40
50
60
70
80
90
100
0 1 2 3 4 5 6 7
Ni
Al
Cr

127
[2] A. Suzuki, T. Pollock,Acta Materialia, 56 (2008) 1288-1297.
[3] S. Meher, S. Nag, J. Tiley, A. Goel, R. Banerjee, Acta Materialia, 61 (2013) 4266-4276.
[4] K. Tannaka, M. Ooshima, N. Tsuno, A. Sato, H. Inui, Phil Mag, 92 (2012) 4011-4027.
[5] M. Chen, C. Wang, Scr. Mater, 60 (2009) 659-662.
[6] M.S. Titus, A. Suzuki, T.M. Pollock,Scr. Mater, 66 (2012) 574-577.
[7] S. Meher, H.Y. Yan, S. Nag, D. Dye, R. Banerjee, Scr. Mater, 67 (2012) 850-853.
[8] P.J. Bocchini, E.A. Lass, K. Moon, M.E. Williams, C.E. Campbell, U.R. Kattner, D.C. Dunand, D.N. Seidman, Scr. Mater, 68 (2013) 563-566.
[9] J. Y. Hwang, R. Banerjee, J. Tiley, R. Srinivasan, G.B.Viswanathan, H. L. Fraser, Metallurgical and Materials Transactions A, 40(1) (2009) 24-35.
[10] T. Rademacher, T. Al-Kassab, J. Deges, R. Kirchheim, Ultramicroscopy, 111 (2010) 719-724.
[11] B. Gault, X.Y. Cui, M.P. Moody, F. De Geuser, C. Sigli, S.P. Ringer, A. Deschamps, Scr. Mater, 66 (2012) 903-906.
[12] D. Blavette, E. Cadel, B. Deconihout, Mater Charact, 44 (2000) 133-157.
[13] T. Boll, T. Al-Kassab, Ultramicroscopy, 124 (2013) 1-5.
[14] W.K. Yeoh, B. Gault, X.Y. Cui, C. Zhu, M.P. Moody, L. Li, R.K. Zheng, W.X. Li, X.L. Wang, S.X. Dou, G.L. Sun, C.T. Lin, S.P. Ringer, Phys. Rev. Lett. 106 (2011) 247002.
[15] F. Vurpillot, G. Da Costa, A. Menand, D. Blavette, J. Microsc, 203 (2001) 295-302.
[16] M. Chaudhari, A. Singh, P.Gopal, S. Nag, G. B. Viswanathan, J. Tiley, R. Banerjee, J. Du Phil. Mag. Lett. 92 (2012) 495-506
[17] C. Botth-Morrison, Z. Mao, R. D. Noebe, D.N. Seidman Appl. Phy. Lett. 93 (2008) 033103
[18] O. Hellman, J. A. Vandenbroucke, J. Rüsing, D. Isheim, D.N. Seidman, Micros. Microanal. 6 (2000) 437-444.
[19] Y. Amouyal, Z. Mao, C. Booth-Morrison, D.N. Seidman, Appl. Phys. Lett. 94 (2009) 041917.
[20] B. Gault, J. Cairney, M.P. Moody, S.P. Ringer, Atom Probe Microscopy, first ed.( 2012) Springer , New York.
[21] B.P. Geiser, T.F. Kelly, D.J. Larson, J. Schneir, J.P. Roberts, Microsc. Microanal. 13 (2007) 437-447.

128
[22] K. Hono, A. Chiba, T. Sakurai, S. Hanada, Acta Metallurgica et Materialia. 40 (1992) 419-425.
[23] N. Wanderka, U. Glatzel, Materials Science and Engineering: A. 203 (1995) 69-74.
[22] D. Blavatte, A. Bostel, Acta Metall. 32 (1984) 811-816
[23] D. Blavatte, A. Bostel,J. M. Sarrau, ,Metallurgical transaction.16 A (1985) 1703-1711
[24] Y. Tu, Z. Mao, D.N. Seidman, , Appl. Phys. Lett. 101 (2012) 121910.

129
CHAPTER 9
STRUCTURAL AND COMPOSITIONAL ANALYSIS OF γ/γ’ INTERFACES IN NI AND
CO-BASE ALLOYS
9.1 Introduction
The physical properties in multiphase systems always have dependence on the nature of
the interphase interfaces. The thermodynamic and kinetic stability of the interface between the
ordered γ’ precipitates with the disorder matrix, due to structural coherence, serves as a key
factor to the high temperature performance of superalloys. The recent experimental studies
involving the coupling of high angle annular dark-field-high resolution scanning transmission
electron microscopy (HAADF-HRSTEM) with 3D tool-atom probe tomography (APT) have
proved that the order/disorder interface in a nickel base alloy is not atomically abrupt but has a
transition width, in agreement with prior atomistic simulations [1,2]. It has been found that these
coherent interfaces can have complex nature by possessing different extent of transition across
the coherent interface between the phases. The observation of two interfacial widths, one
corresponding to a structural order-disorder transition, and the other to the compositional
transition across the interface, raises fundamental questions regarding the definition of the
interfacial width in such systems. The reduction in the precipitate/matrix interface energy is the
thermodynamic driving force for precipitate coarsening. Thus, the strengthening mechanisms and
deformation behavior at elevated temperatures are directly related to the atomic scale behavior
across the interface.
Although HRSTEM has atomic scale resolution [3, 4], APT is the best choice for
compositional analysis due to its inherent capability for element-specific quantitative probing
across the compositional gradients at sub-nanometer scale [5-8]. Based on principles of time of

130
flight mass spectrometry, APT can locate the spatial position of specific elements with high
accuracy along the analysis axis, and the higher depth resolution has successfully explored
crystallographic information in various atom probe studies [7, 8]. Thus, recent developments in
instrumentation can provide exciting new opportunities for development of robust predictive
coarsening models through accurate atomic-scale structural and compositional information.
9.2 Background and Approaches
Cahn-Hilliard introduced the mathematical approach to model diffuse interfaces, which is
essentially the key to the spinodal decomposition theory [9] and phase field modeling [10].
Monte Carlo simulation, as shown in Fig. 9.1 [1], has earlier indicated that the order-disorder
interfaces between γ and γ’ phases is diffuse in nature and the transition occurs over few atomic
planes. Similar results have also been found by Ardell et al. [11].
Fig. 9.1 Concentration profile across the coherent (100) γ / γ’ interface obtained by Monte Carlo simulations at 700 K.
The points in the Fig. 9.1 represent Al concentration in individual (2 0 0) layers parallel
to the interface. The arrow marks the initial position of the interface at 0 K. Over a course of
time, there have been various attempts towards the exploration of interface nature at atomic scale
[12-16]. Howe et al. have studied the diffuse interfaces in Au-Cu alloys by high resolution TEM

131
[12]. The order –disorder interfaces in Nickel superalloys have also been studied recently [13-15]
using HRSTEM and APT.
In the recent trend of crystallographic study using APT [17-21], the standard protocols
like Fourier transforms and Hough transforms have successfully identified crystallographic
information in pure or low alloyed systems. But it is very difficult to apply these protocols to
multi-phase and multi-component systems involving solute elements with high evaporation
fields, since multiple poles are not observed in such systems, making their identification rather
difficult. The unique reproducible characterization method involving EBSD mediated precise
site-specific sample preparation is an alternate method enabling crystallographic study of
complex multi-phase materials, containing ordered phases, has been demonstrated in both Ni and
Co-base alloys in this study. The most important challenge in study of buried interface, with
specific orientation for highest spatial resolution, can be solved the coupling of orientation
microscopy with atom probe tomography.
In the present chapter, a detailed atomic structure and composition of γ/ γ’ interfaces in
long –term annealed Ni and Co-base alloys have been compared and contrasted, by utilizing
HRSTEM and APT, to understand the role of interfaces in precipitate coarsening behavior.
9.3 Materials and Methods
The as-cast nominal Co-10Al-10W (at.%) alloys was encapsulated in quartz tubes
backfilled with argon and were heated in a furnace at 1320°C in the single γ phase field for 12
hours, followed by water quenching. The homogenized samples were encapsulated again,
annealed for 64 hours at 900ºC to achieve near equilibrium phase compositions, and finally,
water quenched. Similarly, the as-cast Ni-14Al-7Cr (at. %) alloy was solutionized at 1250°C for
0.5 h., followed by water quenching. Then, the homogenized sample was annealed at 800C for

132
256 h. Electron backscatter diffraction studies and sample preparation for APT studies were
carried out in a dual-beam focused ion beam (dual-beam FIB) instrument, the FEI FESEM
NOVA 200, retrofitted with EDAX DigiView IV EBSD camera .The HAADF-HESTEM
analysis of the ternary Co base alloys was carried out using FEI Titan 80–300 microscope,
operated at 300 kV, equipped with a CEOS probe aberration corrector. Experiments were carried
out using a local electrode atom probe (LEAPTM 3000X) system in the voltage evaporation mode
at a temperature range of 40 to 60 K, with the evaporation rate at 0.5% and pulse frequency of
200 kHz. Data analysis was performed using IVAS 3.6.6.
9.4 Interface Analysis in a Co-Base Alloys
The characterization of novel Co-base alloys is in the preliminary stage and it is very
important to understand the physical basis of the performance of these alloys with information at
atomic scale. Here, the atomic scale rendition of interface between γ and γ’ phase has been
carried out using HRSTEM and APT.
For the interface analysis of Co-base alloys, the ternary Co-10Al-10W (at. %) alloy has
been chosen, which was annealed at 900°C for 64 h. Fig. 9.2(a) shows a STEM image of γ - γ’
microstructure where the γ’ prime precipitates are aligned along <100> direction due to elastic
interaction among precipitates. Fig. 9.2(b) shows a HAADF-HRSTEM image where the brighter
part on the left hand side is a part of γ’ precipitate and the right hand side is γ matix. This
imaging has been done along the <100> zone axis. The higher mass contrast in γ’ phases is due
to strong partitioning of heavy W atoms towards γ’ phases. The periodic mass contrast in the γ’
phase in the HRSTEM image comes from the fixed atomic positions in the ordered γ’ phase, as
shown in the Fig. 9.2(c). The brighter (001) plane in the stoichiometric Co3(Al,W) precipitate is

133
a mixed atomic plane and contains Co, Al, W and the (002) plane is a pure Co plane. The
alternating contrast in the brighter (001) atomic column due to periodic arrangement of Co and
(Al + W) atoms in that plane. The uniform contrast in the (002) column is due to presence of
only Co atoms.
.
Fig. 9.2 (a) STEM image showing typical γ + γ ' microstructure in Co-10Al-10W (at. %) alloy, subjected to 64 h of isothermal annealing at 900°C (b) HRSTEM image along <001> zone showing the interface between γ and γ’ phase (c) a schematic of L12 Co3(Al, W) structure
γ – γ’
Al,WCo
a
b
c

134
Fig. 9.3 (a) A clipped region of HRSTEM image for interface analysis (b) the plot between average atomic column intensity with corrosponding distance in the HRSTEM image (c) a plot of progressive column intensity vs. corrosponding distance in the HRSTEM image
For the structural and compositional transition across the interface between γ and γ’
phase, a clipped region of HRSTEM image has been chosen (as shown in Fig. 9.3(a)), where the
interface is nearly flat for accuracy in quantitative analysis. Fig. 9.3(b) shows a plot between the
average column intensity with distance (from left to right of the HRSTEM image). The overall
γ’ γ
1 nm
γ’ γCo+Al+W
Co
Distance (nm)
Inte
nsity
(arb
itrar
y un
it )
Inte
nsity
Rat
ios
a
b
c

135
column intensity remains constant upto 2.5 nm (γ’ region) ,then it drops to a certain value over
2.3 nm (as shown by the red lines), and then it remains constant (γ phase). The change in the
contrast of the image across the interface is a manifestation of change of atomic position across
the interface leading to continuous change of composition of atomic planes. Thus, this transition
of atomic column contrast of 2.3 nm can be regarded as compositional width of the interface.
Fig. 9.3(c) shows the progressive column intensity ratio (left to right of the HRSTEM
image) where every atomic column intensity is divided with the previous atomic column. In the
left hand side of the plot (γ’ region), there is constant fluctuation of intensity ratios due to
alternate mixed and pure atomic column present in the ordered precipitate. This high degree of
intensity ratio continues to a large extent into the region where the compositional change occurs
across the interface (Fig. 9.3(b)) and eventually the progressive intensity ratio drops to a near
constant value of one, over two or three atomic planes and then remains nearly constant in γ
matrix. This structural transition region in the intensity ratio is marked by black lines. This
transition indicates that the atomic columns do not follow the stoichiometry of L12 structure and
the transition zone is partially order in structure. Thus, this transition region of 0.5 nm can be
regarded as the structural width of interface and it is very sharp in this Co-10Al-10W (at. %)
alloy. The similar analysis has been carried out on multiple clipped region of HRSTEM image
and unambiguously the same results have been produced.
Although compositional information can be obtained from average column intensity of an
HRSTEM image, it remains silent about behavior of individual elements across the interface.
The abnormal behavior of elements has been reported earlier [15]. Moreover, the above shown
analysis on small particle with curved interface cannot be performed. Atom probe tomography
can be a solution to the above mentioned problems, which can provide three-dimensional spatial

136
information with sub-nanometer resolution.
Fig. 9.4 (a) EBSD pole figure showing that the grain, from which the dual-beam FIB lift-out is prepared, is closer to <001> axis with an offset of 1 ° (b) the pre-final tip prepared using dual-beam FIB shows alignment of precipitates along <001> with minimal offset (c) 2D desorption image shows poles and zone lines with central <001> pole, having an four-fold symmetry (d) APT reconstruction shows a near horizontal γ- γ’ interface (e) Proxigram shows the compositional width of the interface in Co-10Al-10W (at. %) alloy
500 nm0
[002] γ’
γ
30 n
m
2.7 nm
Con
cent
ratio
n (a
t%)
Distance (nm)
γ γ'
Al
W
a
dc
b
e

137
In the present study, a coupling of orientation microscopy with atom probe tomography
has been carried out for interface analysis. APT has highest spatial resolution along z-direction,
thus a horizontal flat interface in the reconstruction is required for accurate quantification of the
compositional interface width. The γ’ precipitate align themselves in <001> direction at later
stage of annealing due to elastic interactions. Thus, the selection of a grain with surface
orientation closer to <001> direction, as a lift-out for atom probe sample preparation, can lead to
presence of buried horizontal interfaces in the atom probe reconstruction.
Fig. 9.4(a) shows the pole figure of the grain, selected for the atom probe lift-out. The
pole figure suggests that the surface of the selected grain is very much close to <001> direction
with an offset of 1°. Fig. 9.4(b) shows a pre-final atom probe tip where the orientation of
embedded γ’ precipitates are clearly parallel to the tip axis. Fig. 9.4(c) shows the two-
dimensional desorption image, formed by accumulation of several millions ions to the detector.
In this image, there seems to be a central crystallographic pole, surrounded by four other poles in
a four-fold symmetry. The four-fold symmetry correlate well with the <001> orientation of the
atom probe tip and the position of the central [002] pole, nearly at the centre of the desorption
map, indicate the minimal mis-orienataion of the tip from <001> direction. Fig. 9.4(d) is a APT
reconstruction, where 9 at.% W isosurface indicates a horizontal interface. This horizontal
interface is suitable for interface analysis in APT. The proxigram(Fig. 9.4(e)),created from above
mentioned interface, shows that compositional width with respect to both Al, W, and is
compositionally diffuse and the quantitative values of the compositional width of the interface
is 2.7 nm. This value of compositional width of the interface matched well with the result
obtained from HRSTEM images. It is to be noted that the interface in the reconstruction is very
flat, so there is no chances of artifact, arising from local magnification effect. Special care was

138
also taken during the experiments to ensure a smooth evaporation sequence across the interface.
This value of compositional width of the interface matched well with the result obtained from
HRSTEM images.
9.5 Interface Analysis in a Ni-Base Alloy
The atomic scale transition across the interface has gained recent research interest and it
has been reported earlier. For the comparative study of γ/ γ’ interface transition in simple model
alloys, a coupling of HRSTEM imaging and APT has been carried out. For a correlation of
interface structure and chemistry with precipitate coarsening behavior, the Ni-14Al-7Cr (at. %)
alloy, annealed at 900°C for 256 h, has been chosen for interface analysis.
Fig. 9.5(a) shows a TEM dark field image of γ - γ’ microstructure where the γ’ prime
precipitates are aligned along <100> direction due to elastic interaction among precipitates. Fig.
9.5(b) shows a HAADF-HRSTEM image where the brighter part on the left hand side is γ matrix
and the right hand side is γ’ phase. This imaging has been done along the <100> zone axis. The
lower atomic mass contrast in γ’ phases is due to strong partitioning of lighter Al atoms towards
γ’ phases. The periodic mass contrast in the γ’ phases in the HRSTEM image comes from the
fix positions of atoms in the ordered γ’ phase, as shown in the Fig. 9.5(c). The (001) plane in the
stoichiometric Ni3(Al,Cr) precipitate is a mixed atomic plane and contains Ni, Al and Cr, while
the (002) plane is a pure Co plane. The alternating contrast in the dimmer (001) atomic column
in the HRSTEM image is due to periodic arrangement of Ni and (Al + Cr) atoms in that plane.
The uniform contrast in the (002) column is due to presence of only Ni atoms.

139
Fig. 9.5 (a) STEM image showing typical γ +γ’ microstructure in Co-10Al-10W (at. %) alloy, subjected to 64 h of isothermal annealing at 900 C (b) HRSTEM image along <001> zone showing the interface between γ and γ’ phase (c) a schematic of L12 Co3(Al, W) structure
A clipped region of HRSTEM image has been chosen (as shown in Fig. 9.6(a)) for the
interface analysis, where the interface is nearly flat for accuracy in quantitative analysis. Fig.
9.6(b) shows a plot between the average column intensity with distance (left to right of ,then it
1 nm
a
bAl,CrNi
c
γ'γ

140
drops to a certain value over 3.3 nm(as shown by the red lines), and then it remains constant in γ’
phase. So, this transition of atomic column contrast of 3.3 nm can be regarded as compositional
width of the interface.
Fig. 9.6 (a) A clipped region of HRSTEM image for interface analysis (b) the plot between average atomic column intensity with corresponding distance in the HRSTEM image (c) a plot of progressive column intensity vs. corresponding distance in the HRSTEM image
0.6
0.7
0.8
0.9
1
1.1
1.2
1.3
1.4
2 3 4 5 6 7 8
40
60
80
100
120
140
160
180
2 3 4 5 6 7 8
Distance (nm)
Inte
nsity
(arb
itrar
y un
it )
Inte
nsity
Rat
ios
Al+Cr
Ni
a
b
c
141
Fig. 9.6(c) shows the progressive column intensity ratio (left to right of the HRSTEM
image) where every atomic column intensity is divided with the previous atomic column. In the
left hand side of the plot (γ’ region), there is constant fluctuation of intensity ratios due to
alternate mixed and pure atomic column in the ordered precipitate. This high degree of intensity
ratio lower down uniformly in the region where there is compositional change across the
interface (Fig. 6.6(b)) and eventually the progressive intensity ratio drops to a near constant
value of one, over a distance of 2.3 nm and then remains constant in γ matrix. The transition
region in the intensity ratio is marked by black lines. So, this transition region can be regarded as
the structural width of interface and it is diffuse in nature in the Ni-14Al-7Cr (at. %) alloy.
The correlative microscopy for interface analysis using APT has been carried out here for
Ni-base alloy. Fig. 9.7(a) shows the pole figure of the grain, selected for the atom probe lift-out.
The pole figure suggests that the surface of the selected grain is very much close to <001>
direction with an offset of 1°. Fig. 9.7(b) shows a pre-final atom probe tip where the orientation
of embedded γ’ precipitates are clearly parallel to the tip axis. Fig. 9.7(c) shows the two-
dimensional desorption image, which has the central <001> pole. Fig. 9.7(d) is a APT
reconstruction, where 9 at.% W isosurface indicates a horizontal interface. The proxigram (Fig.
9.7(e)), created from above mentioned interface, shows that compositional width with respect to
Cr, and is compositionally diffuse and the quantitative values of the compositional width of the
interface is 2.7 nm. This value of compositional width of the interface matched well with the
result obtained from HRSTEM images.

142
Fig. 9.7 (a) EBSD pole figure showing the dual-beam FIB lift-out to be closer to <001> axis with an offset of 2° (b) the pre-final tip prepared using dual-beam FIB shows alignment of precipitates along <001> direction with minimal offset (c) 2D desorption image shows pole and zone lines with central [002] pole, having an four-fold symmetry (d) APT reconstruction shows a near horizontal γ- γ’ precipitate (e) Proxigram shows the compositional width of the interface as 2.6 nm.
Al
Cr
γ’
γ
20 n
m
a b
cd
e

143
9.6 Discussion
The interface study, using advanced characterization tools, is not only limited to metals,
but also, semiconductors have been studied [16, 22]. The atomic scale compositional information
across the coherent interfaces has been incorporated into Cahn-Hilliard interface model, for
estimation of various coarsening parameters [23,24].The compositional width of the interface is
determined by the balance of two forces. As the interface has a non-equilibrium composition, as
compared to bulk of the system, it increases the interfacial energy and hence, this force tends to
decrease the compositional width of the interface width. At the same time, gradient energy
coefficient, which is proportional to the concentration gradient across the interface, tends to
increase the width of the interface. The lattice strain energy, due to lattice misfit between the
precipitate and matrix, increases the strain energy associated with the interface. To relax the
lattice strain, the structural width tends to broaden to accommodate the strain in several atomic
planes.
The structural sharpness of the interface, as in the case of the Co-Al-W alloy, can be
possibly due to substantial increase of the bulk energy of the interface. The accommodation of
anti-site defect across the interface, due to non-equilibrium composition, is speculated to be
energetically very expensive, leading to sharpening of the width. Although, the similar interface
sharpening is not observed in ordered precipitate strengthened Ni-Al-Cr alloy in this study. The
recent studies on interface controlled coarsening behavior of γ’ precipitates in Ni-superalloys
suggest that the interface acts as a barrier to diffusion of solute during coarsening, due to finite
width of the partially ordered interface [ 25, 26]. The experimentally observed diffuse structural
width ( ~ 2 nm) , presented in this study for Ni-base alloys, may suggest the observation of trans-
interface diffusion controlled coarsening (TIDC) in Ni-base alloys. While, the structural width of

144
the interface, in case of Co-base alloys, is sharp and it cannot act as a barrier for diffusion of
solutes from matrix to the precipitates. The experimentally observed coarsening kinetics, as
described in chapter 4, also suggests the matrix diffusion limited coarsening of γ’ precipitates in
Co-base alloys.
The structural information of Ni and Co-base superalloys, obtained by APT coupled with
HRSTEM and computational modeling, offers new prospects for solving materials science
problems. The exact location of specific elements at interface, determined by coupling of
HRSTEM and APT and the associated energetic, by computational modeling will interpret the
possible solute electronic interaction mediated sharpening of interfaces. The atomic-scale
knowledge of structure and chemical composition of the buried interfaces can resolve the
controversy in the atomistic mechanism of precipitate coarsening.
9.7 Conclusions
Towards a detailed understanding of the γ/ γ’ interface structure, chemistry in Novel Co
and Ni-base alloys, the atomic scale information across the interface has been obtained by
utilizing advanced characterization tools like HAADF-HRSTEM and APT. Some of the salient
findings are as follow:
i) The coherent γ/γ’ interface in long term annealed Co-10Al-10W (at. %) alloy is compositionally diffused but structurally very sharp and is about 0.5 nm.
ii) The γ/γ’ interface in long term annealed Ni-14Al-7Cr (at. %) is both structurally and compositionally diffused.
iii) The possible reason for structural sharpness of the γ/γ’ interface in Co-base alloys can be the substantial increase in the bulk free energy of the interface due to non-equilibrium compositions.

145
9.8 References
[1] Y. Mishin, Acta Mater.52(2004) 1451 -1467
[2] R. Srinivasan, R. Banerjee, J.Y. Hwang, G.B. Viswanathan, J. Tiley and H.L. Fraser, Phys. Rev. Lett. 102 (2009) p.086101.
[3] M. Haider, S. Uhlemann, and J. Zach, Ultramicroscopy 81,(2000) ,163.
[4] H. Rose, Ultramicroscopy 103 (2005) 1-6
[5] E.Y. Plotnikov, Z. Mao, R.D. Noebe, D.N. Seidman, Scr.Mater. 70 (2014) 51-54
[6] S. Meher, T. Rojhirunsakool, J.Y. Hwang, S. Nag, J. Tiley, R. Banerjee, Phil Mag Lett, 93(2013) 521-530
[7] B. Gault, J. Cairney, M.P. Moody, S.P. Ringer, Atom Probe Microscopy, first ed.( 2012) Springer , New York.
[8] M. Miller, Atom Probe Tomography: Analysis at the Atomic Level, Springer USA
[9] J.W. Cahn, Acta Metall., 9 (1958) 258
[10] L.-Q. Chen, Annu. Rev. Mater. Res., 32 (2002), 113
[11] A.J. Ardell and V. Ozolins, Nat. Mater. 4 (2005) p.309.
[12] J.M. Howe, W.E. Benson, Interface Sci. 2 (1995) 347-363
[13] B. Ge, Y. Luo, J. Li, J. Zhu, D. Tang, Z. Gui, Phil. Mag. Lett., 92(2012) 541-546
[14] B. Ge, Y. Luo, J. Li, J. Zhu, Met. & Mat. Trans. A 42A (2011) 548
[15] K. Zhao, Adv. Mat. Research 463-464(2012) 20-24
[16] Z. Balogh, P. Stender, M. Reda Chellali, G. Schmitz, Met. & Mat. Trans. A 44A(2013) 4487
[17] B. Gault, X.Y. Cui, M.P. Moody, F. De Geuser, C. Sigli, S.P. Ringer, A. Deschamps, Scr. Mater. 66 (2012) 903-906.
[18] B.P. Geiser, T.F. Kelly, D.J. Larson, J. Schneir, J.P. Roberts, Microsc. Microanal. 13 (2007) 437-447.
[19] B.Gault, M.P. Moody, F. de Geuser, D. Haley, L.T. Stephenson, S.P. Ringer, Appl. Phys. Lett. 95(2009) 034103.
[20] B. Gault B, M.P. Moody, J.M. Cairney, S.P. Ringer, Materials Today 15(2012) 378-386.

146
[21] V.J. Araullo-Peters, B. Gault, S.L. Shrestha, L. Yao, M.P. Moody, S.P. Ringer, J.M. Cairney, Scr.Mater. 66 (2012) 907-910.
[22] B.P. Gorman, A.G. Norman, Y. Yan, Micros. And Microanal. 13(6) (2207) 493-502.
[23] S. Meher, S. Nag, J. Tiley, A. Goel, R. Banerjee, Acta Materialia. 61 (2013) 4266-4276.
[24] A.J. Ardell, Scr Mater 66 (2012) 423.
[25] J. Tiley, G.B. Viswanathan, R. Srinivasan, R. Banerjee, H.L. Fraser, Acta Mater. 57(2009) 2538.
[26] C.G. Garay-Reyes, F.H. Santiago, N.C. Castro, V.M. Lopez-Hirata, J.G. Rocha, J.L.H. Rivera, H.J.D. Rosales, J.J. Cruz-Rivera, Materials Charac. 83(2013) 35-42

147
CHAPTER 10
CONCLUSION AND FUTURE WORK
The present work focuses on comprehensive understanding of high temperature
coarsening behaviors of ordered γ’ precipitates in nickel and novel cobalt-base superalloys. It
explores the microstructures in Co-base alloys and provides critical coarsening parameters, for
the first time, by incorporating atomic scale interface information into a classical interface
model. Developing multi-scale correlative microscopy methods, this work provides true atomic
scale information to understand solute phase partitioning and site occupancy within ordered γ’
precipitates, and γ /γ’ interface profiles in both Ni and Co-base alloys.
The expeditious development of novel cobalt-base γ- γ’ alloys as possible next generation
superalloys critically depends on achieving a comprehensive understanding of the coarsening
kinetics of ordered γ’ precipitates. This work discusses the coarsening of L12 ordered Co3(W,
Al) precipitates in a model ternary Co–10Al–10W (at.%) alloy during isothermal annealing at
800 and 900°C. The experimentally determined temporal evolution of average size of the γ’
precipitates suggests classical matrix diffusion limited Lifshitz–Slyozov– Wagner coarsening at
both temperatures. The γ’ coarsening rate constants have been determined using a modified
coarsening rate equation for non-dilute solutions. Furthermore, using the Cahn–Hilliard
formulation for interfacial energy, the γ/γ’ interfacial energies at the respective annealing
temperatures have been correlated to the concentration profile across the interface that has been
experimentally determined using atom probe tomography. The calculated interfacial energies are
in comparable range with those observed in nickel-base superalloys. Additionally, this analysis
has permitted, for the first time, the determination of the gradient energy coefficient for γ/γ’
interfaces in Co-base alloys, a critical input for phase-field and other simulation models for

148
microstructural evolution. In the explorative work on various quaternary variants of Co-base
alloys, Ta and Ni were found to partition towards γ’ precipitates. Mo was found to partition
anomalously towards γ’ precipitates in Co-10Al-10W-3Mo (at. %) alloy.
Coupling APT and TEM, the temporal evolution of the γ’ precipitate morphology and
size distribution, and compositional width of γ/γ’ interface, has been tracked in a model Ni-14Al-
7Cr(at.%) alloy, during isothermal annealing at 650 and 800°C, subsequent to rapid quenching.
During the initial annealing period, coalescence-dominated growth and coarsening of γ’
precipitates is accompanied by a gradual decrease in the interface width, eventually leading to
classical LSW coarsening with a constant interface width at extended annealing time periods.
The EBSD mediated precise site-specific sample preparation is advancement over Fourier
transforms and Hough transforms, for crystallographic study by the atom probe. This technique
offers the advantage of selecting a prior desired crystallographic orientation of the material for a
lift-out, which enables the evaporation of material with known crystallographic poles. Although
this technique is applicable to any crystalline material, it stands out in cases of characterizing
high evaporating metallic system like superalloys where pole structure is not prominent.
Utilizing this technique, the field evaporation behavior of superalloys was discussed and the
factors affecting the spatial resolution were analyzed. This characterization method was
employed on both Ni and Co-base alloys for solute site occupancy study within γ’ precipitates. In
Co-base alloys, Ta and Mo were found to substitute Al in the basic Co3(Al,W) stoichiometry and
Cr is found to substitute Cr in γ’ precipitates in Ni -14Al-7Cr(at. %) alloy.
The atomic scale investigation of structure and chemistry of order-disorder interface utilizing
HRSTEM and APT has yield fundamental differences between Ni and Co superalloys. Co-Al-W

149
alloy was found to possess sharp structural transition across the order-disorder interface, as
compared to that in Ni-Al-Cr alloy.
From the present study of temporal evolution of γ’ precipitates in both Ni and Co-base
alloys, the following possible extension can be made:
(1) The initial approach of incorporating atomic scale data to the coherent interface
model, as presented in this study for superalloys, can be substantially developed so that it is well
applicable for systems having coherent precipitates. Also, realistic critical coarsening parameters
can also be obtained for different generation of γ’ precipitates in superalloys.
(2) The progress of coarsening studies has not considered the possibility of dual-nature of
interface to date. The significant difference in the interface nature in Ni and Co base alloys
demands for revisit of the coarsening laws incorporating the atomic transition across the phases.
With suitable alloying of these alloys, the structural misfit between order/disorder can be
changed and the following can be observed: i) the rationale of differences in interface nature and
ii) their implications on observed coarsening kinetics.
(3) The advancement with regards to crystallography in APT, by coupling with
orientation microscopy, has immense potential in elucidating the nature of buried interfaces and
accurately determining the site occupancy of solute atoms within the ordered precipitates in
various alloy systems. The revolutionary capabilities for materials characterization down to sub-
angstrom levels by both HRSTEM and APT will be the basis of for further development of
ordered precipitate strengthened metallic systems.