Comparative Assessment of Mobile Navigation Applications ...
6
Comparative Assessment of Mobile Navigation Applications using 2D Maps and Augmented Reality Interfaces Mustafa Eseng¨ un, G¨ okhan ˙ Ince Computer Engineering Department Istanbul Technical University Istanbul, Turkey Email: {esengun, gokhan.ince}@itu.edu.tr Abstract—So far, 2D map-based navigation applications on mobile platforms have been dominating the market. However, with the rise of augmented reality technology, a new type of interface is introduced to the navigation applications. To this end, two mobile navigation applications having different interaction styles were developed for a task of navigation in Istanbul Technical University campus. The first application offers navigation within a 2D digital map view and the second application is an augmented reality browser, which provides navigation by displaying waypoints onto the phone’s camera view. The aim of this study is to investigate how efficient these two different interfaces are in the tasks of navigation and exploring the campus area. In line with this purpose, a user experience test was conducted in the field and the results show that both interfaces have their own pros and cons, but they both accomplish their navigation duties with success. Keywords–user experience; augmented reality browser; mobile navigation. I. I NTRODUCTION Mobile navigation applications are essential for people to figure out how to get from one point to another in any environment without getting lost. Teevan et al. [1] stated that the most common reason for performing a local search was to get directions to their target location (52%), followed by the desire to go somewhere (43%), to get a phone number of a place (28%) and to choose a specific place to visit (21%). Therefore, the main focus should not only be given to show the right path with as much clear directions as possible but also to take the elements of exploration and discovery into account. Another important factor in the development process is the type of user interaction with the application. Different interaction types may create different effects on the degree of exploration of the environment and user’s satisfaction while using the application, both of which are needs to be investigated constituting the main aim of this study. We chose to implement two different interfaces, each of which has different interaction style. The proof-of-concept system is proposed as a campus guide application to be used within the vicinity of Istanbul Technical University (ITU) [2]. The first application offers navigation functionality and fea- tures to explore the area, whose interface design was inspired from the existing Google Maps [3] application. The second application is an Augmented Reality (AR) browser application, which displays the buildings in the campus onto the live camera view of the smartphone as Points Of Interests (POI) and provides navigation by displaying arrows as waypoints directing the user to any destination. By conducting user experience tests, as well as the travel duration, the usability of these two interfaces and efficiency of these two guidance approaches were investigated. The structure of the paper is as follows: In Section II, related researches and their differences with this study are pre- sented. In Section III, the design and implementation details of the algorithms and applications are introduced. In Section IV, setup of the user experiments is presented, and the results are discussed. Lastly, in Section V the paper is concluded by presenting the main outcome of this study and the future work ideas. II. LITERATURE REVIEW The navigation applications allow people to find their route and explore their surroundings easily and quickly in the places they have not visited before without losing too much time [4]. Especially universities with huge campuses welcomes thousands of new students and visitors every year, and to help people find their route without getting lost, most of the universities have guidance signs located at different points around the campus. However, this kind of guidance causes extra burden for the people because they first have to spend time and energy to find those signs. To overcome this issue, different mobile solutions were developed, which are easier for the people to get access [5][6][7]. In order to get more help and benefit from the navigation applications, the interaction styles of applications plays an important role. By using advantages of recent technologies, navigation applications can provide rich contents to the users. Most of the existing mobile navigation applications use 2D map interface, which presents interactive items overlayed onto the map to provide information. This kind of interface allows user to see their surroundings from a bird’s-eye view [7]. On the other hand, AR browsers offer a different kind of interactivity. The technology of AR carries the experience with the real world to a higher level by allowing to see more than what actually exists by combining the real world with the virtual data provided. AR combines the real physical world view with various media contents such as images, 3D models, animations and sounds in order to enhance the perception of the user among the environment or the objects. The media content related with real world locations and displayed onto the camera view of the phones make the users feel as if the objects really exist on those locations, which provides opportunity for the people to enhance their perception and get to know better about surroundings [8][9][10]. Another reason of usage of augmented reality in navigation applications is that AR provides a location-aware interface [9]. Since the study of Feiner et. al. [11], mobile AR applications have been one of the attractive research topics in academia and they showed that AR technology can guide the people to explore an area or a city which are not familiar to them. 423 Copyright (c) IARIA, 2016. ISBN: 978-1-61208-468-8 ACHI 2016 : The Ninth International Conference on Advances in Computer-Human Interactions
Transcript of Comparative Assessment of Mobile Navigation Applications ...

Comparative Assessment of Mobile Navigation Applications using 2D Maps and
Augmented Reality Interfaces
Mustafa Esengun, Gokhan InceComputer Engineering Department Istanbul Technical University
Istanbul, TurkeyEmail: {esengun, gokhan.ince}@itu.edu.tr
Abstract—So far, 2D map-based navigation applications on mobileplatforms have been dominating the market. However, with therise of augmented reality technology, a new type of interface isintroduced to the navigation applications. To this end, two mobilenavigation applications having different interaction styles weredeveloped for a task of navigation in Istanbul Technical Universitycampus. The first application offers navigation within a 2D digitalmap view and the second application is an augmented realitybrowser, which provides navigation by displaying waypoints ontothe phone’s camera view. The aim of this study is to investigatehow efficient these two different interfaces are in the tasks ofnavigation and exploring the campus area. In line with thispurpose, a user experience test was conducted in the field and theresults show that both interfaces have their own pros and cons,but they both accomplish their navigation duties with success.
Keywords–user experience; augmented reality browser; mobilenavigation.
I. INTRODUCTION
Mobile navigation applications are essential for peopleto figure out how to get from one point to another in anyenvironment without getting lost. Teevan et al. [1] stated thatthe most common reason for performing a local search wasto get directions to their target location (52%), followed bythe desire to go somewhere (43%), to get a phone numberof a place (28%) and to choose a specific place to visit(21%). Therefore, the main focus should not only be given toshow the right path with as much clear directions as possiblebut also to take the elements of exploration and discoveryinto account. Another important factor in the developmentprocess is the type of user interaction with the application.Different interaction types may create different effects on thedegree of exploration of the environment and user’s satisfactionwhile using the application, both of which are needs to beinvestigated constituting the main aim of this study.
We chose to implement two different interfaces, each ofwhich has different interaction style. The proof-of-conceptsystem is proposed as a campus guide application to be usedwithin the vicinity of Istanbul Technical University (ITU) [2].The first application offers navigation functionality and fea-tures to explore the area, whose interface design was inspiredfrom the existing Google Maps [3] application. The secondapplication is an Augmented Reality (AR) browser application,which displays the buildings in the campus onto the livecamera view of the smartphone as Points Of Interests (POI)and provides navigation by displaying arrows as waypointsdirecting the user to any destination. By conducting userexperience tests, as well as the travel duration, the usabilityof these two interfaces and efficiency of these two guidanceapproaches were investigated.
The structure of the paper is as follows: In Section II,related researches and their differences with this study are pre-sented. In Section III, the design and implementation details ofthe algorithms and applications are introduced. In Section IV,setup of the user experiments is presented, and the resultsare discussed. Lastly, in Section V the paper is concluded bypresenting the main outcome of this study and the future workideas.
II. LITERATURE REVIEW
The navigation applications allow people to find theirroute and explore their surroundings easily and quickly inthe places they have not visited before without losing toomuch time [4]. Especially universities with huge campuseswelcomes thousands of new students and visitors every year,and to help people find their route without getting lost, most ofthe universities have guidance signs located at different pointsaround the campus. However, this kind of guidance causesextra burden for the people because they first have to spendtime and energy to find those signs. To overcome this issue,different mobile solutions were developed, which are easierfor the people to get access [5][6][7].
In order to get more help and benefit from the navigationapplications, the interaction styles of applications plays animportant role. By using advantages of recent technologies,navigation applications can provide rich contents to the users.Most of the existing mobile navigation applications use 2Dmap interface, which presents interactive items overlayed ontothe map to provide information. This kind of interface allowsuser to see their surroundings from a bird’s-eye view [7].
On the other hand, AR browsers offer a different kind ofinteractivity. The technology of AR carries the experience withthe real world to a higher level by allowing to see more thanwhat actually exists by combining the real world with thevirtual data provided. AR combines the real physical worldview with various media contents such as images, 3D models,animations and sounds in order to enhance the perception ofthe user among the environment or the objects. The mediacontent related with real world locations and displayed ontothe camera view of the phones make the users feel as ifthe objects really exist on those locations, which providesopportunity for the people to enhance their perception and getto know better about surroundings [8][9][10]. Another reasonof usage of augmented reality in navigation applications is thatAR provides a location-aware interface [9]. Since the study ofFeiner et. al. [11], mobile AR applications have been one ofthe attractive research topics in academia and they showed thatAR technology can guide the people to explore an area or acity which are not familiar to them.
423Copyright (c) IARIA, 2016. ISBN: 978-1-61208-468-8
ACHI 2016 : The Ninth International Conference on Advances in Computer-Human Interactions
In AR browser applications, as location-based AR appli-cations, POIs are displayed onto the camera view by usinginformation balloons or any other media content [4]. Theseapplications use phone’s camera, GPS, compass and othersensors to relate the digital content with the real worldobjects in order to provide much detailed information aboutthat location[12][13]. There are couple of commercial ARapplications available, such as, Wikitude [14], Layar [15] andJunaio [16], each of which enables displaying POIs on thecamera view.
Comparison of user experience in using AR browser and2D digital map applications has been discussed in somestudies. Lee [13] proposed to use a 2D digital map, an ARbrowser and panoramic photographs interfaces to inform thetourists about the original view of the buildings which weredamaged by an earthquake in Chirstchurch city. The userexperience tests conducted in this study showed that 2D digitalmap interface was commonly used for browsing and finding thepoint of interests. Another application developed by Mulloniet. al. [18] provided a 2D digital map interface togetherwith an AR browser interface within an application havinga switching mode between them to offer navigation service.The results of user experience test of this study showed thatAR browser interface was mostly used at crossings of theroute where users tried to decide, which direction they need toturn, whereas they used 2D digital map interface mostly whenthey walked straight. In a similar study [17], three differentapplications, one with a 2D map interface developed usingGoogle Maps Application Program Interface (API), anotherone with an AR browser interface and the last one with thecombination of these two interfaces, were compared in termsof user experience for a navigation task. Results of this studyshowed that when AR browser interface was used, arrivingat the destination took longer because of the obstacles on theroute. The drawback of this system was that the route planningoptions in this interface was limited. Another outcome of thisstudy was that using the AR browser interface user foundshorter routes between two locations compared to that whenusing the 2D map because in the map those routes were eithercovered by trees or not included in the satellite images.
What distinguishes our study from the ones in the literatureis the way of providing navigation service. To be more specific,AR interfaces in the literature borrowed either the 2D digitalmap interfaces for navigation purpose or only showed pointsof interests and expected the users to walk towards them.However, in our study, AR browser interface not only showsthe point of interests but also it displays arrows as waypointsto guide the users their destination.
III. PROPOSED NAVIGATION APPLICATIONS
The shortest path between a selected source and target lo-cation is displayed to the users in both applications. Moreover,to help users to explore the campus, a search functionality isalso implemented together with displaying buildings as groups,such as academic buildings, sport facilities, etc.
A. Finding the Shortest Path for NavigationIn both applications, the shortest path offered to the user
is calculated by using Dijkstra’s shortest path algorithm. Forthe implementation of this algorithm Liang’s [19] method isused as a reference. The algorithm uses a weighted graph
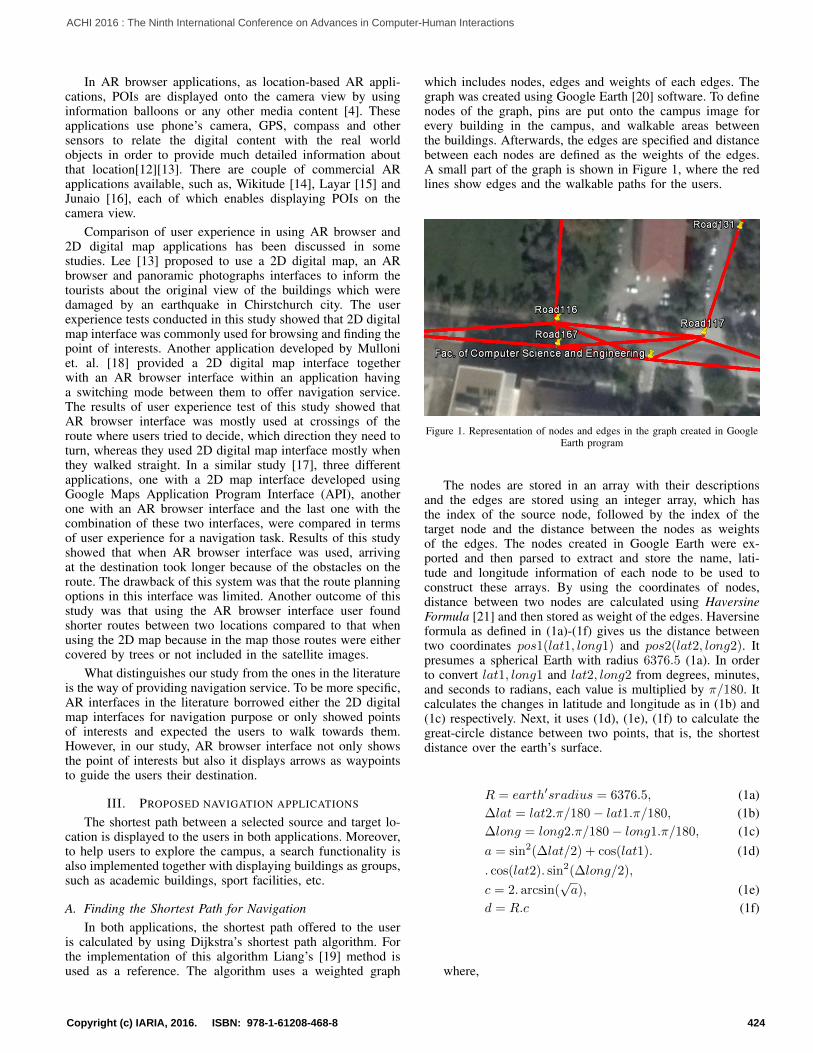
which includes nodes, edges and weights of each edges. Thegraph was created using Google Earth [20] software. To definenodes of the graph, pins are put onto the campus image forevery building in the campus, and walkable areas betweenthe buildings. Afterwards, the edges are specified and distancebetween each nodes are defined as the weights of the edges.A small part of the graph is shown in Figure 1, where the redlines show edges and the walkable paths for the users.
Figure 1. Representation of nodes and edges in the graph created in GoogleEarth program
The nodes are stored in an array with their descriptionsand the edges are stored using an integer array, which hasthe index of the source node, followed by the index of thetarget node and the distance between the nodes as weightsof the edges. The nodes created in Google Earth were ex-ported and then parsed to extract and store the name, lati-tude and longitude information of each node to be used toconstruct these arrays. By using the coordinates of nodes,distance between two nodes are calculated using HaversineFormula [21] and then stored as weight of the edges. Haversineformula as defined in (1a)-(1f) gives us the distance betweentwo coordinates pos1(lat1, long1) and pos2(lat2, long2). Itpresumes a spherical Earth with radius 6376.5 (1a). In orderto convert lat1, long1 and lat2, long2 from degrees, minutes,and seconds to radians, each value is multiplied by π/180. Itcalculates the changes in latitude and longitude as in (1b) and(1c) respectively. Next, it uses (1d), (1e), (1f) to calculate thegreat-circle distance between two points, that is, the shortestdistance over the earth’s surface.
R = earth′sradius = 6376.5, (1a)∆lat = lat2.π/180− lat1.π/180, (1b)∆long = long2.π/180− long1.π/180, (1c)a = sin2(∆lat/2) + cos(lat1). (1d). cos(lat2). sin2(∆long/2),
c = 2. arcsin(√a), (1e)
d = R.c (1f)
where,
424Copyright (c) IARIA, 2016. ISBN: 978-1-61208-468-8
ACHI 2016 : The Ninth International Conference on Advances in Computer-Human Interactions
• lat : Latitude• long : Longitude• ∆lat : change in latitude• ∆long: change in longitude• a : the square of the half of the straight line distance
between two points• c : the great circle distance in radians• d : distance
All the edges in this graph are bidirectional. Therefore,when an edge is defined as from A to B, another edge is alsoneeded to be defined as from B to A. When the user wants toget to a target from his/her current position, finding the sourcenode requires an extra calculation because user’s position isdefined with the corresponding GPS data and it may not bethe same with any of the nodes in the graph. Therefore, whenthe user wants to walk or drive from his/her current positionto a target destination, the source node in the algorithm ischosen by finding the closest node to the user’s position. Inorder to find the closest node to the user’s position, distancebetween user’s position and all the nodes are again calculatedusing Haversine Formula.
After constructing the graph and specifying the node that isclosest to the user, Dijkstra’s algorithm [19] was implementedto find the shortest path from a source node to a target node.The shortest path between two nodes is defined as the pathwith the minimum total weights. The algorithm is known asa single-source shortest path algorithm because it finds theshortest path from the source node to all the other nodes. Thepseudo code of the Dijkstra’s Shortest Path Algorithm is shownin Figure 2.
function SHORTESTPATH(source)Let V denote the set of vertices in the graph and v
denotes any of the vertices in V;Let T be a set that contains the vertices whose paths
to source are known;Initially T contains source vertex with cost[source] =
0;while sizeof T ≤ n do
find v in V - T with the smallest cost[u] + w(u,v)value among all u in T;
add v to T and set cost[v] = cost[u] + w(u,v);end while
end function
Figure 2. The pseudo code of the Dijkstra’s Shortest Path Algorithm.
The algorithm returns the nodes of the path from source todestination node that were used to display route informationin the applications [19]. The intermediate nodes are used toshow waypoints in AR browser application and used to drawthe path in the 2D digital map application.
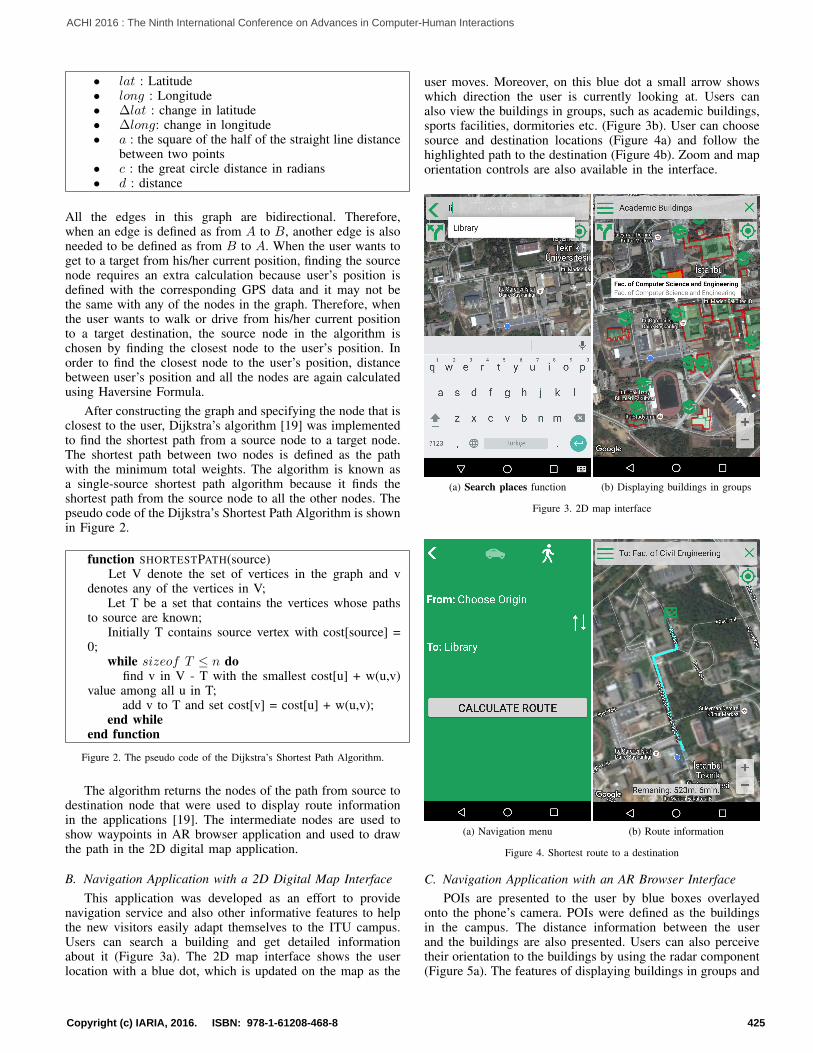
B. Navigation Application with a 2D Digital Map InterfaceThis application was developed as an effort to provide
navigation service and also other informative features to helpthe new visitors easily adapt themselves to the ITU campus.Users can search a building and get detailed informationabout it (Figure 3a). The 2D map interface shows the userlocation with a blue dot, which is updated on the map as the
user moves. Moreover, on this blue dot a small arrow showswhich direction the user is currently looking at. Users canalso view the buildings in groups, such as academic buildings,sports facilities, dormitories etc. (Figure 3b). User can choosesource and destination locations (Figure 4a) and follow thehighlighted path to the destination (Figure 4b). Zoom and maporientation controls are also available in the interface.
(a) Search places function (b) Displaying buildings in groups
Figure 3. 2D map interface
(a) Navigation menu (b) Route information
Figure 4. Shortest route to a destination
C. Navigation Application with an AR Browser InterfacePOIs are presented to the user by blue boxes overlayed
onto the phone’s camera. POIs were defined as the buildingsin the campus. The distance information between the userand the buildings are also presented. Users can also perceivetheir orientation to the buildings by using the radar component(Figure 5a). The features of displaying buildings in groups and
425Copyright (c) IARIA, 2016. ISBN: 978-1-61208-468-8
ACHI 2016 : The Ninth International Conference on Advances in Computer-Human Interactions

searching a building from a dropdown list is also available inthis application (Figure 5b). Moreover, users are free to definea range parameters to see the POIs that are located only withinthat range. This feature is useful if the user prefers to seeonly the buildings that are close to current location. A usercan select any POI to see the detailed information about thebuilding as in Figure 6a.
(a) POIs representation (b) Searh menu
Figure 5. AR browser application interface
(a) Detailed builging information (b) Target and waypointrepresentation
Figure 6. AR browser navigation interface
Since this interface uses the camera of the phone, the routeinformation is provided using a first-person view. The route isdisplayed to the user as a series of waypoints represented byred arrows (Figure 6b). Once the user gets close enough tothe first waypoint, the next one appears and user is directed tothe second, and so on. If the new visible waypoint is not inthe field of vision of the user, s/he gets directed with a smallgreen arrow to the new waypoint (Figure 7).
Figure 7. Arrow directing to the new waypoint
IV. EXPERIMENTS AND RESULTS
A. Hardware and Software SettingsBoth applications were developed for Android smartphones
and tested with a Nexus 5 mobile device. The applicationwith 2D digital map interface was developed using GoogleMaps API [22]. By using this API, Google’s map is integratedinto the application and GPS sensor data was fetched. Forthe application with AR browser interface Wikitude SoftwareDevelopment Kit (SDK) [23]was used. By using this SDK,any type of information can be easily augmented onto thecamera view of the smarthphones. Coordinates, names anddescriptions of POIs were arranged and uploaded to a webservice. The application only requests this data when it is firststarted and parses the data to overlay the POI’s informationonto the camera view as shown in (Figure 5a).
B. Experimental ConditionsThe user experience tests were conducted with two groups
of participants consisting of 5 people each (3 female, 7 male)from ages 23 to 37. They were asked to follow predefinedroutes unfamiliar to them. Two successive routes were defined.First group of the participants were asked to follow the firstroute (699 meters) with the 2D map interface and the secondroute (307 meters) with the AR browser interface. Conversely,second group of the participants were asked to follow the firstroute with the AR browser interface and the second route withthe 2D map interface. By doing this, the potential effect oftask familiarity on the results was intended to be eliminated.The participants were instructed to think aloud during the tests.After each route was completed, the participants were askedto fill out two questionnaires about the interface they used.The first questionnaire was called NASA TLX [24] form,which consisted of six questions with a Likert scale of 1to 21 (1: the lowest, 21: the highest). It is applied to theparticipants to obtain information about how much mental,physical, temporal and psychological work load they felt forthe given task. The second questionnaire was the Post StudySystem Usability Questionnaire (PSSUQ) [25], which had 19questions and measured the overall user satisfaction with theapplications, usefulness of the applications, information qualityand interface quality of the applications.
426Copyright (c) IARIA, 2016. ISBN: 978-1-61208-468-8
ACHI 2016 : The Ninth International Conference on Advances in Computer-Human Interactions

C. ResultsAccording to the demographic information about the users,
none of them used an AR application before, whereas all ofthem used a 2D digital map application. Overall time spentby the two groups with the two interfaces are summarized inTable I. It is apparent that no matter which route was used, 2Ddigital map interface took less time to arrive to the destinationthan the AR browser interface.
TABLE I. MEAN ROUTE COMPLETION TIMES.
Group # Route 1 (699 m.) Route 2 (307 m.)Group 1 with AR 13 min. with 2D map 7.4 min.Group 2 with 2D map 7.4 min. with AR 8.2 min.
The results of NASA TLX questionnaire in Figure 8showed that the application with the 2D map interface de-manded less mental workload than the AR application. Theprobable reason for a difference of 2.3 points was that theparticipants used their intuition more with the AR interfaceto find the target. The application with the 2D map interfacedemanded less physical workload (4.8/21) than the applicationwith the AR browser interface (12.6/21) since they neededto hold the phone always at the eye level to see the arrowand other information. Moreover, it was found out that ARbrowser interface caused negative feelings such as 12.9% morestress, irritation etc. because of the low stabilization of thearrow caused by hand movements and frequent GPS signalfluctuations. In terms of temporal worload, which was abouthow much time pressure the users felt due to the given tasksand whether the interfaces put the users in rush or not, the 2Dmap interface was evaluated higher by 2.2 points since someof the participants missed the route updates and then rushedto get on the previous route in order to not extend the distancetowards the target. The results also show that the participantsspent less effort to achieve the tasks with the 2D digital mapinterface (7/21) compared to the AR browser interface (9.5/21)since with the 2D application some of the participants lookedthe route only couple of times especially when they got closeto the turning points, but with the AR application participantswere always in the interaction with the application. Lastly,participants evaluated themselves more successful with the 2Ddigital map interface, since they arrived to the target locationeasier using the 2D digital map interface compared to theirperformance with the AR browser interface.
The results of PSSUQ is presented in Figure 9. In termsof user satisfaction, PSSUQ results showed that the 2D digitalmap interface (71.1% of user satisfaction) is better than ARbrowser interface (56.2% of user satisfaction). The reason thatthe users were less satisfied with the AR browser interfacewas due to the longer task completion times and the amountof the frustration they felt with the interface. In terms ofinterface quality, 2D digital map interface was consideredsimpler than the AR browser interface, which resulted in the8.6% difference in the interface quality scores of the twointerfaces. Moreover, 2D digital map interface was scored as71% in terms of usefulness while AR browser interface wasscored as 56% because the 2D digital map interface was easierto learn because it looked more familiar and usual than the ARbrowser interface, and also it was considered as more effectivein the navigation tasks the participants fulfilled. Consideringthe information quality scores, because of the color choices(for some participants) and the low stabilization of the arrows
the participants experienced with the AR browser interface,the 2D digital map interface was preferred. However, the radarfeature of the AR browser interface was found useful by theparticipants since it helped them to stay on the right pathduring the navigation and also to get back on the right pathwhen they got lost.
Men
tal
Physic
al
Tempo
ral
Perform
ance
Effort
Frustra
tion
123456789
10111213
Scor
es
AR browser interface2D digital map interface
Figure 8. NASA TLX questionnaire results.
Usersatisfaction(%)
Usefulness(%) Informationquality(%)
Interfacequality(%)
10
20
30
40
50
60
70
80
Scor
es
AR browser interface2D digital map interface
Figure 9. PSSUQ results.
Seven participants stated that they would prefer 2D digitalmap interface, whereas, three participants stated that the ARbrowser interface would be their choice. Moreover, four ofthe participants suggested that the combination of these twointerfaces would be more useful. A seven degree scale (1: thehighest, 7: the lowest) was provided to the participants to eval-uate the degree of exploration they felt with the two interfaces.The answers showed that the 2D digital map interface helped
427Copyright (c) IARIA, 2016. ISBN: 978-1-61208-468-8
ACHI 2016 : The Ninth International Conference on Advances in Computer-Human Interactions

them more to explore the area while walking and the averagedegree of exploration score given to 2D digital map interfacewas 4.3, whereas, average degree of exploration score of ARbrowser interface was 5.4 since using the AR application, userswere regularly focusing on the arrow and keeping their eyeson the screen almost all the time. Moreover, the search placesfeature was mentioned as more useful in the AR browserinterface especially when the POIs was overlapping.
Besides these questionnaires the thoughts of the partici-pants stated during the experiments were also examined. Atthe beginning of the navigation task, each participant tried toorient him/herself to the map according to the direction thatthey are facing to. Some of the participants mentioned thatradar component in the AR browser interface was helpful forfinding the initial orientation. They also stated that the arrow,which shows the orientation of the user in the 2D digitalmap interface appeared and disappeared too much, whichcaused confusion about the direction to be followed. Moreover,participants stated that they had to look at the arrow all thetime, which was tiring and might pose danger while walking.The blue boxes showing the target POI were mentioned asuseful especially when they had difficulty to decide towardswhich direction they needed to walk. Most of the participantsfound the 2D digital map interface more helpful to get to knowthe environment and the route. However, when the GPS signalshows the user’s location wrongly even for a moment, some ofthe participants got confused and felt anxious. In conclusion,all of the participants stated that the combination of these twointerfaces would be more effective for a navigation task.
V. CONCLUSION AND FUTURE WORK
In this study, two different mobile navigation interfaceswere compared in terms of user experience by conductingan experiment using a navigation scenario. The results ofthe experiment revealed the advantages and disadvantagesof both interfaces. Specifically, using 2D digital map inter-face participants spent less time to arrive to target locations.Moreover, in terms of physical and mental workload, the 2Ddigital map interface was less demanding. User satisfactionwas found to be higher with the 2D digital map interface sincethe participants found it simple and functional for the giventasks. The radar component in the AR browser interface wasconsidered useful for orientation and locating the target point.
As a future work, the combination of these two interfaceswill be implemented, which was actually suggested by some ofthe participants. With this new interface, displaying the point ofinterests according to users’ preference will be also provided.It is also thought to be a useful research that an AR applicationsimilar to the one in this study can be implemented in opticalhead-mounted displays, such as, Google Glass or SamsungGear VR, and tested with the users in order to observe people’sbehaviour and usability of these type of devices in navigationtasks.
REFERENCES
[1] J. Teevan, A. Karlson, S. Amini, A. Brush, and J. Krumm, “Understand-ing the Importance of Location, Time, and People in Mobile Local SearchBehavior”, in Proceedings of the 13th International Conference on Mo-bileHCI 2011, Stockholm, Sweden. ACM, 2011, pp. 77-80 ISBN: 978-1-4503-0541-9, URL: http://dl.acm.org/citation.cfm?id=2037386 [ac-cessed: 2015-11-27].
[2] “ITU Webpage”, 2016, URL: http://www.itu.edu.tr [accessed: 2016-01-02].
[3] “Google Maps”, 2015, URL: http://www.maps.google.com [accessed:2015-09-05].
[4] G. Cherchi, F. Sorrentino, and R. Scateni, “AR Turn-By-Turn Navigationin Small Urban Areas and Information Browsing”, in STAG - Eurograph-ics Italian Chapter Conference 2014, Italy. The Eurographics Association,2014, pp. 37-40, ISBN: 978-3-905674-72-9, URL: http://diglib.eg.org/[accessed: 2015-11-20].
[5] T. J. Mehigan and I. Pitt, Harnessing Wireless Technologies for CampusNavigation by Blind Students and Visitors, Springer Berlin Heidelberg,Berlin, Heidelberg, 2012, pp. 67-74, in ICCHP 2012, Linz, Austria, July11-13, 2012, Proceedings, Part II, ISBN: 978-3-642-31534-3.
[6] I. M. Ruffin, A. Murphy, V. Larkin, and J. E. Gilbert, “CAMPNAV: ACampus Navigation System For the Visually Impaired”, Proceedings ofE-Learn: World Conference on E-Learning in Corporate, Government,Healthcare, and Higher Education 2006, pp. 2944-2951. AACE, Hon-olulu, Hawaii, USA, 2006.
[7] T. S. Wang, D. Tjondronegoro, M. Docherty, W. Song, and J. Fuglsang,“A Recommendation for Designing Mobile Pedestrian Navigation Systemin University Campuses”, In Proceedings of the 25th OzCHI ’13, 2013,Adelaide, Australia. ACM, 2013, pp. 3-12, ISBN: 978-1-4503-2525-7,URL: http://dl.acm.org/ [accessed: 2015-11-27].
[8] J. R. Vallino, “Interactive Augmented Reality”, Technical Report, Uni-versity of Rochester, 1998.
[9] R. Azuma, “A Survey of Augmented Reality”, Presence: Teleoperatorsand Virtual Environments, Vol. 6, no. 4, 1997, pp. 355-385.
[10] D. W. F. van Krevelen and R. Poelman, “A Survey of AugmentedReality Technologies, Applications and Limitations”, The InternationalJournal of Virtual Reality, Vol. 9, No. 2, 2010, pp. 1-20.
[11] S. Feiner, B. MacIntyre, T. Hollerer, and A. Webster, “A touringmachine: prototyping 3D mobile augmented reality systems for exploringthe urban environment”, Personal Technologies, vol. 1, no. 4, 1997, pp.208-217, ISSN: 1617-4917.
[12] T. Langlotz, J. Grubert, and R. Grasset, “Augmented Reality Browsers:Essential Products or Only Gadgets?”, Communications of the ACM,vol. 56, no. 11, 2013, pp. 34-36, ISSN: 0001-0782.
[13] G. A. Lee, A. Dunser, S. Kim, and M. Billinghurst, “CityViewAR:A Mobile Outdoor AR Application for City Visualization”,IEEE ISMAR-AMH Proceedings, Nov. 2012, pp. 57-64, URL:http://ieeexplore.ieee.org/ [accessed: 2015-11-22].
[14] “Wikitude”, 2015, URL: http://www.wikitude.com [accessed: 2015-10-03].
[15] “Layar”, 2015, URL: http://www.layar.com [accessed: 2015-10-10].[16] “Junaio”, 2015, URL: http://www.junaio.com [accessed: 2015-10-17].[17] A. Dunser, M. Billinghurst, J. Wen, V. Lehtinen, and A. Nurminen,
“Exploring the use of handheld AR for outdoor navigation”, Computers& Graphics, vol. 36, Issue 8, 2012, pp. 1084-1095, ISSN: 0097-8493.
[18] A. Mulloni, H. Seichter, and D. Schmalstieg, “User Experiences withAugmented Reality Aided Navigation on Phones”, in ISMAR, Oct. 2011,pp.229-230, URL: http://ieeexplore.ieee.org/ [accessed: 2015-11-22].
[19] Y. Liang, Weighted Graphs and Applications. Pearson Education, 2011,chapter 31, pp. 1094-1127, in Introduction to Java programming: Com-prehensive version (8th ed., International ed.).
[20] “Google Earth”, 2015, URL: http://www.earth.google.com [accessed:2015-08-30].
[21] R. W. Sinnott, “Virtues of the Haversine”, Sky and telescope 11/1984;68(2, article 159):158.
[22] “Google Maps API”, 2015, URL: http://developers.google.com/maps/[accessed: 2015-09-06].
[23] “Wikitude SDK”, 2015, URL: http://www.wikitude.com/products/wikitude-sdk/ [accessed: 2015-10-19].
[24] S. G. Hart, “NASA-Task Load Index (NASA-TLX); 20 Years Later”,Proceedings of the HFES 50th Annual Meeting, vol. 50, no. 9, 2006, pp.904-908.
[25] JR. Lewis, “Psychometric Evaluation of the Post-Study System Us-ability Questionnaire: The PSSUQ”, Proceedings of the HFES AnnualMeeting, vol. 36, no. 16, 1992, pp. 1259-1260.
428Copyright (c) IARIA, 2016. ISBN: 978-1-61208-468-8
ACHI 2016 : The Ninth International Conference on Advances in Computer-Human Interactions