Comparative Assessment of Gasification Based Coal Power...
13
Comparative Assessment of Gasification Based Coal Power Plants with Various CO 2 Capture Technologies Producing Electricity and Hydrogen Sanjay Mukherjee, † Prashant Kumar,* ,† Ali Hosseini, ‡ Aidong Yang, §,∥ and Paul Fennell ⊥ † Department of Civil and Environmental Engineering, Faculty of Engineering and Physical Sciences (FEPS), University of Surrey, Guildford, Surrey GU2 7XH, United Kingdom ‡ Sharif Energy Research Institute (SERI), Sharif University of Technology, Tehran, Iran § Department of Chemical and Process Engineering, FEPS, University of Surrey, Guildford, Surrey GU2 7XH, United Kingdom ∥ Department of Engineering Science, University of Oxford, Parks Road, Oxford OX1 3PJ, United Kingdom ⊥ Department of Chemical Engineering, Imperial College London, South Kensington, London SW7 2AZ, United Kingdom * S Supporting Information ABSTRACT: Seven different types of gasification-based coal conversion processes for producing mainly electricity and in some cases hydrogen (H 2 ), with and without carbon dioxide (CO 2 ) capture, were compared on a consistent basis through simulation studies. The flowsheet for each process was developed in a chemical process simulation tool “Aspen Plus”. The pressure swing adsorption (PSA), physical absorption (Selexol), and chemical looping combustion (CLC) technologies were separately analyzed for processes with CO 2 capture. The performances of the above three capture technologies were compared with respect to energetic and exergetic efficiencies, and the level of CO 2 emission. The effect of air separation unit (ASU) and gas turbine (GT) integration on the power output of all the CO 2 capture cases is assessed. Sensitivity analysis was carried out for the CLC process (electricity-only case) to examine the effect of temperature and water- cooling of the air reactor on the overall efficiency of the process. The results show that, when only electricity production in considered, the case using CLC technology has an electrical efficiency 1.3% and 2.3% higher than the PSA and Selexol based cases, respectively. The CLC based process achieves an overall CO 2 capture efficiency of 99.9% in contrast to 89.9% for PSA and 93.5% for Selexol based processes. The overall efficiency of the CLC case for combined electricity and H 2 production is marginally higher (by 0.3%) than Selexol and lower (by 0.6%) than PSA cases. The integration between the ASU and GT units benefits all three technologies in terms of electrical efficiency. Furthermore, our results suggest that it is favorable to operate the air reactor of the CLC process at higher temperatures with excess air supply in order to achieve higher power efficiency. 1. INTRODUCTION Energy is the backbone of every modern society. On the other hand, its production is one of the key contributors toward the global climate change. In particular, power plants produce both electricity and CO 2 by combusting fossil fuels, which is one of the major sources of total man made CO 2 emissions worldwide. 1,2 Future forecasts for the economic growth in Asia Pacific and industrial development in Africa indicate that the total world energy demand will increase from 462 quadrillion British Thermal Units (BTU) in 2005 to over 695 quadrillion BTU by 2030. 3 The exponential rise in emissions of CO 2 from fossil fuel utilization to around 30 Gt per year will lead to significant climate change unless the emissions are captured and stored. 4 Developing clean and affordable energy with abundant supply is an issue of international concern. Until recently, the prime focus of the research on power generation was on improving energy efficiency and switching from fossil fuels toward less carbon intensive (renewable) energy sources. The renewable energy technologies can reduce CO 2 emissions but are still costly. Even if they are made cost-competitive in the next few years, they will still need time to penetrate the market. Some researchers consider coal as the primary source of energy at least for the next 5−6 decades since its supply will last over 150 years compared with 50−60 years for oil and natural gas. 5 Thus, there is a large international research effort toward developing technologies to use coal in an environmentally sustainable manner. 6 In the recent years, carbon capture and storage (CCS) has been considered to offer “end-of-pipe” technologies that can allow continuous use of fossil fuels with low or almost negligible emissions. A review by Boot-Handford et al. 7 has Received: December 9, 2013 Revised: January 20, 2014 Published: January 21, 2014 Article pubs.acs.org/EF © 2014 American Chemical Society 1028 dx.doi.org/10.1021/ef4024299 | Energy Fuels 2014, 28, 1028−1040
Transcript of Comparative Assessment of Gasification Based Coal Power...

Comparative Assessment of Gasification Based Coal Power Plantswith Various CO2 Capture Technologies Producing Electricity andHydrogenSanjay Mukherjee,† Prashant Kumar,*,† Ali Hosseini,‡ Aidong Yang,§,∥ and Paul Fennell⊥
†Department of Civil and Environmental Engineering, Faculty of Engineering and Physical Sciences (FEPS), University of Surrey,Guildford, Surrey GU2 7XH, United Kingdom‡Sharif Energy Research Institute (SERI), Sharif University of Technology, Tehran, Iran§Department of Chemical and Process Engineering, FEPS, University of Surrey, Guildford, Surrey GU2 7XH, United Kingdom∥Department of Engineering Science, University of Oxford, Parks Road, Oxford OX1 3PJ, United Kingdom⊥Department of Chemical Engineering, Imperial College London, South Kensington, London SW7 2AZ, United Kingdom
*S Supporting Information
ABSTRACT: Seven different types of gasification-based coal conversion processes forproducing mainly electricity and in some cases hydrogen (H2), with and without carbondioxide (CO2) capture, were compared on a consistent basis through simulation studies.The flowsheet for each process was developed in a chemical process simulation tool“Aspen Plus”. The pressure swing adsorption (PSA), physical absorption (Selexol), andchemical looping combustion (CLC) technologies were separately analyzed for processeswith CO2 capture. The performances of the above three capture technologies werecompared with respect to energetic and exergetic efficiencies, and the level of CO2emission. The effect of air separation unit (ASU) and gas turbine (GT) integration on thepower output of all the CO2 capture cases is assessed. Sensitivity analysis was carried outfor the CLC process (electricity-only case) to examine the effect of temperature and water-cooling of the air reactor on the overall efficiency of the process. The results show that,when only electricity production in considered, the case using CLC technology has anelectrical efficiency 1.3% and 2.3% higher than the PSA and Selexol based cases, respectively. The CLC based process achieves anoverall CO2 capture efficiency of 99.9% in contrast to 89.9% for PSA and 93.5% for Selexol based processes. The overallefficiency of the CLC case for combined electricity and H2 production is marginally higher (by 0.3%) than Selexol and lower (by0.6%) than PSA cases. The integration between the ASU and GT units benefits all three technologies in terms of electricalefficiency. Furthermore, our results suggest that it is favorable to operate the air reactor of the CLC process at highertemperatures with excess air supply in order to achieve higher power efficiency.
1. INTRODUCTION
Energy is the backbone of every modern society. On the otherhand, its production is one of the key contributors toward theglobal climate change. In particular, power plants produce bothelectricity and CO2 by combusting fossil fuels, which is one ofthe major sources of total man made CO2 emissionsworldwide.1,2 Future forecasts for the economic growth inAsia Pacific and industrial development in Africa indicate thatthe total world energy demand will increase from 462quadrillion British Thermal Units (BTU) in 2005 to over695 quadrillion BTU by 2030.3 The exponential rise inemissions of CO2 from fossil fuel utilization to around 30 Gtper year will lead to significant climate change unless theemissions are captured and stored.4
Developing clean and affordable energy with abundantsupply is an issue of international concern. Until recently, theprime focus of the research on power generation was onimproving energy efficiency and switching from fossil fuels
toward less carbon intensive (renewable) energy sources. Therenewable energy technologies can reduce CO2 emissions butare still costly. Even if they are made cost-competitive in thenext few years, they will still need time to penetrate the market.Some researchers consider coal as the primary source of energyat least for the next 5−6 decades since its supply will last over150 years compared with 50−60 years for oil and natural gas.5
Thus, there is a large international research effort towarddeveloping technologies to use coal in an environmentallysustainable manner.6
In the recent years, carbon capture and storage (CCS) hasbeen considered to offer “end-of-pipe” technologies that canallow continuous use of fossil fuels with low or almostnegligible emissions. A review by Boot-Handford et al.7 has
Received: December 9, 2013Revised: January 20, 2014Published: January 21, 2014
Article
pubs.acs.org/EF
© 2014 American Chemical Society 1028 dx.doi.org/10.1021/ef4024299 | Energy Fuels 2014, 28, 1028−1040

Table 1. Summary of Literature Review on the Comparison of Different Coal to Electricity and H2 Conversion Technologieswith and without CCS
studyconversion technology
used fuel typeCO2 capture technology
used
electricalefficiency(% LHV)
H2 efficiency(% LHV)
CO2 captureefficiency (%)
overallefficiency(% LHV)
Wheeler35 IGCC coal 50.9 50.9post-combustion/chemicalabsorption (amine)
43.4 97.4 43.4
Doctor etal.36
IGCC coal pre-combustion/physicalabsorption (Selexol)
12.8 44.5 86.8 57.3
Klett et al.37 IGCC coal 4.5 51.0 55.5pre-combustion/physicalabsorption (Selexol)
1.4 51.9 92.0 53.3
Parsons38 subcritical PC coal (bituminus) 38.9 396.8post-combustion/chemicalabsorption (MEA)
27.7 99.5 27.7
NGCC natural gas 57.9 57.9Post-Combustion/ChemicalAbsorption (MEA)
49.9 90 49.9
IGCC (Shell) coal (bituminus) 47.4 47.4post-combustion/chemicalabsorption (MEA)
40.1 90.2 40.1
Chiesa etal.8
IGCC with syngasquench
coal 42.6 42.6pre-combustion/physicalabsorption (Selexol)
36.8 91.3 36.8
4.21 57.46 61.7pre-combustion/physicalabsorption (Selexol)
2.1 57.46 91.28 59.6
Damen etal.9
subcritical coal (bituminus) post-combustion/chemicalabsorption (MEA)
35.0 88 35.0
IGCC pre-combustion/physicalabsorption (Selexol)
43.0 85 43.0
post-combustion/chemicalabsorption (MEA)
37.0−38.0 90 37.0−38.0
NGCC natural gas post-combustion/chemicalabsorption (MEA)
47.0 85 47.0
Chiesa etal.39
NGCC natural gas CLC with SC 0.45 77.4 ∼100 78.1CLC with CT 17.57 49.7 ∼100 76.6
NGCC (FTR-) post-combustion/chemicalabsorption (MEA)
0 78.0 73.6 78.0
Li andFan13
pressurized fluidizedbed combustor
coal (Illinois #6) 38.0−45.0(HHV)
38.0−45.0(HHV)
post-combustion/chemicalabsorption (MEA)
26.6−31.5(HHV)
90 26.6-31.5(HHV)
Rezvani etal.40
IGCC coal (bituminous) 45.4 45.4pre-combustion/physicalabsorption (Selexol)
35.6 91 35.6
pre-combustion/membraneseparation
36.4 93 36.4
CLC 35.2 ∼100 35.2Cormos10 IGCC with water
quenchcoal pre-combustion/physical
absorption (Selexol)36.0 92.35 36.028.6 12.9 92.35 41.5
coal with municipalsolid waste
35.8 92.83 35.8
coal with meat andbone meal
35.7 93.0 35.7
coal with sawdust 37.2 92.2 37.2Fan andLi43
IGCC coal (Illinois #6) post-combustion/chemicalabsorption (MEA)
32.1 (HHV) 90 32.1 (HHV)
CLC 36.5 (HHV) 100 36.5 (HHV)gasification based coalto H2 process
post-combustion/chemicalabsorption (MEA)
2.1 (HHV) 55.7 (HHV) 90 57.8 (HHV)
IGCC CLC 26.0 (HHV) 38.1 (HHV) 100 64.1 (HHV)Cormos12 IGCC (entrained flow
gasifier)coal 46.6 46.6
pre-combustion/physicalabsorption (Selexol)
37.1 90.79 37.1
CLC 38.38 99.55 38.38Fan et al.23 PC coal 36.8 (HHV) 36.8
Energy & Fuels Article
dx.doi.org/10.1021/ef4024299 | Energy Fuels 2014, 28, 1028−10401029

comprehensively discussed the recent developments, chal-lenges, and potential future improvements in different typesof CCS technologies. Table 1 shows a summary of a number ofstudies on selection of a promising CCS technology that canproduce electricity and, in some cases, H2 from fossil fuels. Forinstance, Chiesa et al.8 compared different scenarios consider-ing CO2 venting and CO2 capture using integrated gasificationcombined cycle (IGCC) technology for the production of H2and electricity from coal. Physical absorption and adsorptionprocesses were assumed for CO2 and H2 separation,respectively. They8 concluded that, with an emissionsconstraint, there are very small thermodynamic benefits ofcoproduction relative to stand-alone electricity and H2production. Damen et al.9 reviewed various concepts includingoxyfuel combustion, membrane separation, physical absorption,and chemical absorption processes for electricity and H2production from coal and natural gas with CCS. A number ofcritical factors were identified and compared, includingefficiency, cost of energy (COE), cost of H2 (COH), andCO2 avoidance costs. Also assessed were the impact of fuelprices on electricity and H2 production costs for pulverized coal(PC), natural gas combined combustion (NGCC), and IGCCplants. The analysis showed that with CO2 capture, the netelectrical efficiencies are 30−35% for PC, 32−40% for IGCC,and 43−50% for NGCC power plants. Also, both the chemicaland physical absorption processes can achieve 85−90% CO2capture efficiency with the precapture technologies being moresuitable for IGCC plants. Cormos10 describes the methodologyto evaluate the performance of a coproduction (electricity andH2) IGCC power plant with physical absorption (Selexol)-based CO2 capture technology. The study examined the effectof using different feed stocks such as coal, sawdust, municipalsolid waste, and food waste (meat and bone) on the poweroutput. Later, Cormos11 compared different types of gasifiersusing only coal as fuel and investigated the energy integrationaspects in detail to optimize the overall plant efficiency of acoproduction IGCC plant with CCS. The study concludes thatan entrained flow gasifier with dry feed and syngas heatrecovery is a more promising concept than slurry feed andwater quench design. Further work by Cormos12 presented adetailed methodology to assess the performance of an iron-based CLC system using critical design factors such as gasifierselection, gasifier feeding system, and overall energy efficiency.This work suggested that a CLC-based system has a low energypenalty compared to liquid absorption process for CO2 capture.Li and Fan13 addressed the energy conversion efficiencies for
the chemical looping based coal conversion process. Theirstudy shows that efficiencies of syngas chemical looping processis comparable with the current coal conversion processes forelectricity and H2 generation and could be considered as aretrofit technology in the downstream of the presentgasification processes. On the other hand, they found thatcoal direct chemical looping combustion (CDCLC) process ismore energy efficient than coal gasification based CLC process.
In addition to the investigations on energy efficiency, thereare a few studies on the exergetic efficiency of various CO2capture technologies with combined electricity and H2production. Exergy analysis combines the first and secondlaws of thermodynamics to identify the irreversibility and lossesrelated to each unit or process of a system. For instance, Kunze,et al.14 presented the exergy analysis of an IGCC process bydividing the plant into three sections, the gasifier, gas treatment,and combined cycle. The analysis shows that 60% of the exergyis lost in the overall process; out of which, 31.1% is lost only inthe combined cycle section, making it the most inefficient partof the process, followed by 17.1% in gas treating and 11.3% inthe gasifier. Wang et al.15 computed the exergy penalty for CO2capture in an IGCC process. Further, Anheden and Svedberg16
showed the exergy analysis of CLC system with different fuelsand oxygen carriers (OCs). Their results indicate that efficiencyof a CLC system is similar or higher than that of a conventionalcombustion process.While the existing studies have provided useful evaluation of
a range of power (and in some cases H2) generation schemeswith or without CCS, their assumptions and considerationsvary with respect to factors such as feedstock, power generationtechnology, CCS technology, production scale, and modelingapproaches adopted, making it difficult to compare their results.To address this deficiency, our work uses a single basis ofanalysis in terms of the feedstock type, production scale, andmodeling assumptions. This makes it easier and morestraightforward to compare various gasification-coupled coalpower plants with and without the CCS producing electricityand possibly H2. This work provides a methodology to assessdifferent CO2 capture technologies based on mainly energy,exergy, and CO2 capture efficiencies. The processes evaluatedhere include (i) IGCC for power generation without CCS, (ii)IGCC for power (and H2) generation with two differentprecombustion CCS options based on physical absorption andadsorption, and (iii) power (and H2) generation with CLC.Comparison is also made on the basis of the effect of ASU andGT unit integration for each of the three capture technologies.The effect of different operating conditions such as air reactortemperature and water cooling of the air reactor in the CLCprocess on the net electrical efficiency is another distinct featureof the present work. The findings of this work evaluate thesuitability of physical absorption, physical adsorption, and CLCbased CO2 capture technologies for coal power plants byindicating the differences in overall plant performance witheach type of capture technology. This article also predicts thebehavior of the CLC process at different operating conditions(as stated above), which can be useful in pilot scaleexperimental studies.A literature review of advanced CCS technologies has been
first carried out to gather information on technical inputs andparameters such as the component flow rates, temperature,pressure, and efficiencies for various units, required for processmodeling. The chemical process simulation tool Aspen Plus,
Table 1. continued
studyconversion technology
used fuel typeCO2 capture technology
used
electricalefficiency(% LHV)
H2 efficiency(% LHV)
CO2 captureefficiency (%)
overallefficiency(% LHV)
post-combustion/chemicalabsorption (MEA)
26.2 (HHV) 90 26.2 (HHV)
coal direct chemicallooping (CDCL)
CLC 34.7 (HHV) ∼100 34.7 (HHV)
Energy & Fuels Article
dx.doi.org/10.1021/ef4024299 | Energy Fuels 2014, 28, 1028−10401030

was used to develop the flowsheet models for seven differentcoal gasification based power plant configurations at a nominalpower output of up to 467 MW. The electricity generation, H2production, CO2 emission and other performance indicatorssuch as energy and exergy efficiencies are subsequentlyanalyzed.
2. METHODOLOGY2.1. Process Description. Seven different types of coal gasification
based power plant configurations, with and without CO2 capture, at apower output between 141 and 467 MW have been considered. A briefdescription of each process is given in Table 2. The chemical process
simulation tool Aspen Plus was used to develop and simulate a processflowsheet for each case. The base case (case 0) considered in this workis an IGCC plant producing only electricity without any CO2 capture.The flowsheets for cases 1−4 are conventional IGCC process withprecombustion based CO2 capture and cases 5−6 are gasification-coupled CLC process for CO2 capture. Cases 1, 2, and 5 generateelectricity only while the cases 3, 4, and 6 produce both electricity andH2. A stand-alone ASU generating 95% pure O2 has been used in allseven cases, followed by an O2-blown entrained flow shell gasifieroperating at 30 atm, and fuel conversion ratio of 99.9%.11 The powerconsumption by the ASU is assumed to be 225 kWh/tonne of O2produced.11 The dry pulverized coal (100 μm in size) is pressurized ina lock hopper and fed to the gasifier vessel along with O2 from the top.The coal is partially oxidized by O2 in the gasifier to produce syngas,which mainly consists of CO and H2. The exothermic nature of thepartial oxidation reaction of coal inside the gasifier provides the heat toachieve and maintain the desired temperature of 1300 °C which isabove the melting point of ash.8 The excess heat generated in thegasifier is removed by the generation of high pressure (HP) steam.The slag in liquid form flows down the walls and comes out at thebottom with syngas. The syngas can be either quenched with water orcooled in radiative and convective heat exchanger.8 Water quenchingdegrades the thermal energy of the hot syngas stream. Therefore, inour study, the syngas from the gasifier is cooled in a heat exchanger,which allows production of HP steam.2.1.1. IGCC with Precombustion Based CO2 Capture. This section
describes the configuration of cases 1 to 4, which use PSA and Selexoltechnologies for CO2 capture. First, an IGCC process producing onlyelectricity with PSA technology for CO2 capture (case 1), shown inFigure 1a, was developed. The detailed process flow diagram of case 1can be seen in Supporting Information (SI) Figure S.1. In this process,the hot syngas stream at 1300 °C from the gasifier is cooled to 350 °Cin a convective heat exchanger in the heat recovery steam generation(HRSG) unit where HP water used for cooling is converted into a HPsteam. The cooled syngas at 350 °C is sent to two water−gas shiftreactors (WGS-1 and WGS-2) aligned in series operating attemperatures 350 and 178 °C, respectively.17,18 The WGS-1 reactoris supplied with steam at 30 atm and 350 °C generated in the HRSG.The CO in the syngas stream is partially converted to CO2 by thesteam in WGS-1 reactor generating more H2 in the syngas. The syngasand steam exiting the WGS-1 reactor at 350 °C are cooled to 178 °C
before both are fed to the WGS-2 reactor where up to 98% of theremaining CO is converted to CO2.
19 The heat released by the coolingof syngas from 350 to 178 °C is used for preheating the boilerfeedwater in the HRSG. The conversion of CO into CO2 in the WGSreactors is an exothermic process which needs continuous removal ofthe excess heat to maintain the required reaction temperatures.Pressurised boiler feedwater is used as the coolant in the two WGSreactors. The syngas exiting the WGS-2 reactor at 178 °C is furthercooled to 35 °C in the HRSG which condenses the steam and removesit before the syngas is sent to an acid gas removal (AGR) unit or aSelexol unit to remove sulfur; here nearly 99.9% of the hydrogensulphide (H2S) is stripped from the syngas using Selexol (dimethylether of polyethylene glycol).12 The sulfur removed from the syngas inthe form of H2S could be converted into elementary sulfur in a Clausplant.20 The Selexol in the sulfur removal unit is regenerated byheating which removes the dissolved sulfur and CO2. After removingsulfur, the syngas stream is passed through the PSA-CO2 unit whereCO2 is adsorbed by the adsorbent material (activated carbon) and theremaining gases (Tail gas−1; see Figure 1a) exits with a pressure dropof 0.49 atm.21,22 The CO2 separation efficiency of the PSA unit isassumed to be between 90% and 95%.21 The adsorbent material in thePSA-CO2 chamber is regenerated by lowering the pressure to nearlyatmospheric pressure level to release CO2.
21,22 The released CO2 isthen compressed to 150 atm for transportation and storage.23 Case 1does not produce any H2, and therefore H2-rich Tail gas-1 followsroute II (as seen in Figure 1a), which is then supplied to thecombustor of the GT unit after reheated to 350 °C. The hightemperature exhaust gases from the GT are cooled in the HRSG unitbefore it is finally released to the atmosphere. The syngas and flue gasstream temperatures for case 1 are noted in SI Table S.1. The HPsteam generated at 600 °C in the overall process (gasifier, heatexchangers, HRSG) is expanded through the HP, intermediatepressure (IP) and low pressure (LP) steam turbines. The exhauststeam from the HP and IP steam turbines are reheated to 600 °Cbefore further expansion through the IP and LP turbines. The detailsof water and steam cycle as well as the temperature and mass flow rateof steam and water for case 1 are provided in the SI Section S.1 andTable S.2, respectively.
Case 2, which uses a Selexol-based physical absorption CO2 captureunit (also known as acid gas removal or AGR unit) instead of a PSA-CO2 unit after sulfur removal, is shown in Figure 1b. In this process,the outgoing gas stream from the sulfur removal unit, containingmainly CO2 and H2, is passed through the AGR-CO2 unit whichseparates CO2 from rest of the gases. The Selexol is regenerated byreducing the pressure to atmospheric level which releases the absorbedCO2.
8 The CO2 is then compressed to up to 150 atm after condensingany vapor present in the stream. After CO2 removal, the remaininggases (Tail gas-1) are used in the GT unit as in case 1, following routeII.
Case 3, which is shown in Figure 1a, is a variant of case 1, withcombined electricity and H2 production. The stream from PSA-CO2enters PSA-H2 installed for H2 separation, following route I instead ofroute II. A 99.99% pure stream of H2 exits the PSA-H2 unit after 0.49atm of pressure drop.8 The separation efficiency for H2 in the PSA-H2unit is assumed to be 85%.8,10 The output H2 stream is compressed to60 atm for transportation and storage.8 The leftover gas (Tail gas-2)after H2 separation leaves PSA-H2 at nearly atmospheric pressure;hence, it needs to be compressed to the GT combustor pressure (21atm). If more electrical energy is required, some amount of separatedpure H2 can be purged to the GT combustor according to therequirement. The remaining pure H2 stream is compressed to 60 atmfor storage. The high temperature GT exhaust is passed through theHRSG to produce HP steam and for steam reheating. Case 4, shownin Figure 1b, has an AGR-CO2 unit for CO2 removal instead of a PSA-CO2 unit used in case 3. Apart from this difference, the rest of thedownstream path after CO2 removal is same as described above forcase 3, which is following route I instead of route II.
2.1.2. CLC-Based Processes. A CLC process is based on transferringoxygen to the fuel from air or steam by means of a OC. An OC couldbe made of metal or synthetic material that is capable of carrying
Table 2. Description of Different Cases Used in the Study
case no.CO2 capture technology
usedelectricityproduction
H2production
0 (base case) without CO2 capture yes no1 physical adsorption (PSA) yes no2 physical absorption
(Selexol)yes no
3 physical adsorption (PSA) yes yes4 physical absorption
(Selexol)yes yes
5 CLC yes no6 CLC yes yes
Energy & Fuels Article
dx.doi.org/10.1021/ef4024299 | Energy Fuels 2014, 28, 1028−10401031

oxygen and has excellent mechanical properties to withstand attrition,agglomeration and physical stress of recycling at high temperatures.This work assumes hematite (Fe2O3) as the OC, supported with 15%aluminum oxide (Al2O3) and 15% silicon carbide (SiC) to enhance itsmechanical and physical properties.24 Parts c and d of Figure 1 showthe block diagram of cases 5 and 6, respectively. In cases 5 and 6, thesyngas from the coal gasifier is cooled to 35 °C in HRSG and suppliedto a Selexol based sulfur removal unit. The syngas is then sent to afluidized bed fuel reactor of the CLC process (after reheated to 350°C) represented by two fuel reactors, FR 1 and FR 2 (see Figure 1c,d).25 In the fuel reactors, H2 and CO are oxidized into H2O and CO2after coming in contact with Fe2O3. The Fe2O3 is first partially reducedto magnetite (Fe3O4) in FR 1 and then completely reduced to wustite(Fe0.947O) in FR 2,12,25 as shown in Figure 1c and d. A cycloneseparator removes the reduced OC particles from the hot gasescoming out of the FR 2. These hot gases are cooled in a HRSG unit tocondense the water vapor and produce a pure stream of CO2, which iscompressed to 150 atm for storage. The sensible heat lost by the hotgases from the CLC fuel reactor is used to generate HP steam and forsteam reheating. In case 5, the reduced OC particles (Fe0.947O) arefully regenerated to Fe2O3 in the air reactor where they are oxidized by
pressurized air, which also helps in circulation of OC in the system.The oxidation of Fe0.947O by air is a highly exothermic process. The airreactor is maintained at 1300 °C by supplying excess air than usuallyrequired for OC regeneration.26 The hot pressurized air exiting the airreactor is separated from the OC particles in a cyclone separator andexpanded in an air turbine. The regenerated OC particles are recycledback to the FR 1. The air turbine exhaust has a high temperature and,therefore, is sent to the HRSG unit for heat recovery before released tothe atmosphere. The steam generated in the whole process (i.e.,gasifier, CLC reactors, HRSG and other heat exchangers) is used todrive the HP, IP, and LP steam turbines. As in cases without CLC, theexhaust steam from the HP and IP steam turbines is reheated in theHRSG unit to 600 °C before expanding through IP and LP steamturbines.
In case 6, the reduced OC from the fuel reactors is partially oxidizedto Fe3O4 in the steam reactor using steam at 30 atm and 350 °Cgenerated in the HRSG unit. This oxidation reaction of the OC is anexothermic process that generates H2, which with some steam and OCparticles comes out from the exhaust of the steam reactor maintainedat 550 °C through HP water/steam cooling. The OC particles areseparated from the steam and H2 in a cyclone separator and sent for
Figure 1. Simplified block flow diagrams of coal gasification-based power plant: (a) IGCC with PSA based CO2 capture technology (cases 1 and 3);(b) IGCC with selexol based CO2 capture (cases 2 and 4); (c) gasification-coupled CLC based CO2 capture producing electricity only (case 5); (d)gasification-coupled CLC based CO2 capture producing combined electricity and H2 (case 6).
Energy & Fuels Article
dx.doi.org/10.1021/ef4024299 | Energy Fuels 2014, 28, 1028−10401032
complete oxidation to Fe2O3 by compressed air (which is again anexothermic reaction) in an air reactor (see Figure 1d). The hot mixtureof H2 and steam after OC separation is cooled in HRSG unit thatcauses the steam to condense, generating a pure stream of pressurizedH2 for further compression to 60 atm and storage. The hot pressurizedair from the air reactor is expanded in an air turbine and then suppliedto the HRSG unit before it is finally released to the atmosphere.Equations 1 to 7 represent the reactions taking place inside thereactors of a CLC process using an iron based OC.Fuel Reactor.
+ → +CO Fe O CO 2Fe O2 3 2 0.947 (1)
+ → +H Fe O H O 2Fe O2 2 3 2 0.947 (2)
Air Reactor. For case 5,
+ →2Fe O12
O Fe O0.947 2 2 3 (3)
For case 6,
+ →2Fe O12
O 3Fe O3 4 2 2 3 (4)
Steam Reactor. (case 6 Only)
+ → +2Fe O H O Fe O H0.947 2 2 3 2 (5)
Net Reaction. For case 5,
+ + → +CO H O CO H O2 2 2 2 (6)
For case 6,
+ + + → + +CO H12
O H O CO H O H2 2 2 2 2 2 (7)
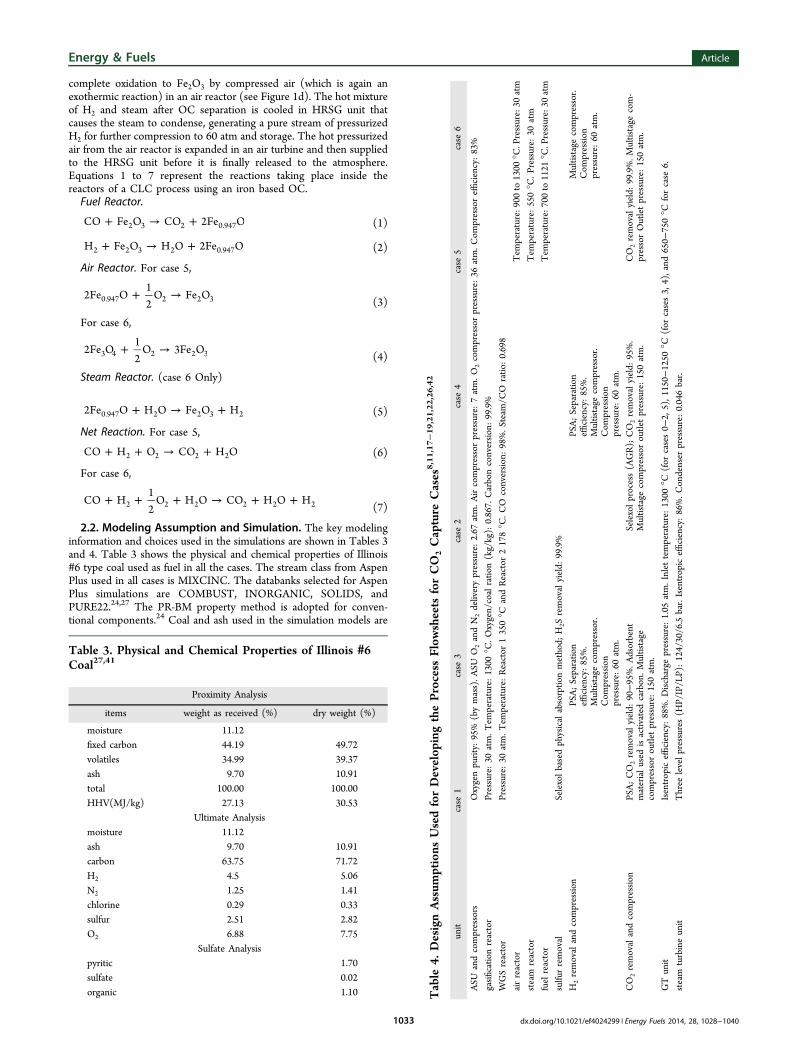
2.2. Modeling Assumption and Simulation. The key modelinginformation and choices used in the simulations are shown in Tables 3and 4. Table 3 shows the physical and chemical properties of Illinois#6 type coal used as fuel in all the cases. The stream class from AspenPlus used in all cases is MIXCINC. The databanks selected for AspenPlus simulations are COMBUST, INORGANIC, SOLIDS, andPURE22.24,27 The PR-BM property method is adopted for conven-tional components.24 Coal and ash used in the simulation models are
Table 3. Physical and Chemical Properties of Illinois #6Coal27,41
Proximity Analysis
items weight as received (%) dry weight (%)
moisture 11.12fixed carbon 44.19 49.72volatiles 34.99 39.37ash 9.70 10.91total 100.00 100.00HHV(MJ/kg) 27.13 30.53
Ultimate Analysismoisture 11.12ash 9.70 10.91carbon 63.75 71.72H2 4.5 5.06N2 1.25 1.41chlorine 0.29 0.33sulfur 2.51 2.82O2 6.88 7.75
Sulfate Analysispyritic 1.70sulfate 0.02organic 1.10 T
able
4.DesignAssum
ptions
UsedforDevelop
ingtheProcess
Flow
sheets
forCO
2Capture
Cases
8,11,17−19,21,22,26,42
unit
case
1case
3case
2case
4case
5case
6
ASU
andcompressors
Oxygenpurity:
95%
(bymass).A
SUO
2andN
2deliverypressure:2.67
atm.A
ircompressorpressure:7atm.O
2compressorpressure:36
atm.C
ompressoreffi
ciency:83%
gasificatio
nreactor
Pressure:30
atm.T
emperature:1300
°C.O
xygen/coalratio
n(kg/kg):0.867.
Carbonconversion:99.9%
WGSreactor
Pressure:30
atm.T
emperature:Reactor
1350°C
andReactor
2178°C
.CO
conversion:98%.S
team
/CO
ratio
:0.698
airreactor
Tem
perature:900
to1300
°C.Pressure:30
atm
steam
reactor
Tem
perature:550°C
.Pressure:
30atm
fuelreactor
Tem
perature:700
to1121
°C.Pressure:30
atm
sulfurremoval
Selexolbasedphysicalabsorptio
nmethod;
H2S
removalyield:
99.9%
H2removalandcompression
PSA;Separatio
neffi
ciency:85%.
Multistage
compressor.
Com
pression
pressure:60
atm.
PSA;Separatio
neffi
ciency:85%.
Multistage
compressor.
Com
pression
pressure:60
atm.
Multistage
compressor.
Com
pression
pressure:60
atm.
CO
2removalandcompression
PSA;CO
2removalyield:
90−95%.A
dsorbent
materialused
isactivated
carbon.M
ultistage
compressoroutletpressure:150atm.
Selexolprocess(AGR);CO
2removalyield:
95%.
Multistage
compressoroutletpressure:150atm.
CO
2removalyield:
99.9%.M
ultistage
com-
pressorOutletpressure:150atm.
GTunit
Isentropiceffi
ciency:88%.D
ischarge
pressure:1.05
atm.Inlet
temperature:1300
°C(for
cases0−
2,5),1
150−
1250
°C(for
cases3,4),and
650−
750°C
forcase
6.
steam
turbineunit
Three
levelpressures(H
P/IP/LP):124/30/6.5
bar.Isentropiceffi
ciency:86%.C
ondenser
pressure:0.046bar.
Energy & Fuels Article
dx.doi.org/10.1021/ef4024299 | Energy Fuels 2014, 28, 1028−10401033

considered as nonconventional components; therefore, informationabout their physical and chemical properties is needed. The propertymethods used for coal and ash are HCOALGEN and DCOALIGT,respectively.28 The OC and support materials are entered as solid inthe component input data in Aspen Plus. The Barin equation is usedto calculate the physical properties of the solid compounds.24 Themodel retrieves the CPSXP (a−h) coefficients from the INORGANICdatabank of Aspen.24
The key conditions and input parameters of each process unit suchas gasifier, ASU, turbines, and reactors are presented in Table 4. In allthe seven processes studied in this work, the raw syngas is produced ina conventional gasification process represented by a RYILEDdecomposer and a RGIBBS gasifier unit. A detailed description ofreactor modeling is given in Section 2.3. Four-stage adiabaticcompressors represented by the MCOMPR model in Aspen Plus,are used for gas compression. These compressors need the dischargepressure from the final stage and isentropic efficiency as the input tothe Aspen Plus model. The Aspen Plus PUMP models with anisentropic efficiency of 90% have been used to simulate pressurizationof the water needed for steam generation. For heat recovery steamgeneration (HRSG), MHeatX type counter current heat exchangersare used.2.3. Reactor Modeling for the CLC Process. This section
describes the reactor models used in the simulations. The built-inAspen Plus reactor models RYIELD and RGIBBS are used to designdifferent reactive processes including (i) gasification, (ii) WGSreaction, (iii) oxidation of fuel in fuel reactor, and (iv) OCregeneration in steam and air reactor.2.3.1. Gasification. A dry feed type entrained flow shell gasifier is
considered in this work due to its dominance in the commercial IGCCplant designs. An RYIELD reactor block is used to decompose thepulverized coal powder into its conventional constituent elements andalso calculates the heat required for it. RYIELD reactors are usedwhere inlets are unknown and the outlets known. The conventionalelements provided after decomposition of coal are fed to the RGIBBSreactor block, which determines the possible products and theircomposition at equilibrium conditions. The RGIBBS reactor is anequilibrium based reactor, which restricts individual equations toequilibrium and does not take account of the reaction kinetics. Thistype of reactor considers all the components as possible products,which is useful when there are many reactions between severalcomponents and the reaction kinetics is unknown. The operatingtemperature, pressure and O2 to coal ratio are the key parametersrequired as input to the RGIBBS reactor.2.3.2. WGS Reactor. A two stage WGS reaction has been
considered in cases 1−4. These reactors are supplied with hot syngasand steam at 30 atm at 350 and 178 °C, respectively. A WGS reactor ismodeled by using a REquil block, which is an equilibrium basedreactor in Aspen Plus. This block is useful when there are few reactionsand the reaction kinetics is unknown. It combines the chemical andphase equilibrium to generate the products of reaction. Thetemperature, pressure, and the chemical reaction equations are thekey parameters required as input to a REquil reactor.2.3.3. CLC Fuel Reactor. The reactants and products of the CLC
fuel reactors are assumed to be well-mixed. Simple RGIBBS reactorblocks of Aspen Plus are used for the simulation of the CLC fueloxidization process under equilibrium conditions. The operatingtemperature, pressure, and molar flow of OC particles and syngas arethe key input parameters required for this model. The temperature andpressure are considered to remain constant. The reactions taking placeinside the fuel reactors are endothermic and require heat, which isprovided by high temperature OC particles (Fe2O3) supplied from theair reactor.2.3.4. CLC Steam and Air Reactor. The steam reactor of a CLC
system uses steam to partially oxidize the reduced OC particles toFe3O4 while generating H2 as a product at thermodynamicequilibrium. The H2 yield of the steam reactor is directly proportionalto the OC conversion. The steam reactor was modeled in Aspen Plusby using a single RGIBBS reactor block. The key operating parametersused for modeling the steam reactor are operating temperature,
pressure and molar flow ratio between steam and OC. The air reactoreffected complete oxidization of the reduced OC particles to Fe2O3and was modeled as an entrained bed reactor with air and OC particlesflowing cocurrently through the vessel. The combustor model,operating at a constant temperature and pressure, was used to predictthe excess heat produced and the possible products. All of thecombustion reactions are assumed to be fully completed in thecombustor and this was sufficiently modeled using a RGIBBS model.The ratio between OC and air supplied and the operating temperatureare the key variables for the air reactor model.
2.4. Plant Performance Indicators. All cases were evaluatedfrom both the energy and exergy point of view. The assessment of theoverall performance of all the processes was performed usingstreamflow data, for example, mass flow of the components, pressure,temperature, power, and energy output provided by the simulation ofeach process configuration. The terms discussed below are used as thekey plant performance indicators.11,12
Gross electrical ef f iciency (ηgross) indicates the overall electricityproduced by the steam and gas turbines used in the process. It doesnot consider the energy consumed by the auxiliary elements needed torun the plant and can be calculated using eq 8.
η = ×Gross power output (MW )
Feed stock LHV (MW )100gross
e
th (8)
Net electrical ef f iciency (ηnet) shows the actual electrical powerproduced by the system. This is calculated by deducting all theauxiliary energy consumed from the gross electricity produced, asshown in eq 9.
η = −
×
{[Gross power output (MW ) Auxiliary energy consumed
(MW )]/[Feed stock LHV (MW )]} 100net e
e th (9)
H2 energy efficiency (ηH2) applies to cases 3, 4, and 6 which produce
both H2 and electricity. The term indicates the efficiency of the systemin producing H2 from the coal feed. The thermal energy of H2 is usedto calculate H2 efficiency, as shown by eq 10.
η = ×Hydrogen thermal energy (MW )
Feed stock thermal energy (MW )100H
th
the2 (10)
Overall energy efficiency (ηOverall) for cases 1, 2, and 5 producingonly electricity is the same as the net electrical efficiency shown by eq9. For the cases 3, 4, and 6, ηOverall is calculated by adding bothelectrical and H2 energy efficiency as shown by eq 11.
η η η= +Overall net H2 (11)
Specific CO2 emission (SECO2) gives the amount of CO2 released to
the atmosphere by the system for per MW of energy generated, whichis equal to the net electrical energy output for cases producing only netelectricity, and electrical plus thermal energy of H2 for cases withcoproduction. SECO2 is calculated by eq 12.
=+
SEemitted CO mass flow (t/h)
net power output (MW ) hydrogen energy (MW )CO2
e th2
(12)
2.4.1. Exergy Analysis. Exergy is the maximum work that can beextracted from a system interacting with a reference environment,which is taken as 1 atm and 25 °C for this study.29 For a processstream, its exergy can be divided into two parts (physical andchemical).
Physical exergy (Exph) equals to the maximum reversible amount ofwork obtainable when a stream of substance is brought from its actualstate to the environmental state. The physical processes involve onlythermal and mechanical interaction with the environment which isdefined by pressure P0 and temperature T0, respectively.
30 Assumingthat potential and kinetic energy can be neglected, the physical exergyis expressed by eq 13:
Energy & Fuels Article
dx.doi.org/10.1021/ef4024299 | Energy Fuels 2014, 28, 1028−10401034

= − − −h h T s sEx ( ) ( )ph 0 0 0 (13)
where h and s are specific molar enthalpy (kJ/kmol) and specific molarentropy (kJ/kmol K), respectively; h0 and S0 are the values of h and sat standard conditions (T0, P0).Chemical exergy (Exch) of a substance is the maximum amount of
work obtainable by bringing it from the environmental state (T0, P0)to a full equilibrium with the chosen environment. The molar chemicalexergy of an ideal mixture is expressed by eq 14 as
∑ ∑= +x RT x xEx Ex lnchi
i ch 0i
i itotal i(14)
where xi and Exchi are molar fraction and molar chemical exergy (kJ/kmol), respectively, of each component in the mixture, and R is theuniversal gas constant.Exergy loss (Exloss) of each individual unit can be calculated by
finding the difference between the exergy of input and output streamsof this unit:
= −Ex Ex Exloss total totalin out (15)
Total exergy (Extotal) of stream is taken as the sum of its physicaland chemical exergy:
= +Ex Ex Extotal ph ch (16)
Chemical exergy of coal (Excoal): In calculation of the total exergy ofcoal, its physical exergy is considered to be zero, because the input coalfeed is in the physical equilibrium with the environment. The chemicalexergy of coal can be estimated using eqs 17 and 18. These equationsare only applicable when the oxygen to carbon ratio in the given coalfeed is less than 0.667.31
φ= + +wh sEx (CV ) 9417ch fg drycoal (17)
CV is the net calorific value of Illinois # 6 type coal in kJ/kg, w isthe percentage of moisture content in the coal, hfg is the latent heat ofwater in kJ/kg at temperature, To, and s denotes the mass fraction ofsulfur in the fuel. The term φdry is be calculated by using the eq 18.
φ = + + +hc
oc
nc
0.1882 0.061 0.0404 1.0437dry (18)
where c, h, o, and n represents the mass fractions of carbon, hydrogen,oxygen, and nitrogen in the coal feed, respectively.H2 exergy efficiency (ηExH2) is taken as the ratio of the total exergy
content in H2 product to the chemical exergy of the coal feed:
η = ×overall exergy in H (MW )
chemical exergy in coal feed (MW )100ExH
2 th
the2 (19)
Exergy efficiency (ηex) of a system is the ratio of total exergy outputto the total exergy given to the system. For the cases considered in thisstudy, the total exergy output is the sum of electrical work output andchemical exergy of H2 stream produced in the process whereas thechemical exergy of the coal feed is taken as the exergy input to thesystem, as shown in eqs 20 and 21:
η = ×Total exergy output of the systemTotal exergy given to the system
100ex (20)
η =+
×+Net electrical energy total H exergy (MW )Total chemical exergy in feed stock (MW )
100ex2 e th
the
(21)
3. RESULTS AND DISCUSSIONS3.1. Comparison of CLC Process with Physical
Absorption and Adsorption Processes for Only Elec-tricity Generation Cases. The net electrical efficiency andCO2 captured shown in Tables 5 and 6 are the two maininvestigated parameters, which are discussed in this section to
compare CLC, PSA, and Selexol based capture technologies.The simulation results of the CLC process that produces onlyelectricity (case 5) give an overall electrical efficiency of 38.7%,which is close to what is observed by a previous study.32 ThePSA (case 1) and Selexol (case 2) based processes showed anoverall electrical efficiency of 37.4 and 36.4%, respectively,which is lower than case 5. The electrical efficiency achieved forcase 5 is also found to be substantially higher as compared withamine-based postcombustion capture technology, which hasefficiency between 26.7 and 35.3%.33 The overall CO2 captureefficiency of the CLC process is 99.9% compared with 89.9%for PSA and 93.5% for Selexol processes. This lower overallcapture efficiency of PSA and Selexol process is mainly due tothe following reasons: (i) the 98% CO conversion efficiency of
Table 5. Plant Performance Indicators for Cases ProducingElectricity Only
plant data units case 0 case 1 case 2 case 5
fuel input energy, LHV(A)
MWth 1126.5 1126.5 1126.5 1126.5
net GT output MWe 319.7 301.2 296.2 259.9
steam turbine output MWe 224.7 223.8 221.8 269.8
gross electric poweroutput (B)
MWe 544.4 525.0 518.0 529.7
ASU consumption + O2compression
MWe 34.1 34.1 34.1 34.1
CO2 capture andcompression
MWe 26.3 29.9 10.2
power cycle pumps MWe 3.0 3.0 3.9 3.52
other MWe 40.5 40.5 40.5 45.0
total ancillary powerconsumption (C)
MWe 77.6 103.9 108.4 92.8
net electric power output(D) (D = B − C)
MWe 466.8 421.1 409.6 436.9
gross electrical efficiency(B/A × 100)
% 48.3 47.3 46.7 47.0
net electrical efficiency(D/A × 100)
% 41.4 37.4 36.4 38.7
overall energy produced(electricity)
MWe 466.8 421.1 409.6 436.9
overall plant energeticefficiency
% 41.4 37.4 36.4 38.7
overall plant exergeticefficiency
% 37.2 33.5 32.6 34.6
CO2 capture efficiency % 89.9 93.5 99.9
exergy in captured CO2stream (% fuelchemical exergy)
% 7.5 7.9 10.2
overall exergyconsidering exergy ofcaptured CO2 stream
% 41.0 40.5 44.4
CO2 emission t/h 278.3 33.6 21.1 0.28
CO2 specific emissions t/MWh 0.597 0.079 0.051 0.0006
CO2 captured t/h 244.7 257.2 278.0
CO2 captured (specific) t/MWh 0.581 0.627 0.63
Table 6. Amount of CO2 Captured Per Unit Energy andEfficiency Penalty for Cases 1, 2, and 5 with Reference to theBase Case
plant data unit case 1 case 2 case 5
CO2 captured per MW decrease in energyproduction than the base case
t/h 5.3 4.5 9.3
net electrical efficiency penalty % 4.0 5.0 2.7relative decrease in net electrical efficiencycompared to the base case
% 9.6 12.0 6.5
CO2 captured per unit decrease in netelectrical efficiency from base case
t/h 61.1 51.4 102.9
Energy & Fuels Article
dx.doi.org/10.1021/ef4024299 | Energy Fuels 2014, 28, 1028−10401035

WGS reactors compared to 99.99% conversion in the CLC fuelreactor and (ii) 90.3% CO2 capture efficiency for the PSA and95.0% for Selexol units, compared to the assumed completecapture by CLC. The unconverted CO from the WGS reactoris oxidized in a combustor after the CO2 removal step in thepresence of air to produce CO2. This CO2 along with theuncaptured CO2 from the CO2 removal unit is expanded in aGT before it is finally vented to the atmosphere with the otherflue gases.8
Figure 2a shows the variation in electricity production andcarbon emissions for all the three different CO2 capture caseswith electricity production only. Compared with the CLCprocess (case 5) that emits 0.0006 t/MWh of CO2 at anemission rate of 0.28 t/h, the PSA (case 1) and Selexol (case 2)technologies emit 0.079 and 0.051 t/MWh of CO2 at anemission rate of 33.6 and 21.1 t/h, respectively. Figure 2bshows a comparison between cases 0, 1, 2, and 5 for grosspower output, power consumption, and net power produced.CLC process (case 5) produces less power from the GT unit,but it generates more power from the steam turbines, whichresults in more net electricity production (436.9 MW)compared with case 1 (421.1 MW) and case 2 (409.6 MW).3.2. Comparison of CO2 Capture Cases (Cases 1, 2,
and 5) Producing Only Electricity with the Base Case(Case 0). Table 5 shows the results of case 0, which is taken asa base case that produces only electricity without any CO2capture. In case 0, the syngas stream from the WGS reactors issupplied to the combustor unit eliminating the CO2 scrubbingstep. The unconverted CO, and H2 from the WGS reactor unitare oxidized in the combustor in the presence of air. Theproduct stream from the combustor is expanded through theGT and sent to HRSG before it is finally vented to theatmosphere. The base case has a higher net electrical efficiencyof 41.4% compared to the other cases (cases 1, 2, and 5), whichproduce only electricity with CO2 capture. Figure 3 shows thatcase 2 using the Selexol process suffers the highest net energypenalty of 57.2 MW versus case 0 compared to 29.9 MW forCLC and 45.7 MW for PSA-based processes. The results fromTable 6 indicate that per MW decrease in energy productioncompared to the base case, the CLC process capturessignificantly higher CO2 (9.3 t/h) compared to PSA (5.3t/h)and Selexol (4.5 t/h) process. The relative decrease in the netelectrical efficiency in comparison to base case (case 0) forprecombustion based capture processes (case 1 and 2) is lowerthan the energy penalty of 20−29% for the amine basedpostcombustion capture methods described in a report of theIEA.33
3.3. Energy Consumption in CO2 Compression forCases 1, 2, and 5. Table 7 shows the energy consumption inCO2 compression work for PSA, Selexol and CLC processes. Itcan be seen that the CLC process (case 5) requires only 10.2MW for compressing 278 t/h of CO2 whereas the IGCC withPSA (case1) and IGCC with Selexol (case 2) processes require26.3 MW and 29.9 MW, respectively, even though theycompress less CO2 compared to the CLC. This is due to thefact that the CO2 stream available for compression in this CLCprocess is already at elevated pressure levels of approximately30 atm, and therefore, less energy is required for compressingCO2 to 150 atm. On the other hand, the CO2 streams availablefor compression in the cases of the PSA and Selexol processesare very close to atmospheric pressure, which explains thehigher compression energy requirement for these twotechnologies. Further analysis can be made to consider theCO2 stream being produced from the system at a pressure of 1atm. For cases 1 and 2, this would mean that the CO2compression step is eliminated. In case 5, this analysis assumesthat the pressurized (30 atm) CO2 stream from the fuel reactoris expanded in an expander, which will produce an extra 5.11MW of power. As shown in Table 7, the CLC process will stillbe more energy efficient than the Selexol and PSA processesand attain a net electrical efficiency of 40.0%. Some considerthat this analysis could be useful if the CO2 captured from thepower plant were to be used in other industries, instead ofsequestration. For example, the food and chemical sectors mayhave no need for compressed CO2. However, very fewprocesses other than enhanced oil recovery (EOR) and
Figure 2. (a) Relation between electricity production and CO2 emissions for cases 0, 1, 2, and 5 and (b) relation between power production, powerconsumption and net power output for cases 0, 1, 2, and 5.
Figure 3. Energy and efficiency penalty in cases 1, 2, and 5 withreference to the case 0.
Energy & Fuels Article
dx.doi.org/10.1021/ef4024299 | Energy Fuels 2014, 28, 1028−10401036

potentially the production of urea are likely to be able to utilizea significant fraction of the CO2 produced by a gasifierproducing 467 MWe.3.4. Comparison of CO2 Capture Technologies for
Combined Electricity and H2 Production Cases. One ofthe main objectives of this work was to investigate thesuitability of the gasification-coupled CLC process (case 6)compared to IGCC with PSA (case 3) and Selexol (case 4)technologies for combined electricity and H2 generating plants.Table 8 summaries the results of these cases for identical H2
production rates (524 MW) from each process. Case 6 withCLC yields an overall energy efficiency (59.4%), which ismarginally higher than case 4 Selexol (59.1%). Case 6 has a
lower overall efficiency compared to the case 3 PSA (60.0%)process owing to two main reasons: (i) lower GT inlettemperature of 727 °C compared to 1185 °C for case 3 and (ii)higher power consumption by the air compressor in air reactor.Figure 4 shows the trade-off between the electrical, H2 and
overall efficiencies for case 6. The overall efficiency increases
with the H2 production rate whereas the electrical efficiencyshows an opposite trend. The decrease in electrical power is theresult of less H2 being available for combustion in the GTcombustor unit. The H2 produced in the steam reactor of theCLC system can be used for electricity generation duringperiods of high electricity demand by simply burning it in aseparate combustor and expanding through the GT along withthe hot air reactor exhaust. This can provide flexibility to theCLC system with respect to changing loads.
3.5. Exergy Analysis of PSA, Selexol, and CLCTechnologies. Tables 5 and 8 show the results of exergyanalysis for all the seven cases. The study indicates an overallexergetic efficiency of 53.6% for case 3 with the PSA processproducing combined electricity and H2, which is the highestamong all the seven cases analyzed here. The other two casesfor electricity and H2 production using Selexol (case 4) andCLC (case 6) process have exergetic efficiencies of 52.7 and53.0%, respectively. The exergetic efficiency of CLC process ishigher compared to Selexol and PSA processes in cases withelectricity production only. It is also seen that the captured CO2stream contains 7.5−10.2% of the total chemical exergy of thecoal used as the fuel to the system. If this exergy of the capturedCO2 stream is considered to recognize the effort dedicated toCO2 capture, it would make the CLC process moreexergetically efficient among the cases with combined H2 andelectricity production.
3.6. Effect of Using N2 Available from ASU in GT onPower Output. All the configurations with CO2 capture,represented by cases 1−6, assumed that N2 from the ASU isadded to the feed to the GT unit to enhance its power output.The N2 stream produced in the ASU is compressed (22 atm for
Table 7. Comparison of CO2 Compression Work for Cases 1, 2, and 5
caseno.
electricalefficiency (%)
CO2captured(%)
CO2 compressionwork (MW)
CO2 captured(t/h)
compression work per tonne of CO2captured (MWh/t)
electrical efficiency with CO2produced at 1 atm (%)
0 41.4 0 0 0 0 41.41 37.4 89.9 26.3 244.7 0.107 39.72 36.4 93.5 29.9 257.2 0.116 39.05 38.7 99.9 10.2 278.02 0.036 40.0
Table 8. Plant Performance Indicators for Cases withCombined Electricity and H2 Production
plant data units case 3 case 4 case 6
fuel input energy, LHV (A) MWth 1126.5 1126.5 1126.5H2 produced (LHV) MWe 524.0 524.0 524.0net GT output MWe 136.2 130.9 61.5steam turbine output MWe 135.6 133.3 177.9gross electric power output(B)
MWe 271.8 264.2 239.5
ASU consumption + O2compression
MWe 34.1 34.1 34.1
CO2 capture andcompression
MWe 26.3 29.9 10.2
H2 compression MWe 4.1 4.6 4.4other MWe 55.1 53.8 45.07total ancillary powerconsumption (C)
MWe 119.6 122.4 93.7
net electricity produced MWe 152.2 141.8 145.8net electrical efficiency % 13.5 12.6 12.9H2 efficiency % 46.5overall energy produced(H2 + electricity)
MWe 676.2 665.8 669.8
overall plant energeticefficiency
% 60.0 59.1 59.4
overall plant exergeticefficiency
% 53.6 52.7 53.0
CO2 capture efficiency % 89.9 93.5 99.9exergy in captured CO2stream (% fuel chemicalexergy)
% 7.5 7.9 10.2
overall exergy consideringexergy of captured CO2stream
% 61.1 60.6 63.2
CO2 emission t/h 33.6 21.1 0.28CO2 specific emissions t/MWh(e) 0.220 0.148 0.002CO2 specific emissions(total)
t/MWh(e+th) 0.049 0.031 0.0004
CO2 captured t/h 244.7 257.2 278.0CO2 captured (specific)-electric
t/MWh(e) 1.60 1.81 1.90
CO2 captured (specific)-thermal
t/MWh(e+th) 0.36 0.38 0.41
Figure 4. Variation of electrical, H2, and overall efficiency versus theH2 output for case 6.
Energy & Fuels Article
dx.doi.org/10.1021/ef4024299 | Energy Fuels 2014, 28, 1028−10401037

the cases without CLC process and 32 atm for CLC) andsupplied to the combustors (in cases without CLC) and to theair reactors (in cases with CLC) eventually for expansionthrough the GT/air turbine. Figure 5 shows that all the
processes benefit, in terms of their power output, from theintegration of ASU with the GT unit. The gasification-coupledCLC process (cases 5 and 6) is least effected by ASUintegration. In contrast, case 1 experiences 4.7% increase in thenet electrical efficiency which is the highest among all six cases.The results show that integrating N2 stream with the GT cyclecan improve the overall electrical efficiency of the processdespite the extra work required for N2 compression.Potentially, further integration can be done to use the air
from the more efficient compressor of the GT power cycle tosupply compressed air to the ASU. This type of integration cancompletely eliminate the low efficiency ASU compressors.34 AGT compressor can supply HP air to the ASU. The mainlimitation of such integration is that the ASU cannot startunless the GT starts running. This problem can be resolved byusing a separate air compressor for the ASU to start up theprocess.3.7. Effect of Air Reactor Temperature on the Power
Output of the CLC-Based Process. With the model ofgasification-coupled CLC (case 5), the effect of change in airreactor temperature on the net electric power produced hasbeen analyzed. Figure 6a shows that the net power production
increases with the air reactor temperature. The power isproduced in the GT unit, which is supplied with hot exhaustfrom the air reactor, and in the steam turbine unit. Steam isgenerated by the HRSG unit which recovers heat from the hotexhaust of the fuel reactor and that of the gas turbine. The airreactor regulates its temperature via the amount of excess airsupplied to the reactor beyond what is required by completecombustion. Figure 6a shows that as the temperature of the airreactor increases, both the power from the stream turbine unitand that from the GT unit increase.The exhaust gases from the air reactor are expanded through
the GT, which gives a higher yield when operated at a highertemperature range. This provides the explanation behind theincrease in GT power output with air reactor temperature.When the air reactor is maintained at higher temperature, thetemperature of OC supplied to the fuel reactor from the airreactor is also high and hence is higher the fuel reactortemperature. This means a high temperature fuel reactorexhaust is available in the HRSG for steam generation,explaining the reason behind the gain in steam turbine poweroutput with increase in air reactor temperature.
3.8. Effect of Water-Cooling of the CLC Air Reactor onthe Power Output. The CLC system (case 5) was examinedfor the effects of using water-cooling of the air reactor insteadof excess air supply as an alternative to maintain the requiredtemperature of 1300 °C throughout the study. The HP waterafter absorbing heat from the air reactor is converted into HPsteam, which is used for power generation. It has been foundfrom the sensitivity analysis that an excess air supply of 81.14%can maintain the desired air reactor temperature withoutrequiring any cooling by water. Figure 6b indicates that the useof water-cooling results in decrease in the feed to the GT, gross,and net power output of the system, whereas the steam turbineoutput power increase due to more steam available for thesteam turbines. Completely using water/steam cooling for theair reactor can decrease the net power output by ∼5.7%.However, this can help in reducing the size of the air reactor,compressor, gas−solid separator, and GT, and hence, thecapital cost of the plant.
4. SUMMARY AND CONCLUSIONS
This article investigates the performance characteristics of sevendifferent types of gasification based coal power plants with andwithout the CO2 capture using PSA, Selexol and CLCprocesses. Cases 0, 1, 2, and 5 produced only electricity while
Figure 5. Effect of ASU integration on power output for cases 1−6.
Figure 6. Effect of (a) air reactor temperature and (b) water-cooling of the air reactor on the power output for CLC process.
Energy & Fuels Article
dx.doi.org/10.1021/ef4024299 | Energy Fuels 2014, 28, 1028−10401038

cases 3, 4, and 6 produced combined electricity and H2. Allseven process flowsheet models were developed using achemical process simulation tool “Aspen Plus”. The resultsgenerated from the flowsheet simulation models werecompared based on the electrical efficiency, H2 production,and CO2 emissions. The effect of ASU and GT integration onthe performance of all CO2 capture cases was estimated.Sensitivity analysis was performed for the CLC process to studythe plant behavior with respect to air reactor temperature andwater cooling of the air reactor.Among the systems producing only electricity with CO2
capture, the CLC based process achieves the highest electricalefficiency (38.7%) compared with PSA (37.4%) and Selexol(36.4%) based processes. In electricity and H2 cogenerationcases, the CLC-based process has marginally lower (by 0.6%)and higher (by 0.3%) net electrical efficiencies than the PSAand Selexol based process, respectively. However, CLC processcan capture 99.9% of CO2 produced, which is potentially higherin comparison to 89.9% for PSA and 93.5% for Selexol basedprocesses. Further comparison among the three captureprocesses could also be made, based on the cost and lifecycle analysis in order to assess the combined techno-economicviability, but such a comparison is beyond the scope of ourpresent study. The ASU and GT integration results in higherpower output for all the cases; however, the cases with CLCprocess have the least effect. The sensitivity analyses performedon CLC process shows that it is favorable to operate the airreactor at higher temperatures for more net power output. Alsoit has been concluded that cooling of air reactor (whilemaintaining 1300 °C) by using excess air supply instead ofpressurized water tends to increase the net power output of theCLC system.In addition to the factors considered in the current work, a
number of potential improvements will be studied in futureinvestigations. These include extracting and utilizing the heatreleased by the intercooled compressors, and replacing thecryogenic ASU with membrane-based technology, which canpossibly be more efficient when integrated with the GT unit. Adetailed sensitivity analysis of the three capture technologies atall different possible operating conditions will be considered infuture work to further study and understand the plant behaviorin order to assist the optimization of power plants. The CLCprocess has comparatively more scope of efficiency improve-ment in future by directly using the solid coal fuel into the fuelreactor, eliminating a separate gasification and ASU, which areresponsible for high exergy losses in the system.
■ ASSOCIATED CONTENT*S Supporting InformationDetailed process flow diagram of case 1; This information isavailable free of charge via the Internet at http://pubs.acs.org/.
■ AUTHOR INFORMATIONCorresponding Author*Tel.: +44 1483 682762. Fax: +44 1483 682135. E-mail: [email protected], [email protected] authors declare no competing financial interest.
■ ACKNOWLEDGMENTSThis work is carried out as a part of U.K.−China EPSRC grant(EP/I010912/1), titled as “Multi-scale evaluation of advanced
technologies for capturing the CO2: Chemical looping appliedto solid fuels”. The authors also thank the Department of Civiland Environmental Engineering at the University of Surrey foradditional funding support.
■ REFERENCES(1) Holloway, S.; Pearce, J. M.; Hards, V. L.; Ohsumi, T.; Gale, J.Natural emissions of CO2 from the geosphere and their bearing on thegeological storage of carbon dioxide. Energy 2007, 32 (7), 1194−1201.(2) Taseska, V.; Markovska, N.; Causevski, A.; Bosevski, T.; Pop-Jordanov, J. Greenhouse gases (GHG) emissions reduction in a powersystem predominantly based on lignite. Energy 2011, 36 (4), 2266−2270.(3) International Energy Outlook; Energy Information Administration(EIA): Washington DC, 2008. http://www.eia.gov/forecasts/ieo/more_highlights.cfm (accessed Feb. 12, 2013)(4) Cayan, D. R.; Maurer, E. P.; Dettinger, M. D.; Tyree, M.;Hayhoe, K. Climate Change Scenarios for the California Region; SpringerScience: New York, 2008.(5) Longwell, J. P.; Rubin, E. S.; Wilson, J. Coal: Energy for thefuture. Prog. Energy Combust. Sci. 1995, 21 (4), 269−360.(6) Minchener, A. J.; McMullan, J. T. Sustainable clean coal powergeneration within a European contextThe view in 2006. Fuel 2007,86 (14), 2124−2133.(7) Boot-Handford, M. E.; Abanades, J. C.; Anthony, E. J.; Blunt, M.J.; Brandani, S.; Mac Dowell, N.; Fernandez, J. R.; Ferrari, M.-C.;Gross, R.; Hallett, J. P.; Haszeldine, R. S.; Heptonstall, P.; Lyngfelt, A.;Makuch, Z.; Mangano, E.; Porter, R. T. J.; Pourkashanian, M.;Rochelle, G. T.; Shah, N.; Yao, J. G.; Fennell, P. S. Carbon capture andstorage update. Energy Environ. Sci. 2014, 7, 130−189.(8) Chiesa, P.; Consonni, S.; Kreutz, T.; Robert, W. Co-productionof hydrogen, electricity and CO2 from coal with commercially readytechnology. Part A: Performance and emissions. Int. J. Hydrogen Energy2005, 30 (7), 747−767.(9) Damen, K.; Troost, M. v.; Faaij, A.; Turkenburg, W. Acomparison of electricity and hydrogen production systems withCO2 capture and storage. Part A: Review and selection of promisingconversion and capture technologies. Prog. Energy Combust. Sci. 2006,32 (2), 215−246.(10) Cormos, C.-C. Assessment of hydrogen and electricity co-production schemes based on gasification process with carbon captureand storage. Int. J. Hydrogen Energy 2009, 34 (15), 6065−6077.(11) Cormos, C.-C. Evaluation of energy integration aspects forIGCC-based hydrogen and electricity co-production with carboncapture and storage. Int. J. Hydrogen Energy 2010, 35 (14), 7485−7497.(12) Cormos, C.-C. Evaluation of syngas-based chemical loopingapplications for hydrogen and power co-generation with CCS. Int. J.Hydrogen Energy 2012, 37 (18), 13371−13386.(13) Li, F.; Fan, L.-S. Clean coal conversion processesProgress andchallenges. Energy Environ. Sci. 2008, 1 (2), 248−267.(14) Kunze, C.; Riedl, K.; Spliethoff, H. Structured exergy analysis ofan integrated gasification combined cycle (IGCC) plant with carboncapture. Energy 2011, 36 (3), 1480−1487.(15) Wang, H.; Xu, Li.; Kim, H. Exergy Analysis of CO2 Capture fromSyngas at Pre-combustion in IGCC Power Plant; Ajou University: Korea,2007; Vol. 11, pp 109−112.(16) Anheden, M.; Svedberg, G. Exergy analysis of chemical-loopingcombustion systems. Energy Convers. Manage. 1998, 39 (16−18),1967−1980.(17) Brunetti, A.; Drioli, E.; Barbieri, G. Medium/high temperaturewater gas shift reaction in a Pd-Ag membrane reactor: An experimentalinvestigation. RSC Adv. 2012, 2 (1), 226−233.(18) Li, Y.; Fu, Q.; Flytzani-Stephanopoulos, M. Low-temperaturewater−gas shift reaction over Cu- and Ni-loaded cerium oxidecatalysts. Appl. Catal. B: Environ. 2000, 27 (3), 179−191.(19) Bracht, M.; Alderliesten, P. T.; Kloster, R.; Pruschek, R.; Haupt,G.; Xue, E.; Ross, J. R. H.; Koukou, M. K.; Papayannakos, N. Water−
Energy & Fuels Article
dx.doi.org/10.1021/ef4024299 | Energy Fuels 2014, 28, 1028−10401039

gas shift membrane reactor for CO2 control in IGCC systems:Techno-economic feasibility study. Energy Convers. Manage. 1997, 38(Supplement,(0)), S159−S164.(20) Kohl, A. L.; Nielsen, R. B. Chapter 8 Sulfur Recovery Processes.In Gas Purification (Fifth ed.); Gulf Professional Publishing: Houston,1997; pp 670−730.(21) Casas, N.; Schell, J.; Joss, L.; Mazzotti, M. A parametric study ofa PSA process for pre-combustion CO2 capture. Sep. Purif. Technol.2013, 104 (0), 183−192.(22) Schell, J.; Casas, N.; Marx, D.; Mazzotti, M. Precombustion CO2
capture by pressure swing adsorption (PSA): Comparison oflaboratory PSA experiments and simulations. Ind. Eng. Chem. Res.2013, 52 (24), 8311−8322.(23) Fan, L.-S.; Zeng, L.; Wang, W.; Luo, S. Chemical loopingprocesses for CO2 capture and carbonaceous fuel conversionProspect and opportunity. Energy Environ. Sci. 2012, 5 (6), 7254−7280.(24) Li, F.; Zeng, L.; Velazquez-Vargas, L. G.; Yoscovits, Z.; Fan, L.-S.Syngas chemical looping gasification process: Bench-scale studies andreactor simulations. AIChE J. 2010, 56 (8), 2186−2199.(25) Cleeton, J. P. E.; Bohn, C. D.; Muller, C. R.; Dennis, J. S.; Scott,S. A. Clean hydrogen production and electricity from coal via chemicallooping: Identifying a suitable operating regime. Int. J. Hydrogen Energy2009, 34 (1), 1−12.(26) Erlach, B.; Schmidt, M.; Tsatsaronis, G. Comparison of carboncapture IGCC with pre-combustion decarbonisation and withchemical-looping combustion. Energy 2011, 36 (6), 3804−3815.(27) Zeng, L.; He, F.; Li, F.; Fan, L.-S. Coal-direct chemical loopinggasification for hydrogen production: Reactor modeling and processsimulation. Energy Fuels 2012, 26 (6), 3680−3690.(28) Aspen Plus IGCC Model; 2008.(29) Dincer, I.; Rosen, A. Exergy: Energy, Environment, andSustainable Development; Elsvier: Oxford, U.K., 2007.(30) Szargut, J.; Morris, D. R.; Stewart, F. R. Exergy Analysis ofThermal, Chemical, and Metallurgical Processes; Springer-Verlag GmbH& Co. K: Berlin and Heidelberg, 1988.(31) El-Emam, R. S.; Dincer, I.; Naterer, G. F. Energy and exergyanalyses of an integrated SOFC and coal gasification system. Int. J.Hydrogen Energy 2012, 37 (2), 1689−1697.(32) Cormos, C.-C. Evaluation of iron based chemical looping forhydrogen and electricity co-production by gasification process withcarbon capture and storage. Int. J. Hydrogen Energy 2010, 35 (6),2278−2289.(33) IEA Report: Cost and Performance of Carbon Dioxide Capturefrom Power Generation; International Energy Agency (IEA): Paris,2011. (accessed July 22, 2013)(34) Liszka, M.; Tuka, J. Parametric study of GT and ASUintegration in case of IGCC with CO2 removal. Energy 2012, 45 (1),151−159.(35) Wheeler, F. Decarbonization of Fossil Fuels; IEA: Paris, 1996.(accessed July 30, 2013)(36) Doctor, M. J.; Chess, K. L,; Brockmeier, N. F. HydrogenProduction and CO2 Recovery, Transport and Use from a KRW Oxygen-Blown Gasification Combined-Cycle System; Argonne National Labo-ratory: Argonne, 1999.(37) Klett, M. G.; White, J. S.; Schoff, R. L.; Buchanan, T. L. Plantperformance and cost comparisons. In Hydrogen Production Facilities;National Energy Technology Laboratory: Reading, PA, 2002.(38) Parsons, E. L. Advanced Fossil Power Systems Comparison Study;National Energy Technology Laboratory: Pittsburgh, PA, 2002.(39) Chiesa, P.; Lozza, G.; Malandrino, A.; Romano, M.; Piccolo, V.Three-reactors chemical looping process for hydrogen production. Int.J. Hydrogen Energy 2008, 33 (9), 2233−2245.(40) Rezvani, S.; Huang, Y.; McIlveen-Wright, D.; Hewitt, N.;Mondol, J. D. Comparative assessment of coal fired IGCC systemswith CO2 capture using physical absorption, membrane reactors, andchemical looping. Fuel 2009, 88 (12), 2463−2472.(41) Fan, L. S. Chemical Looping Systems for Fossil Energy Conversions;John Wiley and Sons, Inc.: Hoboken, NJ, 2010.
(42) Liu, Y.; Li, Z.-s.; Xu, L.; Cai, N. Effect of sorbent type on thesorption enhanced water−gas shift process in a fluidized bed reactor.Ind. Eng. Chem. Res. 2012, 51 (37), 11989−11997.(43) Fan, L. S.; Li, F. Chemical looping technology and its fossilenergy conversion applications. Ind. Eng. Chem. Res. 2010, 49, 10200−10211.
Energy & Fuels Article
dx.doi.org/10.1021/ef4024299 | Energy Fuels 2014, 28, 1028−10401040