Comparative assessment for low-noise pavements by …€¦ · Comparative assessment for low-noise...
9
Inter-noise 2014 Page 1 of 9 Comparative assessment for low-noise pavements by means of the ISO 11819 and the OBSI Marc BURET 1 ; James MCINTOSH 2 ; Cassandra SIMPSON 3 ; VicRoads, Australia ABSTRACT In 2013, VicRoads initiated an acoustic test program for low-noise road surfaces. The program aims to assess the acoustic performance and maintenance requirements for different types of pavement surfaces over a period of at least five years. Seven different products were laid on a single section of roadway on the Mornington Peninsula Freeway in Victoria, Australia. Acoustic tests have then been carried out at regular intervals following three different methods: Statistical Pass-By (ISO 11819-1), Close Proximity Method (ISO/DIS 11819-2) and On-Board Sound Intensity method (AASHTO TP 76-10). Results from these tests are presented here. The measured performance of the different pavement is discussed and an insight is given into the comparison of the different test methods. Keywords: Road Traffic Noise I-INCE Classification of Subjects Number(s): 52.3 1. INTRODUCTION In March 2013, VicRoads commenced a five year investigation into the road traffic noise reduction performance of selected asphalt road pavement surfacing. The trial is being conducted on an urban freeway, the Mornington Peninsula Freeway, near Melbourne, Victoria, Australia. Seven sections of different asphalt were placed, including a conventional Open Graded Asphalt (OGA), an OGA where the surface was treated using diamond grinding to provide a smoother surface whilst maintaining porosity, two sections of double layer OGA, a stone mastic asphalt (SMA) and two proprietary mixes. Road traffic noise generated on each trial section is being determined by the Statistical Pass-by Method, by the Close Proximity Method and by the On Board Sound Intensity Method. The acoustic performances of the trial pavement surfaces will be determined by these methods over a five year period. The objectives of the trial are to quantify the opportunity to reduce traffic noise by selection of pavement, update the noise corrections for low noise pavements in traffic noise modeling, and investigate the optimization of the conventional open graded asphalt pavement used by VicRoads. This paper presents the results of the acoustic tests conducted within the first year of the trial. 2. TRIAL LAYOUT The trial sections are located on the southbound carriageway of the Mornington Peninsula Freeway between La Trobe Parade and Lonsdale Street, in McCrae, Victoria, an area chosen for the close proximity of houses next to the urban freeway and the absence of noise mitigation devices. The freeway is a four lane divided freeway with substantial median, emergency shoulder lanes, roadside open drainage, grade separated intersections and a 100 km/h speed limit. Seven sections were resurfaced with the trial pavements listed in Table 1. Details of the preexisting site conditions and the resurfacing conducted for the trial are given in Simpson (1). Sections 6 and 7 were resurfaced at the end of March 2013. The pavements of Sections 1 to 5 were installed one month later. 1 [email protected] 2 [email protected] 3 [email protected]
Transcript of Comparative assessment for low-noise pavements by …€¦ · Comparative assessment for low-noise...
Inter-noise 2014 Page 1 of 9
Comparative assessment for low-noise pavements by means of the
ISO 11819 and the OBSI
Marc BURET1; James MCINTOSH
2; Cassandra SIMPSON
3;
VicRoads, Australia
ABSTRACT
In 2013, VicRoads initiated an acoustic test program for low-noise road surfaces. The program aims to assess
the acoustic performance and maintenance requirements for different types of pavement surfaces over a
period of at least five years. Seven different products were laid on a single section of roadway on the
Mornington Peninsula Freeway in Victoria, Australia. Acoustic tests have then been carried out at regular
intervals following three different methods: Statistical Pass-By (ISO 11819-1), Close Proximity Method
(ISO/DIS 11819-2) and On-Board Sound Intensity method (AASHTO TP 76-10). Results from these tests are
presented here. The measured performance of the different pavement is discussed and an insight is given into
the comparison of the different test methods.
Keywords: Road Traffic Noise I-INCE Classification of Subjects Number(s): 52.3
1. INTRODUCTION
In March 2013, VicRoads commenced a five year investigation into the road traffic noise reduction
performance of selected asphalt road pavement surfacing. The trial is being conducted on an urban
freeway, the Mornington Peninsula Freeway, near Melbourne, Victoria, Australia. Seven sections of
different asphalt were placed, including a conventional Open Graded Asphalt (OGA), an OGA where
the surface was treated using diamond grinding to provide a smoother surface whilst maintaining
porosity, two sections of double layer OGA, a stone mastic asphalt (SMA) and two proprietary mixes.
Road traffic noise generated on each trial section is being determined by the Statistical Pass-by
Method, by the Close Proximity Method and by the On Board Sound Intensity Method. The acoustic
performances of the trial pavement surfaces will be determined by these methods over a five year
period.
The objectives of the trial are to quantify the opportunity to reduce traffic noise by selection of
pavement, update the noise corrections for low noise pavements in traffic noise modeling, and
investigate the optimization of the conventional open graded asphalt pavement used by VicRoads. This
paper presents the results of the acoustic tests conducted within the first year of the trial.
2. TRIAL LAYOUT
The trial sections are located on the southbound carriageway of the Mornington Peninsula Freeway
between La Trobe Parade and Lonsdale Street, in McCrae, Victoria, an area chosen for the close
proximity of houses next to the urban freeway and the absence of noise mitigation devices. The
freeway is a four lane divided freeway with substantial median, emergency shoulder lanes, roadside
open drainage, grade separated intersections and a 100 km/h speed limit. Seven sections were
resurfaced with the trial pavements listed in Table 1. Details of the preexisting site conditions and the
resurfacing conducted for the trial are given in Simpson (1). Sections 6 and 7 were resurfaced at the
end of March 2013. The pavements of Sections 1 to 5 were installed one month later.
Page 2 of 9 Inter-noise 2014
Page 2 of 9 Inter-noise 2014
Table 1 – Trial Pavements
Section Type of asphalt Depth, mm Section length, m
1 Standard OGA Size 10mm 30 200
2 Size 10mm OGA, treated by “shaving” 30 100
3 Double layer OGA Size 10mm and 14mm 30 + 40 (resp.) 150
4 OGA Size 10mm (laid in two layers) 2 × 35 150
5 Standard SMA Size 10mm 35 150
6 Boral Noise Reducing Trial Mix2 35 150
7 Boral Durapave Asphalt 35 150
0
10
20
30
40
50
60
70
80
90
100
0.075 0.15 0.3 0.6 1.18 2.36 4.75 6.7 9.5 13.2 19
Gra
idn
g a
im %
(b
y m
ass
)
Sieve size (mm)
Size 10mm OGA
Size 10mm SMA
Size 14mm OGA
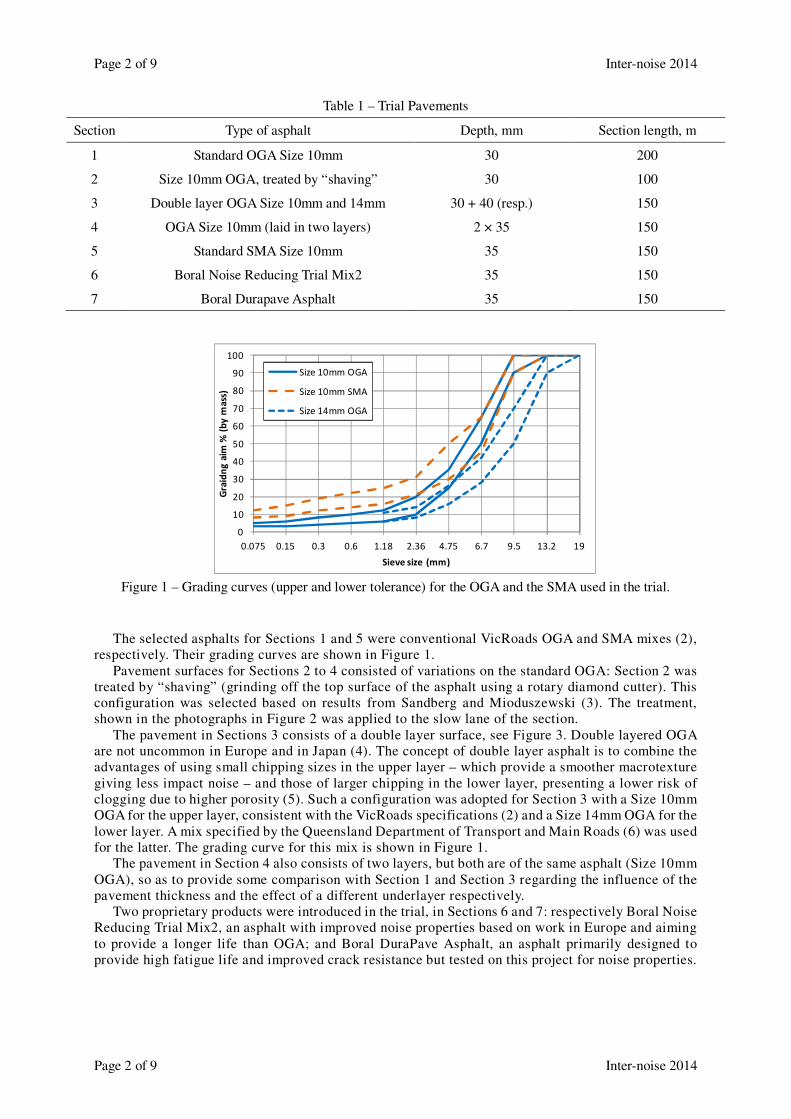
Figure 1 – Grading curves (upper and lower tolerance) for the OGA and the SMA used in the trial.
The selected asphalts for Sections 1 and 5 were conventional VicRoads OGA and SMA mixes (2),
respectively. Their grading curves are shown in Figure 1.
Pavement surfaces for Sections 2 to 4 consisted of variations on the standard OGA: Section 2 was
treated by “shaving” (grinding off the top surface of the asphalt using a rotary diamond cutter). This
configuration was selected based on results from Sandberg and Mioduszewski (3). The treatment,
shown in the photographs in Figure 2 was applied to the slow lane of the section.
The pavement in Sections 3 consists of a double layer surface, see Figure 3. Double layered OGA
are not uncommon in Europe and in Japan (4). The concept of double layer asphalt is to combine the
advantages of using small chipping sizes in the upper layer – which provide a smoother macrotexture
giving less impact noise – and those of larger chipping in the lower layer, presenting a lower risk of
clogging due to higher porosity (5). Such a configuration was adopted for Section 3 with a Size 10mm
OGA for the upper layer, consistent with the VicRoads specifications (2) and a Size 14mm OGA for the
lower layer. A mix specified by the Queensland Department of Transport and Main Roads (6) was used
for the latter. The grading curve for this mix is shown in Figure 1.
The pavement in Section 4 also consists of two layers, but both are of the same asphalt (Size 10mm
OGA), so as to provide some comparison with Section 1 and Section 3 regarding the influence of the
pavement thickness and the effect of a different underlayer respectively.
Two proprietary products were introduced in the trial, in Sections 6 and 7: respectively Boral Noise
Reducing Trial Mix2, an asphalt with improved noise properties based on work in Europe and aiming
to provide a longer life than OGA; and Boral DuraPave Asphalt, an asphalt primarily designed to
provide high fatigue life and improved crack resistance but tested on this project for noise properties.

Inter-noise 2014 Page 3 of 9
Inter-noise 2014 Page 3 of 9
Figure 2 –OGA Treated by shaving on Section 2.
Figure 3 –Section 3 double layer OGA. (L.H.S.: the upper layer extends partly onto the emergency)
2.1 Non acoustical testing
Surface texture depths for the seven sections were measured using a multi-laser profilometer
immediately after the pavements were laid (1). Average values measured in the slow lane are shown in
Figure 4. Air void testing was conducted for the untreated OGA using the mensuration method of
Australian Standard AS 2891.9.3 (7,8) on core samples taken in the left wheelpath and the centre of the
lanes after one week of trafficking. Results are presented in Table 2. Lower ratios for the wheelpaths
are likely to result from some initial compaction of the pavements due to traffic.
Figure 4 – Average surface texture depth Table 2 – Air voids for OGA
Section Layer
Average Air Voids
(3 samples)
Left
Wheelpath
Centre of
Lane
1 Single 15.1% 16.3%
3 Upper 15.0% 16.1%
Lower 16.7% 19.8%
4 Upper &
Lower 16.6% 17.9%
Untreated OGA
Treated OGA
Treated OGA Untreated OGA
130mm

Page 4 of 9 Inter-noise 2014
Page 4 of 9 Inter-noise 2014
3. ACOUSTIC TESTING
3.1 Test methodologies and results
VicRoads commissioned acoustic tests by means of three different methods, the Statistical Pass-By
method (SPB), the Close Proximity Method (CPX) and the On-Board Sound Intensity method (OBSI).
The schedule for the tests and the results, presented in terms of overall A-weighted results are
presented in Table 3 and 4 respectively.
The first method consisted of roadside noise measurements, correlated to speed observations,
following generally the provisions of ISO 11819-1 (9), except for a speed correction in the form of a
normalization that was adopted for calculation of the SPB level in numerous earlier works in Australia
(10,11). This procedure shows a good correlation with the ISO standard calculations (linear
regression) and was adopted here for its adequacy to the Australian context and for consistency with
those previous studies. The measurements were taken for three types of vehicles: passenger cars,
medium trucks and heavy trucks. The average speed for each test varied from 91 to 96 km/h for cars, 83
to 93 km/h for medium trucks and 81 to 99 km/h for heavy trucks.
The second and third methods involved measurements of sound pressure level and sound intensity
level conducted in the nearfield of the tyre-pavement contact, following the procedures of ISO/DIS
11819-2 (12) and AASHTO TP 76-10 (13) respectively. They were conducted using a trailer that was
constructed to allow for measurements according to both standards (14). The CPX and OBSI tests were
conducted using reference tyres specified for ISO/TS 11819-3 (15), the Michelin 225/60-R16 Standard
Reference Test Tyre (SRTT) for passenger cars and the Avon 195-R14C Supervan AV4 for heavy
vehicles (referred to as AV4 hereinafter). Both tyres are shown in the photographs in Figure 5. CPX
and OBSI tests were conducted at a travelling speed of 100 km/h. Each test was repeated for 8 to 10
runs. The results presented in Table 3 are the overall A-weighted CPX and OBSI levels measured on
the slow lane (left lane), bearing the highest traffic flow.
Table 3 – Test schedule
SPB Tests CPS & OBSI Tests
Section Test 1 Test 2 Test 3 Test 1 Test 2 Test 3
1
0 month 6 months 12 months
2 months 8 months 12 months
2 (*)
3
4
5
6 1 month 7 months 13 months
3 months 9 months 13 months
7
(*) The treatment of pavement 2 was carried out 1 month after installation
Figure 5 –Tyres used for the CPX and OBSI tests. L.H.S.: Michelin 225/60-R16 SRTT; R.H.S.: Avon
195-R14C Supervan AV4 (Images extracted from ref. 15)
Inter-noise 2014 Page 5 of 9
Inter-noise 2014 Page 5 of 9
Table 4 – Test results (All in dB(A))
Section Test
Passenger Car Heavy vehicles
SPB
CPX
(SRTT)
OBSI
(SRTT)
SPB
(dual axle)
SPB
(multi axle)
CPX
(AV4)
OBSI
(AV4)
1
1 71.6 99.1 100.7 80.0 85.1 99.6 101.4
2 74.0 99.6 99.6 82.8 82.9 98.3 99.9
3 73.6 100.9 101.8 82.4 85.2 98.6 100.9
2
1 - 96.6 98.4 - - 97.6 99.8
2 71.7 96.8 97.2 81.6 86.1 96.3 98.1
3 71.0 98.5 99.5 81.4 80.8 96.8 99.7
3
1 69.7 98.2 99.9 80.2 82.7 98.1 100.1
2 72.0 97.7 97.8 81.1 82.8 96.8 98.4
3 71.3 99.1 100 80.8 82.7 97.9 100.3
4
1 71.4 98.8 100.4 83.8 84.2 98.5 100.4
2 71.7 97.9 97.8 82.3 81.7 97.1 98.8
3 72.3 99.1 100 79.7 82.8 98.5 100.8
5
1 74 101.8 102.9 82.7 85.1 100.6 102.2
2 75.2 101.0 100.5 82.7 84.9 99.4 100.7
3 75.9 102.2 102.5 83.1 85.4 100.4 102.3
6
1 72.1 98.5 99.7 80.5 83.5 98.5 100.3
2 73.6 97.9 97.7 82.2 83.5 97.3 98.7
3 74.8 99.5 99.9 82.8 84.0 97.7 99.9
7
1 74.7 100.2 101.4 83.3 86.6 99.3 101
2 73.7 99.5 99.3 82.5 86.9 98.1 99.4
3 74.5 100.6 101.2 81.3 85.2 99 101.1
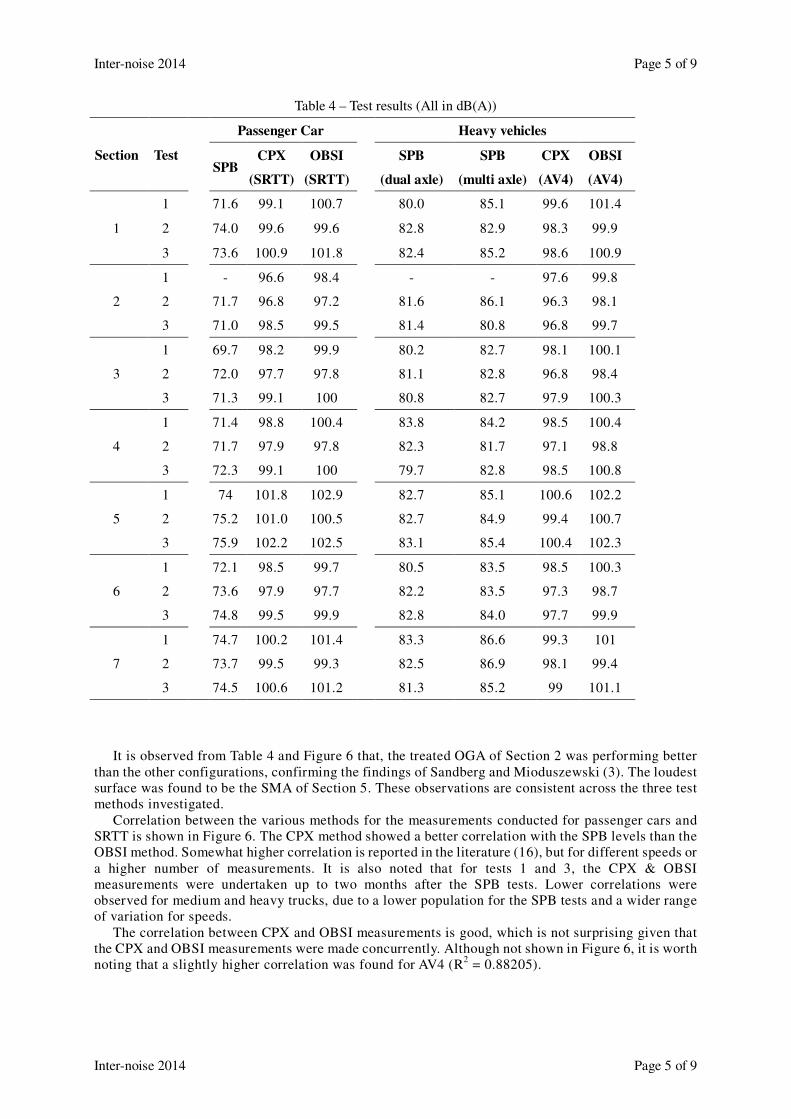
It is observed from Table 4 and Figure 6 that, the treated OGA of Section 2 was performing better
than the other configurations, confirming the findings of Sandberg and Mioduszewski (3). The loudest
surface was found to be the SMA of Section 5. These observations are consistent across the three test
methods investigated.
Correlation between the various methods for the measurements conducted for passenger cars and
SRTT is shown in Figure 6. The CPX method showed a better correlation with the SPB levels than the
OBSI method. Somewhat higher correlation is reported in the literature (16), but for different speeds or
a higher number of measurements. It is also noted that for tests 1 and 3, the CPX & OBSI
measurements were undertaken up to two months after the SPB tests. Lower correlations were
observed for medium and heavy trucks, due to a lower population for the SPB tests and a wider range
of variation for speeds.
The correlation between CPX and OBSI measurements is good, which is not surprising given that
the CPX and OBSI measurements were made concurrently. Although not shown in Figure 6, it is worth
noting that a slightly higher correlation was found for AV4 (R2 = 0.88205).

Page 6 of 9 Inter-noise 2014
Page 6 of 9 Inter-noise 2014
R² = 0.4099
95
100
105
68 73 78
Ov
era
ll C
PX
Le
ve
dB
(A)
Overall SPB Level dB(A)
Legend
0
50
100
150
0 200
Test 1 Test 2 Test 3
Section 1 Section 2 Section 3
Section 4 Section 5 Section 6
Section 7
R² = 0.2128
95
100
105
68 73 78
Ov
era
ll O
BS
I Le
ve
l d
B(A
)
Overall SPB Level dB(A)
R² = 0.8068
95
100
105
95 100 105
Ov
era
ll O
BS
I Le
ve
l dB
(A)
Overall CPX Level
Figure 6 – Correlation between the three measurement methods for the measurements for passenger cars
Further insight is given into the variation with time of the acoustic properties of the investigated
pavements and into their relative performance in the following. Results presented are based on the
levels obtained by the CPX method. At this stage of the trial, this method was preferred for such
analysis since it appeared to be more robust than the statistical pass-by method, particularly for heavy
vehicles, and was found to correlate better to the roadside noise levels than the OBSI method.
3.2 Variation over time
Figure 7 shows a plot of the variation over time of the overall A-weighted CPX level for the
different pavements, with reference to the first test session. For SRTT an increase of up to 2 dB(A) was
observed across the 10 months between the first series and the last series of CPX tests for Sections 1
and 2. An inflexion can be observed with a lower increase in noise levels between test 1 and test 2 than
between test 2 and test 3. The increase was limited to about 1 dB for Sections 3 and 7, and quasi-null
for Sections 4 to 6. Again, an inflexion was observed for these surfaces, with a slight decrease in CPX
levels for test 2.
The increase in CPX level was somewhat lesser (about 1 dB(A) for Sections 1 and 2, and quasi null
for the other sections across the 10 months between test 1 and test 2).
3.3 Relative performance of the tested asphalts
As alluded in paragraph 3.1, the Section 5 SMA was found to be the loudest surface amongst the
seven pavements investigated. It was therefore used as a reference surface so as to further investigate
the relative performance of the six other pavements. It is noted that typically, in Victoria, SMA
pavements lead to noise levels approximately 1 dB(A) lower than dense graded asphalts. (16)
In Figure 8, the performance of the six other pavements relative to that of Section 5 SMA,
expressed as the difference in overall A-weighted CPX levels, are compared for both SRTT and AV4.
Unsurprisingly, with negative differences, all six pavements were quieter than the SMA for the three
tests. While the performance of Sections 1 and 2 relative to the Section 5 SMA showed some
degradation over time (and particularly over the first few months), the performance of the other
pavement seemed to have remained relatively stable over the ten months of trial. A slight decrease in
CPX vs. SPB
OBSI vs. SPB OBSI vs. CPX

Inter-noise 2014 Page 7 of 9
Inter-noise 2014 Page 7 of 9
performance can be observed for Sections 4 and 6 for SRTT. This is however less obvious for AV4.
The treated OGA of Section 2 was found to be up to 5 dB(A) quieter for SRTT and 3 dB(A) quieter
for AV4 than the Section 5 SMA.
Further insight in the relative performance of the different OGA configurations tested is given in
Figure 9. The performance of the pavements in Sections 2 to 4, relative to that of the standard OGA in
Section 1 is plotted for the three tests. The three alternative OGA configurations were found to provide
additional noise reduction. The improvement observed for the treated OGA of Section 2 was found to
be relatively stable across the 10 months of trial, with an additional reduction in CPX levels of
approximately 2.5 dB(A) for SRTT and about 2 dB(A) for AV4. While this result is consistent with that
of Sandberg and Mioduszewski (3) for the SRTT, a lower decrease for AV4 (0.5 dB) was observed in
that earlier study. This may be explained by the fact the latter was conducted for a double layer porous
asphalt concrete, whereas the pavement investigated here in Section 2 is based on a single layer OGA.
-3.0
-2.0
-1.0
0.0
1.0
2.0
3.0
Test 1 Test 2 Test 3
Dif
fere
nce
in
CP
X L
ev
el
dB
(A)
SRTT
-3.0
-2.0
-1.0
0.0
1.0
2.0
3.0
Test 1 Test 2 Test 3
Dif
fere
nce
in
CP
X L
ev
el
dB
(A)
AV4
Legend
-6.0-4.0
-2.00.0
Section 1
Section 2
Section 3
Section 4
Section 5
Section 6
Section 7
Figure 7 – Evolution with time of pavement performance (CPX levels relative to test 1)
-6.0
-5.0
-4.0
-3.0
-2.0
-1.0
0.0
Test 1 Test 2 Test 3
Dif
fere
nce
in
CP
X L
ev
el
dB
(A)
SRTT
-6.0
-5.0
-4.0
-3.0
-2.0
-1.0
0.0
Test 1 Test 2 Test 3
Dif
fere
nce
in
CP
X L
ev
el
dB
(A)
AV4
Legend
-6.0-5.0-4.0-3.0-2.0-1.00.0
Section 1
Section 2
Section 3
Section 4
Section 6
Section 7
Reference:
Section 5
Figure 8 – CPX levels of the pavements in Sections 1 to 4, 6 and 7 relative to that of the SMA in Section 5
-3.0
-2.0
-1.0
0.0
Test 1 Test 2 Test 3
Dif
fere
nce
in
CP
X L
ev
el
dB
(A)
SRTT
-3
-2
-1
0
Test 1 Test 2 Test 3
Dif
fere
nce
in
CP
X L
ev
el
dB
(A)
AV4
Legend
-3.0-2.0-1.00.01.02.0
Section 2
Section 3
Section 4
Reference:
Section1
Figure 9 – CPX levels of the OGA pavements in Sections 2 to 4, to that of the standard OGA in Section 1
Page 8 of 9 Inter-noise 2014
Page 8 of 9 Inter-noise 2014
4. CONCLUSIONS
The results of acoustic tests conducted on seven different pavement surfaces at the Mornington
Peninsula Freeway, near Melbourne have been presented here. The tests were conducted during the
first year following the installation of the surfaces, and are part of a program intended to take place
over a total of five years.
The asphalt pavements tested consisted of four different configurations of open graded asphalt
(OGA), one stone mastic asphalt (SMA) and two proprietary products. Acoustic tests were conducted
by means of three different methods: Statistical Bypass (SPB), Close-Proximity Method (CPX) and
On-Board Sound Intensity (OBSI). The latter two were conducted using a reference tyre representative
of passenger car tyres (SRTT) and one representative of heavy vehicle tyres (AV4). The CPX method
showed better correlation to the SPB measurements than the OBSI method.
While the Stone Mastic Asphalt was found to be the loudest surface tested, the quietest surface was
an OGA treated by grinding off 1-2mm of its surface so as to create a negative texture. Relative to the
SMA, a reduction in CPX levels of up to 5 dB(A) was measured for the treated OGA for SRTT, and
approximately of 3 dB(A) for AV4. When compared to a standard OGA, the treatment resulted in an
additional reduction in CPX levels of about 2.5 dB(A) for SRTT and about 2 dB(A) for AV4.
Consistent with previous works, double layer OGA was found to perform better than single layer
OGA, showing improvement in noise reduction, but also lesser loss in performance over time.
The trial is expected to last for another four years, during which tests will be conducted at regular
intervals so as to provide an understanding of the acoustic performance of the tested pavements in the
long term.
5. ACKNOWLEDGEMENTS
The authors acknowledge Boral, TEF Consulting and Vipac Engineers & Scientists for their
participation to the trial.
6. REFERENCES
1. Simpson C., McIntosh J., Buret M., Samuels S. Asphalt trials to reduce traffic noise levels. Submitted
26th Australian Road Research Conference; 19-22 October 2014; Sydney, New South Wales, Australia
2014.
2. Standard Specification 407, Hot Mix Asphalt. VicRoads; Kew, Victoria, Australia, 2013.
3. Sandberg U. and Mioduszewski P. Gaining extra noise reduction and lower rolling resistance by
grinding a porous asphalt pavement. Proc. INTER-NOISE 2012; 19-22 August 2012; New York, USA
2012.
4. Goubert L., Hooghwerff J., The P., Hofrman R., Two-layer porous asphalt: an international survey in
the frame of the Noise Innovation Programme (IPG). Proc. INTER-NOISE 2005; 07-10 August 2005;
Rio de Janeiro, Brazil 2005.
5. Sandberg U, Ejsmont J.A. Tyre/road noise reference book. Informex, Kisa, Sweden, 2002.
6. Main Roads Technical Standard, MRTS30 Dense Graded and Open Graded Asphalt. State of
Queensland (Department of Transport and Main Roads); Australia, 2009.
7. DR AS/NZS 2891.9.3 Methods of sampling and testing asphalt - Determination of bulk density of
compacted asphalt - Mensuration method; Standards Australia; 2013.
8. Tran J, and Van Loon H. Bulk Density Investigations in South Australia. AAPA’s 14th International
Flexible Pavements Conference; 25-28 September 2011; Sydney, New South Wales, Australia, 2014.
9. ISO 11819-1:1997 Acoustics -- Measurement of the influence of road surfaces on traffic noise -- Part
1: Statistical Pass-By method. International Standard Organization; Geneva, Switzerland, 2013.
10. Samuels SE., The acoustic effects of diamond grinding Portland Cement Concrete pavement surfaces.
Road and Transport Research Journal, Vol. 20 No. 4; December 2011, pp. 42-56; ARRB Group,
Vermont South, Victoria, Australia.
11. Samuels SE., Tyre and road pavement influences on vehicle and road traffic noise, D.Eng. Dissertation,
University of Newcastle; Newcastle, New South Wales, Australia, 2008.
12. ISO/DIS 11819-2 Acoustics -- Measurement of the influence of road surfaces on traffic noise -- Part 2:
The close-proximity method. International Standard Organization; Geneva, Switzerland, 2013.
13. AASHTO TP 76-10, Standard Method of Test for Measurement of Tire/Pavement Noise Using the
On-Board Sound Intensity (OBSI) Method. American Association of State Highway and
Transportation Officials; Wahsington D.C., USA 2010

Inter-noise 2014 Page 9 of 9
Inter-noise 2014 Page 9 of 9
14. Li X., Lim V. Integrated test system for tyre/road noise – ISO/DIS 11819-2 and AASHTO TP76-12
methods. Submitted INTER-NOISE 2014; 16-19 November 2014; Melbourne, Victoria, Australia
2014.
15. Morgan P., Sandberg U., Van Blokland G. The selection of new reference test tyres for use with the
CPX method, to be specified in ISO/TS 11819-3. Proc. INTER-NOISE 2009; 23-26 August 2009;
Ottawa, Canada 2009.
16. Jørgen K., Møller Iversen L., Sandberg U. Road surface texture for low noise and low rolling
resistance, Nordtex final report, Vejdirektoratet rapport 506. Vejdirektoratet, Denmark 2013.
17. Road Design Note 6-01 Interpretation and application of VicRoads Traffic Noise Reduction Policy
2005, VicRoads, Melbourne, 2010.