COMPARATIVE ANALYSIS OF NET ENERGY BALANCE OF …doe/er-0056 dist. category uc 11, 13, 62, 63, 95f,...
131
DOE/ER-0056 DIST. CATEGORY UC 11, 13, 62, 63, 95f, 97c COMPARATIVE ANALYSIS OF NET ENERGY BALANCE OF SATELLITE POWER SYSTEMS (SPS) AND OTHER ENERGY SYSTEMS April 1980 Prepared by: R. R. Cirillo, B. S. Cho, M. R. Monarch, and E. P. Levine Integrated Assessments and Policy Evaluations Group Energy and Environmental Systems Division Argonne National Laboratory Argonne, Illinois 60439 Under Contract No. 31-109-ENG-38 Prepared for: U.S. Department of Energy Office of Energy Research Satellite Power System Project Division Washington, D.C. 20545 DOE/NASA SATELLITE POWER SYSTEM Concept Development and Evaluation Program
Transcript of COMPARATIVE ANALYSIS OF NET ENERGY BALANCE OF …doe/er-0056 dist. category uc 11, 13, 62, 63, 95f,...
DOE/ER-0056 DIST. CATEGORY UC 11, 13, 62, 63, 95f, 97c
COMPARATIVE ANALYSIS OF NET ENERGY BALANCE OF SATELLITE POWER SYSTEMS (SPS) AND OTHER ENERGY SYSTEMS
April 1980
Prepared by:
R. R. Cirillo, B. S. Cho, M. R. Monarch, and E. P. Levine
Integrated Assessments and Policy Evaluations Group Energy and Environmental Systems Division Argonne National Laboratory Argonne, Illinois 60439
Under Contract No. 31-109-ENG-38
Prepared for:
U.S. Department of Energy Office of Energy Research Satellite Power System Project Division Washington, D.C. 20545
DOE/NASA
SATELLITE POWER SYSTEM Concept Development and Evaluation Program

bbl:
Btu:
•c: cm:
eV:
•F:
ft:
g:
gal:
GW:
hr:
J:
K:
kg:
Ian:
kV:
kWh:
kWhe:
kWht:
lb:
m:
mi:
MWe:
MWh:
µm:
s:
SWU:
t:
t-lan:
ton:
ton-mi:
yr:
DEFINITIONS OF UNIT SYMBOLS
barrel
British thermal unit
degrees centigrade
centimeter
electron volt
degrees Fahrenheit
foot
gram
gallon
gigawatt (i.e., 109 watts)
hour
joule
Kelvin (temperature scale)
kilogram
kilometer
kilovolt
kilowatt hour
kilowatt hour (electric)
kilowatt hour (thermal)
pound
meter
mile
megawatt (electric)
megawatt hour
micrometer
second
separative work unit
metric ton (l,000 kg)
ton-kilometer (metric)
English ton
ton-mile (English)
year
iv

TABLE OF CONTENTS
ABSTRACT ...... .
1 EXECUTIVE SUMMARY.
2 SCOPE AND METHODOLOGY.
2.1 INTRODUCTION ...• 2.2 METHODOLOGICAL ALTERNATIVES 2 . 3 APPROACH. . . . . . . . . . •
2.3.1 2.3.2 2.3.3
Methodology. • • • • • • •••••• Resolution of Technical Issues • Resolution of Philosophical Issues •
3 ALTERNATIVE ENERGY SYSTEMS
3.1 COAL-BASED SYSTEMS •.
4
3 .1.1 3.1.2
Atmospheric Fluidized Bed Combustion Coal Gasification/Combined Cycle •
3.2 NUCLEAR SYSTEM ..•.......•..• 3.3 TERRESTRIAL SOLAR ENERGY SYSTEMS ..•.•
3.4
3.3.l 3.3.2
Terrestrial Solar Thermal System • • • • • • Terrestrial Solar Photovoltaic System.
SATELLITE POWER SYSTEM.
RESULTS OF ANALYSIS.
4.1· BASELINE CASE . 4.2 EFFECT OF UNCERTAIN DATA.
4.2.l 4.2.2 4.2.3 4.2.4 4.2.5 4.2.6
Energy Intensity of Silicon Cell Production .• Cell Lifetime. • • • • . • • • • • •••• Energy Supply for Silicon Production • • . • • •••• Quantity of Silicon Required • • ••••• Energy Intensity of GaAlAs Cell Production • Other Material Energy Requirements • . •
4.3 EFFECT OF ALTERNATIVE METHODS: OTHER STUDIES .
5 CONCLUSIONS AND RECOMMENDATIONS.
REFERENCES. . • . . • .
APPENDIX A - DETAILS OF THE METHODOLOGY •
APPENDIX B - COAL FUEL CYCLE SYSTEMS.
APPENDIX C - NUCLEAR FUEL CYCLE . . .
APPENDIX D - TERRESTRIAL SOLAR ENERGY SYSTEMS .
APPENDIX E - SATELLITE POWER SYSTEM .
v
1
1
5
5 6 7
7 8
10
13
13
13 13
16 16
16 18
18
23
23 27
27 29 29 30 30 31
31
35
37
39
55
75
99
121

No.
1.1
2.1
4.1
A.l
A.2
B.l
B.2
B.3
B.4
C.l
C.2
D. l
LIST OF FIGURES
Title
Comparison of System Energy Payback Periods.
Schematic of Energy Balance ..••
Variation of Net Energy Parameters with Silicon Energy Requirements.
Schematic Chart of System Element Energy Balance . • •
Potential for Reduction in Silicon Energy Requirements
Simplified Flow Diagram of an AFBC Cycle ..•
Primary Energy Flow Diagram of an AFBC Cycle •
Simplified Flow Diagram of an AFBC Cycle •••
Primary Energy Flow Diagram of Low-Btu CG/CC System.
Simplified Flow Diagram of the Nuclear Fuel Cycle.
Energy Flow Pathway of the Nuclear Fuel Cycle .•••
Power Conditioning Module Functional Block Diagram
. . . . . . .
4
7
28
42
50
58
63
67
70
77
94
102
D.2 Energy Flow of 1000-MWe Solar Photovoltaic Plant in Barstow, CA. 107
D.3 Schematic Diagram of Solar Thermal Plant • 111
D.4 Energy Flow of 100-MWe Solar Thermal Plant in Barstow, CA. 115
E.l Simplified Flow Diagram and Efficiency Chain of SPS. 124
E.2 Primary Energy Flow Diagram for SPS •.
LIST OF TABLES
1.1 Summary of Energr Balance Data
Summary of AFBC Energy Paramaters. . . . . . . . 3.1
3.2
3.3
Summary of Coal Gasification/Combined Cycle Energy Parameters •
Summary of LWR Energy Parameters . . . . . . . . . . . . 3.4 Summary of Terrestrial Solar Thermal Energy Parameters .
3.5 Summary of Terrestrial Solar Photovoltaic Energy Parameters.
3.6 Summary of SPS Energy Paramters ..•.•...
4.1 Summary of Energy System Inputs and Outputs.
4.2 Summary of Energy Balance Data ..••
4.3 Differences in Silicon Requirements.
4.4
A. l
A.2
Effect of Energy Intensity Assumptions on SPS Energy Balance
Fuel Heating Values •••.....•.•••••
Adjustments to Energy Intensity for Input/Output Analysis.
A.3 Energy Costs of Delivered Fuel •
vii
. .
131
2
14
15
17
19
20
22
24
25
30
31
43
47
47

LIST OF TABLES (Cont'd)
No. Title
A.4 Material Energy Intensities .•.•••••
B.l Energy Balance Parameters for AFBC System ••
B.2
B.3
B.4
C.l
C.2
C.3
C.4
c.s C.6
C.7
C.8
Energy Efficiencies for the Primary Energy Flow in the AFBC System •
Energy Balance for CG/ CC System. • • • • • • • • • • • • •
Energy Efficiencies for the Primary Energy Flow in the CG/CC System.
Uranium Mining - Direct Energy Requirements.
Uranium Mining - Total Energy Requirements •
Uranium Milling - Direct Energy Requirements
Uranium Milling - Total Energy Requirements.
Energy Requirements of Uranium Purification.
Enrichment Energy Requirements . . • • • • • • • • •
Energy Requirements for LWR Fuel Fabrication • • • • •
Major Material Requirements for a 1000-MWe LWR ••
49
64
65
71
72
78
79
80
81
82
83
85
86
C.9 Major Categories for Plant Groupings Shown in Table C.8. • • • • 87
C.10 Major Material Requirements for a 1000-MWe LWR • • • • • 87
C.11 Annual Energy Requirements for a 1000-MWe LWR ••
C.12 Annual Fuel Storage Requirements ••
C.13 Waste Storage Annual Requirements.
C.14 Transportation Energy Requirements: Ore Mill to Enrichment Plant ••
C.15 Transportation Energy Requirements: Enrichment to Storage or Reprocessing of Waste. . . • . . • • • • • • • • • •
C.16 Energy Balance Parameters for Nuclear LWR System •
D. l
D.2
D. 3
E.l
E.2
E.3
E.4
Energy Balance Parameters for Terrestrial Solar Photovoltaic System.
Solar Cell Efficiencies ••••••••••••••••••••
Energy Balance Parameters for Terrestrial Solar Thermal System •
Material Requirements for SPS.
Masses of SPS Subsystems . • • •
Energy Balance Parameters for SPS ••
Total Masses of All SPS Program Components •
E.5 Total Capital Inputs for SPS •.•.••••
viii
88
89
90
92
92
95
106
109
116
128
129
132
133
134

1
COMPARATIVE ANALYSIS OF NET ENERGY BALANCE FOR SATELLITE POWER SYSTEMS AND
OTHER ENERGY SYSTEMS
ABSTRACT
This T'epoT't assesses the net energy balance of seven electric ene.,.gy systems: tllJo coal-based, one nucZea.,., tllJo te.,..,.estrial soza.,., and tllJo solar pOllJeT' satellites, llJith principal emphasis on the latte.,. two systems. Soza.,. ene7"(Jy systems T'equiT'e much less operating ene.,.gy per unit of eZectT'icaZ output. HOllJeve.,., on the basis of the analysis used heT'e, coal and nuciea.,. systems aT'e two to five times moT'e efficient at extracting usef uZ ene.,.gy from the primary resource base than are the solar energy systems. 'l'he payback peT'iod for au systems is less than 1. 5 years, e:r:cept .for the te.,..,,.estriaZ photovoltaic (19 .8 yr) and the solar pollJer sateUite system (6 .4 yT'), both of llJhich rely on energy-intensive silicon cells.
1 EXECUTIVE SUMMARY
A preliminary assessment of the net energy balance of seven electric
energy systems was conducted, using existing data and methods, to identify
differences and to recommend further work needed to improve the evaluation.
Two of the systems are coal-based--a 747-MWe atmospheric fluidized bed combus
tion (AFBC) and a 741.5-MWe coal-gasification/combined-cycle (CG/CC) system;
one is nuclear--a 1000-MWe light water reactor (LWR); two are terrestrial
solar--a 100-MWe thermal and a 1000-MWe photovoltaic system; and two are
satellite power systems--5000-MWe satellites using, respectively, silicon
cells and gallium aluminum arsenide (GaAlAs) cells. The principal emphasis is
on the satellite power system (SPS).
A combination of process analysis and input/output analysis was
used to compute, for each system, the energy balance parameters: gross
efficiency, operating efficiency, operating ratio, lifetime efficiency,
lifetime ratio, and payback period. These parameters are defined in Table
1.1, which summarizes the basic results.
The coal and nuclear systems are two to five times more efficient than
the solar energy systems, but use nonrenewable resources, which is undesirable
when concern for resource depletion is important. The conversion efficiency
of the system dominates the result: the calculation of efficiency is not

Table 1. 1. Surmnary of Energy Balance Data
Coal Nuclear Terrestrial Solara spsa
Photo-Parameter AFBC CG/CC LWR Thennal voltaicb Silicon GaAlAs
Gross Efficiency, %c 28 .1 36.7 21. 7 11.4 5.7 7.0 6.9
Operating Efficiency, %d 26.7 33.4 20.4 11.4 5.7 7.0 6.9
Operating Ratioe 5.33 3.67 3.32 26.74 27.34 16.67 77 .89
Lifetime Efficiency, %f 26.4 33.0 20.3 11.3 5.4 6.9 6.9
Lifetime Ratiog 4.43 3.26 3.04 11.54 1.43 3.85 17 .97
Payback Period (Electric Basis), yrh 1.30 1.11 1.14 1.48 19.82 6.38 1.30
aThe data for the solar energy systems are limited and, in some cases, highly uncertain; conclusions should be drawn with caution.
bsilicon system.
ccross Efficiency =Annual Net Output/Annual Primary Input.
doperating Efficiency =Annual Net Output/Annual Primary+ Operating + Internal Inputs.
eoperating Ratio = Annual Net Output/Annual Operating + Internal Inputs.
fLifetime Efficiency = Lifetime Net Output/Lifetime Primary + Operating + Internal + Capital Inputs.
8Lifetime Ratio = Lifetime Net Output/Lifetime Operating + Internal + Capital Inputs.
hPayback Period is the time at which Net Output = Operating + Capital Inputs.
N

3
sensitive to gross, operating, or lifetime efficiency figures. Because
efficiency parameters cannot take into account the fact that the solar energy
systems operate from a renewable, effectively inexhaustible, resource base,
whereas nuclear and coal systems operate from a nonrenewable resource base,
one must conclude that efficiency is not a good measure of comparability
between the solar and the coal and nuclear systems.
Although the operating ratio results demonstrate that the solar energy
systems require substantially less operating energy per unit of electrical
output, the large capital investment reduces their lifetime ratios signifi
cantly. For silicon-cell satellite power systems (SPS/Si) and terrestrial
photovoltaic systems, the lifetime ratios are less than that of the best coal
system.
The payback period for all systems except SPS/Si and terrestrial
photovoltaic is less than 1. 5 years. For both these exceptions, the long
payback results primarily from the energy intensity of silicon production.
For the SPS/Si system, several possibilities -- e.g., decreased energy re
quirements for cell production, use of solar-generated rather than conven
tional electrical power in cell manufacture, increased cell lifetime, and
decreased silicon requirements -- could make the payback period comparable to
that of the other systems. (The payback periods of the other systems could
also be reduced slightly if solar electricity were substituted for conven
tional electricity in their manufacture.) In contrast, the best combination
of conditions for the terrestrial photovoltaic system still would result in a
payback of about six years. Figure 1.1 summarizes the range of payback
conditions.
The difference between the SPS/Si and the terrestrial photovoltaic
system occurs because the SPS/Si system would operate 24 hr/day, as compared
to about 8-10 hr/day for the terrestrial system, and after the capital energy
investment has been made in the silicon cells, the SPS would use the material
more intensively and thus more efficiently.
The results of this study were compared to those from three earlier
studies of the net energy balance of satellite power systems. Differences
among the results arise primarily from different initial assumptions in the
various studies. When these
conditions, the resulting net
studies become comparable.
assumptions are resolved to the same set of
energy balance parameters from the different

4
20 I BASE I I
19 I
"'' ..,,.,, !111~
18 ~·:::> lo ..,,,,., ~I~
10 .,.., \111. WJ~ "'I"'
(f) 9 ~·cc
a: <t w JPL >- 8 Q
Q a: 7 w a.. :.:: BASE u 6 ca >-~ 5
4
3
2
AFBC LWR CG/CC SOLAR SOLAR SPS SPS THERMAL PHOTO Si GoAIAs
VOLTAIC
Fig. 1.1. Comparison of System Energy Payback Periods
Recommendations for future activity include the following:
1. No further analysis is recommended for the coal, nuclear, and terrestrial solar thermal systems, because their payback periods are so similar; little can be gained by further comparisons of SPS with these systems.
2. More detailed assessment of energy requirements for production of silicon cells is needed, beca¥se the results for SPS/Si and terrestrial photovoltaic systems depend so heavily on this energy input. A study of the potential for reducing such energy consumption is recommended, and the net energy balance parameters for SPS/Si
3. The energy inputs required for production of GaAlAs cells need study, and the net · energy balance parameters for SPS/GaAlAs should be recomputed .with the resulting new information. The information available at present is extremely limited, and although it suggests a very short paypack period the level of uncertainty dictates that is should be examined more carefully.

5
2 SCOPE AND METHODOLOGY
2.1 INTRODUCTION
Net energy analysis is a developing tool that is coming to be more
widely used in energy research and decision making. Its goal is to estimate
the quantity of energy that must be invested in an energy system to recover
useful energy output. The concept of net energy analysis has not been impor
tant in decisions about conventional energy systems, because those systems
traditionally have been considered to provide substantially more energy than
was required to put them into operation. However, advanced technologies
require more energy investment to recover each unit of usable energy, so the
net energy yield becomes an important decision parameter. Net energy output
is not the only variable on which decisions must be based; it must be con
sidered in the light of economic, environmental, social, and other factors of
interest, including use of renewable versus non-renewable resources and
depletion of nonenergy mineral resources. All these factors are important in
a comparative assessment, but they are beyond the scope of a net energy
study. They are more appropriately addressed separately.
For satellite power systems (SPS), the issue of net energy analysis
was raised by Herendeen,l who suggested that an SPS system might be close to
the payback limit, i.e., might not return sufficient usable energy compared to
the energy investment required. Other studies2,3 have come to somewhat
different conclusions. The objective of the present study, part of an overall
comparative assessment of SPS and other energy technologies, was to conduct a
preliminary evaluation of the net energy output for SPS and other technologies
to draw some preliminary conclusions about how SPS compares with other systems
and to identify where deficiencies in information exist. Available data and
current analytic methods were used to obtain first-order estimates of the net
energy balance parameters for the various systems; there has been no great
effort to make detailed refinements of the calculations. This preliminary
screening process will lead to a determination of where additional effort
might best be spent to resolve differences in data and approach and to fill
the information gaps.
Net energy analysis was applied to seven electrical energy systems:
atmospheric fluidized bed combustion (AFBC) and coal gasification/combined-

6
cycle (CG/CC), both coal-based; light water reactors (LWR), two terres
trial solar energy systems (photovoltaic and thermal), and two satellite
power systems, SPS/Si and SPS/GaAlAs, which use, respectively, silicon cells
and gallium aluminum arsenide cells.
2.2 METHODOLOGICAL ALTERNATIVES
Basically, three methodologies can be used for net energy analysis.
Reference 4 gives a concise review and critique of the alternatives.
Process analysis involves a detailed balance of energy flows into and
out of a system. It is the most accurate and most involved methodology, and
can be applied to situations where vast amounts of process-specific informa
tion are available.
Input/output analysis uses a procedure analogous to economic input
output analysis to determine the energy costs of any energy supply. It
involves identifying the interactions among all sectors of the economy re
quired to produce energy and translating the flow of goods and services among
sectors into energy equivalents.
Ecoenergetics involves the assignment of energy values to various
portions of the natural environment that are affected by the energy system.
The process can be compared to a cost/benefit analysis in an economic evalu
ation.
In addition to the choice of analysis, several other decisions must be
made to conduct a net energy analysis. Reference 4 classifies these decisions
as follows:
Technical Issues
• Definition of system boundaries. • Assignment of weights and quality factors to different forms of
energy. • Measurement of net energy. • Treatment of temporal variations.
Philosophical Issues
• Evaluation of return on investment and discount rate. • Treatment of labor requirements. • Evaluation of sociological and institutional factors. • Evaluation of environmental impacts.

7
2.3 APPROACH
2.3.1 Methodology
In this preliminary analysis, a combination of process analysis and
input/output analysis, rather than the econenergetics approach, was used.
These methodologies have been widely applied in other studies and therefore
satisfy a primary guideline for this assessment, i.e., to use existing re
search.
Each of the systems chosen for evaluation can be described as a collec
t ion of system elements. Each element represents a particular piece of
hardware, processing step, energy conversion step, or transportation mode.
The energy balance of each system element can be described as shown in Fig.
2.1. The primary input is in the form of fuel (e.g., coal into a coal-proces
sing plant) or energy (e.g., heat from a solar collector into a boiler). The
ancillary operating inputs are those energy forms (fuel, electricity, or
materials) required to keep the process operating (e.g., electricity to run
pumps, gasoline for motor vehicles, or limestone for a combustor). The gross
output is the energy or processed fuel that results from the system element.
A portion of this may be used to meet internal energy requirements (e.g. ,
electricity required at a power plant site to operate equipment). The balance
is the net output that goes on to become the primary input of the next system
element. The losses are the difference between the outputs and inputs.
PRIMARY INPUT
ANCILLARY OPERATING INPUTS
CAPITAL ENERGY INPUTS
SYSTEM ELEMENT
l LOSSES
INTERNAL USE
GROSS OUTPUT
Fig. 2.1. Schematic of Energy Balance
NET OUTPUT

8
For each system element, data on the quantities of materials, fuels,
and electricity required to build and operate the system were compiled.
Published data on energy requirements,1,3,5,6 expressed either in joules per
ton of material or joules per dollar cost of material, were used to convert
the physical material quantity or material cost into an energy equivalent.
Where the material cost was available, this conversion was based on an input/
output table for each sector of the economy. For each type of material, an
economic value of goods and services required from other sectors of the
economy was computed, and an energy intensity figure was used to translate
these economic costs into energy costs. In some cases, data already trans
lated into energy equivalents in other net energy analyses were used. Because
it was not deemed necessary at this time to perform a systematic check of the
analytical processes used in these other studies, the potential exists for
some inconsistencies among technologies in the calculation of indirect energy.
These can be corrected in subsequent expansions of this work.
2.3.2 Resolution of Technical Issues
Several technical assumptions, discussed below, are i111pl icit :m the
application of the analytical procedure.
System Boundaries. The boundary of each energy system was defined as
extending from the primary resource (coal, uranium, or solar radiation) to
electricity transmitted from the generating plant. The boundary includes
environmental control systems and procedures to the extent that they are
directly attributable to the energy system (e.g., cooling towers, particulate
emission control, or strip mine' reclamation). Materials, fuels, and elec-
tricity required for plant construction and operation enter the system
from external sources, and the input/output analysis is the only method
of dealing with their energy equivalents.
Energy Quality Factors. No attempt was made to attach a relative
weight to the various forms of energy to account for the differences in
quality and potential use. (For example, a joule-equivalent of a petroleum
fuel is more useful than a joule-equivalent of coal). In the case of elec
tricity required as ancillary operating input or as capital energy input, some
adjustment must be made to reflect the basic resource cost of generating
9
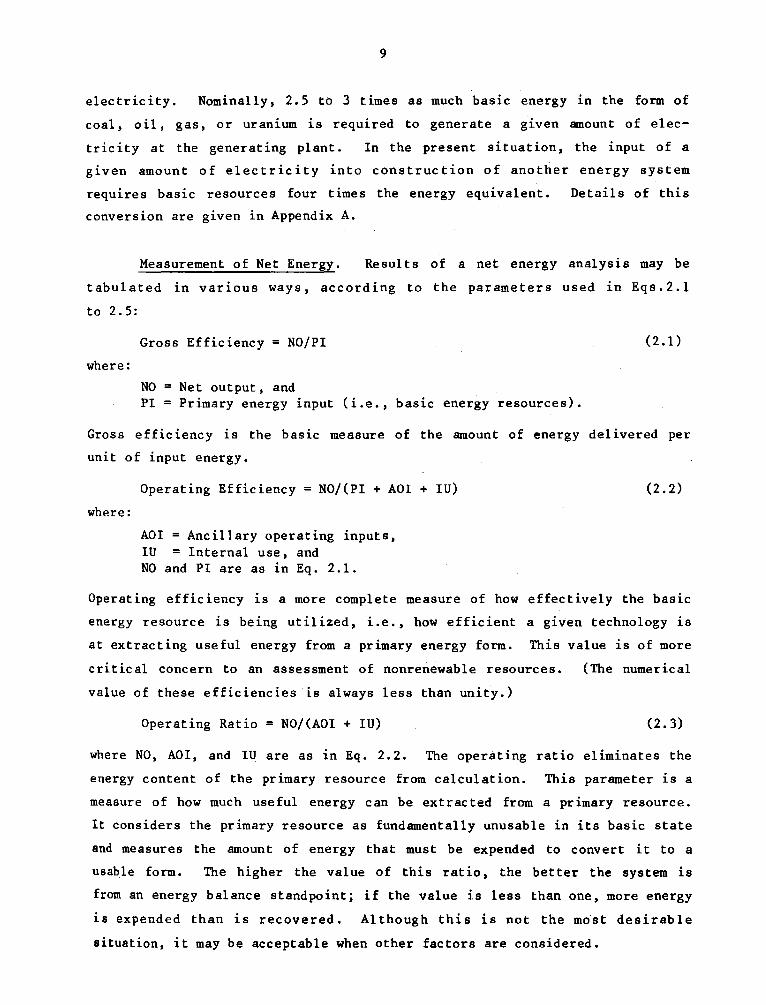
electricity. Nominally, 2.5 to 3 times as much basic energy in the form of
coal, oil, gas, or uranium is required to generate a given amount of elec-
tricity at the generating plant. In the present situation, the input of a
given amount of electricity into construction of another energy system
requires basic resources four times the energy equivalent.
conversion are given in Appendix A.
Details of this
Measurement of Net Energy. Results of a net energy analysis may be
tabulated in various ways, according to the parameters used in Eqs.2.1
to 2.5:
Gross Efficiency = NO/PI (2.1)
where:
NO= Net output, and PI= Primary energy input (i.e., basic energy resources).
Gross efficiency is the basic measure of the amount of energy delivered per
unit of input energy.
where:
Operating Efficiency = NO/(PI + AOI + IU)
AOI =Ancillary operating inputs, IU = Internal use, and NO and PI are as in Eq. 2.1.
(2.2)
Operating efficiency is a more complete measure of how effectively the basic
energy resource is being utilized, i.e., how efficient a given technology is
at extracting useful energy from a primary energy form. This value is of more
critical concern to an assessment of nonrenewable resources. (The numerical
value of these efficiencies is always less than unity.)
Operating Ratio = NO/(AOI + IU) (2.3)
where NO, AOI, and IU are as in Eq. 2.2. The operating ratio eliminates the
energy content of the primary resource from calculation. This parameter is a
measure of how much useful energy can be extracted from a primary resource.
It considers the primary resource as fundamentally unusable in its basic state
and measures the amount of energy that must be expended to convert it to a
usable form. The higher the value of this ratio, the better the system is
from an energy balance standpoint; if the value is less than one, more energy
is expended than is recovered. Although this is not the most desirable
situation, it may be acceptable when other factors are considered.

where:
10
T x NO Lifetime Efficiency = ~~~~~~~~~~~
T(PI + AOI + IU) + CI
T = System lifetime,
CI = Capital energy inputs, and
NO, PI, AOI, and IU are as in Eq. 2.2.
T x NO Lifetime Ratio = ~~~~~~~~
T(AOI + IU) + CI
(2~4)
(2.5)
Where the notation is as in Eq. 2.4. The lifetime efficiency and lifetime
ratio are entirely analogous to the operating efficiency and operating ratio
of Eqs. 2.2 and 2.3. They include in the balance the capital energy invest
ment, which represents the energy required to construct the system.
Temporal Variations. This preliminary analysis did not consider the
time variation of energy expenditures or energy returns in constructing and
operating an energy system; all calculations were made on an annual basis with
capital investments adjusted by the system lifetime. However, several of the
energy systems examined have significant variations in the time rate of energy
investment and usable energy output. A temporal analysis could treat the
problems arising from high energy demands early in system deployment, but such
an analysis was considered unnecessary for this preliminary study.
2.3.3 Resolution of Philosophical Issues
As with the technical issues, some philosophical assumptions are
implied in the analysis; these are discussed below:
Return on Investment. No attempt was made to prescribe and evaluate
a desirable rate of return on energy investment or a suitable discount rate
for estimating present value. No estimates were made of the relative value of
an early expenditure versus a later one. The only assessment of this type
that was carried out was the straightforward calculation of the payback
period, i.e., the time required for the system to produce enough useful
energy to match the energy invested in building and operating it. The
payback period is that time at which the net output equals the capital energy
input plus the cumulative ancillary operating inputs.

11
Treatment of Labor. No attempt was made to place an energy equivalent
on human labor because this issue is outside the realm in which net energy
analysis can supply useful insight.
Institutional/Sociological Considerations. No energy value can be
placed on changes in institutional or social structures that are required or
induced by an energy system. Institutional and social effects must be
examined in other assessments of the technologies.
Environmental Impacts. The inclusion of direct requirements of energy
for environmental control was discussed in defining system boundaries. No
attempt was made to place energy values on such problems as ecosystem distur
bance or withdrawal of land from natural ecological uses, because these
concerns are outside the realm of net energy analysis.

13
3 ALTERNATIVE ENERGY SYSTEMS
3.1 COAL-BASED SYSTEMS
Both atmospheric fluidized-bed combustion (AFBC) and coal-gasification/
combined-cycle (CG/CC) generation are advanced technologies and are projected
to be available for commercial use in about the same period as a satellite
power system. Appendix B gives a detailed description of the configurations
of these two coal-based systems selected for net energy evaluation.
3.1.1 Atmospheric Fluidized Bed Combustion (AFBC)
The system selected for analysis is a coal-fired AFBC steam generation
system based on a design by the General Electric Company. A 747-MWe system
was assumed, generating 4. 25 x 109 kWhe/yr at a plant capacity factor of
65%.
The total system analyzed includes stripmining of coal, coal prepara
tion and transportation, handling of both coal and limestone, combustion in an
AFBC furnace, and conversion to power in a conventional steam-cycle system
including a steam turbine, generator, condenser, and cooling tower.
Table 3.1 summarizes the energy parameters for the system. The power
plant itself requires most of the capital energy investment, accounting for
85% of the total capital energy. It also requires almost half the operating
energy investment. Other portions of the system are relatively small in the
energy balance.
3.1.2 Coal Gasification/Combined Cycle (CG/CC)
The system studied is a gas-turbine/steam-turbine, combined-cycle
unit, fired by the output of a low-Btu, fludized-bed coal gasifier. The
design, based on a Westinghouse system, is for a 741.5-MWe station generating
4.22 x 10⁹ kWhe/yr at a plant capacity factor of 65%.
The overall system evaluated includes stripmining of coal, coal
preparation and transportation, and the gasifier/cleanup unit, gas turbine,
heat recovery system, and steam-cycle generator.
Table 3. 2 summarizes the energy balance parameters for the system.
As with AFBC, the power plant itself represents the largest energy invest-

Table 3.1. Summary of AFBC Energy Parameters
Annual Primar~ In2ut
System Element Type
Stripmining Coal 2.35 x 10 6
Coal Preparation Coal 2.11 x 10 6
Transportation Coal (Railroad) 1.86 x 10 6
AFBC and Steam Cycle Coal 1.84 x 10 6
TOTAL
alnput to entire cycle.
bOutput from entire cycle.
Energy (101 s J/yr)
54 .629 t
49.166 t
43.266 t
42 .833 t
54.629a
Total Ca2ital In2uts Annual 02eratins lnl!!:!ts
Type Energy (101 SJ)
Type Energy (101 sJ/yr)
Equipment and 1.827 Electricity, fuel, 0.541 Construct ion supplies, maintenance,
reclamation
Machinery, construe- 0.270 Electricity, supplies, 0. 082 tion, water lines maintenance, water
Rolling stock 0.531 Diesel oil 0.342
Equipment, 15.016 Consumables, mainte- 0.780 construction nance, limestone
17. 644 1. 745
Annual Out2ut
Type Energy (l01sJ/yr)
Coal 49 .166 2.llx 10 6 t
Coal 43 .266 1.86 x 10 6 t
Coal 42 .833 1.84 x 10 6 t
Electricity 10 6 kWhe
Gross 4.56 16.455 Internal 0.31 1.129 Net 4.25 15.326
b 16 .455 Gross b Intgrnal 1.129 Net 15 .326
I-' ,I::-.

Table 3.2. Summary of Coal Gasification/Combined Cycle Energy Parameters
Annual Primary Input
System Element Type Energy (l015J/yr)
--Stripmining Coal 41.442
1. 78 x 10 6 t
Coal Preparation Coal 37.298 1. 61 x 106 t
Transportation Coal 32 .822 (Railroad) 1.42 x 10⁶ t
Gasifier/ Cleauup Coal 32.494 1.40 x 10⁶ t
Gas Turbine Low Btu Gas 33.771
Heat Recovery System Exhaust Gas 21.391
Steam Cycle System Steam 14.352
Power Transformer Electricity 16.015
Total Plant
TOTAL 41.442a
ainput to entire system.
binternal use - included in cutout total only.
cOutput from entire cycle. d Internal includes electricity, steam, air, water
Total Capital Inputs
Type Energy (lOlSJ)
Equipment and 1,383 Construction
Machinery, 0.207 construction, water lines
Rolling stock 0.402
------(Included Below)------
Annual Operating Inputs
Type
Electricity, fuel, supplies, maintenance, reclamation
Electricity, supplies, maintenance, water
Diesel oil
Dolomite, internal air. steam, water, electricity
Energy (lOlSJ/yr)
0.410
().062
0.259
0.152 (2.746)b
-------------------------(Includerl Below)--------~----------~-
-------------------------(Included Below)----~-----------------
-------------------------(Included Below)~--------------------
~-----------------------(Included Below)~---------------------
Components 13. 6'·1
15.633
Routine and Special 0 & M
0.206
1.089
Annual Output
Type
Coal 1.61 x 10⁶ t
Coal 1.42 x 10⁶ t
Coal 1.40 x lrf t
Low Btu gas
Internal air, steam Exhaust gas Electricity
Internal steam, water Steam to turbine
Electricity
Electricity 109 kWhe
Gross 4.43 Internal 0.21 Net 4.22
Energy (101SJ/yr)
37.298
12.822
32.494
33. 771
1.663 21.392 10.503
0.657 14.352
5.512
15.938 0.735
15.203
Grosse c d 15.938 Internal ' 3.055 NetC 15.203
I-' l.n

16
ment. The energy balance is somewhat complicated by the internal energy.use:
air, steam, and water are supplied to the gasifier from the gas turbine and
heat recovery system; electricity is supplied from the overall plant output.
In general, the system is more efficient than the AFBC configuration, as it
uses about 25% less coal to deliver about the same amount of electricity.
3.2 NUCLEAR SYSTEM
The nuclear system analyzed is a conventional 1000-MWe light-water
reactor (LWR), assumed to generate 5. 34 x 109 kWhe/yr at a plant capacity
factor of 61%. Appendix C gives the details of this system.
The overall system includes uranium mining, milling, and transporta
tion; conversion, enrichment, and fuel element fabrication; the reactor it
self; spent fuel storage, and waste storage. Ordinary uranium ore, O. 208%
U30a of which 0.71% is u235 with an enrichment tails assay of 0.2%, is
assumed. Reprocessing for recovery of unused uranium and plutonium is not
considered.
Table 3.3 summarizes the energy balance parameters. Althougb the
reactor itself represents the largest energy investment, the enrichment
process is the largest consumer of operating energy, most of which is in the
form of electricity.
3.3 TERRESTRIAL SOLAR ENERGY SYSTEMS
Two terrestrial solar energy systems are considered: thermal and
photovoltaic. Both are advanced technologies and could be available for
commercial use at about the same time as an SPS. Appendix D gives the
details of these systems.
3.3.1 Terrestrial Solar Thermal System
The terrestrial solar thermal system assessed is a 100-MWe central
receiver (power tower), designed by the McDonnell-Douglas Company. Glass
flat-plate heliostats (22,000) on tracking mounts focus sunlight on a receiver
tower. The receiver/boiler and riser/downcomer provide heat and steam to the
storage system and steam turbine; the storage system, designed to even out
fluctuations in solar radiation, contributes about one-third of the input to
the turbine. The turbine/generator and the balance of the electrical system
use conventional components.

Table 3.3. Summary of LWR Energy Parameters
Annual Primarl In~t Total Ca2ital In~ts Annual 02erating In2uts Annual Out!!!:!t
Systea Element Type Energy (1015J/yr)
Type Energy (10l5J)
Type Energy (1015J/yr)
Type Energy (101 SJ/yr)
Uranium Mining Uranium 88.515 Electricity, fuels 0.647 Electricity, fuels, 0.095 Uranium 88.515 137.2 t 111Sterials 137.2 t
Uranium Milling Uranium 88.515 Electricity, fuels, 0.169 Electricity, fuels, 0.118 Uranium 84.084 137.2 t materials materials 130.3 t
Conversion Uranium 84.084 Electricity, fuels, 0.040 Electricity, fuels, 0.220 UFs 84.084 130.3 t materials materials 191. 7 t
Enrichm .. nt UF& 84.084 Electricity, fuels, l.449 Electricity, fuels 4 .069 Enriched uranium 60.515 191. 7 t materials 22.8 t
Fuel Fabrication Enriched uranium 60.515 Electricity, fuels, 0.037 Electricity, fuels, 0.155 Enriched uranium 60.515 22.8 t materials materials 22 .8 t
Reactor Enriched uranium 60.515 Electricity, fuels, 13.323 Electricity, fuels, o.421 Electricity 22.8 t materials 111Ster ials 10 9 kWhe
Gross S.9' 19.933 Internal 0.19 0.700 Net 5.35 19.233
Spent Fuel Storage Depleted uranium NA Electricity, 0,236 Electricity, fuels, 0.007 .NA I-'
22.8 M tons materials materials .......
Waste Storage Depleted uranium NA Electricity, fuels, 0.031 Electricity, fuels 0.008 NA materials materials
Transportation NA Electricity, 0,150 Fuel 0.007 NA materials
--- -- b TOTAL 88.515a 16.082 5.100 Gross b 19.933
Intgrnal 0.700 Net 19.233
8 Input to entire cycle.
bOutput from entire cycle.

18
Table 3. 4 summarizes the energy parameters for the system. The col
lector represents the largest energy investment, accounting for 40% of the
total. Operating energy is in the form of auxiliary electricity that is
generated by the plant itself.
3.3.2 Terrestrial Solar Photovoltaic System
A 1000-MWe (peak) photovoltaic facility, operating 10 hr/ day at a
capacity factor of 55%, was analyzed. The system has limited storage capacity
in the form of lithium/sulfur batteries to compensate for loss of insolation.
The solar cells, assumed to be silicon, occupy an area of 52 km2; they are
fitted with parabolic trough reflectors to concentrate solar radiation.
Output from the cells is controlled by a power-conditioning module consisting
of a DC collection network, regulator, controller, and inverter. An AC
distribution system and a transformer for matching to a utility grid also are
included.
Table 3. 5 summarizes the net energy parameters of this system: the
capital energy investment is overwhelmingly dominated by the energy required
to produce the silicon cells--73% of the total, on the basis of the current
state of the art of silicon manufacture. The implications of projected
reductions in the cost of silicon cells and corresponding reductions in energy
requirements will be discussed later. Steel required for the facility makes
up an additional 17% of the capital energy investment.
3.4 SATELLITE POWER SYSTEM (SPS)
The SPS analyzed is based on the latest concept definition
prepared by NASA under the DOE/NASA SPS Concept Development and Evaluation
Program. 7 Two systems, using silicon cells and gallium aluminum arsenide
cells respectively, were analyzed. Appendix E gives the details of the
systems.
A single 5-GW satellite in geosynchronous orbit, transmitting power to
earth via focused microwave beams, is assumed. The system includes the
ground rectenna, which receives and rectifies the microwave power, and the
launch vehicle and orbital construction equipment. An analysis of the entire
system (projected to use 60 satellites) would prorate the launch vehicles and
other orbital construction equipment over all the satellites rather than

Table 3.4. Summary of Terrestrial Solar Thermal Energy Para~eters
Annual Primarx Ineut
Syat- El-t Type Energy (101 s J/yr}
Collector Solar radiation 10.775
Receiver/Boiler Heat 5.389
Riser/Downcoaer Heat 4 .534
Storage Heat 1. 777
Turbine/Generator Steam 4.221
Transformer/ Electricity 1.257 Power Conditioner
Misc. Equipment
TOTAL 10. 775b
8 0perating inputs as internal electricity use.
binput to entire cycle.
cOutput from entire cycle.
Total Caeital In~ts
Type Energy (101 s J)
Glass, steel, 0.737 concrete
Steel, concrete 0.137
Steel 0.001
Caloric HT43 oil, 0.483 sand, gravel, steel
Equipment 0.324
(Included in turbine/generator}
Electrical equipment, 0.136 cooling tower, water transport
1.818
Annual Operating Inputs Annual Output
Type Energy (101 SJ/yr)
Type Energy 001 s J/yr}
---------(Included Below}a------~ Heat
Heat
---------(Included Below)a ________ Heat to storage Steam to turbine
---------(Included Below) 8-------- Steam to turbine
. a -~------(Included Below} -------- Electricity
10 8 kWhe
3.62 0.13
To transformer 3.49
•
Gross Internal
Electricity Net 3.42 x 10⁸ k'Wh
e
Grosse Internalc NetC
5.389
4.534
1.777 2.711
1.510
1.303 0.046 1.257
1.230
1.303 0.046 1.230
..... \0

Table 3.5. Summary of Terrestrial Solar Photovoltaic Energy Parameters
Annual Primarx In2ut
Syat- Element Type Energy (1015J/yr)
Collector Solar radiation 115.048 10 kWhe
Power Regulator, Electricity 7.830 Controller, DC 2.18 Collection Network
Battery Electricity 2.508 0.70
Inverter Electricity 7.171 1.99
AC Distribution Electricity 6.814 Line System 1.89
Transformer Electricity 6.576 1.82
Entire Plant
TOTAL 115.048c
aBased on state-of-the-art silicon production.
bOperating inputs as internal electricity use.
cinput to entire cycle.
dOutput from entire cycle.
Total Ca2ital In2uts
Type Energy (1015 J)
Silicon 94. 5803
Copper 0.027
Lithium 6.480
Equipment 1.370
-------(Included Below)-------
Equipment 1.940
Electrical equiplll!nt, 24.566 steel, concrete
---128.963
Annual 02eratin& In2uts Annual Outet
Type Energy (lOISJ/yr)
Type Energy c1015J/yr)
109 kWhe
--------(Included Below) b --------- ----Electricity 2.18 7.830
--------(Included Below)b ________ Electricity To Battery o. 70 2.508 To Inverter 1.43 5.165
--------(Included Below)b ________ Electricity To Inverter 0.56 2.006
Electricity 1.89 6.814
Electricity Gross 1.89 6.814 Internal 10.07 0.238 To transformer 1.82 6.576
Electricity Net 1.81 6.508
b d -- Gross d 6.814 Internal 0.238 Netd 6.508
N 0

21
just the first one, but insufficient information was available to do so in the
present study. The results, however, would not change much because vehicles
and construction equipment make up a very small portion of the total materials
energy required, and because the rocket fuel, which is a much larger portion
of the construction energy required, was assessed for a single satellite
only.
The energy parameters are summarized in Table 3.6. The energy needed
for production of silicon cells dominates the balance, as was the case
for terrestrial solar photovoltaic. The rectenna is the next largest consumer
of capital energy for SPS/Si (it is the largest for SPS/GaAlAs) because of the
aluminum and steel required.

Table 3.6. Sununary of SPS Energy Parameters
Annual PrimarI In2ut Total Ca2ital ln:2!,!tB Annual Operatin& In~ts Annual Out2ut
Syatem Element Type Energy (1015 J/yr)
Type Energy (1015 J)
Type Energy (1015J/yr)
Type Energy (1015J/yr)
Solar Energy Collection 109 kWhe System
Si Solar Radiation 2079.410 Electricity 74 .05 266.570 GaAlAs Solar Radiation 2107.530 Electricity 74.05 266.570
Power Distribution Electricit~ 266.570 Electricity 66.77 240.360 System 74.05 x 10 kWh e
Microwave Power Electricitl 240.360 Electricity Transmission System 66.77 x 10 kWh Gross 40.33 145.180
e Internal NA NA Net 40.33 145 .180
System Components Satellite Si Materials 406.906
GaAlAs Materials 37.393
LEO/GEO Si Materials 6.564 Construction GaAlAs Materials NA !'.)
!'.)
Flight Si Materials 13.504 Vehicles GaAlAs Materials 1.462
Rectenna Materials 118.553
Other Si Materials 325.719 GaAlAs Materials 28.816
Entire System Si Materials a. 112
GaAlAs Materials 1.864
--- --2079.410a 871.246
b Gross 145.180c TOTAL Si 8.712b GaAlAs 2107 .530a 186.224 1.864 Internal NAd
Net 145 .180c
8 Input to entire system. b
Based on 30% of capital materials a~ortizeu over 30 year lifetime.
cOutput from entire system.·
dNot available.

23
4 RESULTS OF ANALYSIS
4.1 BASELINE CASE
Table 4.1 sununarizes the energy inputs and outputs described in Sec. 3
for each of the systems considered. Because of the variation in system size
(100 MWe for terrestrial solar thermal to 5000 MWe for SPS) and plant capacity
factors, the values are not directly comparable. (In the net energy balance,
discussed below, these differences disappear because the parameters of in
terest are normalized.)
All net output values are expressed in terms of electricity rather than
as thermal equivalents; the importance of this will become apparent later.
Likewise, all primary inputs are expressed as energy content of the fuel
itself, with no adjustment factors applied. The capital and operating inputs,
however, are computed using the net energy analysis techniques described in
Sec. 2 and reflect both the energy cost of delivering materials to the
facility and the energy content of the materials themselves.
The internal energy use includes electricity, compressed air, and
steam. These differences in energy form, plus the differences in where
internal electrical power is tapped in each system configuration, yield the
consequence that the net output is not simply the difference between gross
output and internal energy use.
Table 4. 2 shows the energy balance parameters for the seven systems.
The coal and nuclear systems are substantially more efficient than their solar
counterparts in terms of gross, operating, and lifetime efficiency. However,
the coal and nuclear systems operate from a nonrenewable resource base,
whereas the solar energy systems operate from a renewable and effectively
unlimited resource base, but the cost of resource depletion does not enter the
calculation of efficiency. The three different measures of efficiency
do not differ significantly because the numerator of each measure reflects the
system output and the denominator includes the primary input, with various
combinations of internal use and opera~ing and capital inputs. The annual
primary input is much larger, for all systems, than the annual operating input
and internal use; also, the primary input is much larger than the capital
input when both are expressed over the system lifetime for the lifetime
efficiency calculation. The implication is that the efficiency with which the

Table 4.1. Summary of System Energy Inputs and Outputs
Energy, 1015 J
Coal Nuclear Terrestrial Solar SPS --AFBC CG/CC LWR Thermal Photovoltaic S· 1 GaAlAs
747 MWe 741.5 MWe 1000 MWe 100 MWe 1000 MWe 5000 MWe 5000 MWe
Annual Primary Input 54.629 41.442 88.515 10.755 115. 048 2079.410 2107.530
Total Capital Input 17.644 15.633 16.082 1.818 128.963 871. 246 186.224
Annual Operating Input 1.745 1.089 5.100 _c -C 8. 712 1.864
Annual Outputs
Grossa 16.455 15.938 19.933 1.303 6.814 145.180 145.180
Internal Useb 1.129 3.055 o. 700 0.046 0.238 NA NA
Neta 15.326 15.203 19.533 1.230 6.508 145.180 145.180
aExpressed as electricity,
brnternal includes electricity, ait, steam. Because of differences in where the internal energy use is tapped from the system, the net output is not necessarily equal to the difference between gross and internal.
Cinternal electricity only.
""' .i:-

Table 4.2. Summary of Energy Balance Data
Coal Nuclear Terrestrial Solar SPS
Parameter AFBC CG/CC LWR Thermal Photovoltaica Silicona GaAlAsa
1. Gross Efficiency, % 28.1 36.7 21. 7 11.4 5.7 7.0 6.9
2. Operating Efficiency, % 26.7 33.4 20.4 11.4 5.7 7.0 6.9
3. Operating Ratio 5.33 3.67 3.32 26.74 27.34 16.67 77.89
4. Lifetime Efficiency, % 26.4 33.0 20.3 11.3 5.4 6.9 6.9
5. Lifetime Ratio 4.43 3.26 3.04 11.54 1.43 3.85 17.97
6. Payback Period (Electric Basis), yr 1.30 1.11 1.14 1.48 19.82 6.38 1.30
8 The data for the solar energy systems are limited and, in some cases, highly uncertain. There- ....., fore, conclusions should be drawn with caution. VI

26
primary energy resource is converted into electricity is relatively insensi
tive to the ancillary operating energy inputs and the capital energy· inputs
for these systems. The thermal or electric conversion efficiency of the
system is thus the principal factor in determining system performance.
The situation is different with regard to the operating ratio and the
lifetime ratio, both of which are computed without consideration of the
primary resource input. Operating ratios of the solar energy systems are much
higher than those of coal and nuclear systems, indicating that much less
energy is used annually to convert each unit of primary resource into elec
tricity. Over the lifetime of each system, however, the result changes
dramatically. For the coal and nuclear systems, the operating and lifetime
ratios differ by, at most, 17% (for AFBC), whereas for the solar energy
systems, the difference is 57%-95%. The terrestrial photovoltaic and the
SPS/Si systems show· lifetime ratios that are lower than the best coal system
(AFBC), whereas the terrestrial solar thermal and the SPS/GaAlAs systems have
both operating and lifetime ratios higher than those of the coal and nuclear
systems. The implication is that the capital energy investment required to
build each of the solar energy systems greatly reduces the net useful output
of the systems over their lifetimes. This is not true of the coal and nuclear
systems because the capital energy investments required are not as great
relative to the energy output. For the terrestrial photovoltaic and the
SPS/Si systems, the decrease in net output makes them poorer performers than
the best coal system. (As will be shown later, this is the result of the
silicon production requirements.)
In contrast to the measures of efficiency, operating and lifetime
ratios are relatively sensitive to the ancillary operating, internal, and
capital energy requirements. Small changes in these data can make relatively
large changes in the ratios. Therefore the ratio calculations must be viewed
as only rough gauges of system performance.
The energy payback period of each system is a somewhat less sensitive
measure of overall energy balance. The payback period for all systems except
the terrestrial photovoltaic and SPS/Si is less than 1.5 yr, indi!cating that
five of the systems will deliver significantly more energy over their nominal
30-yr lifetimes than was required to build them. Because the calculation is
relatively insensitive to moderate changes in the data, it can be inferred

27
that payback from these systems is reasonable; but the results are so similar
among the five systems with short payback periods that they do not provide a
clear basis for choosing among these systems.
The results are not encouraging for the terrestrial photovoltaic and
the SPS/Si systems. The SPS/Si system requires over six years of operation to
return the energy invested--more than four times longer than the worst of the
other systems. Although this is not necessarily an unacceptable situation, it
does demand closer investigation of the possibility of reducing the capital
energy required. The terrestrial 'photovoltaic system requires almost 2/3 of
its entire lifetime to repay the energy investment. This slow payback,
combined with a lifetime ratio of 1.43--little more than the breakeven point
of 1.0--leads to some serious concern over the viability of such a system, at
least in the configuration used here.
In the following sections, the uncertainties in some of the data
used in this baseline analysis will be considered, and different approaches to
net energy analysis will be discussed, to illustrate the sensitivity of the
results to alternative data and methods.
4.2 EFFECT OF UNCERTAIN DATA
4.2.1 Energy Intensity of Silicon Cell Production
For both the terrestrial photovoltaic and SPS/Si systems, the rela
tively poor performance compared to the other systems was traced to the very
high energy requirements of silicon cell production. As shown in Appendix A,
the energy requirements for silicon solar ·cell production vary over a wide
range (1.0 x 10³ to 26.0 x 10³ kWht/kg).1,2,8,9 The value used in the base
line case, 13.9 x 10³ kWht/kg, is derived from Ref. 9 and falls in the middle
of the range. This value represents the cur~~nt state of the art in silicon
production technology. Substantial reductions in the cost of silicon cell
production, and presumably in the energy required, are projected for the
period when SPS is to be operational. Therefore, the impact of these reduc
tions on the energy balance needs to be investigated.
Figure 4.1 shows the effect of using different levels of silicon energy
intensity on the energy parameters. Because of the dominance of the primary
energy input, there is essentially no effect on the lifetime efficiency.

20
10
40
30
20
10
28
SPS/Si
PAYBACK PERIOD (YRS)
TERRESTRIAL SOLAR PHOTO VOLTAIC
LIFETIME EFFICIENCY (%I
- ...s;:_ -' .. , LIFETIME RATIO
.A. HIGH e BASE • JPL 't' LOW
--------· ---- _L._ __ .. o ...... ~..__~..._~...._~...._-'-;;;.o;,._;;;.;;=-~~~-
Fig. 4.1.
o 5 10 15 20 25 30 SILICON ENERGY REQUIREMENTS, 10 3 kwh1/k9
Variation of Net Energy Parameters with Silicon Energy Requirements
The lifetime ratio and the payback period could be significantly altered by
reductions in this production energy. By asswning the silicon production
energy used in Ref. 2, the SPS payback period is reduced to just over two
years, and that of the terrestrial photovoltaic system to just over eight
years. Use of the lowest estimates of production energy would put the SPS/Si
system into the same payback class a·s the other energy systems and give the
terrestrial photovoltaic system a somewhat more acceptable payback period of
just over six years.
The difference between the SPS/Si and the terrestrial photovoltaic
system occurs because the SPS/Si system would operate 24 hr/day, as compared
to about 8-10 hr/day for the terrestrial system, and after the capital energy
investment has been made in the silicon cells, the SPS would use the material
more intensively and thus more efficiently.

29
4.2.2 Cell Lifetime
A fair amount of uncertainty exists as to the lifetime of silicon
cells, either in geosynchronous earth orbit (GEO) or in the terrestrial
environment. Reference 9 indicates a cell lifetime of ten years in terrestrial
applications; Ref. 7 assumes a 30-yr lifetime in orbit with some cell repair
necessary. Obviously, a three-fold difference in eel 1 lifetime and, concom
itantly, in the amount of silicon required, will affect the net energy balance
similarly to a changed energy intensity of cell production. Experience is as
yet insufficient to allow determination of the most realistic expected life
time. For the purpose of this study it was assumed that the cells in both
SPS/Si and terrestrial photovoltaic systems would have a 30-yr lifetime.
4.2.3 Energy Supply for Silicon Production
Most of the energy required for silicon production is needed as
electricity for growing the crystals.9 All of the estimates of production
energy cited above consider the electricity to be supplied by conventional
generators; thus all are limited by the thermal conversion efficiency of such
equipment. (For input/output analysis as described in Appendix A, the
energy cost of providing electricity is approximately four times the amount of
electrical energy provided.) One method of reducing the energy requirements
for silicon production would be to provide the electricity for cell manufac
ture from solar-power facilities instead of conventional fossil fuel or
nuclear facilities. This would, in effect, reduce the silicon energy require
ments by a factor of four. To account for this reduction, a dynamic analysis
of the development of an entire solar electricity system would be needed,
instead of the individual facility analysis made here. Although such a
dynamic analysis is not within the scope of this study, a rough estimate of
the impact of such a scenario may be obtained by simply viewing the use of
solar electricity as a four-fold decrease in energy intensity and using Fig.
4 .1 to determine the effect on the parameters. A four-fold decrease in the
value used in this study for silicon production would reduce the payback
period from 19.8 yr to about 9 yr for terrestrial photovoltaic, and from 6.4
yr to about 2 yr for SPS/Si. With a four-fold decrease in the lowest estimate
of silicon production energy, the payback would be about six years for terres
trial solar and one year for SPS/Si. (Reductions of smaller magnitude could
also be realized for all the other systems if solar electricity were substi
tuted for conventional electricity.)

30
4.2.4 Quantity of Silicon Required
There is also some uncertainty, al though of smaller magnitude, with
respect to the amount of silicon required per MW of electrical output. Table
4.3 summarizes some of the different estimates. None of the different values
would lead to a substantial difference in the outcome of the analysis, with
the exception of the values for the average rather than peak power output for
the terrestrial systems.
rating were used.
In thi~ analysis only values for the peak power
4.2.5 Energy Intenstity of GaAlAs Cell Production
Uncertainties about the energy requirements for product ion of gallium
alluminum arsenide photovoltaic cells are much greater than the uncertainties
about silicon. None of the other analyses of net energy for solar systems
included GaAlAs as a candidate system, so very little information is avail
able. The data for this study were based on Ref. 8; no other sources were
discovered in the course of this preliminary review. The estimated energy
intensity of 5. 5 x 10³ kWht/kg is about half as much as that required for
silicon production. The quantity of GaAlAs required is almost an order of
magnitude less (1696 t versus 13,813 t), primarily as the result of the higher
efficiency GaAlAs and the use of concentrators in the cell configuration. It
appears that GaAlAs cells require a much smaller energy investment than
silicon cells (34 x 1015 J versus 691 x 1015 J) for the same energy output.
Table 4.3. Differences in Silicon Requirements
Silicon Capacity Required Intensity
System (MWe) (t) (t/MWe) Reference
SPS/Si 480,000 698,000 1.45 JPL2
SPS/Si 5,000 13,813 2.76a NASA7
Terrestrial Photovoltaic (Peak) 4,500 ll,000 2.44 EPA9 (Average) 900 11,000 12.22
Terrestrial Photovoltaic (Peak) 1,000 1,890 l.s9a,b EPAlO
aused for this study.
bBased on use of parabolic concentrators.
31
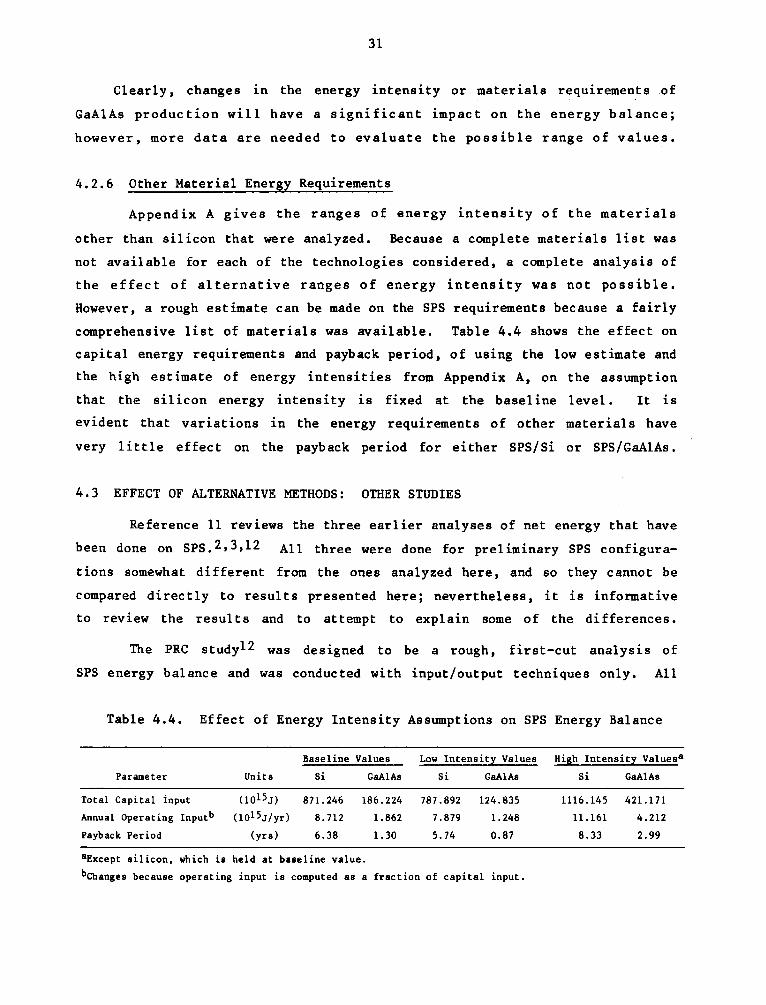
Clearly, changes in the energy intensity or materials requirements of
GaAlAs production will have a significant impact on the energy balance;
h~wever, more data are needed to evaluate the possible range of values.
4.2.6 Other Material Energy Requirements
Appendix A gives the ranges of energy intensity of the materials
other than silicon that were analyzed. Because a complete materials list was
not available for each of the technologies considered, a complete analysis of
the effect of alternative ranges of energy intensity was not possible.
However, a rough estimate can be made on the SPS requirements because a fairly
comprehensive list of materials was available. Table 4.4 shows the effect on
capital energy requirements and payback period, of using the low estimate and
the high estimate of energy intensities from Appendix A, on the assumption
that the silicon energy intensity is fixed at the baseline level. It is
evident that variations in the energy requirements of other materials have
very 1 ittle effect on the payback period for either SPS/Si or SPS/GaAlAs.
4.3 EFFECT OF ALTERNATIVE METHODS: OTHER STUDIES
Reference 11 reviews the thre.e earlier analyses of net energy that have
been done on SPS. 2•3,12 All three were done for pre 1 iminary SPS configura
tions somewhat different from the ones analyzed here, and so they cannot be
compared directly to results presented here; nevertheless, it is informative
to review the results and to attempt to explain some of the differences.
The PRC studyl2 was designed to be a rough, first-cut analysis of
SPS energy balance and was conducted with input/output techniques only. All
Table 4.4. Effect of Energy Intensity Assumptions on SPS Energy Balance
Baseline Values Low Intensity Values High Intensity Valuesa
Parameter Units Si GaAlAs Si GaAlAs Si GaAlAs
Total Capital input (1015 J) 871.246 186.224 787.892 124.835 1116.145 421.171
Annual Operating Inputb (lol5J/yr) 8. 712 1.862 7.879 1.248 11.161 4.212
Payback Period (yrs) 6.38 1.30 5. 74 0.87 8.33 2.99
aExcept silicon, which is held at baseline value.
bchanges because operating input is computed as a fraction of capital input.

32
SPS components were represented by cost figures and were converted to energy
requirements using the standard approach. The calculation for a 5-GWe satel
lite using GaAlAs cells and a rectenna site, showed a capital energy require
ment of 465 x 1015 J. This can be compared to the current study's estimate of
186 x 1015 J for the same size satellite and rectenna. The difference can be
traced primarily to the energy intensity values used in the two studies. The
PRC analysis used strictly system component costs, whereas the present current
study used a materials list. Also, the materials and cost requirements are
different for each system because of an evolving system definition. If the
PRC estimate of capital energy is translated into a payback period on the same
basis as in the current study, the result is 2.5 years, which is comparable to
the 1.3 years computed here.
The Herendeen study3 was conducted for an entire SPS consistin~
of ll2 silicon-cell satellites of 10 GWe each. Several energy ratios are
presented; the one that is closest to the lifetime ratio used here is referred
to as the "Energy Ratio, at 3413 Btu/kWe, fuel excluded •11 This refers to
the fact that the system output is expressed as electricity, and does not
consider the efficiency of conventional power plants that generate the input
electricity. The "fuel excluded" indicates that the primary resource input is
not included in the calculation. Both of these assumptions are the same as
those used in the present study to compute lifetime ratio. Herendeen's
analysis shows a range of energy ratios from 0.5 to 3.9, using a randomized
uncertainty in energy intensity; the present study shows a lifetime ratio of
3.85. Considering the major difference in the assumption about silicon cell
life, the values are surprisingly close. Herendeen considers an exponen-
tially decreasing power output as the cells deteriorate over the system
lifetime; however, this study assumes constant power output with cell repairs
over a 30-yr 1 i fe time. Because the lifetime energy ratio is a relatively
sensitive parameter, small changes in data make significant changes in the
ratios.
The JPL study2 is also for an entire SPS including 48 satellites of 10
GWe each. It also is based on an earlier system design using silicon cells
only. JPL computed energy intensity values by starting with process energy
requirements for materials and multiplying by a factor of 2.5 to derive
total materials of energy requirements, instead of using an input/ output
analysis based ·on economic costs. The JPL study used a multiplier of 4 to

33
convert input electricity to total thermal energy equivalents, and a multi
plier of 3 to convert output electricity to thermal equivalents. The first
multiplier is basically consistent with the approach used here; but the second
multiplier is not. Although it can be argued that the SPS output should be
compared to the energy required to deliver that electricity from conventional
generators, the across-the-board multiplication of the output by a factor of 3
appears arbitrary. Rather, it would seem more appropriate to consider the
energy ratios as "joules of electricity output per joule of energy input" and
to consider the payback period as the time over which the useful electrical
output equals the useful thermal and electrical inputs. The JPL study2 shows
a payback period of 1.2 to 1.6 yr, depending on the rectenna materials chosen.
If the factor of 3 were removed from the output energy, then the payback
period would be 3.6 to 4.8 yr. This is comparable to the 6.4 yr reported
here. The reason for the difference lies primarily in the values used for
energy requirements for silicon production. The JPL value2 is signifi
cantly lower (2. 9 x 10³ kWht/kg versus 13. 9 x 10³ kWht/kg) and represents
projected improvements in the state of the art. Moreover, the quantity
of silicon required is substantially less (1.45 t/MWe versus 2. 76 t/MWe).
These two factors yield the result that in the JPL study2 the SPS energy
balance is more heavily dominated by the choice of aluminum or steel for the
rectenna than by the silicon requirements.

35
5 CONCLUSIONS AND RECOMMENDATIONS
Three preliminary conclusions can be drawn from the present analysis.
First, the calculation of system efficiency shows that 'the coal and nuclear
systems are 2 to 5 times more ef.ficient at extracting useful energy from
the primary resource base than are the solar energy systems. This efficiency
difference remains whether one uses gross, operating, or lifetime parameters;
it derives primarily from the electrical conversion efficiencies of the
systems. However, because efficiency parameters cannot take into account the
fact that the solar energy systems operate from a renewable and effectively
inexhaustible resource base, whereas the nuclear and coal systems operate from
a nonrenewable resource base, one must conclude that efficiency is not a good
measure of comparability between the solar and the coal and nuclear systems.
Second, the operating ratio calculation shows that the solar energy
systems require substantially less operating energy per unit of electrical
output than do the coal and nuclear systems. Even the poorest of the solar
energy systems (SPS/Si) has an operating ratio more than three times better
than that of the best coal system (AFBC). The lifetime ratio, however, is
greatly reduced (by 57%-95%) below the operating ratio because of the inten
sive capital energy investment. For SPS/Si and terrestrial photovoltaic, the
reduction is enough to drop them below the best coal system in performance.
Third, the payback period is less than 1.5 yr, except for the terres
trial photovoltaic system (19.8 yr) and the SPS/Si (6.4 yr). In both cases,
this poor performance is caused by the energy required for silicon cell
production. Several possibilities, including reduction in the energy required
for cell production, the use of solar-generated electricity in place of
conventional electrical power, increased cell lifetime, and decreased silicon
requirements, could reduce the SPS/Si payback period to a level that is
comparable with the other systems considered (1-2 yr). However, for the
terrestrial photovoltaic system, it appears that even the best combination of
conditions would still require a payback period significantly longer than
those of the other options (about 6 yr). (This is not necessarily a reason to
consider terrestrial photovoltaic systems undesirable, as net energy balance
is only one of several decision parameters.)

36
Concerning the application of these results, it can be concluded
that the energy payback period is a significant decision parameter only
with respect to the choice of SPS/Si or terrestrial photovoltaic systems
over the other systems, For the others, the computed payback periods are
so close as to be well within the range of error of the data, and it can be
concluded that there is no difference, The operating and lifetime ratios
show the expected results that the solar systems require much less operat
ing energy than the coal or nuclear systems but that the capital energy
requirements greatly reduce this advantage. The terrestrial photovoltaic
system is the poorest performer in this category. Although the efficiency
calculations show the conventional systems to have higher efficiencies than
the solar systems, the nature of the renewable versus nonrenewable resource
base makes the cross-comparison difficult.
Recommendations for future activity include the following:
1. No further analysis is recommended for the coal, nuclear, and terrestrial solar thermal systems, because their payback periods are so similar; little can be gained by further comparisons of SPS with these systems.
2. More detailed assessment of energy requirements for production of silicon cells is needed, because the results for SPS/Si and terrestrial photovoltaic systems depend so heavily on this energy input. A study of the potential for reducing such energy consumption is recommended, and the net energy balance parameters for SPS/Si and terrestrial photovoltaic should b.e recomputed using the results of that study.
3. The energy inputs required for production of GaAlAs cells need study, and the net energy balance parameters for SPS/GaAlAs should be recomputed with the resulting new information. The information available at present is extremely limited, and although it suggests a very short payback period the level of uncertainty dictates that it should be examined more carefully.

37
REFERENCES
1. Frabetti, A.J., Jr., et al., Application of Net EnePgy Analysis to ConswneP Technologies, Report No. DSI 047, Development Sciences Inc., East Sandwich, Mass (Dec. 22, 1976).
2. Livingston, F.R., et al., Satellite POIJJeP System PPelimninaPy Resource Assessment, Document No. 900-805, Rev. A., Jet Propulsion Laboratory, Pasadena, Calif. (Aug. 7, 1978).
3. Herendeen, R.A., 'l'l..Jo Technologies Near the Net Energy Limit: Gasohol and SolaP Satellite POl.iJer Station, Energy Research Group, University of Illinois at Champaign-Urbana (Aug. 1978).
4. Fraley, D.W., C.L. McDonald, and N.E. Carter, A Review of Issues and Applications of Net Energy Analysis, Battelle Pacific Northwest Laboratories, PNL-SA-6619 (May 1978).
5. Herendeen, R.A., and C.W. Bullard III, EnePgy Costs of Goods and Ser>Viaes 196J and and 296?, CAC Document No. 140, Center for Advanced Computation, University of Illinois at Champaign-Urbana (Nov. 1974).
6. Meyers, A.C., and A.E. Hildebrandt, Solar TOIJJera-Theromal Collection EnePgy Component-10 !.fie Pilot Plant, Proc. of the 1977 Annual Meeting, American Section of the International Solar Energy Society, Vol. 1 (1977).
7. Satellite POIJJeP System Concept Development and Evaluation PPog'Y'QTTI Reference System Report, DOE/ER-0023, U.S. Department of Energy (Oct. 1978).
8. Woodcock, G.R., SPS Cost Conside1'ation, Journal of Energy, Vol. 2, pp.196-202 (July-Aug. 1978).
9. Gandel, M.G., et al., Assessment of Large-Saale Photovoltaic Materials PPoduation, Report No. EPA-600/7-77-087, U.S. Environmental Protection Agency, Industrial Environmental Research Laboratory, Cincinnati, Ohio (Aug. 1977).
10 • Sears, R.D., D.V. Merrifield, and M.M. Perry, Environmental Impact Statement fop a Hypothetical 1000 Mt/e Photovoltaic Solara-EleatPic Plant, Report No. EPA 600/7-77-085, U.S. Environmental Protection Agency, Industrial Engineering Research Laboratory, Cincinnati, Ohio (Aug. 1977).
11. Kotin, A.D., Satellite POIJJer System White PapeP on ResouPce RequiPements, Report No. SA-3, DOE/NASA SPS Concept Development and Evaluation Program, (Oct. 1978).
12. Bloomquist, C.E., A SuPvey of Satellite POIJJeP Stations, Report No. DSE/ 2071-1, Planning Research Corporation, Los Angeles (Sept. 1976).

38
13. Personal communication with John M. Blocher, Jr. Research Associate, Materials Development Section, Battelle Columbus Laboratory (Nov. 1979).
14. Personal communication with Ralph Lutwock, Jet Propulsion Laboratory (Nov. 1979).
15. Blocher, J.M., Jr., and M.F. Browning, Evaluation of Selected ChemicaZ Processes for Prooduotion of LOl.J-Cost SiZicon, DOE/JPL 954339-78/11 (July 9, 1978).

39
APPENDIX A DETAILS OF THE METHODOLOGY

41
A.l BASIC STRUCTURE
The energy technology system to be analyzed is first described as a
series of elements that fall into the following categories:
Resource Extraction Processing Transportation Conversion Environmental Control .
In the present analysis, the system boundary extends from the basic
resource (e.g., coal in the ground or incident solar radiation) to the genera
tion of electricity at the power plant. Specifically excluded from the
analysis are the energy costs of exploration for resources and of research and
development; these are beyond the scope of this preliminary evaluation.
Figure A. l gives the basic structure of the net energy balance applied
to each element of the system. The principal flows are the primary resource
input; the ancillary operating inputs; the capital inputs; and the gross,
net, and internal use outputs. The net output of one system element becomes
the primary resource input to the next element in sequence.
The primary resource input is measured by a physical quantity and an
energy content. In the case of coal, for example, the physical quantity 1s
the tonnage of coal moved through the system; the energy content is the
heating value of the coal. In the case of heat flow from a solar collector,
the physical quantity is the volume of air or heat-exchange fluid, and the
energy c"ontent is the heat content.
Ancillary operating inputs (A) are divided into three categories:
electricity, fuels, and materials. These inputs represent the requirements
for operating the system element on a daily basis. The ancillary electricity
energy content (AEE) is the electricity that must be purchased from outside
the element to run machinery, operate instruments, or provide energy for the
process. In keeping with standard practice on net energy analysis, the energy
content of the ancillary electricity must have associated with it an ancillary
energy cost (AEC) that reflects the primary fuel resource required to
generate that electricity. Details of this calculation are described in
Sec. A.3.

Physical Quantity:
Energy Content:
Energy Cost:
Ancillary Operating Inputs, A Capital Inputs, C
Electricity Fuels Materials Electricity Fuels
AFQf ·. AFQn AMQl ... AMQn CFQ1 ... CFQn
CFE1 CF~!l
Ci<\ ... CFCn
AEE
Primary Resource In out
Physical Quantity: PQ
PE Energy Content:
Physical Quantity:
Energy Content:
Resource Lost
RQ 0
RE 0
System
Element
Losses
CEE
CEC
Byproducts
BQr •. BQn
BE1 ... BEn
In_ternal , I Use IE
Gross Ou tout
GQ
GE
Energy Lost
LE1 ..• LEn
Fig. A.l. Schematic Chart of System Element Energy Balance
Materials
CMQl • •• CMQn
CMClT . : . CMCn
Net Output
NQ
NE
~ N

43
Ancillary fuels (AF) input into the system element are measured by
three parameters: AFQ, the physical quantity (e.g., m3 of natural gas or gal
of fuel oil); AFE, the energy content (e.g., the heating value of the fuel);
and AFC, the energy cost required to produce and deliver the fuel to the
system element. The first two items require straightforward calculations;
Table A.l presents the fuel heating values used here. To determine the
conversion from physical units to energy costs requires the use of input/output
analysis, which is also described in Sec. A.3.
Ancillary materials (AM) input is measured by AMQ, the physical quan-
tity (e.g. tons of steel or tons of concrete). By definition, there is no
heating value in the material itself. The energy cost (AMC), is the energy
required to produce and deliver the material to the plant site. This is
calculated using input/output analysis or the material energy intensities
described in Secs. A.2 and A.4, respectively.
Capital inputs (C) represent the energy required to construct the system
element. They are entirely analogous to the ancillary operating inputs,
except that they are input over the lifetime of the system, in contrast to
the annual inputs represented by the primary resource inputs and ancillary
operating inputs. To incorporate capital inputs into the analysis, they are
Table A.l. Fuel Heating Values
Fuel
Heavy Diesel Fuel Diesel and Light Fuel Gasoline Other Petroleum Products Oil
Coal Uranium
Natural Gas
Heating
109 J/m3
41. 7 38.7 34.8 40.3 36.5
107 J/kg
2.32 64,520
107 J/m3
3.92
Value
Btu/gal
149,690 138,690 124,952 144,405 131,000
Btu/lb
10,000 211. 6 x 10⁶
Btu/ft3
1,051

44
either annualized, by dividing hr the system lifetime, or the other inputs are
multiplied by system lifetime to obtain total energy flows. The simplifying
assumption is used that level of operation is constant over the system life-
time. This is not an accurate reflection of actual conditions, but will
suffice for this preliminary analysis.
Gross output (G) is the form of energy that results from operation of
the system element. (Output may be in the same form as the primary resource
input or it may be in a different form if the system element is a conver
sion process.) The internal use (IQ) is that quantity of the output product
that is consumed internally (e.g., electricity from a power plant used to run
equipment). The net output (NQ) becomes the primary resource input to the
next system element.
Losses are included in the diagram for the sake of completeness, but
they are not used directly in any of the calculations; they are derived
quantities computed by balancing inputs and outputs.
The expressions for the energy balance parameters can be presented
in terms of these energy flows (meaning of abbreviations is shown in Fig. A.l)
as follows:
System Primary Resource Input
Ancillary Operating
Inputs
Capital Inputs
Internal Use
=
=
=
=
PE0 (Input to first system element)
L re L L ~CJ A "" + AFC +
elements fuels materials
c = L [CEC + L CFC + L ~CJ elements fuels materials
IQ =L IE
elements

System Net
Output
System Lifetime
Gross Efficiency
Operating Efficiency
45
= NEf (Net output from final system element)
= T
=
-
NE f
PE 0
NEf PE + A + IQ
0
Operating ,. NEf Ratio
Lifetime Efficiency
Lifetime Ratio
Payback Period
A+ IQ
NEf x 't
= (PE 0
+ A + IQ) x
NEf x 't
• (A + IQ) x 't +
= c
NE - A f
c
't + c
Note that the numerator in the operating and lifetime efficiency and
ratio equations includes net output only and the denominator includes internal
use. This is standard net energy analysis formulation and is based on the
consideration that if the internal use energy were not supplied by the system,
it would have to be supplied by another source. '11lerefore, it must be treated
as an additional operating energy requirement.

46
A.2 INPUT/OUTPUT ANALYSIS
The details of an input/output analysis applied to net energy evalua
tion have been described in several studies.l The process involves the
development of energy intensity values (expressed in Btu/$) that represent the
quantity of energy required per unit of output of a given product. Basic data
used in many studies comes from work done by Herendeen and Bullard,5 in which
a 357-sector input/output model of the U.S. economy was constructed and used
to develop energy intensity values. These values are expressed in terms of
the primary energy resources (coal and crude oil) and electricity required to
deliver a given dollar value of materials or finished product. The elec
tricity values are in terms of the U.S. national average of primary re
sources required for electricity generation, given the structure of the U.S.
utility system.
Application of the input/output technique followed the procedure
outlined by DSI, Inc.l In this procedure, several adjustments were made to
the basic data from Herendeen and Bullard, which were derived for U.S. condi
tions in 1967. First, the electricity requirements were modified to account
for a change in the structure of the utility system through the introduction
of more nuclear and hydroelectric power since 1967. Second, the energy
intensity of U.S. industry, which has changed since 1967, was factored in by
adjusting the 1967 data by the energy consumption per dollar of GNP. Third,
inflation was accounted for by adjusting the 1976 energy intensity values (Btu
per 1967 dollar) to 1974 or 1975 dollars, depending on the data used. The
inflation rates for various sectors of the economy were used to make the
adjustment more accurate for the period 1967-1974. Only one set of factors
was available to adjust from 1974 dollars to 1975 dollars; these are sum
marized in Table A.2.
These revised 1974 and 1975 energy intensity values were used for those
system components that were expressed in terms of cost. For material com
ponents the energy intensities per physical quantity (i.e., kWht/kg) given in
Sec. A.4 were used.
A.3 COMPUTATION OF ENERGY COSTS
In many of the data sources used for the various systems, some of
the operating energy and/or capital energy requirements are reported in

47
Table A.2. Adjustments to Energy Intensity for Input/Output Analysis
Cause of Adjustment
Structure of Utility Sector
Energy Intensity of Industry
Inflation (1967-1974)
Inflation (1974-1975)
Cost Adjusted
Electricity
Coal Crude Oil Electricity
Coal Crude Oil Electricity
Coal Crude Oil Electricity
avaried with economic sector (see ref. 5).
Factor
0.61652
0.8838 1. 0150 1.7869
_a _a _a
0.9203 0.9203 0.9203
physical units (e.g., kWh of electricity, bbl of oil, m3 of gas). It 1s not
adequate, however, to include only the energy content of the fuels 1n the
energy balance; an accounting of the energy required to produce and deliver
those fuels is necessary also. The input/output methodology of Refs. 1 and
5 provides coefficients that permit computation of the energy costs of de
livered fuel. These coefficients, shown in Table A.3, have the units of Btu
of primary energy required per Btu of fuel energy delivered in its final
form. The energy content of the fuel used in the process is multiplied by the
coefficient to account for the energy required to deliver that fuel. For this
analysis, the fuel heating values in Table A.l were assumed. For electricity,
Table A.3. Energy Costs of Delivered Fuel
Energy Cost Fuel (Btu required/Btu delivered)
Coal 1.0060
Refined Petroleum Products
Gas
Electricity
Source: Ref. 1.
1.2082
1.1005
3.7963

48
the quantity of electricity in kWh is first converted to Btu (3413 Btu/kWh)
and then multiplied by the coefficient, which includes a factor for the
thermal efficiency of electrical generation facilities. This process is
applied only to the capital and operating energy requirements, and not to the
primary energy input of the system.
A.4 THE ENERGY INTENSITY OF MATERIALS
A.4.1 General Materials
In some of the analyses, the quantities of materials involved in
the construction and/or operation of a system are presented in physical
units rather than in terms of energy costs. The energy intensities of these
materials are shown in Table A.4 with the reported range of values and the
value selected for this study.
Use of these intensities along with the intensities expressed in
dollar costs in Sec. A.2 is consistent in that both represent total primary
energy required at the point of manufacture. In the case of the Herendeen
data3 in Table A.4, an input/output economic analysis was used to develop
the total energy requirements. In the case of the JPL data,2 the direct
process energy required in manufacturing is arbitrarily multiplied by a factor
of 2.5 to account for total energy requirements.
A.4.2 Silicon Production
Silicon production requires coke and electric power. Coke is used
to reduce quartz ( Si02) to metallurgical grade silicon in an arc furnace
that is approximately 50% efficient. The silicon reacts with hydrochloric acid
to yield trichlorosilane (SiHCl3), which is admitted to a chamber containing
an electrically heated silicon rod. The heat of the rod (1370 K) causes the
SiHCl3 to decompose; the released Si deposits on the rod, which grows at about
1.44 cm/day. A suitable silicon ingot is produced in 3 to 4 days, and resis
tance heating of the rod during this period consumes about 70% of the elec
tricity required by the process.
The electrical power required to produce 0.11 x 10⁵ t of silicon cells
annually (i.e., the quantity required for 4500 MWe peak output) is 4574 MWe,9
This process is assumed to be continuous, so the annual energy requirement is
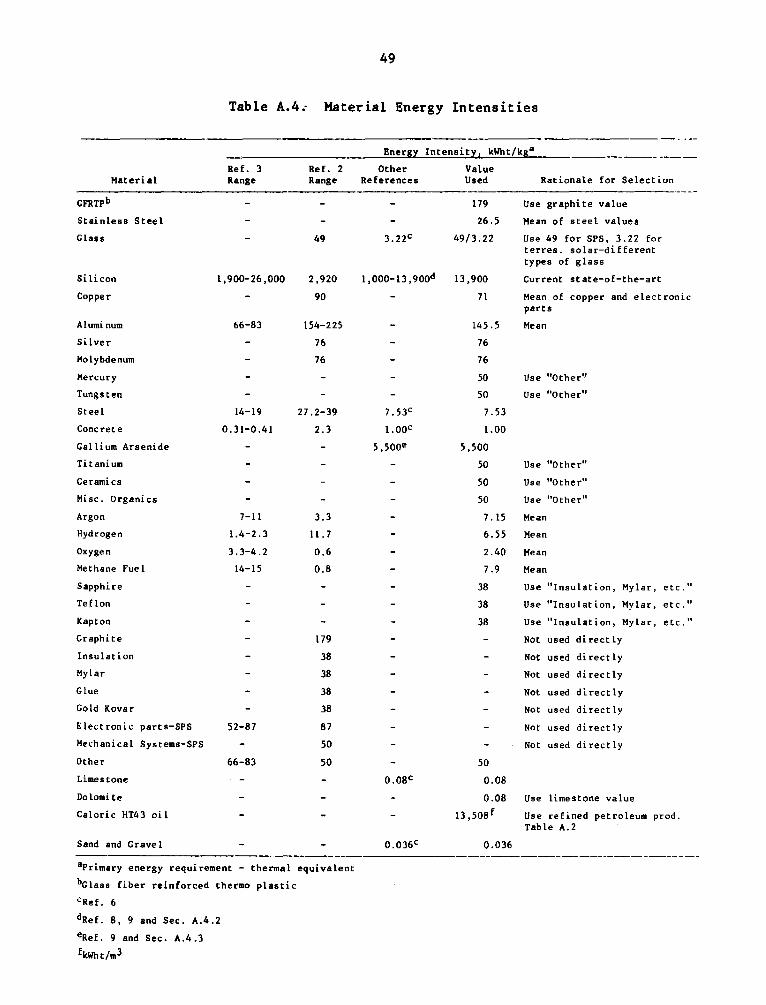
49
Table A.4; Material Energy Intensities
Material
Stainless Steel
Glass
Silicon
Copper
Aluminum
Silver
Molybdenum
Mercury
Tungsten
Steel
Concrete
Gallium Arsenide
Titanium
Ceramics
Misc. Organics
Argon
Hydrogen
Oxygen
Methane Fue 1
Sapphire
Teflon
Kapton
Graphite
Insulation
Mylar
Glue
Gold Kovar
Electronic parts-SPS
Mechanical Systems-SPS
Other
Limestone
Dolomite
Caloric HT43 oil
Sand and Gravel
Ref. 3 Range
l, 900-26 ,000
66-83
14-19
0.31-0.41
7-11
1.4-2. 3
3.3-4.2
14-15
52-87
66-83
Ref. 2 Range
49
2,920
90
154-225
76
76
27.2-39
2.3
3.3
l l. 7
0.6
0.8
179
38
38
38
38
87
50
50
aPrimary energy requirement - thermal equivalent
bGlass fiber reinforced thermo plastic
CRef. 6
dRef. 8, 9 and Sec. A.4.2
eRef. 9 and Sec. A.4.3
fkWht/m3
Energy Intensity, kWht/kga
Other Value References Used
l ,ooo-n, 9ood
7.53c
l.OOC
5,5ooe
o.o8c
179
26.5
49/3.22
13. 900
71
145 .5
76
76
50
50
7.53
1.00
5,500
50
50
50
7. 15
6.55
2.40
7.9
38
38
38
50
0.08
0.08
13,508f
0.036
Rationale for Selection
Use graphite value
Hean of steel values
Use 49 for SPS, 3.22 for terres. solar-different types of glass
Current state-of-the-art
Hean of copper and electronic parts
Hean
Use "Other"
Use "Ocher"
Use "Other"
Use "Other"
Use ••other 11
Hean
Hean
Hean
Hean
Use "Insulation, Mylar, etc."
Use "Insulation, Mylar, etc."
Use "Insulation, Mylar, etc."
Not used directly
Not used directly
Not used directly
Not used directly
Not used directly
Not used directly
Not used directly
Use limestone value
Use refined petroleum prod. Table A.2

50
4.007 x 10¹⁰ kWhe. This value yields an energy intensity of 3643 kWhe/kg
of ailicon cell, for a total energy cost (as discussed in Sec. A.3) of 13,800
kWht/kg. In addition, the process requires 21 kg of coke per kg of silicon
cell. Assuming a heating value of 10,000 Btu/lb (23.24 x 10⁶ J/kg) and using
the energy cost of coal from Sec. A.3 yields 140 kWht/kg of silicon cell.
Thus the total energy requirement is 13,900 kWht/kg of silicon cells. This is
the value used in the present baseline analysis.
Figure A.2 illustrates potential reductions 1n energy requirements
as silicon manufacturing technology advances;8 the lower limit is about 1000
kWht/kg of cells.
In addition to the advances in silicon manufacturing technology
projected in Ref. 8, different technologies are emerging that may signifi
cantly reduce the energy consumption in various phases of polycrystalline
silicon production. In all cases the Si single cell is produced from poly-
crystalline Si. Four such processes are the Acheson Process,13 Westinghouse
Arc Heater Process,14 Battelle Zinc Reduction Process,15 and the Union Carbide
Silane Process.14
The Acheson Process produces SiC (rather than metallurgical grade Si)
from sand and sawdust using a very efficient resistance heating process with a
Cl) ...J ...J LI.I c..> ~ 0
~ ..... .t:::. • -~-Cl) 0 c..>
~ LI.I
ffi
10,000
7500
5000
POTENTIAL
2500 FOR CONTINUOUS PROCESS
.TYPICAL TODAY
01-...~~--'-~~~-'-~~-'-~~~-'-~~~~-o .2 .4 .6 .8
YIELD, kg SOLAR CELLS PER kg SEMICONDUCTOR GRADE SILICON
1.0
Fig. A.2. Potential for Reduction in Silicon Energy Requirements8

51
carbon rod. The Westinghouse Arc Heater Process starts with the preparation
of SiCl4 from SiC and pttoduces polycrystalline silicon. The Battelle Zinc
Reduction Process produces polycrystalline silicon starting with the reduction
of SiCl4 with zinc. The SiCl4 can either be purchased or produced from
metallurgical grade Si or SiC. The Union Carbide Silane process also produces
polycrystalline Si, starting with metallurgical grade Si. All of these appear
to have the potential for reducing the energy requirements of silicon produc
tion significantly below those used in this analysis.
A.4.3 Gallium Aluminum Arsenide Production
Very few data are available on gallimn arsenide production require
ments. The electrical power required for the annual production of enough
GaAlAs to make cells to yield 100 MWe (peak power) of electricity is 57.98
MWe. 9 The process is assumed to be continuous, so the energy requirement is
5. 08 x 108 kWhe. Cell requirements are 3. 69 t per peak MWe, which yields an
energy intensity of 1377 kWhe/kg of cells. Using the energy costs of elec
tricity from Sec. A. 3 yields 5500 kWht/kg of cells. This value was used
here.
No information was available on potential energy reductions.

53
REFERENCES TO APPENDIX A
1. Frabetti, A.J., Jr., et al., Application of Net EnePgy Analysis to ConswneP Technologies, Report No. DSI 047, Development Sciences Inc., East Sandwich, Mass (Dec. 22, 1976).
2. Livingston, F.R., et al., Satellite Powep System PPelimninaPy Resoupce Assessment, Document No. 900-805, Rev. A., Jet Propulsion Laboratory, Pasadena, Calif. (Aug. 7, 1978).
3. Herendeen, R.A., Ttuo Technologies Neap the Net EnePgy Limit: Gasohol and SolaP Satellite PoweP Station, Energy Research Group, University of Illinois at Champaign-Urbana (Aug. 1978).
4. Fraley, D.W., C.L. McDonald, and N.E. Carter, A Review of Issues and Applications of Net EnePgy Analysis, Battelle Pacific Northwest Laboratories, PNL-SA-6619 (May 1978).
5. Herendeen, R.A., and C.W. Bullard III, EnePgy Costs of Goods and Se1"Vices 1963 and and 2967, CAC Document No. 140, Center for Advanced Computation, University of Illinois at Champaign-Urbana (Nov. 1J74).
6. Meyers, A.C., and A.E. Hildebrandt, SolaP Tower>-TheT'Trlal Collection EnePgy Component-10 Mole Pilot Plant, Proc. of the 1977 Annual Meeting, American Section of the International Solar Energy Society, Vol. 1 (1977).
7. Satellite PoweP System Concept Development and Evaluation ProgPam RefePence System Report, DOE/ER-0023, U.S. Department of Energy (Oct. 1978).
8. Woodcock, G.R., SPS Cost Consideration, Journal of Energy, Vol. 2, pp.196-202 (July-Aug. 1978).
9. Gandel, M.G., et al., Assessment of Large-Seate Photovoltaic Materials Production, Report No. EPA-600/7-77-087, U.S. Environmental Protection Agency, Industrial Environmental Research Laboratory, Cincinnati, Ohio (Aug. 1977).
10. Sears, R.D., D.V. Merrifield, and M.M. Perry, Environmental Impact Statement fop a Hypothetical 1000 Mole Photovoltaic SoZar>-EZectPic Plant, Report No. EPA 600/7-77-085, U.S. Environmental Protection Agency, Industrial Engineering Research Laboratory, Cincinnati, Ohio (Aug. 1977).
11. Kotin, A.D., Satellite Power System White Paper on Resource Requirements, Report No. SA-3, DOE/NASA SPS Concept Development and Evaluation Program, (Oct. 1978).
12. Bloomquist, C.E., A SuPvey of Satellite PoweP Stations, Report No. DSE/ 2071-1, Planning Research Corporation, Los Angeles (Sept. 1976).

54
13. Personal communication with John M. Blocher, Jr. Research Associate, Materials Development Section, Battelle Columbus Laboratory (Nov. 1979).
14. Personal communication with Ralph Lutwock, Jet Propulsion Laboratory (Nov. 1979).
15. Blocher, J.M., Jr., and M.F. Browning, Evaluation of Selected Chemical P~ocesses for Production of Low-Cost Silicon, DOE/JPL 954339-78/11 (July 9, 1978).

55
APPENDIX B COAL FUEL CYCLE SYSTEMS

57
APPENDIX B COAL FUEL CYCLE SYSTEMS
This append ix wi 11 address two coal-based systems: atmospheric
fluidized-bed combustion and gasification/combined-cycle facilities.
B.l FLUIDIZED-BED COMBUSTION
B.1.1 Description of the Overall System
The system analyzed is a coal-fired steam generation cycle with the
atmospheric fluidized-bed combustion (AFBC) furnace, designed by the General
Electric Company. The system is designed to deliver electricity to a utility
grid and includes a 747-MWe power plant generating 15,326 x 1012 J/yr (4.25 x
109 kWh/yr) with a plant capacity factor of 65%.
Figure B.l shows a simplified flow diagram of a coal fuel cycle for the
AFBC system. In addition to mining, preparation, and transportation of coal,
separate unit processes in the AFBC system are merged into two subsystems:
the conversion system and the steam cycle system. These subsystems are used
to calculate separate energy balances for the overall system performance.
Energy balances for each subsystem are calculated on the basis of the elec
trical output of 15,326 x 1012 J/yr.1-3 The lifetime of a power plant is
assumed to be 30 yr.
B.1.2 System Elements
The net energy analysis for a coal fuel cycle depends on many complex
factors, such as geographic location, mining methods, coal-preparation options,
transportation, prices of ancillary energy, capital requirements, manpower
and material availabilities, and envirornnental regulations. In this section,
the elements of the AFBC system are discussed briefly.
Re$ource Extraction. Two types of coal mining procedures are used in
the United States: strip mining and underground mining. Some 545 x 106 t* of
coal were mined in the U.S. in 1973.4 This is a 14% increase since 1965;
*t is the abbreviation for metric ton (1000 kg); the English ton is not abbreviated.

Coal
' -l- -; ·--------
~ I Mining 1---"TI~ Coal
Preparation
(1) Resource (2) Processing
Extraction (Crushing &
(Strip- Cleaning)
mining)
I (4) Conversion system Particulates I
i-Removal I Exhaust gas
I
Lime'j
L one _____ ~ ___ is
I
I
I
l ~t~am-sysl~ ~ystem
I
Transportation II
Solid (AFBC) I Steam -- -:---' Handling Combuster Turbine I
[ :nerator ~ Electdcity
I
I
I
I ' •
(3) Transport
(rail -
300 miles)
Solids H Condenser I -·
1 Cooling
Tower
~ - - - - - - - - J - - - - - - - - - - - - - - - - - 1
Fig. B.1. Simplified Flow Diagram of an AFBC Cycle
lJ1 00

59
however, most of this increase has occurred in the western coal fields where
surface mining methods are used, and total underground mining has decreased.4
Therefore, only surface mining is considered in this study.
Typical energy contents of coal generally range from about 16.3 x 10⁹
J/t (7 ,000 Btu/lb) for lignite to over 32.6 x 10⁹ J/t (14,000 Btu/lb) for
anthracite. The coal studied here is assumed to be a bituminous coal with a
heating value of 23.2 x 10⁹ J/t (10,000 Btu/lb).
A typical strip-mined coal bed is 2 m wide with an overburden averaging
22 m.l The overburden is blasted with an ammonium nitrate-fuel oil mixture
and removed by electric shovels of 92-m3 capacity.I Overburden drills,
stripping equipment, coal loading shovels, pumps, and lighting equipment are
operated by electric power. About 90% of the deposited coal is assumed to be
recovered in surface mines;l-4 only 50% to 60% of the coal may be recovered
in an underground mine using room-and-pillar methods.
Land reclamation costs, including handling and treatment of the
preparation plant refuse, are estimated at $494,000 per km2 ($2,000 per
acre) .1
Processing. Coal may be prepared (beneficiated) before transporta-
tion to upgrade its value and remove potential enviromnental pollutants.
The preparation assumed in this study consists of mechanical cleaning and
separation of particles of coal from impurities. (About 60% of total U.S.
coal output undergoes some kind of mechanical cleaning and processing. )5
Coal preparation generally is accomplished at or near the mine site,
and it involves any combination of the following steps: 5
• Crushing and screening to achieve desired size range and to remove part of the impurities.
• Removal of dust and heavier mineral impurities (including pyritic sulfur) through techniques based on specific gravity, centrifugation, and differences in surface characteristics.
• Thermal drying to prepare the coal for shipping or use.
In this study, the coal preparation plant was assumed to be located at
the mine mouth, and a 16 km (10 mi) pipeline to bring water to the plant is
required. An allowance for a coal loading facility is included in the plant
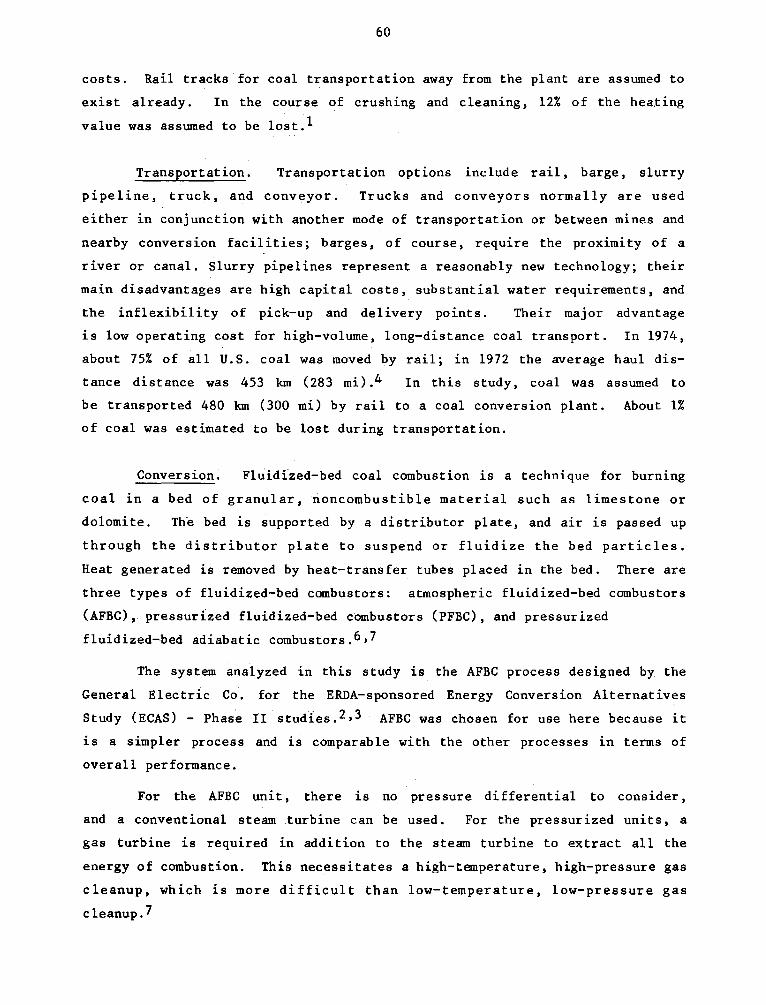
60
costs. Rail tracks for coal transportation away from the plant are assumed to
exist already. In the course of crushing and cleaning, 12% of the hea.ting
value was assumed to be lost.l
Transportation. Transportation options include rail, barge, slurry
pipeline, truck, and conveyor. Trucks and conveyors normally are used
either in conjunction with another mode of transportation or between mines and
nearby conversion facilities; barges, of course, require the proximity of a
river or canal. Slurry pipelines represent a reasonably new technology; their
main disadvantages are high capital costs, substantial water requirements, and
the inflexibility of pick-up and delivery points. Their major advantage
is low operating cost for high-volume, long-distance coal transport. In 1974,
about 75% of all U.S. coal was moved by rail; in 1972 the average haul dis
tance distance was 453 km ( 283 mi). 4 In this study, coal was assumed to
be transported 480 km (300 mi) by rail to a coal conversion plant. About 1%
of coal was estimated to be lost during transportation.
Conversion. Fluidized-bed coal combustion is a technique for burning
coal in a bed of granular, noncombustible material such as limestone or
dolomite. Th·e bed is supported by a distributor plate, and air is passed up
through the distributor plate to suspend or fluidize the bed particles.
Heat generated is removed by heat-transfer tubes placed in the bed. There are
three types of fluidized-bed combustors: atmospheric fluidized-bed combustors
(AFBC), pressur1zed fluidized-bed combustors (PFBC), and pressurized
fluidized-bed adiabatic combustors.6,7
The system analyzed in this study is the AFBC process designed by the
General Electric Co. for the ERDA-sponsored Energy Conversion Alternatives
Study (ECAS) - Phase II studies.2,3 AFBC was chosen for use here because it
is a simpler process and is comparable with the other processes in terms of
overall performance.
For the AFBC unit, there is no pressure differential to consider,
and a conventional steam turbine can be used. For the pressurized units, a
gas turbine is required in addition to the steam turbine to extract all the
energy of combustion. This necessitates a high-temperature, high-pressure gas
cleanup, which is more difficult than low-temperature, low-pressure gas
cleanup.7

61
The AFBC and PFBC systems designed by G.E. have been compared,2,3
and the results show that the overall efficiency of the AFBC system (35.8%)
is about 3.4 percentage points lower than that of the PFBC system (39.2%).
The cost of electricity (COE) of the AFBC (31.7 mills/kWh) is about 2.4
mills/kWh less than the PFBC' s COE (34.1 mills/kWh) .3 Therefore, the AFBC
system requires more ancillary energy but involves a lower cost to produce the
same amount of electricity, mainly because of the lack of gas turbines operat
ing in parallel with the steam cycle. According to a net energy analysis2 for
fluidized-bed systems, the rate of delivered energy output to total primary
energy input is also favorable to the AFBC system.
Environmental Control. Three major pollutants are emitted by the
burning of coal in a power plant: sulfur oxides, nitrogen oxides, and parti
culates.
For fluidized-bed combustion systems, the use of limestone or dolomite
as the bed material provides a means for removing the S02 generated during
coal combustion. Because the AFBC is operated under oxidizing conditions,
complete combustion is possible, and S02 is removed as CaS04. Fluidized-bed
systems also offer the potential for inherently low NOx emissions because of
lower combustion temperatures. In most cases S02 and NOx emissions are below
the present federal standards.2-4
The control of particulates is similar to that in conventional power
plants. In general, control is accomplished by mechanical devices such as
centrifugal collectors (cyclones), wet collectors, electrostatic precipita-
tors, and baghouses. In this study, conventional cyclones and hot electro-
static precipitators were assumed as the furnace-gas cleanup equipment.
Furthermore, for this energy balance study, the performance of the conversion
system and environmental control system were merged.
Steam-Cycle System. The energy flow from an atmospheric fluidized-bed
combustor has two major outlets: the flue-gas circuit and the water/ steam
circuit. The water/steam circuit generates the electricity using a steam
turbine driving an electrical generator, whereas the flue-gas circuit is
funneled through the environmental control equipment.

62
Water is converted to steam in tubes placed inside the combustor.
The thermal energy of superheated steam is converted into mechanical energy by
expansion in a steam turbine, and the mechanical energy is changed to electri
city by the generator. After leaving the turbine, the low-pressure steam is
converted back to water in a condenser. Energy is released during condensa
tion and absorbed by water or air at a cooling tower, and then discharged into
the atmosphere. This is the conventional steam-cycle system that is used in
modern coal-fired power plants.
B.1.3 Energy Balance Parameters
Two types of energy flow are included in the net energy analysis of a
coal fuel cycle: primary energy, and operating and capital energy.
The primary energy flow diagram of a fuel cycle for the AFBC from
mining to busbar is shown in Fig. B.2. The nominal size of the unit chosen
for study (747 MWe operating at a capacity factor of 65%) requires 2.35 x 10⁶
t of bituminous coal per year with a heating value of 2.32 x lolO J/t (10,000
Btu/lb); it is assumed to be strip-mined coal. After mining, preparation, and
transportation losses are subtracted, the coal thermal input to the conversion
system is 42,833 x 1012 J (from 1.84 x 10⁶ t of coal). Except for the energy
loss in the conversion system, all the heat released in the combustor (37,639
x 1012 J) is transmitted to the steam cycle. The steam turbine generates
15,326 x 1012 J of electric power (4.25 x 10⁹ kWh).
Annual operating and capital energy requirements for the AFBC were
normalized to the electric output of 15,326 x 1012 J; results are summarized
in Table B.l. The operating and capital energy consumption for coal extrac
tion, preparation, and transportation, and for plant operation and construc
tion materials has been calculated using the input/output methodology and the
cost estimates of appropriate materials for each economic sector.1,2
B.1.4 Identification of Sensitive Data
The primary energy efficiencies for the present study were estimated
from previous analyses. It is important to review the range for each of these
parameters. for the identification of sensitive data. Table B. 2 shows the
range of available data on the efficiencies of the primary energy flow used
for the system studied here. The most significant step for energy utilization
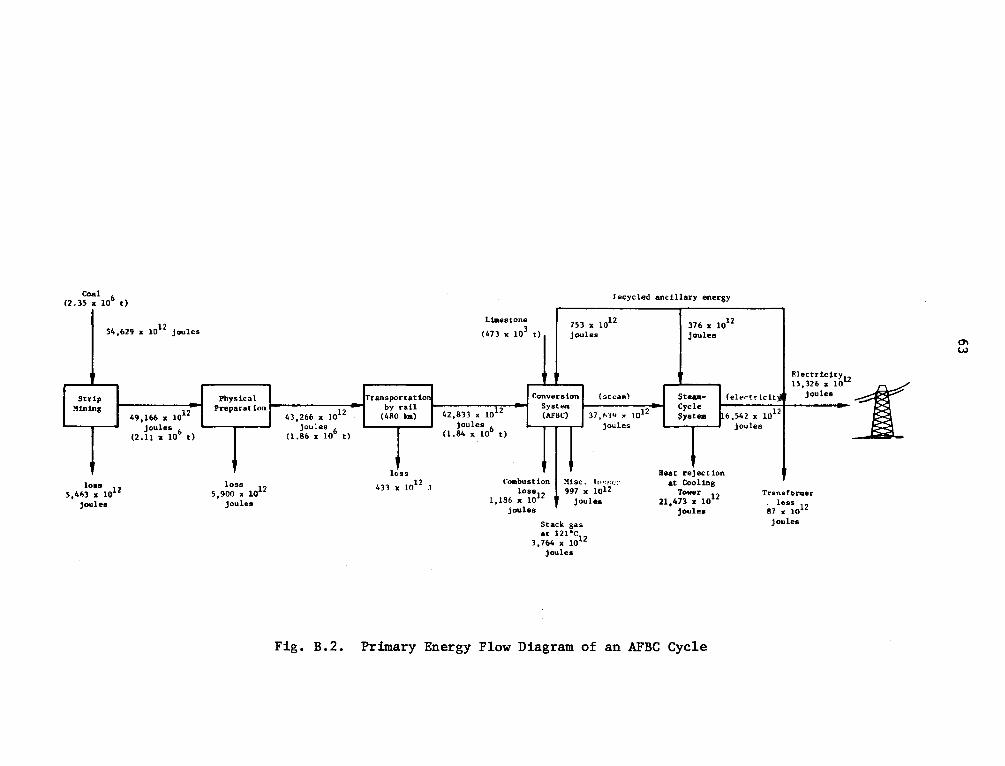
Coal (2.3S x 106 t)
S4,629 x 1012
joules
Strip Mining
loss S,41,3 x 1012
joolee
49, 166 " 1012
joules (2.11 " 10
6 t)
Limestone
(473 " 103
t)
•
Eecycled anc illa~y energy
753 x 1012
joules 376 " 10
12
joules
F.l ectricity12
Physical Transportation Conversion Preparation by rail 1' System 1--------'
(stca111) SteamCycle System
Celertt"icit joules i-:.-----:+---
6 ,542 x 1012
1>,326:i 10 ~
loss 5,900 x 1012
joulea
43,266 x 1012 (4110 loo) 42,833 x 10" (AFBC) 37,~J~ ~ tol 2
joules joules 6 joules ( 1.86 x 10⁶ t) (l.84 x 10 t)
loss 1' 431 x 10 - .1
Combustion l Misc. ]('!:~<.::· loss
12 997 x 1012
1,196 x lO joules joules
Stack gas at l21•c
12 3,764 x 10 joules
Heat rejection at Cooling
Tower 21,473 x lo
12
joules
Fig. B.2. Primary Energy Flow Diagram of an AFBC Cycle
joules
Transfonaer
81 l:s~o12 joules
°' w

Table B .1. Energy Balance Parameters for AFBC System
Total Capital Input Annual Operating Input
Type Quant it ya Energy Energy
(1015 J)b Type Quantitya (1015 J)b Type
STRIPlllNING: ANNUAL PRIMARY INPUT 2.35 x 10⁶ t COAL, 54.629 x 10¹⁵ JC
Shovels, Drills, etc. $18,970,000 1. 2030 Electricity 23.32 x 10⁶ kWhe 0.3195 Coal Industrial Vehicles $ 6,110,000 Construction $ 4,333,000
0.3420 Oil 9635 bbls 0.0675 0.2820
Total 1. 8270 Explosives $536,890 0.0916 General Supplies $735,760 0.0296 Maintenance $259,390 0.0096 Reclamation $532,650 0.0231 Total - 0.5409
COAL PREPARATION: ANNUAL PRIMARY INPUT 2.11 x 10⁶ t COAL, 49.166 x 10¹⁵ JC
Machinery Construction Water Lines Total
Rolling Stock
$ 1,927,000 $ 1,927,000
NA
NA
0.1260 Electricity 4.78 x 10⁶ kWhe 0.0655 Coal 0.1260 Supplies $38,540 0.0014 0.0180 0.2700 Maintenance $19,270 0.0071
Water NA 0.0080 Total - 0.0820
RAIL TRANSPORT: ANNUAL PRUIARY INPUT 1. 86 x 106 t COAL 2 43. 266 x 1015 JC
0.5310 Diesel Oil 45,923. bbls 0.3417 Coal
AFBC AND STEAM CYCLE: ANNUAL PRIMARY INPUT 1. 84 x 106 t COAL, 42. 833 x 1015 JC
Electricity (material equivalents) Major Components 2. 99 x 108 kWhe 4.0956 Other Components 3. 08 x 108 kWhe 4.2165 Construe tion 0.09 x 10⁸ kWhe 0.1210
Other Materials Major Components NA 2. 9118 Other Components NA 2.9751 Construction NA o. 6963
Total - 15.0163
anollar amounts in 1974 dollars.
Electricity (from output)d Material ,equivalents: Consumablese Maintenance
Other Materials Consumbablese Maintenance Limestone
Total
(0.31 x ~o9 kWhe)d
1.57 x 10⁷ kWhe 1.20 x 10⁷ kWhe
NA NA
521,000 t -
(l.129)d
o. 214 7 0.1646
0.0918 0.1699 0.1385 0.7795
Electricity Gross lnternald Net
bcapital and operating energy computed by I/O analysis as energy cost of fuels, materials, and electricity used.
CEnergy input and output computed as heat content of fuels or joule equivalent of electricity generated.
drnternal use, included in output total only.
eother than limestone.
Annual Output
Quantity
2.11 x 10⁶ t
1.86 x 10⁶ t
1.84 x 10⁶ t
4.57 x 10⁹ kWhe (0.31 x 10⁹ kWhe}d 4.25 x 10⁹ kWhe
Energy ( lQ15 J )C
49.166
43.266
42.833
16.455 c1.1i9>d 15.326
0\ ~

65
Table B.2. Energy Efficiencies for the Primary Energy Flow in the AFBC System
Assumed Operating Range of
Subsystem Efficiency, % Variation
Stripmining of Coal 90 5-10% loss in extraction
Coal Cleaning 88 10-15% loss of heating value
Coal Transport 99 Rail: 1% loss per 480-km haul
1.6% loss per 800-km haul
0.04% loss per unit train
0.08% loss per conventional train
Barge: 0.04% loss
Pipeline: 2% loss
AFBC 36 35.8% (AFBC) to
Conversion 88 40.0% (PFBC)
Steam Cycle 44 Power Conditioning 93
Overall Efficiency 28
References
1,4,8
1,4 ,5
1
8
8
5
5
5
3,10
must be the AFBC system which has a 36% ·overall efficiency in this study.
According to Refs. 3 and 7, however, there is not much room to improve the
overall power plant efficiency.
Because of the lack of data, the range of operating and capital energy
requirements is not shown.
B.2 COAL GASIFICATION/COMBINED CYCLE (CG/CC)
B.2.1 Description of the Overall System
The system studied is a coal-fired steam cycle using a Westinghouse
gas-turbine/steam-turbine, combined-cycle system integrated with a low-Btu
fluidized-bed gasifier. The analysis was based on a system required to

66
deliver electricity to a utility grid at a 741.5-MWe output, generating 15,203
x 1012 J/yr (4.222 x 10⁹ kWh/yr) of electricity with a plant capacity factor
of 65%.
Figure B.3 shows a simplified flow diagram of a coal fuel cycle for
the Westinghouse integrated gasifier and combined cycle system (CG/CC). In
addition to mining, preparation, and transportation of the coal, separate unit
processes in the CG/CC system were grouped into the following subsystems to
allow separate energy balances: the gasifier/cleanup system; and the combined
cycle, consisting of the gas-turbine system, heat recovery system, and steam
cycle system. Energy balances for each subsystem were calculated on the basis
of available referencesl,9,3 and normalized to the electrical output of 15,203
x 1012 J/yr. The construction period and life of the power plant were assumed
to be 5 yr and 30 yr respectively.9
B.2.2 System Elements
The mining, preparation, and transport of coal assumed for the CG/CC
system are identical to the processes described in Sec. 'B .1. 2. The other
system elements, conversion (gasifier/cleanup) and the combined cycle system,
are described briefly below.
Gasifier/Cleanup System. The conversion system is itself divided into
other subsystems: coal and dolomite handling, gasification, and hot gas
cleanup. A pressurized fluidized-bed gasifier with a hot gas cleanup system
was analyzed.
The Westinghouse fluidized-bed gasifier is made up of two stages,
one a 870°C (1666°F) desulfurizer/devolatizer bed; the other a 1093°C (2000°F)
agglomerating gasifier bed.9 Dry, crushed coal from the coal handling system
is injected into the gas stream from the gasifier and devolatilized in the
870°C bed. Desulfurization is accomplished by injecting dolomite into the
bed. The char and fines from this bed are gasified in the 1093 °C bed in
the presence of air and steam; the gas leaving the gasifier is recycled to
fluidize the desulfurizer/devolatilizer bed. This gasification process must
be able to operate at a temperature high enough to avoid tars in the resultant
flue gas, but low enough to avoid volatilizing and carrying over alkali/
metals. The low-Btu gas leaving the gasifier ves!!els passe_~ througtCa--three-

Coal
I ~ - - - - 1 - - - - - - - -.·B.· ·. I I I
Mining ,·- Coal ---, 1 1
1 Preparation 1
L----- I I
Transportation
- - - - - - - -
( 1) Resource (2) Process- (3) Transport ~J Extraction ing (Wet (Rail -
(Strip- cleaning 300 miles) mining) & crush-
ing)
Fig. B.3.
(4) Conversion System (Gasifier/Cleanup System)
I dolpmite
~ : ~ .--'-----, I I -I I Solid I I I Lnillu ............ ug J
Gasifier
J
Particulate Removal
I -1-
·--------
_ S~l!d_ d:a~o_:;a: J
(5) Gas-turbine system
I
I
[.c. ombustor 1---i Gas l~E'l.ectricity 1 ~ -L:::=J-- I
(6) Heat Recovery System
(7) Steam-cycle system
--1----Waste Heat I ...
Boiler Exhaust 1
Gas
I
I Condenser 1-- I T~~=~e 1~1 Generator~lectricity
tl Cooling
Tower
Simplified Flow Diagram of Low-Btu CG/CC System
0\ -..J

68
stage particle cleanup system, consisting of a cyclone, a multiclone unit, and
a granular bed filter.
The plant requires 66.95 kg/a (265.7 tons/hr) of coal· and 24.86 kg/s
(98.6 tons/hr) of dolomite as inputs.9 It emit':S 0.3096 g of SOi, 0.2795 g of
NOx, and 0.00602 g of particulates per megajoule of input coal energy (respec
tively 0.91, 0.65, and 0.014 lb/106 Btu of input) ,9. These emissions are
respectively, 76%, 93%, and 14% of the relevant EPA emission limits.9 The
plant also discharges 24.22 kg/s (96.12 tons/hr) of solid wastes (ash and
spent sorbent), which are disposed of in an on-site landfill.9 } I
Three basic low-Btu gasification processes are available: fixed or
moving bed (used by Lurgi, McDowell-Wellman, and G.E.); fluidized bed (used by
IGT, Westinghouse, and BCR); and entrained flow (used by Foster Wheeler and
Texaco).7,9,10
The G.E. fixed-bed process and the Westinghouse fluidized-bed process
were chosen for this study because good data were available for both.3,9
After results for the two systems were compared, the Westinghouse system was
finally selected for analysis because it had better overall efficiency: the
G.E. design for the integrated gasifier/combined cycle has an overall effi
ciency of 39.6%, whereas the Westinghouse design has an overall efficiency of
46.8%,3 The difference in efficiency is attributable to the differing ther
modynamic efficiencies of gas and' steam turbines and to differences between
the two gasifier/cleanup systems: in the G.E. cleanup system, a large portion
of the sensible heat is lost when the gas is water-washed to remove tars,
oils, and phenols, and is desulfurized, whereas the Westinghouse design uses
in-bed desulfurization and hot-gas particulate cleanup, with the result that
little of the sensible heat of the gas is lost.3
Combined-Cycle System. The combined-eye le system consists of a gas-
turbine system, a heat recovery system, and a steam-cycle system. The net
plant electrical output in this study is 15,203 x 1012 J/yr with a 65%
plant capacity. About 66% of the net power is )lerived from the gas-turbine
generators, and the remainder is from the steam-turbine generator.
A part of the gas turbine's compressor air is rec ye led and passed
through a coupled, fluidized-bed gasifier with three stages of hot gas clean
up. The resultant low-Btu fuel gas is burned in the gas-turbine combustor.
The products of combustion expand through the gas turbine and flow upward

69
through a heat-recovery steam generator, and then to the stack. Steam gene
rated in the heat-recovery boiler is expanded through a steam turbine with an
abbreviated feed water heater system. Heat rejected from the steam turbine
into the condenser is discharged to the atmosphere by means of mechanical
draft evaporative cooling tower.9
B.2.3 Energy Balance Parameters
Figure B.4 shows the primary energy flow diagram of the CG/CC system
analyzed. The 741.5-MWe unit, operating at a 65% plant capacity factor,
requires 1. 78 x 106 t of bituminous coal annually, with a heating value of
2.32 x lolO J/t (10,000 Btu/lb). Strip-mined coal is assl.DD.ed; after mining,
preparation, and transportation losses are deducted, the coal thermal input to
the conversion system is 32,494 x 1012 J (from 1.40 x 10⁶ t of coal). Most of
the heat released in the combustor is transmitted to the gas turbine, which
produces 10,503 x 1012 J (2.92 x 10⁹ kWh) of electric power. After leaving
the gas-turbine system, the combustion products move to heat-recovery boilers.
The heat-recovery system delivers steam to the steam turbine, which generates
5,512 x 1012 J (1.53 x 10⁹ kWh) of electricity. After subtraction of recycled
ancillary energy and transformer losses, a balance of 15,203 x 1012 J (4.22 x
109 kWh) of electric power is produced by this system.
Operating and capital energy requirements for the CG/CC system were
normalized to the electric output of 15,203 x 1012 J; they are summarized in
Table B.3. Annual operating and capital energy consumption for coal extrac
tion, preparation, and transportation were calculated by using an input/output
analysis and the cost estimates of appropriate materials for each economic
sector.l
B.2.4 Identification of Sensitive Data
Because the energy efficiencies for this study were estimated from
existing data, it is necessary to review the range;of each of those parameters
to identify sensitive data. Table B.4 shows all the available efficiency data
for the primary energy flow used in the system studied, The most signifi
cantly limiting step is the gasifier/combined-cycle system, with 46.8% overall
efficiency. According to Refs. 11 and 15, it seems that this efficiency is
not likely to improve significantly in the near future.

Coal (1. 75 x 10
6 t) Dolomite
(519 x 103 t)
To Gasifier{~leanup ------426 x 10
(735 x 1012 joules) Recycled Ancillary Energy
J 41,442 x 1012 joules il
l Jj·oule:~fr)--1~96-;lQTI joules To power 1~ystem 309 x 10 joules
r----'-
Strip Mining
37,298 x 1012
joules (1.61 x 10
6 tl
loss 4,144 x 1012
joules
f :-a~};;;-; x 10i2~~i { la•· Btu gas ) •
coal 6
electric it Physical l Transportation 1 •40 x lO t) Preoarati•>n 12 by Rail
12 ~--..---~32,822 x 10 (480 km) :?2,494 x 10 '----~-----' 33. 771 x 1012
Gas-Turbine System 0,503 x 10
joules
loss 4,476 x 10
12
joules
6 joules
(1.42 K lQ t) ! ------loss
328 x 1012
joules
To cooliyf tower 309 x 10 joules
~ Combusti'J'2 _loss 90'} x 10 Joules
Misc. l2ss 251 x 10 joules
joules
(stea.-.)
(exhaust gas)
21,392 x 1012
joules
541 x 1012
Joules
12 ___,I Heat Recovery (water) 116 x 10 System
joules
H,352 x .o12
joules
10,~ 116 x 10 joule•
(steam)
Steam-cycle System
Heat rejection
loss 213 x 1012
joules
to stack 12
6,383 x 10 joules
electricitv\ 5,512 x 10
joules
at cooling tower 8,723 x 1012 joules
Fig. B.4. Primary Energy Flow in a Low-Btu CG/CC System
l
(ElectriciiJ) 15,203x10
joules
Transf orDler lo f~
77xl0 joules
" 0

Table B.3. Energy Balance for CG/CC System
Annual Pri•ary Input
Sys tea !lem:nt
Stri paining
Type
Coal
Coal Preparation Coal
Rail Transport Coal
Casifier/Cleatklp Coal
Ga11 Turbine Low Btu Cas
H.eat Recovery EKhaust Gas
Ste• Cyc Le Stem.
Quantity
1.78 x 10⁶- t
l.6L x to6 c
l.42 x 106 t
1.40 x 10⁶ t
~~~f~Y;) 41.442
37 .298
32 .822
32 .494
33. 771
21.392
14.352
Power Transformer Electricity 4.45 x 10'9 kWhe 16.015
Tot al Power P l•nt
~nergy input and output -c0111puted as heat content of fuels
boollar _,unts in l'il74 doll.au.
Tot al Capital Inputs
Type
Shovels, drills 1 etc. Industrial vehiclu Construct ion Total
Machinery Construct ion Water Li.ne Total
Rolling Stot.:k
Quantityb
$l4 ,385,000 $4,633,000 $3 ,286,000
$1,46L,OOO $1,46L,000
NA
NA
~7~f~Y;)
0.9120 0.2580 0.2130 I. 3830
0.0960 0.0960 0.0150 0.2070
0.4020
---------------{Included be low)---------------
---------------(Included below)---------------
---------------(Included be low}---------------
--------------(Inc ludcd below)---------------
---------------{Included be low)---------------
Major Components Other Components Total
S2L7,LOO,OOO 9.L940 $L05,000,000 4.4470
L3.~4LO
joule equi.valeRt of electriclty ~enel"ated.
"Capital and operating energy computed by I/0 analysis as energy ..:ost of fuelst m.at~rials~ and electdt:ity used.
dlnternal use, inl.'.luded in output total a.nly.
Annual Operating ln-putsb
Type
Electricity Oil Explosives Gen. Supplies P'lai nt enani.'e Re .. · lam.at l on Total
Electri.;ity Supplies Mai ntenanl.'.e Water Total
Diesel Oil
Dolomite G.as Turbi rie: Air
Stear'I' Boiler! Steam
Water
Internal Elec.
Routine 0 & M Spe_dal 0 & M
Total
Quantity
L 7 .68 x. 106 kWhe 7307 bbls $L97,000 $558,000 $407 ,000 $404 ,000
3 .fi2 x 106 kWhe $29 ,000
$ L46 ,000 MA
34 ,828 bb ls
5L8,989 t
$4 ,350 ,000 SL,385,000
~7~w:) 0.2422 0.05t2 0.0694 0.0225 0.0073 O.OL75 0.4LOL
0.04% 0.0010 0.0054 0.0061 0.062L
0 .2 592
0.1519 (L .2960)0 (0.3610)0
(0.54LO)d (O. L 160)0
(0.4260)0
0.1510 0.0490 0.3579
Annual Output
Type Quantity
Coal l.6-lxL06t
Coal 1.42 x to6 c
Coal t.4o x io6 t
Low Btu Gas
Internal Use: Air Steam
Exhaust to boi Ler Electricity 2. 92 :1: rn9 kWhe
Steam to Gasifiet" To Turbine
Water to Casi fier
Electridty 1.53 x w9 k1''be
Electricity 4 • .t.3 :1: L09 kWhe Gross
To Gasifier O. L2 x 109 kllhe To Generator 0.09 x 10⁹ kWhe Net 4.22 x w9 k'Whe
~~~w;) J7. 298
12.822
32 .494
33 .17L
L.296 0.367
21.392 L0.503
0.541 ..... 14.152 ..... O. LL6
5.512
15.938 0.426 0.309
L5.203

72
Table B.4. Energy Efficiencies for the Primary Energy Flow in the CG/CC System
Assumed Operating Range of
Subsystem Efficiency , % Variation
Stripmining of Coal 90 5-10% loss in extraction
Coal Cleaning 88 10-15% loss of heating value
Coal Transport 99 Rail: 1% loss per 480-km haul
1.6% loss per 800-km haul
0.04% loss per unit train
0.08% loss per conventional train
Bar~e: 0.04% loss
Pipeline: 2% loss
CG/CC 46.8 39.6% (G.E., fixed-bed) to 42.2% ( IGT, fluidized-bed)
Overall Efficiency 36.7
References
1,4,8
1,4,5
1
8
8
5
5
5
3, 10

73
REFERENCES TO APPENDIX B
1. Frabetti, A., et al., A Study to Devetop Energy Estimates of Merit for Setected Fuet Technotogies, Development Sciences, Inc., East Sandwich, Mass. (Sept. 23, 1975).
2. Perry, A.M., et al., Net Energy Anatysis of Five Energy Systems, Institute for Energy Analysis, Oak Ridge Associated Universities, ORAU/IEA(R)-N-12 (Sept. 1977).
3. Evatuation of Phase 2 Conceptuat Designs and Irrrptementation Assessment Resulting from the Energy Conversion Alternatives Study (ECASJ, NASA -Lewis Research Center, Cleveland, Ohio (April 1977).
4. Ferrell, G., Energy Utilization and Environmentai Controt Technologies in the Coal-Etectric Cycte, Lawrence Berkeley Laboratory Report LBL-6334, Berkeley, Calif. (Oct. 1977).
5. Cirillo, R.R., et al., An Evaluation of Regional Trends in PO/JJer Plant Siting and Energy Transport, Argonne National Laboratory Report ANL/AA-9, Argonne, Ill. (July 1977).
6. Yaverbraum, L., Fluidized-Bed Combustion of Coal and Waste Materiats, Noyes Data Corporation, Park Ridge, N.J. (1977).
7. Cirillo, R.R., unpublished information.
8. Vogenthaler, Thomas, et al., Net Energy Analyses: An Energy Balance Study of Fossil Fuet Resources, Colorado Energy Research Institute, Golden, Col. (April 1976).
9. Beecher, D.T., et al., Energy Conversion Alternatives Study (ECASJ -Westinghouse Phase II Final Report; Summ:::r.ry and Combined Gas-Steam Turbine Plant with an Integrated LOIJJ-Btu Gasifier. Westinghouse Electric Corp. Research Laboratories, Pittsburgh, Pa. (Nov. 1, 1976).
10. Reddy, N., Commerciatization of Coat-Based Combined Cycle Plants, presented at the 7lst Annual Meeting of the APCA, Houston, Tex. (June 1978).

75
APPENDIX C
NUCLEAR FUEL CYCLE

77
C.l DESCRIPTION OF THE OVERALL SYSTEM
This appendix describes the direct energy, process energy, ano con
struction energy inputs required in each stage of the nuclear fuel cycle.
These requirements, which include the energy use associated with mining of the
ore and transport and storage of the wastes, are those necessary to support
the annual operation of a 1000-MWe l~ght water reactor (LWR). Most of the
data were developed by the Institute for Energy Analysis ( IEA) of Oak Ridge
Associated Universitiesl and adjusted according to the assumptions used by
the Energy Research and Development Administration.2
The use of conventional uranium ores ( 0. 208% U30g, of which 0. 71% is
u235) with an enrichment tails assay of 0.2% is assumed. Reprocessing of
wastes for recovery of unused uranium and plutonium is not considered. The
reactor is assumed to have a service life of 30 years, during which it pro
duces an average of 19,240 x 1012 J/yr (5.343 x 10⁹ kWh/yr) at a capacity
factor of 61%. Figure C.l shows a simplified schematic diagram of the nuclear
fuel cycle considered.
C.2 SYSTEM ELEMENTS
C.2.1 Mining
Most of the uranium produced domestically is recovered from high-grade
sandstone deposits in the western United States. The ores found in this
region contain 0 .1% to 0. 5% uranium. Both open pit and underground mining
methods are utilized; the choice depends on the depth and nature of the rock
strata of the overburden covering the ore.
Current mining practices are mechanized and highly efficient operations
that extract almost all of the uranium. Electric and fuel purchase require
ments have been determined by the Institute for Energy Analysis (IEA)l from
Uranium Mining
Uranium Milling
Conversion Enrichment Fuel Fabrication
Internal Use
Reactor Electricity
Fig. C.l. Simplified Flow Diagram of Nuclear Fuel Cycle

78
1973 Bureau of Mines (BOM) survey data. The annual direct electrical purchase
that is required to support a 1000-MWe light water reactor is 1,586 MWh.
Petroleum products needed for mine operation are divided into categories of
heavy fuel oil, diesel and light fuel oil, gasoline, and other petroleum
products. These fuel quantities and the energy content required for the
mining of 65,950 t of ore (137.16 t uranium) are listed in Table C.l.
One common recovery technique is room and pillar mining, in which
material is tunnel-bored and transported to the surface where it is crushed.
Equipment used in underground mining usually includes drills, boring machi
nery, loaders, and explosives. Open-pit mining generally is done by tractors
with rippers, scrapers, tractor pushers, drill-powered shovels, and large
truck fleets.3 Beneficiation of the ore before shipment to the mill is
relatively uncommon at uranium mines.
The energy content of the process materials was estimated by IEA as
30 .6 x 1012 J. Explosives are the largest class in the process materials
requirement; their value was adjusted to reflect the .1974 ratio of surface
to underground mining (59% of uranium surface-mined and 41% deep-mined);
however, these percentages vary annually.
The construction energy requirements for the mining operation were
developed by amortizing the costs over an expected 10-yr mine lifetime.
Table C.l. Uranium Mining - Direct Energy Requirementsa
Elec-Quantity Energy tricity Energy
Energy (per yr) (lo9 J/m3) (MWh/yr) (1012 J/yr)
Electricity 1,586 MWh 1,586 Heavy Diesel Fuel 25 .1 m3 41. 7 1.0 Diesel & Light Fuel 789.9 m3 38.7 30.6 Gasoline 46.7 m3 34.8 1.6 Other Petroleum 38.2 m3 40.3 1.5 Natural Gas 20,051 m3 0.0392 0.8 Other Energy 1 MWh 1 Total 1,587 35.5
Per Metric Ton of Uranium 11.62 0.26
aQuantity adjusted to show the amount needed to support a 1000-MWe LWR for each year of service using conventional ore containing 0.208% U303, of which 0.71% is u235.

79
These requirements, adjusted to reflect the amount needed annually for an
1000-MWe LWR, were 207 MWh of electricity and 15.5 x 10¹² J of other fuels.
The total energy requirements for mining are listed in Table C.2; they
represent about 2% of the entire nuclear fuel eye le energy requirements.
IEA did not indicate whether land reclamation costs were included
in the energy values presented above. However, because they derived much of
the information from 1973 mining industry surveys, these values are likely to
have included direct and operating energy requirements for reclamation that
were in effect during that year.
This analysis did not consider any resource loss to occur during
the mining operation, because strip-mining is very efficient in extracting the
ore, and uranium ores left behind in deep mines are not, strictly speaking,
lost. The energy content of the 137.16 t uranium delivered to the mill site
is 88,515 x 1012 J.
C. 2. 2 Milling
Extraction of the uranium from its ore (which contains, on the average,
5 lbs U308 per ton of ore) is performed at the mill site. The milling opera
tion comprises mechanical and chemical processing, from crushing and grinding
the ore to the precipitation of yellowcake.
Ores are crushed and ground in ball-and-rod mills. The uranium is
extracted from the ore by chemical leaching, using either sulfuric acid or an
alkaline solution (usually sodium carbonate/ sodium bicarbonate). The acid
treatment is more common because most ores are low-lime types amenable to acid
leach.3 Uranium in the leach solution is purified by either solvent extrac-
Table C.2. Uranium Mining - Total Energy Requirements
Electricity Other Energy Energy Requirement (MWh/yr) (1012 J/yr)
Direct 1,587 35.5 Process Materials 30.6 Mine Construction 207 15.5 Total 1,794 81.6

80
tion or ion exchange; solvent extraction is the more common process. Yellow
cake, the final product, contains from 70% to 90% U305 after it is calcined to
remove the excess water.
Direct energy requirements were calculated by IEAl on the basis of
Bureau of Mines data, which accounted for fuels and electricity purchased in
1973 for the milling of 91% of the yellowcake produced domestically. Annual
electricity, fuel oil, and natural gas requirements for supporting a 1000-MWe
LWR amount to 2 ,248 MWh/yr of electricity, 11.8 x 10¹² J/yr of petroleum
products, and 34.4 x 10¹² J/yr of natural gas, as indicated in Table C.3. The
milling operation considered in this analysis is projected to process 137.16 t
of uranium annually in support of the LWR. The process is assumed to be 95%
efficient in its extraction.
The energy content of the process materials was determined on the
assumption of a 330 ,000-t/yr mill with a service life of ten years. Large
quantities of sulfuric acid are required for the acid leach treatment: 34 kg
(75 lb) of acid per ton of ore processed, which results in an annual require
ment of 2 ,482 t H2S04 per 1000-MWe LWR. This amount of acid has an energy
value of 7 .4 x 1012 J/yr. Other materials and supplies are estimated
to have an energy value of 27. 2 x 10¹² J/yr. Th.ese other supplies include the
sodium chlorate and manganese dioxide oxidants required for acid leaching ,3
Amortized over the life of the plant, the capital energy needed for the
mill was divided into two categories: the energy in construction materials
Table C.3. Uranium Milling - Direct Energy Requirements
Elec-Quantity Energy tricity Energy
Energy (per yr) (109 J/m3) (MWh/yr) (1012 J/yr)
Electricity 2,248 MWh 2,248 Heavy Fuel Oil 68.3 m3 41. 7 2.8 Diesel & Light Fuel 200.5 m3 38.7 7.8 Gasoline 6.3 m3 34.8 0.2 Other Petroleum 25.6 m3 40.3 1.0 Natural Gas 877,920 m3 0.0392 34.4 Total 2,248 46.2
Per Metric Ton of Uranium 16.39 0.34

81
and the direct energy used in construction. These amounted to 3.65 MWh of
electricity, 0.9 x 10¹² J/yr in fuels, and 4~5 x 10¹² J/yr in material energy
requirements.
Table C.4 stnnmarizes the energy requirements of the milling operation;
the total represents 2.2% of the entire energy requirement of the nuclear fuel
cycle.
As indicated earlier, the milling operation was asswned 95% efficient
in extracting the uranium from its ore. This 5% loss represents about 6.9
t of uraniwn and has an energy content of 4 ,431 x 1012 J. The remaining
material represents 130.3 t of uranium with an energy content of 84,084 x 1012
J. This reported efficiency is close to the milling industry average of 93.2%
U30s recovery in the 16 producing mills operating in 1974.3
C.2.3 Purification
Uranium used in reactor fuel must be free of impurities capable of
capturing neutrons. Thus furt~er purification beyond the production of
yellowcake is required. The process involves conversion of yellowcake to
uranium hexafluoride (UF6), which can be purified and enriched in the gaseous
state.
Conversion of U30s to UF6 is usually a three-stage operation. In the
first stage, the yellowcake feed is dissolved in nitric acid; the resulting
uraniwn nitrate solution is heated to 550-600°C and decomposed to U03, which
is then reduced with hydrogen or dissociated NH3 to U02. During the second
stage, the U02 is converted to UF4 with anhydrous hydrogen fluoride at
450-650°C and then to crude UF6 with elemental fluorine at 350-500°C. The
third step entails the removal of impurities by fractional distillation.
Table C.4. Uranium Milling - Total Energy Requirements
Electricity Other Energy Energy Requirement (MWh/yr) (1012 J/yr)
Direct 2,248 46.2 Process Materials 34.6 Mill Construction 3.65 5.4
Total 2,252 86.2

82
!EA analyzed the energy requirements for the process, and concluded
that the direct energy used, mostly as natural gas, constituted the major part
of the total energy required. The energy requirements for direct energy,
process material, and plant construction are given in Table C.5 for a plant
assumed to produce 9,090 t/yr of UF6 (6,180 t/yr of U). These values re-
present an assumed plant service life of 30 years. Purification of uranium
uses approximately 4% of the entire nuclear cycle energy requirements.
!EA assumed 100% efficiency in the purification of U308; thus uranium enters
and exits from this operation with a resource energy equivalence of 84,084 x
1012 J.
C.2.4 Enrichment
The gaseous diffusion enrichment process concentrates crude UF6 con
taining about 0.7% u235 to the desired concentration of about 3%. The
process makes use of the different rates at which gases of differing molecular
weights will diffuse through a porous barrier. The lighter UF6 molecules
containing u235 diffuse through the barrier relatively faster than the heavier
UF6 molecules containing u238, thereby separating the UF6 into two streams,
one slightly enriched in the u235 isotope and the other slightly depleted.
The degree of separation in a single diffusion stage is low, but the effect
can be amplified by repeating the process with many stages arranged in cas
cades.
Table C.5. Energy Requirements of Uranium Purification
Electricity Other Energy Energy Requirement (MWh/yr) (1012 J/yr)
Direct Electricity 1,327.76 Natural Gas 169.7
Process Materials 553.78 15.0
Plant Construction Construction Material 19.55 0.8 Direct Construction
Energy 0.78 0.2
Total 1,901.9 185.7
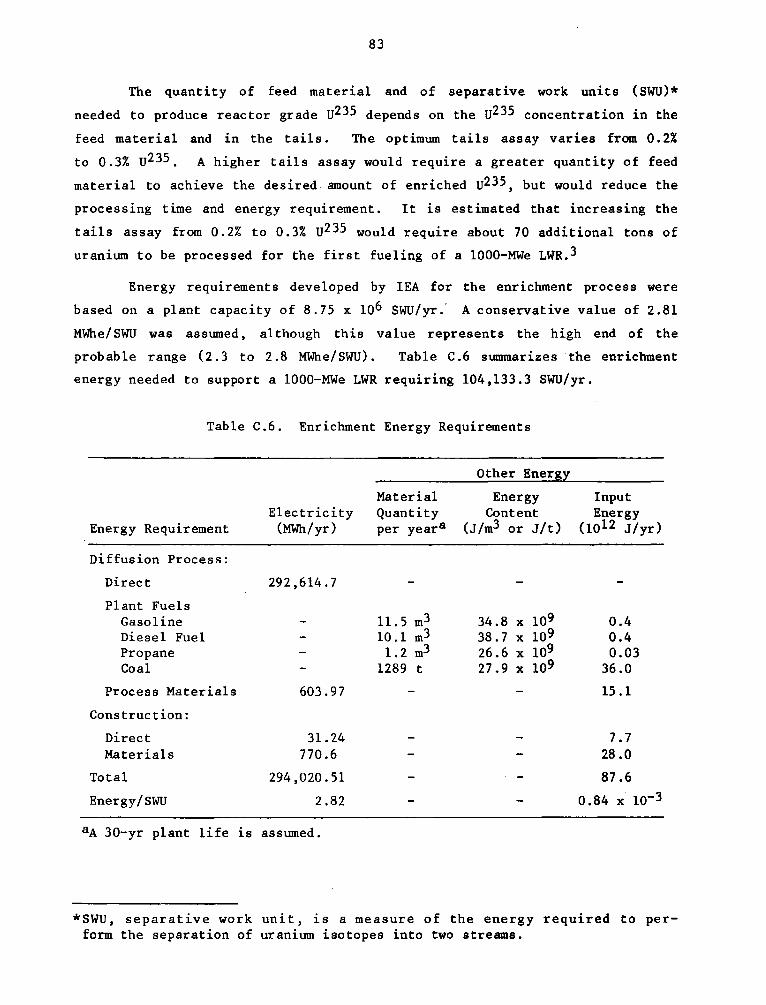
83
The quantity of feed material and of separative work units (SWU)*
needed to produce reactor grade u235 depends on the u235 concentration in the
feed material and in the tails. The optimum tails assay varies from 0. 2%
to 0.3% u235, A higher tails assay would require a greater quantity of feed
material to achieve the desired amount of enriched u235, but would reduce the
processing time and energy requirement. It is estimated that increasing the
tails assay from 0.2% to 0.3% u235 would require about 70 additional tons of
uranium to be processed for the first fueling of a 1000-MWe LWR.3
Energy requirements developed by IEA for the enrichment process were
based on a plant capacity of 8.75 x 10⁶ SWU/yr. A conservative value of 2.81
MWhe/ SWU was assumed, al though this value represents the high end of the
probable range (2 .3 to 2 .8 MWhe/SWU). Table C .6 summarizes the enrichment
energy needed to support a 1000-MWe LWR requiring 104,133.3 SWU/yr.
Table C.6. Enrichment Energy Requirements
Energy Requirement
Diffusion Process:
Direct
Plant Fuels Gasoline Diesel Fuel Propane Coal
Process Materials
Construction:
Direct Materials
Total
Energy/SWU
Electricity (MWh/yr)
292,614.7
603.97
31.24 770.6
294,020.51
2.82
aA 30-yr plant life is assumed.
Material Quantity per yeara
11. 5 m3 10.1 m3 1.2 m3
1289 t
Other Energy
Energy Content
(J/m3 or J/t)
34.8 x 10⁹ 38.7 x 10⁹ 26.6 x 10⁹ 27.9 x 10⁹
Input Energy
(1012 J/yr)
0.4 0.4 0.03
36.0
15.1
7.7 28 .o 87.6
0.84 x lo-3
*SWU, separative work unit, is a measure of the energy required to perform the separation of uranium isotopes into two streams.

84
The enrichment process involves large capital expenditures and consumes
enormous amounts of electric power, with much of the power being used for
recompression of the gas before each diffusion stage. Enrichment accounts for
about 71% of the total energy input required for the nuclear fuel cycle, and
more than 97% of the total electrical input required. Energy requirements for
operation and construction are small compared with the direct energy inputs.
An enrichment operation converting 0. 71% u235 to 3.0% u235 will lose
28.17% of the u235 input. This amounts to 36.71 t of U with an energy equiv
alence of 23,685 x 1012 J/yr. The output from this operation is 22. 77 t of
enriched uranium, representing an energy equivalence of 60,515 x 1012 J.
C.2.5 Fuel Fabrication
Fuel fabrication consists 1n converting the enriched UF6 to a form
usable as reactor fuel. Pelletized uranium dioxide (U02) is the most common
fuel form used in LWR. The enriched UF6 is hydrolized to U02F2, reacted with
NH3 to form ammonium diuranate, calcined to U03, and finally reduced with
hydrogen to UOz at 800°c.4
Fabrication of a fuel assembly involves screening and compacting the
raw U02, pelletizing it under high pressure, and sintering it at high tem
perature. After the uranium content is determined, the high-density pellets
are inserted into cladding tubes. The preferred cladding materials are
aluminum for moderate-temperature reactors and stainless steel or zircalloy
for high-temperature reactors.
In 1975, ten fuel fabrication facilities of three types were oper
ating: four pl ants were equipped to produce U02 pellets, three encased the
pellets, and three were designed for integrated operations .2 For the IEA
study,l an integrated facility was assumed.
The energy requirements were evaluated for a plant producing 600
t/yr of enriched uranium in fuel elements, with a service life of 30 years.
The energy requirements shown in Table C.7 are scaled to the needs of a
1000-MWe LWR, and represent the annual fabrication of 22. 77 t of enriched
uranium into fuel elments.
Material requirements of the process represent the major energy use,
attributable to the required cladding materials. The fuel fabrication step

85
Table C.7. Energy Requirements for LWR Fuel Fabrication
Energy Requirement
Direct Electricity Natural Gas (135l398 m3,
38.4 x 10⁶ J/m~)
Process Materials
Plant Construction Construction Material Direct
Total
Per Metric Ton of Enriched Uranium
Electricity Other Energy (MWh/yr) (1012 J/yr)
2257.7
5.2
4572 55.5
20.2 0.7 0.95 0.2
6850.85 61.6
300.9 2. 71
represents 2.8% of the fuel cycle energy requirements. No loss of enriched
uranium is assumed; therefore, the material energy equivalent leaving this
step remains at 60,515 x 1012 J.
C.2.6 Reactor
The reactor analyzed is assumed to be a 1000-MWe- light water reactor
(LWR) operating at an average capacity factor of 61% over a service life of 30
years. The lifetime electrical output from such a facility is 160,300,000 MWh
(577,085 x 1012 J); 3.5% of this power is used in operating the station. The
capacity schedule of this projected facility is as follows:
Five-month period before commercial operation: 40% First two years of commercial operation: 65% Years 3 through 15: 70% Last 15 years (2% decrease per year): 68% to 40%
The direct energy requirements and process :~aterials energy were
estimated by IEAl using data scaled for a 1000-MWe facility. The direct
fuel consumption is primarily for operation of the auxiliary equipment, which
must remain operational even when the reactor is not functioning. Fuel
consumption amounts to 344 m3/yr (90,900 gal/yr) of diesel fuel.
The largest requirements for process materials energy are for fabrica
tion and replacement of metal products such as valves, pipes, and supports,
and chemicals required in water treatment in the boiler-turbine cycle. These
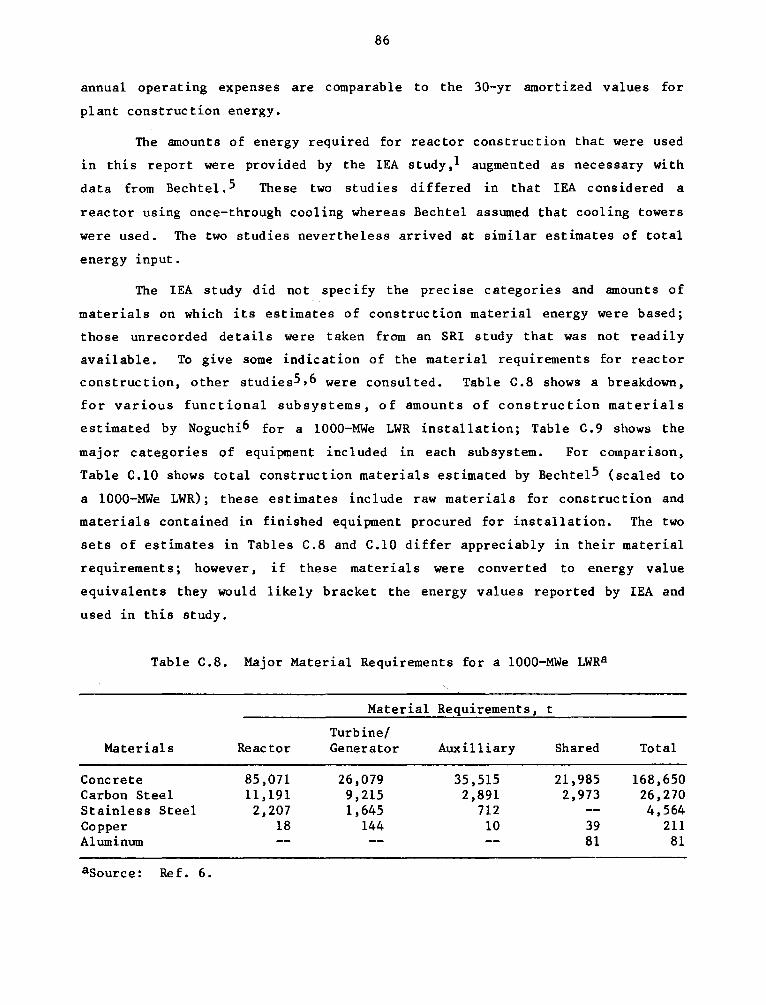
86
annual operating expenses are comparable to the 30-yr amortized values for
plant construction energy.
The amounts of energy required for reactor construction that were used
in this report were provided by the IEA study ,1 augmented as necessary with
data from Bechtel. 5 These two studies differed in that IEA considered a
reactor using once-through cooling whereas Bechtel assumed that cooling towers
were used. The two studies nevertheless arrived at similar estimates of total
energy input.
The IEA study did not specify the precise categories and amounts of
materials on which its estimates of construction material energy were based;
those unrecorded details were taken from an SRI study that was not readily
available. To give some indication of the material requirements for reactor
construction, other studies5,6 were consulted. Table C.8 shows a breakdown,
for various functional subsystems, of amounts of construction materials
estimated by Noguchi6 for a 1000-MWe LWR installation; Table C.9 shows the
major categories of equipment included in each subsystem. For comparison,
Table C.10 shows total construction materials estimated by Bechtel5 (scaled to
a 1000-MWe LWR); these estimates include raw materials for construction and
materials contained in finished equipment procured for installation. The two
sets of estimates in Tables C.8 and C.10 differ appreciably in their material
requirements; however, if these materials were converted to energy value
equivalents they would likely bracket the energy values reported by IEA and
used in this study.
Table C.8. Major Material Requirements for a 1000-MWe LWRa
Material Requirements, t
Turbine/ Materials Reactor Generator Auxilliary Shared Total
Concrete 85,071 26,079 35,515 21,985 168,650 Carbon Steel 11,191 9,215 2,891 2,973 26,270 Stainless Steel 2,207 1,645 712 4,564 Copper 18 144 10 39 211 Aluminum 81 81
asource: Ref. 6.

87
Table C.9. Major Categories for Plant Groupings Shown in Table C.8
Reactor
Building Auxiliary Reactor
Building Reactor Equipment Main Heat Transfer
System Instruments and
Controls Other Equipment
Turbine/Generator
Building Tur/Gen Equipment Feedwater System Condensing System Instrument and
Control Other Equipment
Auxiliary
Fuel Storage Bldg. Safeguard Cooling
System Rad. Waste and
Disposal Fuel Handling and
Storage Circulating Water
System Intake and Discharge
Structures
Table C.10. Major Material Requirements (Metric tons) for a 1000-MWe LWRa
Carbon Steel 47,800 Steel Castings Low-Alloy Steel 4,860 Aluminum Castings Stainless Steel 2,025 Brass & Bronze Castings Copper 2,305 Iron & Steel Forgings Aluminum 670 Structural Steel Shapes Manganese 413 Steel Plate (1.5 in) Chromium 477 Steel Plate ( 1. 5 in) Nickel 82 Cement Cast Iron 900 Concrete
asource: Ref. 5.
Shared
Site Improvements and Facilities
Misc. Buildings Electrical
Plant Equip-ment
315 47 80
372 8,263 5,652 1,796
59,575 562,815
Use of cooling towers instead of once""'.'through cooling systems would
increase the energy requirements for the reactor. Although the actual energy
increases were not readily available, the differences would be approximately
as follows:
• Direct energy requirements for all auxiliaries would increase by about 1% to approximately 4 to 5%.
• Cooling towers would become the most energy-intensive auxiliary in the reactor operation.
• Most of the direct energy would go towards oper~tion of six to eight 3100-HP pumps.
• Process material requirements would increase because the cooling tower would require additional water treatment to inhibit scaling, corrosion, and biofouling.

88
• Construction energy would increase to include the energy content in the superstructure, pumps, fans, and pipe materials.
Table C .11 provides the annual energy requirements for a 1000-MWe
LWR. The reactor portion of the nuclear cycle represents the second largest
energy use, amounting to more than 16% of the total energy input.
The reactor was assumed 33% efficient in production of electricity,
yielding a gross power output of 19,933 x 1012 J/yr. Allowing 3.5% of the
power for internal results in a net power output of 19,235 x 1012 J/yr.
C.2.7 Spent Fuel Storage
Between one-third and one-quarter of the reactor fuel elements are
removed and replaced with new fuel bundles annually. Although only a portion
of the fissionable material is depleted in the fuel elements that are removed,
the accumulated fission products in them reduce operating efficiency by
absorbing neutrons.
The spent fuel rods removed from the reactor are highly radioactive
and are therefore submerged in water for cooling and decay of short-lived
products. They are generally stored at the reactor site for several months to
several years. The bulk of the materia) resources required for storage
facilities is concrete and steel. Most storage systems consist of a pool,
fuel storage racks, pool makeup system, pool cooling and filtering system, and
a remote-controlled fuel-handling system with jib cranes, grapples, and
slings.
Table C.11. Annual Energy Requirements for a 1000-MWe LWR
Energy Requirement
Direct Diesel Fuel (344 m3 at 38.7 x 10⁹ J/m3)
Process Materials
Plant Construction Materials Direct
Total
Electricity (MWh/yr)
8,551
6,543 288
15,382
Other Energy (1012 J/yr)
13. 3
287 .6
271.6 65.3
637.8

89
Fuel storage racks are of stainless steel, aluminum, and neutron
absorbing materials. A stainless steel rack will use from 150 to 250 tons of
stainless steel; aluminum racks require about 75 to 150 tons of aluminum. 7
Many new or expanded storage plants currently are using a neutron-
absorbing material as an integral part of rack construction. The commonly
used materials are Boral plate (boron carbide dispersed in aluminum) or boron
stainless steel.7
Direct process and capital energy requirements were developed by
ERDA in Appendix B of their National Plan for Energy Research, Development and
Demonstration.2 The basis for their estimates for the storage of 22. 77 t
of depleted uranium (containing about 0.8% u235) each year was not reported in
that docwnent.
It is assumed that the estimates represent interim waste fuel storage
at the reactor facility and longer-term storage either at another plant
in the utility system or at a commercial storage facility.
A summary of the energy requirements for spent fuel storage, as de
veloped by ERDA,2 appears in Table C.12. This portion of the nuclear cycle
represents less than 0.3% of the cycle's total energy requirements.
The IEA values for this portion of the nuclear pathway are summarized
in Table C.13. The values represent the energy requirements for the handling,
packaging, and storing of the estimated ten canisters of waste accumulated
each year. The dominant energy requirement is for the process materials:
Table C.12. Annual Fuel Storage Requirements
Energy Requirement
Direct Electricity Other Fuels
Process Materials
Facility Construction Materials Direct Construction
Total
Electricity (MWh/yr)
242.7
81
129.3
453.0
Other Energy (1012 J/yr)
0.16
2.26
6.13
8.55
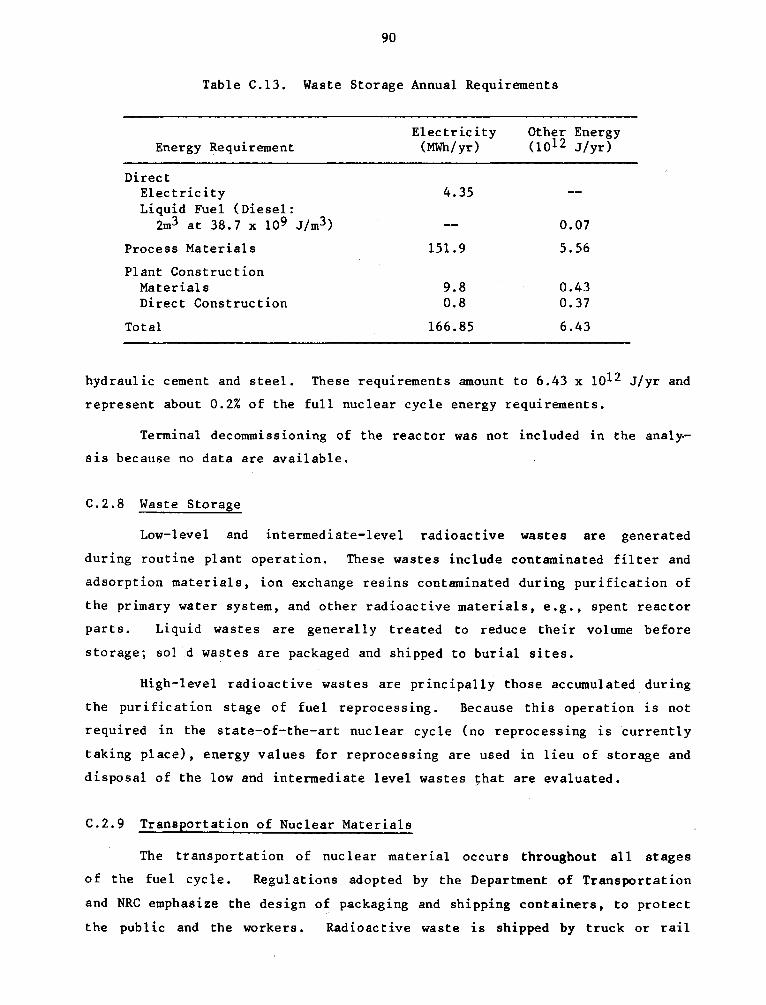
90
Table C.13. Waste Storage Annual Requirements
Energy Requirement
Direct Electricity Liquid Fuel (Diesel:
2m3 at 38.7 x 10⁹ J/m3)
Process Materials
Plant Construction Materials Direct Construction
Total
Electricity (MWh/yr)
4.35
151.9
9.8 0.8
166.85
Other Energy (1012 J/yr)
0.07
5.56
0.43 0.37
6.43
hydraulic cement and steel. These requirements amount to 6.43 x 10¹² J/yr and
represent about 0.2% of the full nuclear cycle energy requirements.
Terminal decommissioning of the reactor was not included in the anal~
s is because no data are available.
C.2.8 Waste Storage
Low-level and intermediate-level radioactive wastes are generated
during routine plant operation. These wastes include contaminated filter and
adsorption materials, ion exchange resins contaminated during purification of
the primary water system, and other radioactive materials, e.g., spent reactor
parts. Liquid wastes are generally treated to reduce their volume before
storage; sol d wastes are packaged and shipped to burial sites.
High-level radioactive wastes are principally those accumulated during
the purification stage of fuel reprocessing. Because this operation is not
required in the state-of-the-art nuclear cycle (no reprocessing is currently
taking place), energy values for reprocessing are used in lieu of storage and
disposal of the low and intermediate level wastes ~hat are evaluated.
C.2.9 Transportation of Nuclear Materials
The transportation of nuclear material occurs throughout all stages
of the fue 1 cycle. Regulations adopted by the Department of Transportation
and NRC emphasize the design of packaging and shipping containers, to protect
the public and the workers. Radioactive waste is shipped by truck or rail

91
over public transportation routes, and the regulations result in extra energy
costs for the transport of fuel material and containers.
The transportation energy requirements reported by ERDA categorize
transportation in two cycles, the first being the pre-enrichment transport
of natural uranium and the second being the transport of enriched fuel or
enriched uranium.
The transportation distances between the mine and the mill site are
considered small since the mill is usually located near the mine site. The
energy requirements for the trucks and fuels were slight and were included as
part of the energy requirements of the milling operation.
The energy requirement for the transport of U30s from the mill to
the purification plant was computed by assuming a typical travel distance,
which was multiplied by a transportation intensity value (J/t-km) and a
"shipment factor." This shipment factor is the ratio of total cargo to total
uranium. A distance of 1290 km (800 miles) was assumed, with an intensity
factor of 1.96 x 10⁶ J/t-km (2720 Btu/ton-mi) for truck haulage and a shipment
factor of 1.5 to account for the containers, equipment, and oxygen content of
the U308· This results in an estimate of 3.44 x 10⁹ J/t of uranium for
transportation from the mill to the purification plant.
The energy requirement for material transport from the purification
plant to the enrichment plant was calculated similarly. A shipment factor of
2. 24 was used to account for the containers required in the shipment of UF6
gas. The mileage between processing plants was assumed to be 1290 km (800
miles) and the transport performed by truck; the direct energy required
amounts to 5. 2 x 10⁹ J. This information, scaled from the IEA report, is
presented in Table C.14.
The direct transportation energy requirement includes the necessary
shipping containers and other protective equipment. The indirect energy
includes the energy content of the trucks and all loading, unloading, and
docking facilities.
Post-enrichment transportation energy was similarly developed, but
now represents enriched fuel rather than natural uranium. Also, transport by
rail is included, with an energy intensity factor of 0.40 x 10⁶ J/t-km
(550 Btu/ton-mile). The data are shown in Table C.15.

92
Table C.14. Transportation Energy Requirements: Ore Mill to Enrichment Plant
Energy Elec-Shipment Distance Intensity tricity
Transport Energy Factor (km) oo6J/t-km) (MWh/yr)
Indirect 13.7
Direct (Total)
Mill to Purification 1.5 1,290 1.96
Purification to Enrichment 2.24 1,290 1.96
Total Energy 13.7
Other Energy
(1012 J/yr)
0.86
1.12
0.45
0.67
1.98
Table C.15. Transportation Energy Requirements: Enrichment to Storage or Reprocessing of Waste
Elec- Other Energy tricity Ener~y
Shipment Distance Intensity (MWh/ 001 Transport Energy Factor (km) (106 J./t-km) yr) J/yr)
Indirect 51.5 3.24
Direct (Total) 4.24
Enrichment to Fabrication 4.0 1,290 1.96 0.84
Fabrication to Reactor 7.0 805 1.96 0.23
Reactor to Reprocessing:
Truck 100 480 1.96 1.96
Rail 30 1, 770 0.4 0.44
Waste Shipment 10 1,610 1.96 0.65
Recycle of u + Pu 2.25 1,290 1.96 0.12
Total Energy 51.5 7.48
The transport of fuel does not have a sizeable impact upon the nuclear
cycle's energy requirements; it amounts to about 0.2% of the total. There
fore, the above values would not change appreciably if reprocessing energies
were not substituted for low-level waste storage.

93
C.3 ENERGY BALANCE PARAMETERS
This analysis has discussed the energy requirements for each stage of
the nuclear fuel cycle as it exists today, including all fuel processing,
transportation, and waste storage needed for supplying a 1000-MWe light water
reactor with a 30-yr service life and an enrichment tails assay of 0.2%, and
excluding reprocessing of the residual uranium and plutonium in the spent
fuel.
Figure C.2 shows an energy flow diagram for the nuclear cycle with
resources, energy equivalence values, and losses. The energy flow values were
based on the total power output of the plant operating according to the
efficiencies described previously, i.e., a one-year annualized output of 1.92
x 1016 J. The residual energy remaining in the depleted fuel rods was con
sidered as lost energy for purposes of this analysis.
Table C.16 summarizes the energy requirements for the entire fuel
cycle, with electricity and fuel use converted to energy equivalents using the
methodology of Appendix A.
C.4 IDENTIFICATION OF SENSITIVE DATA
Some possibilities exist for decreasing the overall energy requirements
of the fuel cycle. Increasing the plant capacity from 61% to 75% would
reduce the energy input requirements by about 5%. Increasing the enrichment
tails assay from 0.2% to 0.3% would reduce the energy input by approximately
15%. Addition of fuel reprocessing would lower the energy input requirements
by more than 20% (assuming no major changes in the system components), with
the bulk of the energy reduction occurring from a decrease in the quantity of
fuel requiring enrichment.
Reactor decommissioning and ultimate disposal of high-level wastes
and spent fuel would add another step in the fuel cycle and slightly increase
the energy input requirements reported here.
The greatest potential for increasing the net efficiency of the LWR
fuel cycle is likely to occur in the enrichment operation. This report
considers the enrichment operation by the gaseous diffusion process. However,
gas centrifugation processes hold promise for drastically reducing direct-
energy requirements. The electrical input for centrifugation has been esti-
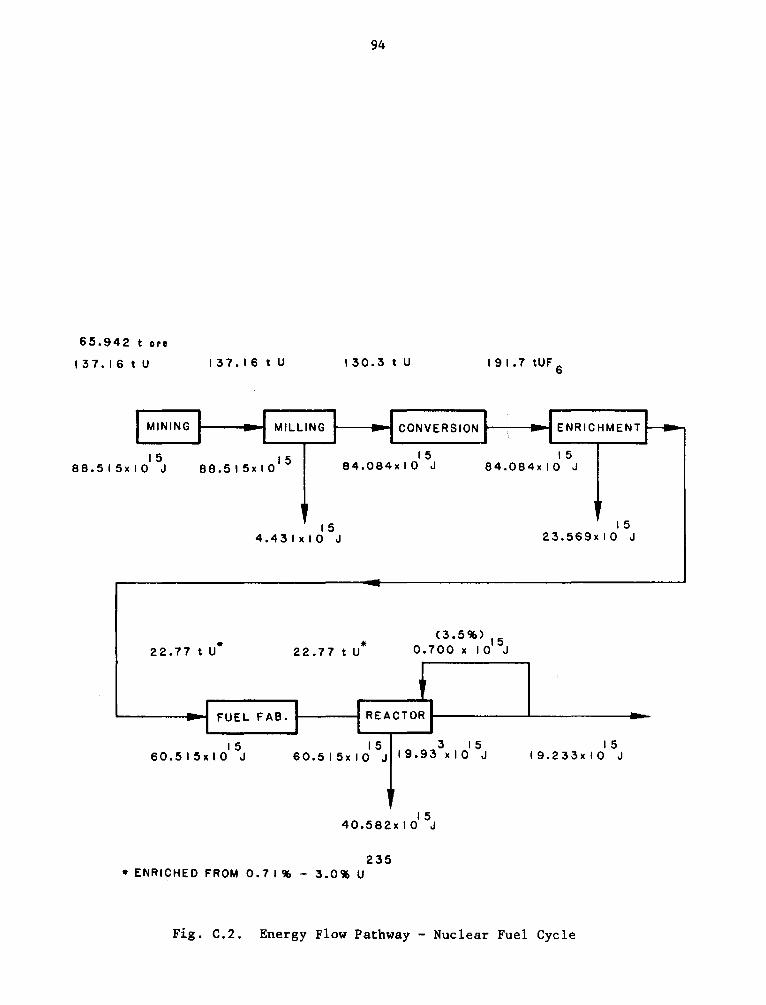
94
65.942 t ore
I 3 7. I 6 t U I 3 7. I 6 t U I 3 0. 3 t U I 9 I • 7 tUF S
MINING MILLING CONVERSION ENRICHMENT ............. -.
I 5 15 15 I 5 88.515xl0 J 88.515xl0 84.084Kl0 J 84.084xl0 J
• 22.77tU
15 4.431xl0 J
* 22.77tU
(3.5%) 15 O. 700 x I 0 J
15 23.569K I 0 J
FUEL FA B • .,__ ___ RE ACT OR 1--------1---------1-
15 60.515xl0 J
15 3 15 60.515xl0 J 19.93 xlO J
15 40.582x I 0 J
235 • ENRICHED FROM 0. 7 I% - 3.0% U
15 19.233xl0 J
Fig. C.2. Energy Flow Pathway - Nuclear Fuel Cycle

Table C.16. Energy Balance Parameters for Nuclear LWR System
Annua I Primary Input
System Element
Urani1111 Mining
Uranium Hilling
Conversion
Enrichment
Typ•
Uranium.
Uranium
UraniWll
UF6
Quantity (t)
137 .2
137 .2
130.3
191. 7
Fuel Enriched 22 .8 Fabrication Uranium
Reactor
Spent Fuel Storage
Waste Storage
Transport
Enriched Uranium
22.8
Depleted 22 .8 UraniU11.
Energya ( 1015 J)
88.515
88 .515
84.084
84 .084
60.515
60.515
NA
NA
NA
Total Capital Inputs
Type
Electricity Fuels Total
Ele-1.:tricity Fuels Materials Tot al
Quantity
6.21 x 10⁶ kWh• 465.0 x 10¹² J
0.11 x 10⁶ kWh• 27.0 x 10¹² J
NA
Electricity 0.023 x 10⁶ kWhe In 11.aterials 0.587 x 10⁶ kWhe
Fuels 0.2 x 10¹² J Materials NA Total
Electricity 0.94 x 10⁶ kWhe In uterials 2l.12 x 106 kWhe
Fuels 2lt .O x 1012 J Materials Total
NA
Electricity O.Ol x 106 kWhe tn Materials O .6l x to6 kWhe
Fuels 6.0 x 10¹² J Mater-ials NA Total
Electricity in materials
Fuels Materials Total
Electricity H.nerials Total '
Electricity Fuels Materials Tot.al
Electrit:i ty Materials Total
8.64 x 10⁶ kWhe 196.lO x 106 kWhe
l.959 x 1015 J NA
3 .88 • 106 kWhe NA
0.02 x 10⁶ kWhe 12 .0 x 1012 J
NA
I. 96 x 106 kWhe NA
Energyb 00 15 J)
0.0852 0.5618 0.6470
0.0015 0.0326 O. ll50 0.1691
0.0003 0.0081 0.0073 0.0240 0.0l97
0.0129 O.ll68 0.2790 0.8400 1.4487
O.OOOl 0.0084 0.0073 0.0210 O.Ol70
0.1185 2 .6892 2. l669 8.1480
13.l226
0.0531 0.1830 0.2361
O.OOOl 0.0144 0.0120 O.Ol06
0.0267 0.1230 0.1497
Annual Operating Inputs
Type
Elect ri~i ty Heavy fue I oi L Diesel fuel Gasoline Other petroleum Natural gas Process 111aterial!'l Total
Electricity Heavy fuel oil Diesel fuel Gasoline Other petroleum Natural ~as Sulfuric acid Other m.ated.als Total
Electricity Natural gas Process materials Total
Quantity
l. 59 x 106 kWhe 25. l m3/yr
789 .9 m3/yr 46.7 m3/yr
Jll. 20 m3/yr 20,051 m3/yr
NA
2.25 x 10⁶ kWhe 68.l ml/yr
200. 5 m3/yr 6. l ml/yr
25 .6 ml/yr 877, 920 ,.l /yr
NA NA
l.l3 x 106 kWhe 4.33 x 10⁶ ml/yr
NA
Electricity 292 .6 x 106 kWhe In materials 0.6 x 10⁶ kWhe
Gasoline ll.'S m3/yr Diesel Fuel LO .1 ml/yr Propane l.2 ml/yr Coal 1289 t/yr Process :materials NA Total
Electricity In materials
Natural gas Process materials Total
Electricity In materials
Diesel fuel Process materials Total
Electricity In materials
Fuels Process cateri als Total
Electricity In materials
Diesel fuel Process materials Total
Fuel
2.26 x 10⁶ kWhe 4.57 x 10⁶ kWhe
0.14 x 10⁶ ml NA
( 0. 19 x 109 kWhe )< 8.55 x 10⁶ kWhe
344 ml NA
0.25 x 10⁶ kWhe 0 .08 x 106 kWhe 0.2 x 10¹² kWhe
NA
0.004 x 10⁶ kWhe 0.15 x 10⁶ kWhe
2 ,.l /yr NA
5.36 x 10¹² J
8Energy input and output computed as heat content of fuels or joule equivalent of electricity generated.
bcapit•l and operating energy input computed by 1/0 analysis as energy cost of fuels, 111aterials, and elect•icity used.
Cinteraal u&-e, included i.n output totals only.
Energyb 0015 J)
0.0217 0 .0012 0.0370 0.0019 0.0018 0.0009 O.Ol06 0.0951
0.0308 0.0034 0 .0094 0.0002 0.0012 0.0379 0 .0074 0.0272 0.1175
0.0182 0.1868 0.0150 0.2200
4.0088 0 .008l 0.0005 0.0005 0 .00004 0.0362 0.0151 4 .0094
O.Ol09 0.0626 0.0057 0.0555 0.1547
(0.70QO)C O. l 172 0.0161 0.2876 0.4209
0.0033 0.001 l 0.0002 0.0023 0.0069
0.0006 0.0021 0.0012 0.0056 0.0079
0.0065
Annual Primary Output
Type
Uranium
Urani u111
UF6
Enriched Uranium
Enriched Uraniutn
Electricity Gross Internalc Ne<
Quantity
l37 .2t
130.lt
191. 7t
22.8t
22 .8t
Energya 0015 J)
88.515
84 .084
84.084
60.515
60.515
5.54 x 10⁹ kWhe 19.93l (0.19 x 10⁹ kWhe) (0.700) 5.l5 x t09 kWhe 19.233
NA
NA
NA
'° VI

96
mated at between 4%1 and 10%8 of current diffusion power requirements (100
to 250 kWh/SWU versus 2500 kWh/SWU). Moreover, a 30% increase in enrichment
capacity could be handled by existing utility grids.8 Although centrifugation
offers lower power consumption, it does not show a commensurate reduction in
total cost per SWU. However, it st il 1 is thought to be more economical.

97
REFERENCES TO APPENDIX C
1. Perry, R., A. Perry and D. Reister, Net Ener>gy fr>om Nuc'lear> Power>, Institute for Energy Analysis, Oak Ridge Associated Universities, OEA-75-3 (Nov. 1975).
2. A Nationa'l P'lan for> Ener>gy Resear>ch, Deve'lopment and Demonstr>ation; Cr>eating Ener>gy Choices for> the Futur>e, Appendix B, ERDA 76-1 (Apr. 1976).
3. Woodmansee, W., Ur>anium, from Mineral Facts and Problems, Bureau of Mines, U.S. Dept. of Interior, p. 1185 (1975).
4. Babcock and Wilcox, Steam/Its Gener>ation and Use, 38th Edition (1972).
5. Bechtel National, Inc., Resour>ce Requir>ements, Impacts, and Potentia'l Constr>aints Associated ~ith Var>ious Ener>gy Futur>es, Contract #EX-77-C3794 for U.S. DOE, Report #PAE-3794-9 (Aug. 1978).
6. Noguchi, T., Ener>gy Requir>ement of a 1000 We Pr>essur>ized Water> Reactor> Power> Station, draft paper E-42, the University of Chicago, Resource Analysis Group (Dec. 1977).
7. Gener>ic EIS on Handling and StoY'O.(!e of Spent Light Water Reactor> Fue'l N.R.C., NREG-0404, Vols. 1 and 2 (Mar. 1978).
8. Olander, D., The Gas Centr>ifuge, Scientific American, v. 239(2), pp. 37-43 (Aug. 1978).

99
APPENDIX D
TERRESTRIAL SOLAR ENERGY SYSTEMS

101
This appendix describes the details of the terrestrial solar power
systems used in the analysis.
discussed.
D.l PHOTOVOLTAIC SYSTEM
Both photovoltaic and thermal systems are
D.1.1 Description of the Overall System
The conceptual designl for the photovoltaic plant analyzed calls
for an estimated peak capacity of 1000 MWe and a capacity factor of 55%, with
limited storage to compensate for loss of insolation. The plant is assumed to
be operational 329 days (i.e~, 90%) of the year. With lithium/sulfur bat
teries capable of storing 6.097 x 10¹² J/day, the plant would operate 10
hr/day to yield a total of 1.978 x 10¹³ J/day or 6.058 x 10¹⁵ J/yr given a
daily mean insolation of 3.150 x 10¹⁴ J/day. The plant's net efficiency for
days of operation is 6.28%. Plant lifetime is assumed to be 30 years, battery
lifetime to be 5 years,l and silicon cell lifetim~ to be 30 years. All
capital inputs are stated for a 30-yr plant lifetime.
D.1.2 System Elements
Figure D.l gives a schematic diagram of the elements of the system.
Insolation. Insolat ion is a diffuse energy source that varies with
nearness to the equator and with regional climate factors such as cloud
cover. The mean daily insolation is that solar energy which is normal to the
earth's surface. The terrestrial photovoltaic plant analyzed is assumed to be
situated in Barstow, California,2 where the mean daily insolation is approx
imately 480 langleys (i.e., 2.01 x 10⁷ J/m2-day). The insolation used for
this analysis is based on an average for the winter solstice, equinoxes, and
summer solstice, assuming the use of a tracking reflector system that captures
solar radiation equal to 3.39 x 10⁷ J/m2-day, somewhat more than the mean
insolation of 2.01 x 10⁷ J/m2-day.
Solar Array Module. The solar array is composed of 50, 000 single
axis modules spaced on 32.9-m centers in a NS-EW grid pattern occupying 52 km2
(12,840 acres). Each module is composed of 14 linear-focus, reflective con-

SOLAR
MODULE
1
SOLAR
MODULE
2
SOLAR
MODULE
100
i---.
..L" ;;/""
---
r---- POWER CONDITIONING MODULE ------, 34 KV
DISTRIBUTION
LINE REGULATOR INVERTER _ I •
1 r
CONTROLLER BATTERY
L ___ I __________________ _J
CENTRAL
CONTROL ROOM
Fig. D.l. Power Conditioning Module Functional Block Diagram1
230 KV
TRANSMISSION
LINE
-~g
SH ':!;::
UTILITY ~
...... 0 N

103
centrators (i.e., parabolic troughs). The troughs are arranged side by side
on a plane inclined 45° from the horizontal. The primary concentrator is 1.2
m x 12.2 m, with a 12.7 cm x 12.2 m absorber strip mounted directly over the
focal point of the trough. The total collector area of each module (less the
surface area shaded by the absorber) is 186 m2. The geometric solar concen
tration ratio of the collector to absorber is 18.
The absorber has a 6.1-cm x 12.20-m strip of single silicon cells
contained within a Winston-type concentrator with a 12.2 cm aperture. The
absorber containing the silicon cells is passively cooled by ambient convec
t ion. Nominal cell temperature is 100°C.
This solar array module was selected as representative of the current
and near-term state of the art. Other photovoltaic materials as well as
collector designs are currently being developed for possible commercialization
in the future.
The primary energy input i.s 3.150 x 10¹⁴ J/day, assuming the average
daily insolation per year available with the tracking system in Barstow,
California. The ancillary energy input is electrical energy used to rotate
the solar modules; this energy is part of the 7. 235 x loll J/day ( 3. 5% of
gross output) tapped from plant output as total auxiliary power. The prin
cipal capital input is 1.89 x 10⁶ kg of pure monocrystalline silicon.
System output is 2.380 x 10¹³ J/day as electricity (6.61 x 10⁶ kWh/
day), assuming the silicon cells are 16% efficient at 60°c.3 The linear
temperature correction equation for cell efficiency4 reduces the single cell
efficiency to 13% at the operating temperature of 100°C. The matrix of single
cells (including the conductive bridge) occupies 85%3 of the total absorber
area. Series resistance of the cell matrix results in a 10% energy loss.3
The parabolic trough collector has an efficiency of 69% with north-south
tracking. The overall efficiency is the product of the efficiencies of the
cell, the module, and the collector, which is equal to 7.55%. Losses are
reflected solar energy and heat released to the atmosphere, which total 2,914
x 1014 J/day.
Power Regulator, Controller, and DC Collection Network. The power
regulator, in conjunction with the controller's microcomputer, follows the
characteristics of the solar module for variations in'solar input and temper-
104
ature to maximize power output for each solar module. The power regulator and
controller are part of the power conditioning module. There are 500 power
conditioning modules, each servicing 100 solar modules. The power regulator
consists of a smoothing reactor, and interphase reactor, and the direct
current (DC) collection network.
The daily input to the collection network is 2. 380 x iol3 J/day from
the solar array. The ancillary energy inputs are in the form of electrical
energy for operating switches and cooling fans; this ancillary energy is
supplied by the plant.
Capital material inputs! have been aggregated for the entire plant:
835 x 106 kg steel, 260 x 106 kg cement, 1.4 x 10⁵ m3 water for cement,
and 1.08 x 10⁵ kg copper for the DC collection network. The gross ouput, at
an overall efficiency of 98%,5 is 2.33 x 10¹³ J/day of electrical energy.
About 4.75 x lQll J/day is lost in electrical resistance and released to the
environment as heat.
Lithium/Sulfur Storage Batteries. Lithium/sulfur batteries! will
be located in a 3. 7 m x 16.8 m battery building, an all-steel construction
with a 15 cm-thick reinforced concrete floor. The battery bank will be 2.4 m
x 12.2 m x 3.1 m high with a nominal weight of 79 t. The eel ls operate at
450°C, but the batteries are insulated so that the ,exterior surface temper
ature is 32°C. Auxiliary resistance heaters are embedded in the battery banks
for reheat in the event of an id le period exceeding two days. Normally,
however• self-generated heat will maintain the batteries within their oper
ating temperature range, and no additional power will be needed. (Waste heat
is removed by circulating air.) Should heat be required, the auxiliary
heaters will expend about l kW/100 kW generating capacity.
The primary energy input to the batteries is 7.624 x 10¹² J/day (2.12
x 106 kWh/day) for charging them. The major capital material input is 14.4 x
106 kg of lithium, assuming a 5-yr battery life.
The net output is 6.097 x 10¹² J/day (1.69 x 10⁶ kWh/day). About
6.08 x ioll J/day (8% of the input) is lost on charging, and 9.14 x 10¹¹ J/day
(about 12% of the input) is lost on discharging the batteries. These losses
are expended to atmosphere as heat.

105
DC/AC Inverter. The DC/AC inverter converts regulated DC to 60 Hz
AC at 34 kV. An inverter is included in each of the 500 power conditioning
modules. Total input is 6.097 x 10¹² J/day from battery storage and 1.570 x
1013 J/day directly from the power regulators, for a total of 2.1797 x 10¹³
J/day (6.06 x 10⁶ kWh/day). Thus about 72% of the total input to the in
verters comes directly from the solar module; there are no ancillary inputs.
Data on capital input materials were nbt available. Only the total inverter
cost was available ($29.51 x 10⁶ in 1975 dollars5). This cost was converted
to an energy equivalent using the input/output method described in Appendix
A.
Transformer. Transformers are also included in the power conditioning
modules; they convert the 34 kV to 230 kV for the AC transmission network.
Total input is 1.999 x 10¹³ J/day. There are no ancillary inputs. Data on
capital inputs were limited to costs ($34.63 x 10⁶ in 1975 dollars5).
Output is 1.978 x 10¹³ J/day or 6.508 x 10¹⁵ J/yr assuming 329 oper
ating days per year and 99% efficiency. 5 Losses are 1. 999 x 1011 J/day, as
heat due to electrical resistance.
D.1.3 Energy Balance Parameters
Figure D. 2 gives a schematic de script ion of the energy flows in the
terrestrial photovoltaic system. Table D.l give the values of the parameters
used in the net energy balance.
D.1.4 Identification of Sensitive Parameters
This section will describe some of the more sensitive data and indicate
the ranges of possible values.
Insolation. The area chosen for the plant site is in the Southwest,
which is the most suitable part of the U.S. for terrestrial solar energy.
The Southwest has an average daily insolation of approximately 1.88 x 10⁷
J/m2-day. Some areas (El Paso, Phoenix, Tucson, etc.) receive as much insola
tion as 2.41 x 10⁷ J/m2-day. The Midwest, North and East Coast have much
lower average insolation levels of 1.5 x 10⁷ J/m2-day. Moreover, indirect
insolation from cloud cover cannot be effectively utilized by a tracking

Table D.l. Energy Balance Parameters for Terrestrial Solar Photovoltaic System
Annual Primary Input Total Caeital Ineuts Annual Output
System Element
Collectord
Power Regulator Controller, DC Collection Networkd
Batteryd
Inverter
AC Distribution Line System
Transformer
Entire Plant
Type
Solar Radiation
Electricity
Electricity
Electricity
Electricity
Electricity
Quantity (kWhe)
Ener~ya (101 J)
- 115.048
2.18 x 10⁹ 7.830
0.10 x 10⁹ 2.508
1.99 x 10⁹ 7.171
1.89 x 10⁹ 6.814
1. 82 x 109 6.576
Type Quantityb Ener~yc 001 J) Type
Silicon 1,890 t 94.58oe Electricity
Copper 108 t 0.0272 Electricity to Battery to Inverter
Lithium 2,400 t 6.480 Electricity to Inverter
Equipment $29,510,000 1. 370 Electricity
----------(Included below)----------- Electricity Gross Internald Net
Main trans- Electricity formers $28,570,000 l.f)_Ol
Substation transformers $ 6,060,000 0.339
Miscellaneous Electrical Equipment $24,380,000 1.130
Steel 835,000 t 22.500 Cement 260 ,000 t 0,936
aEnergy input and output is computed as heat content of fuels or joule equivalent of electricity generated.
bDollar amounts are in 1975 dollars.
ccapital energy input computed by 1/0 analysis as energy cost of fuels, materials, and electricity used.
Quantity (kWhe)
2.18 x 10⁹
o. 70 x 109 1.43 x 10⁹
o. 56 x 109
1.89 x 10⁹
1.89 x 10⁹ (0.07 x 10⁹)d 1.82 x 10⁹
1. 81 -x- io9
Ener~ya (lol J)
7.830
2.508 5.165
2.006
6.814
6.814 (0.238)d 6. 576
6.508
dAnnual operating input consists solely of auxiliary electricity tapped from output for internal use; the total is shown as "ElectricityInternal" under Annual Output.
eBased on 13,900 _kWht/kg; current state-of-the-art of manufacturing.
t--' 0
°'

1.037110 171 J/1 (SOLARI
'10 = (.13) l.84ll.69) • .0755
SINGLE CRYSTAL SILICON CELL PARABOLIC SILICON CELL MODULE Tl= . 84 TROUGH
i...- 'l•.13@ 100•c COLLECTOR 'I• .69
TRACKING MOTORS
1.570(10 13 )J/d (ELECTRICAL!
4. 75(lO11 ) J/d I 6.08 ( 10 ll) J/d 9.14 ( 10 11 1 J/d (THERMAL CHARGING ~ DISCHARGE RESISTIVE) (ELECTRICAL l (ELECTRICAL)
POWER REGULATOR BATTERY 2. 380( 1013 ) J/d 8 CONTROLLER 7. 624 (10 12) J/d STORAGE ti.097 (10 121 J/ d
8 0.C. NETWORK Li.IS (ELECTRICAL l I ELECTRICAL) (ELECTRICAL) '1•.98 '1• 0.8
t ' AIR COOLING SYSTEM
' 7.235(10 11 ) J/d
(ELECTRICAL)
ELECTRIC 1. 978 ( 10 13 l J/ d TRANSFORMER DISTRIBUTION
1. 999 (1013) LINES ( ELECTRICALI '1 • .99 J/d
y (ELECTRICAL I
· IELECTRICALI
I en
DC/AC INVERTER 'I •.95
!.0 IEl
AUXILIARY ENERGY FOR TOTAL PLANT '1=. 965
1.091( 1012) J/d HllAL-RESISTI VE l
,7, 10 l3) J/d ECTRICALI
Fig D.2. Energy Flow of 1000-MWe Solar Photovoltaic Plant in Barstow, California
....... 0 ....,
108
system. If the representative plant were located in Chicago, where the
average insolation is 1.47 x 10⁷ J/m2-day, the resulting daily output of
electricity would be almost 30% }1
ess, although the energy investment in
materials would be the same.
Photovoltaic Cells. Critical properties of photovoltaic materials
are the bandgap energy, iriternal resistance, and cell temperature. All
these properties affect the generation of electricity.
Photovoltaic material is relatively transparent to light of wavelengths
1 anger than the value of the bandgap energy 1evel.8 For sunshine at ground
level, optimum bandgap energy is about 1.45 electron volts (eV), which is very
close to the value for gallium arsenide (1.43 eV at 20°C) and somewhat greater
than that for silicon (1.2 eV at 20°C). lherefore gallium arsenide is able to
convert more of the solar energy into electrical energy than silicon. Also,
absolute heat-sink temperatures can be about 20% higher for gallium arsenide
than for silicon.8 This means that the output of electricity would decrease
20% less for gallium arsenide than for silicon as the temperature increases
above reference temperature. Gal 1 ium arsenide 1s also unusual in that, at
temperatures as high as 200°C, it still has an efficiency of 14% with a
270-fold concentration of solar radiation (i.e., geometric concentration
ratio),
Table D. 2 shows currently achieved and theoretical efficiencies of
photovoltaic cells, and the efficiency goals set by DOE, which may be achiev
able with further. development, The upper bound of efficiency of photovoltaic
materials is 26% at 60°C and about 17 .6% at 100°C. lhe efficiency of the
photovoltaic material 1s the critical efficiency (i.e., smallest efficiency)
among the components of a photovoltaic generating plant. Replacement of
silicon cells with gallium arsenide cells would increase plant output to 2.678
x 1013 J/day, giving the plant a new net efficiency of 8.5% as opposed to
6.28%.
Collector. The efficiency of the collector may be increased by using
a different design or more efficient materials (e.g., reducing reflected
losses, or providing more accurate tracking of the sun). Improving the
collector efficiency to 80% would increase output (all else being the same) to

109
Table D.2. Solar Cell Efficienciesa,b
E ffic ienc~'.'.> %
Cell Type Achieved Goal Theoretical
Silicon Single Crystal 16 18 22 Polycrystalline 10 15 22 Amorphous 5 ~10 unknown
GallilDll Arsenide Single Crystal 18 20 26
CadmilDll Sulfide Vacuum Deposition 8 12 14-16C Spray 5 10 unknownd
asource: Ref. 3.
hwithout concentration and at reference temperature, 60°C.
cTheoretical understanding is still in formative stages.
dshould approach that of vacuum-deposited cells.
2.293 x 10¹³ J/day, raising the net plant efficiency to 7.28%. However,
increasing the solar flux at the absorber would increase the cell temperature
and (especially for silicon) decrease electrical production. Also, if the
photovoltaic cells were actively cooled, energy would have to be expended for
cooling fluid or fans.
Concentration Factor of Collector. A collector with greater concen-
trating ability would increase the incident solar flux on the photovoltaic
cell, and thus increase the electric energy generated per unit area of cell;
however, the temperature would also increase, which reduces power generation
(more so for silicon than for gallium arsenide). Also, as the current per
cell increases with solar flux, so does the power lost through the cell's
resi.stance. The usual resistance of solar cells is in the vicinity of 1 to 10
ohm-cm. The optimum resistance of the bulk material is about 0 .1 to 0. 3
ohm-cm. A variety of designs are under consideration that would reduce the
resistance of the solar cell.lo These involve changing the geometry of
the conventional planar cell in such a way that the series resistance is
decreased. For instance, laboratory studies have indicated that use of a
thick layer of aluminum gallium arsenide provides an improved series resist-

110
ance by reducing the series resistance components.10 Another low-resistance
design is the edge-illuminated silicon cell, which has multiple series
connected junctions that are perpendicular to the front surface. Solid
contacts and elimination of the need for current travel along a thin diffused
sheet results in a greatly improved series resistance.
Energy Consumption for Si Production. The input energy requirements
for silicon production have already been discussed in Appendix A.
D.2 THERMAL SYSTEMS.
D.2.1 Description of the Overall System
The terrestrial solar thermal electric plant is based on a two-year
research and development program to develop technology for a 10-MWe central
receiver pilot plant, which is currently being built in Barstow, California
under the sponsorship of DOE. The system evaluated is a 100-MWe design which
has been designated as the commercial scale plant. Under the sponsorship of
DOE and the technical management of Sandia Laboratories, three contract teams,
headed by Honeywell, Martin Marrietta, and McDonnell Douglas, completed
parallel and competing programs to develop conceptual designs for a pilot
pl ant of 10 MWe as a basis for a 100-MWe commercial plant. The McDonnell
Douglas design was chosen, and was used as the basis for this evaluation.
D.2.2 System Elements
Figure D.3 gives a schematic diagram of the system elements described
below.
Insolation. The representative terrestrial thermal plant is assumed
to be situated in Barstow, California, where average insolation is 3.39 x.107
J/m2-day, as discussed in Section D.1.2.
Collector. The collector is a flat glass plate heliostat with a
front-surface silver coating under an acrylic coating. The heliostat has a
reflective area of 38 m2 (6.1 m square) with a net reflectivity of 91%.
Heliostats have motor drives to position them both vertically and horizon-

111
RECEIVER
TOWER
TRACKING HELIOSTATS
STEAM TURBINE
THERMAL STORAGE
ELECTRICAL POWER TRANSMISSION
NETWORK
ELECTRIC .._ _ __,GENERATOR
NIN/1/111//11
Fig. D.3. Schematic Diagram of Solar Thermal Plant

112
tally. The collector array consists of 22,914 heliostats spaced around a
central receiver tower in a staggered radial pattern.
869,586 m2 of glass, and occupy 3.66 x 10⁶ m2 of land.
The heliostats total
Primary energy input to the heliostats is 2.95 x 10¹³ J/day, assuming
tracking of daily insolation averaged for the winter solstice, equinoxes, and
sum.mer solstice. This amounts to 1.077 x 10¹⁶ J/yr for direct sunshine 90% of
the year (329 days/yr). Ancillary energy inputs include electrical power to
drive the heliostat tracking motors, rated at 12 watts per heliostat. This
power is taken from the plant output, and is part of an estimated total
ancillary power need of 3.5% of total plant output.6
The capital material inputs are glass (1.088 x 10⁷ kg), steel (1.998 x
107 kg), and concrete (1.888 x 10⁷ kg).
The heliostat output is 1. 638 x 1013 J/day of solar energy reflected
to the receiver, assuming a net collection efficiency of 55.5%.13 About 1.314
x 1013 J/day of solar energy is lost by being reflected into the atmosphere.
Receiver and Boiler. The receiver consists of 24 panels of Incoloy
800 tubing. Twenty panels are external, single-pass-through superheat boil
ers, and four are preheating panels, located on the south side of the receiv
er. The tubes are coated with Pyromark paint, which has 95% absorptivity over
a wide range of wavelengths. The boiler tubes cover a cylinder 421 m in
diameter, mounted atop a 242-m tower located in the optimum focal center of
the collector array.
The primary energy input to the receiver is 1. 638 x 1013 J/day of
solar energy reflected by the tracking hel iostats.
energy inputs.
There are no operating
The capital inputs4 are: receiver steel (94.64 x 10³ kg), tower
steel (1.426 x 10⁶ kg), and. tower concrete (2.6491 x 10⁷ kg).
The system output is 1. 378 x 1013 J/day as pressurized steam from
a receiver designed for an incident peak flux of 0.31 MW/m2.13 This yields a
net efficiency of 84%; 2.61 x 10¹² J/day are lost to the atmosphere as radiant
heat energy.

113
Riser/Downcomer System. The riser and downcomer are two pipes, 242 m
long, contained within the tower for circulation to storage and to the tur
bine.
The primary energy input is 1.378 x 10¹³ J/day of thermal energy
from the receiver and boiler. The operating energy needed to pump cooled
water from the cooling tower to the receiver is part of the overall ancillary
energy requirement of 3.5% of plant output,
The capital input4 is 27.60 x 10³ kg of steel.
The net output is 1. 3639 x 1013 J/day of thermal energy, of which
39. 62%, or 5 .403 x 1012 J/day, goes to storage and 8. 236 x 1012 J/day goes
directly to the turbine as steam at 510°C and 1800 psia. This output is based
on an asslD!led piping efficiency of 99%.
Storage. The McDonnell Douglas single-stage sensible heat system,
using a dual storage medilD!l of rock and oil, is assumed to be used for heat
storage. The system consists of four tanks 18.3 m (60 ft) tall and 27.6 m
( 90. 5 ft) in diameter, used in parallel. The basic heat-transfer fluid is
Caloric HT 43, which has excellent stability and compatibility with rocks and
construction materials up to 316°C (600°F).
The primary energy input is 5.403 x 10¹² J/day of thermal energy in the
form of pressurized steam from the receiver. The ancillary input is the
electrical power, taken from plant output, to operate pumps for the heat
exchanger.
The capital inputsS are Caloric HT 43 heat-transfer oil (9400 m3),
sand and gravel (8.10 x 10⁷ kg), and steel for the tanks (5.53 x 10⁵ kg).
The output of the storage system is 4.59 x 10¹² J/day of thermal
energy, with a net efficiency of 85%.3 Thermal energy amounting to 8.099 x
loll J/day is lost by radiation.
Turbine, Condenser, Cooling Tower and Generator. A 3600-rpm dual
admission turbine from G.E. is used.13 The primary energy input is 8.236 x
1012 J/day of thermal energy in steam at 1800 psia and 950°F (510°C) directly
from the receiver and 4.59 x 10¹² J/day in steam at 550°F (288°C) and 500 psia
from storage, for a total of 12.826 x 10¹² J/day. Ancillary electrical energy
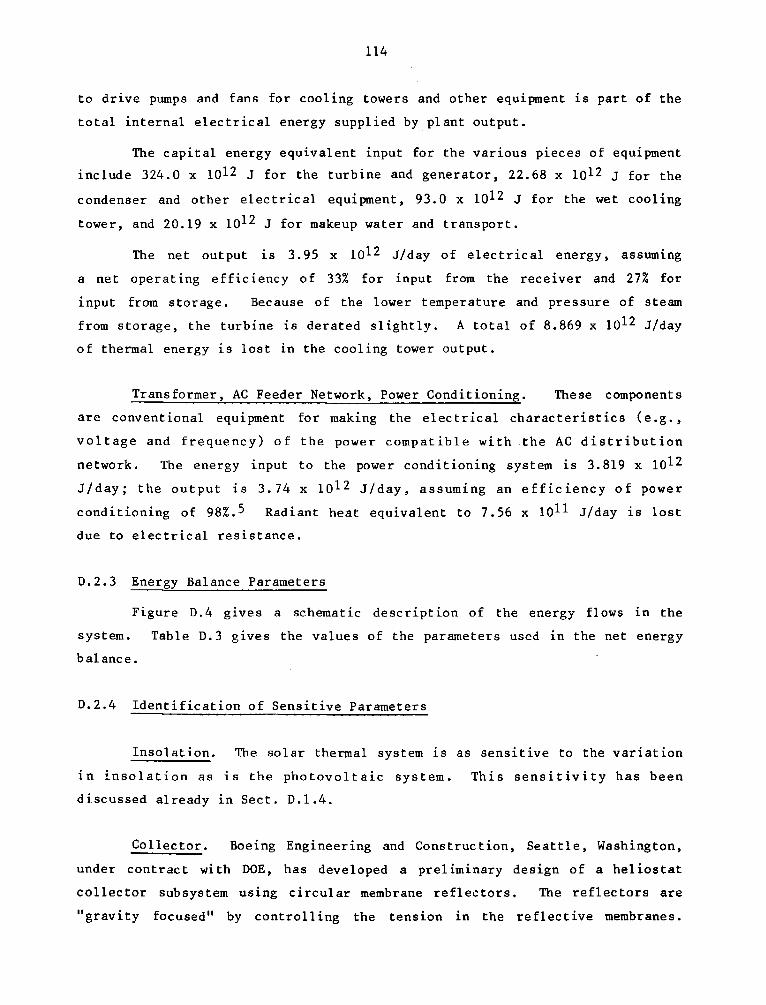
114
to drive pumps and fans for cooling towers and other equipment is part of the
total internal electrical energy supplied by plant output.
The capital energy equivalent input for the various pieces of equipment
include 324.0 x 10¹² J for the turbine and generator, 22.68 x 10¹² J for the
condenser and other electrical equipment, 93. 0 x 1012 J for the wet cooling
tower, and 20.19 x 10¹² J for makeup water and transport.
The net output is 3.95 x 10¹² J/day of electrical energy, assuming
a net operating efficiency of 33% for input from the receiver and 27% for
input from storage. Because of the lower temperature and pressure of steam
from storage, the turbine is derated slightly. A total of 8.869 x 10¹² J/day
of thermal energy is lost in the cooling tower output.
Transformer, AC Feeder Network, Power Conditioning. These components
are conventional equipment for making the electrical characteristics (e.g.,
voltage and frequency) of the power compatible with the AC distribution
network. The energy input to the power conditioning system is 3.819 x 10¹²
J/day; the output is 3.74 x 10¹² J/day, assuming an efficiency of power
conditioning of 98%.5 Radiant heat equivalent to 7 .56 x 1011 J/day is lost
due to electrical resistance.
D.2.3 Energy Balance Parameters
Figure D.4 gives a schematic description of the energy flows in the
system. Table D. 3 gives the values of the parameters used in the net energy
balance.
D.2.4 Identification of Sensitive Parameters
Insolation. The solar thermal system is as sensitive to the variation
in !nsolation as is the photovoltaic system. This sensitivity has been
discussed already in Sect. D.1.4.
Collector. Boeing Engineering and Construction, Seattle, Washington,
under contract with DOE, has developed a preliminary design of a hel iostat
collector subsystem using circular membrane reflectors. The reflectors are
"gravity focused" by controlling the tension in the reflective membranes.

1.077(1016) J/y (SOLAR)
- 2.952(1013)J/d (SOLAR) j
8.236(1012 1J/d
(THERMAL)
1600 psia 510°C
4 e.869 no12> Jld I (THERMAL}
COOLING TOWER a CONDENSER
t 1314(1013) J/d ~(SOLAR}
2.61(1012)J/d (THERMAL) 1.368 ( 1011 ) J/d t 8.~99 ( 10 111 J/d
LTHERMAL) f (THERMAL) t I
HELIOSTAT 13 RECEIVER 8 13 i....i COLLECTOR 1·638 (lO )J/d BOILER l.378 (10 )J/d
'l=.555 (SOLAR) 'l=.841 (THERMAL)
TRACKING MOTOR 12 WATT/HELIOSTAT
' l
STEAM/WATER Pl PING SYSTEM
I 5.403(1012) J/d I S~ORAGE (THERMAL) _. '1-.
95 12 TURBINE 8
4·59 llO )J/d GENERATOR
(THERMAL) 'l RECEIVER= .33 'l=. 99
PUMPS
ELECTRIC
• PUMPS
500 psia 'l STORAGE= .27 2ee•c 3. 959 ( 1012 )J/d (ELECTRICAL)
7. 56{10 11 )J/d 1. 404 ( 1011 ) J/d (ELECTRICAL) __ .....___....,
TRANSFORMER AUXILIARY DISTRIBUTION 3_74 (1012)J/d 8 POWER 3.8l 9 (1o12) ENERGY LINES CONDITIONING FOR TOTAL
15 'l =.98 J/d PLANT 1.23 (10 )J/y (ELECTRICAL CONSUMPTION (ELECTRICAL) 'l =. 965
Fig. D.4. Energy Flow of 100-MWe Solar Thermal Plant in Barstow, California
..... ..... U'I

Table D.3. Energy Balance Parameters for Terrestrial Solar Thermal System
Annual Primary Input Total Capital Inputs Annual Output
System Quantity Ener~ya Element Type ( kWhe) (101 J)
Callee torc Solar Radiation - 10. 775
Receiver/Boiler Heat - 5.389
Riser/DowncomerC Heat - 4.534
Storagec Heat - 1. 777
Turbine/GeneratorC Steam - 4.221
Transformer/Power Conditioner Electricity 3.49 x 10⁸ 1.257
Miscellaneous Equipment - NA -
Type Quantity Ener~yb 001 J)
Glass 10,880 t 0.1260 Steel 19,980 t 0.5430 Concrete 18,980 t 0.0684 Total - 0.7374
Steel Receiver 94.64 t 0.0025 Tower 354 t 0.0094 Tower Base 1072 t 0.0297
Concrete Tower 2,031 t 0.0073 Tower Base 24,461 t 0.0881
Total - 0.1370
Steel 27.60 t 0.0007
Caloric HT43 ~il 9,400 m3 0.4571 Sand & Gravel 81,000 t 0.0106 Steel 555 t 0.0150 Total - 0.4827
General Equipment NA 0.324
-----------(Included above)------------
Condenser & Other Electrical Equipment NA 0.0227
Wet Cooling Tower NA 0.0930 Makeup Water
Transport NA 0.0202 Total - 0.1359
Type
Heat
Heat
Heat to Storage Steam to Turbine
Steam to Turbine
Electricity Gross Internalc Net
Electricity
aEnergy input and output is computed as heat content of fuels or joule equivalent of electricity generated.
bcapital energy input computed by 1/0 analysis as energy cost of fuels, materials, and electricity used.
Quantity (kWhe)
Energya (1015 J)
5.389
4.534
1. 777 2. 711
1.510
3. 62 x' 108 1.303 (0.13 X 10⁸)c (0.046)C 3.49 x 10⁸ 1.257
3. 42 x 108 1.230
CAnnual operating input consists solely of auxiliary electricity tapped from output for internal use; the total is shown as "ElectricityInternal" under Annual Output.
......
...... 0\

117
Transparent air-supported plastic-bubble enclosures protect the light-weight
reflectors. Measurements were conducted in 19771 on individual heliostats and
on a group of three hel iostats over a 4. 5 month period. Results showed a
nominal average efficiency of 69% to 72%; after five months without cleaning,
the reflectors still had a nominal average efficiency of 65%, which is appre
ciably better than the 55 .5% efficiency of the McDonnell Douglas system.
Receiver and Boiler. The present receiver/boiler system, which uses
once-through forced flow, has a rated efficiency of 84.1%13, given an incident
energy flux from the collector of 0 .31 MW/m2. The original commercial-scale
plant has a predicted design efficiency of 89.8%, assuming an incident energy
flux of 0.85 MW/m2; however, the life of the receiver tubes at this higher
energy flux is uncertain. Mechanical oscillations may be induced by the
severe temperature stress of this level of energy flux, which could cause
early failure of the tubes due to structural fatigue. Once-through boilers
have been built and operated ~t flux levels of 0.3 MW/m2, but apparently no
once-through boiler has ever been built to operate at a flux as high as 0.85
MW/m2.
Liquid Sodium System. The potential for higher plant efficiency
has led to consideration of a second-generation solar thermal system using
either a hot-gas or a liquid-metal cycle.11 Recent studies have confirmed the
technical feasibility of using the exceptional heat-transfer capability of
liquid sodium in a solar thermal power plant.
The system as conceived would use liquid sodium in the receiver/boiler,
with sodium at 594 °C (l, 100°F) going directly to storage. Heat exchangers
would be employed to transfer the heat to water, producing steam for the
turbine, Having hot sodium in storage would allow the system to operate in
steady-state condition during periods of cloud cover. Peak energy flux at the
receiver is limited to 1.7 MW/m2 to achieve an assumed tube life of not less
than 10,000 cycles; however, this level of energy flux is twice that of the
McDonnell Douglas design (0.85 MW/m2),
The predicted turbine efficiency for a 100-MWe liquid sodium plant
with six hours operating energy in storage is 39.4%7, as compared with turbine
efficiencies of 33% (turbine feed from receiver) and 27% (turbine feed from

ll8
storage) for the water system. (In the sodium system the turbine would always
be fed from storage, so there is only one ,efficiency value to consider.)
The advantage of liquid sodium as a receiver coolant is that scale
formation is not a problem, as it is with water in the receiver. In addition,
less pumping power is needed, and the low receiver pressure allows use of
smaller-gauge tubing. This plus sodium's excellent heat-transfer character-
istics substantially reduces the possibility of thermal fatigue in the re
ceiver tubes, which can be a real problem in water systems at heat fluxes
higher than 0.6 MW/m2,

119
REFERENCES TO APPENDIX D
1. Sears, R.D., D. V. Merrifield, M. M. Penny, Environmentai Impact Statement for a Hypotheticai 1000 J.$1e Photovoitaic SoLa'Y'-ELectric PLant, IERL, Report EPA 600/7-77-085 (Aug. 1977).
2. Annuai Environmentai Analysis Report: A PreLimin.ary Environmental Analysis of Energy Technologies Using the Assumptions of the Nationai Energy PLan, Volume IV, The MITRE Corporation/METREK Division, CONSAD Research Corporation, Control Data Corporation, International Research and Technology, Inc., Draft Report (1977).
3. Evans, D. L. and L. W. Florschuet, Cost Studies on TerrestriaL Photovoitaic Power Systems with Sunlight Concentroation, Solar Energy, Vol. 19, pp. 255-262, Pergamon Press, Great Britain (1977).
4. SoLar Assessment Study in Support of the International Ekistics Program, prepared by Arthur D. Little for Argonne National Laboratory, Report No. ANL/ICES-TM-12 (July 1977).
5. Chowaniec, C.R., R.R. Ferber, et al., Solar Photovoitaic Power Stations, proceedings of the 1977 Annual Meeting of the American Section of the International Solar Energy Society (1977).
6. Frabetti, A. J., et al, A Study to Develop Energy Estimates of Merit for Selected Fuel Technologies, Final Report to U.S. Dept. of Interior, Office of Research and Development, Development Science, Inc. DSI038 (1975).
7. Cole, R., et al., Estimated Cost of Electricity Produced by Four Types of Compound Parabolic Concentrators, Proceedings of the 1977 Annual Meeting of the American Section of the International Solar Energy Society (1977).
8. Johnston, W.D., The Prospects for Photovoltaic Conversion, American Scientist, Vol. 65, pp. 736-739.
9. Hovel, H.J., Review Paper Solar Cells for Terrestrial Applications, Solar Energy, Vol. 19, pp. 605-615, Pergamon Press (1977).
10. Donnell, D. T., et al., Characteristics of Solar Cells Designed for Concentrator Systems, proceedings of the 1977 Annual Meeting of the American Section of the International Solar Energy Society, pp.23-1 to 23-5 (1977).
11. Highlights Report Solar TherrmaJ Conversion Program Centroal Power Projects, Energy Research and Development Administration, Division of Solar Energy, SAND 77-8513 (1977).
12. Gandel, M. G., and P.A. Pillard, Assessment of Large-Seate Photovoltaic Materiais Production, Industrial Environmental Research Laboratory, EPA-600/7-77-087, Cincinnati (1977).

120
13. Recommendations fop the Conceptuai Design of the Bapst()l,J, CaZiforonia, SoZaP CentpaZ ReceiveP PiZot PZant, Executive Summary, Solar Project Division 8132, Sandia Laboratories, SAND77-8035 (1977).
14. Meyers, A. c., A. E. Hildebrunt, SoZaP T(}(J)e..,._TheT'ITlaZ CoZZection EnePgy Component - 10 Mle PiZot PZant, Proceedings of the 1977 Annual Meeting of the American Section of the International Solar Energy Society, Vol. 1, pp. 20-11 to 20-15 (1977).
15. Mitchell, R. c., et al., DuaZ - Mediwn Ther>ma.Z StoPage System fop SoZaP TherrmaZ P(}(J)ep PZants, Proceedings of the 1977 Annual Meeting of the American Section of the International Solar Energy Society (1977).
16. Vant-Hull, L. L., A Liquid Sodiwn CooZed SoZar TOl,Jer System, Proceedings of the 1977 Annual Meeting of theAmerican Section of the International Solar Energy Society (1977).

121
APPENDIX E
SATELLITE POWER SYSTEM

123
E.l DESCRIPTION OF OVERALL SYSTEM
The satellite power system was suggested in 1968 by P.E. Glaser.l
It is a solar power cycle that involves generating electrical power from
photovoltaic solar panels in geosynchronous orbit, transmitting the power to
earth via focused microwave beams, and collecting and converting the beams
into useful electricity on the earth's surface.
The system analyzed in this report2,3 is designed as a 5-GW DC power
unit that is connected to a conventional utility grid on the earth. The size
of the satellite power system (SPS) is dictated primarily by the efficiency
chain of the various elements in the system. Figure E.l shows a simplified
flow diagram and the end-to-end efficiency chain of the present SPS concept.3
Two options are currently under consideration for converting solar energy into
electrical energy: gallium aluminum arsenide (GaAlAs) solar cells with a
concentration ratio of 2 and silicon (Si) solar cells with no concentration.
The quoted efficiency is the minimum efficiency for a 30-yr lifetime, in
cluding the worst-case factor for solar radiation at the sununer solstice
(0.9675), the seasonal variation (0.91), and the end-of-life efficiency of
solar cells, assuming annealing.3
The capacity factor of the plant designed to provide 5 GW of DC power
to utility busbars is estimated to be 92%, with a downtime of 696 hours
(87 day/yr x 8 hr/day) for maintenance.4 As a result, the electricity gene
rated by the 5-GW SPS is expected to be 145.18 x 10¹⁵ J/yr (40.32 x 10⁹
kWh/yr).
E.2 SYSTEM ELEMENTS
The separate elements of the SPS illustrated in Fig. E.l can be cate-
gorized into three groups: the solar energy collection system, the power
distribution system, and the microwave power transmission system. The mater
ial requirements and the space transportation system to construct and operate
a SPS are also key elements in studying the net energy balance. In this
section these topics are briefly discussed, mainly on the basis of data in
Ref. 3.
E.2.1 Solar Energy Collection System
The solar energy collection system has the function of collecting
the dispersed solar energy in sufficient quantities for conversion to elec
trical energy.

r I I I Ga
17 I. 77
CSOLA
I 70.8 I
I I
Si
SOLAR ENERGY COLLECTION SYSTEM
SUMMER SOLSTICE ....- SEASONAL FACTOR VARIATION
o.9675 0.91
L-------
57.81GW
REFLECTOR Ga
REFLECTIVITY -EQUIVALENT
0.915
~
IO. 79 GW
SOLAR CELL
Si EFF@ AMO -
20°c r--
0.1 73
-- -- -- -- -- -- -- -- -- -- --- -- -- -
I 0.50 GW 9.97 GW 9.45 GW
CELL TEMP ARRAY
DEGRADATION PACKING DESIGN r- --@125°c FACTOR FACTOR
0.908 o.95 0.901
I 0.29 GW I 0.1 9GW 9. 79 GW
CELL TEMP ARRAY DEGRADATION CELL-TO-CELL DESIGN
@ 38°C t- MISMATCH r-- FACTOR
0.954 0.99 0.951
-- -- ------------ ---------- - - -- -;-o~w--, -1- ~w~ DIS;;BUTIO~YSTEM - - -- -- --: iM~;;AVE T~SMISS~- - - -
I . . 0.96
ULTRAVIOLET I I ARRAY
& RADIATION I - POWER ..__ SLIP RINGS DEGRADATION I I DISTRIBUTION -o.9273 I I I 0.9368 0.9995
__ _ _ 9.08 GW _j L -- -- --- -- -- -- --
MICROWAVE
TRANSMISSION SYSTEM
-- -- -- -- -- --- --
---6.58 GW
ATMOSPHERIC LOSSES
5. 79 GW
RECTENNA ENERGY
COLLECTION
0.98 I I 0.89
OVERALL EFFICIENCY = 6.97% Ga
7.06% Si
ANTENNA I I
DC-RF TRANSMITTING ..._.. POWER ~ CONVERSION i-- ANTENNA
DISTRIBUTION
I I 0.963 0.85 0.9653
-- _ _J L _____ _ 5.15Gw- - - - - -1 RECTENNA. GRID
ENERGY CONVERSION
INTERFACES
I I
0.88 0.97 I I _________ _J
MPTS EFFICIENCY = 63.0%
Fig. E.l. Simplified Flow Diagram and Efficiency Chain of SPS (Ga CR=2 and Si CR=l)6
...... N ~

125
In order to determine the most favorable energy collection/conversion
system, a variety of studies were performed during 1974-1976, including solar
photovoltaic systems, thermal conversion systems (solar Rankine cycle, solar
Brayton cycle), orbiting nuclear power systems, and orbiting solar reflector
systems.5 After a review of those systems, the photovoltaic system, using
either single-crystal Si or GaAlAs cells, was chosen as the reference energy-
conversion device. A concentration ratio of one (CR 1) is preferred for
Si-cell systems, whereas GaAlAs cells may be more advantageous with a concen
tration ratio of two (CR 2) • Based on the analyses conducted to date, the
results indicate the photovoltaic systems would be less complex and have lower
mass than the thermal conversion systems regarded as competitive. The major
disadvantages of thermal systems are the need to contain fluid, wear in
rotating equipment, complexity of construe tion, and relatively high mass.
The solar array consists of the deployed solar cell blankets and
their support structure. The basic GaAlAs solar cell consists of a 51-1m-thick
GaAs PN cell with a 0.03 to 0.05-µm-thick GaAlAs front-side window. The
blanket material is 25-µm-thick Kapton. The area of the blanket is 25.52 km2,
deployed in a total area of 55.13 tan2 for the GaAlAs system with CR2, which
includes the solar reflectors mounted on each side of the solar cell blankets.
The projected cost of the blankets is $71/m2.
The Si-cell blanket consists of 50-µm-thick single-crystal Si cells
with a borosilicate covering electrostatically bonded to the front and back.
The area of the blanket for the Si system with CR 1 is 52.34 tan2, deployed in
a total area of 54.08 km2. The projected cost of the Si blankets is $35/m2.
The primary structure for both types of solar cells is of open-truss
design made of thermoplastic reinforced with graphite fiber. The basic truss
elements are designed for automatic fabrication in space.
E.2.2 Power Distribution System
The prime function of the power distribution system is to collect,
regulate, and control power from the solar-array sections; to control, con
dition, and transmit this power to microwave generators on the transmitting
antenna; to provide for energy storage during occul tat ions of the sun by the
earth or moon, or during system maintenance; and to provide for detection and
monitoring of faults and disconnecting faulty sections.

126
Power from the solar array is controlled by high-voltage circuit
breakers near the buses, depending on load requirements. Two sections of the
array provide the required voltage (45.5 kV) at the sliprings, using the
sheet-conductor voltage drop to achieve this voltage.
Power is transferred from sections of the solar array to the microwave
attenna via rotary joints using slipring/brush assemblies. Conductors from
the sl ipring brushes are tied to DC/DC convertors through switchgear that
allow isolation of a section when it is under maintenance. Conductors are
then tied between voltage-summing buses through other switchgear for trans
mitting the required power to the DC-RF generators.
Batteries for energy storage are located on the microwave antenna
structure, with a bus routed along the regular network to provide power when
the solar array is not operating. About 12 MWh of electrical energy would be
stored.
E.2.3 Microwave Power Transmission System
The transfer of energy from geosynchronous orbit to earth, in the
present SPS concept, would be accomplished by means of microwave transmission.
Power transfer is a 3-step process: (1) converting the power from DC to
microwaves; (2) focusing and transmitting the microwaves to earth's surface;
and (3) collecting the microwave power on earth and converting it to DC
power. The overall efficiency of this system is about 63%; a breakdown of the
efficiencies of the subsystems is given in Fig. E.l.
The studies performed by contractors on the microwave power amplifiers
(DC to RF converters) have focused primarily on investigation of the klystron
(a linear beam amplifier) and the amplitron (a crossed-field amplifier).
According to these studies, 6 the klystron is preferred because of better
performance, including much higher power per tube, higher operating voltage,
lower noise levels, and much lower phase-control drive power.
The microwave transmission system assumed has a phased-array trans
mitting ,antenna 1 km in diameter. This antenna is composed of 7, 220 sub arrays
with slotted waveguides as the radiating surface and DC-RF power tubes mounted
on the back. Both the primary and the secondary structure of the antenna are
composed of a graphite/epoxy material. The primary structure is an open
A-frame truss, and the secondary structure is a deployable cubic truss which

127
provides support for installation of the microwave subarrays.
waveguides are assumed to be made of aluminum.6
The slotted
The present configuration of the ground rectenna, which receives
and rectifies the power beam, has half-wave dipoles feeding Schottky barrier
diodes.6 Two-stage, low-pass filters between the dipoles and diodes suppress
harmonic generation and provide impedance matching. For economic reasons, the
rectenna is a series of serrated panels perpendicular to the incident beam
rather than a continuous structure. RF power collected at the rectenna is
converted to DC power to be used in utility power levels. through the unit
processes such as RF-DC conversion, DC power interface, and DC/DC processing.
E.2.4 Material Requirements
The materials needed for the SPS program are presented in Table E .1. 6
These requirements have been estimated for individual system components, such
as the satellite station, ground station, and various transport vehicles.
The satellite station requirements are separated into three major
segments: a 5-GW satellite system, low earth orbit (LEO) staging, construc
tion of an orbital transfer vehicle (OTV), and construction in geosynchronous
orbit (GEO). The satellite masses, which are shown in Table E.2,6 consist of
the solar array, the microwave antenna, and array/ antenna . interfaces. The
GaAlAs option in the solar array uses a radiation concentration ratio of 2,
which reduces the required blanket area and therefore the blanket mass.
The rectenna is the main part of the ground unit. It is composed
of steel panels supported by steel columns in concrete footings; aluminum
conductors are used for the power collection system. According to the present
concept report,6 the projected cost for the rectenna structure is over 20% of
the total SPS program, even though a recent redesign of the rectenna elim
inated over 75% of the aluminum from the original 1976 design. This component
needs further study to bring costs down.
E.2.5 Space Transportation System
This section describes the space transportation vehicles assumed in the
present study. The vehicles are distihguished by their primary payload,
either cargo or personnel, and their area of operation, i.e., between earth
and low earth orbit (LEO), or between LEO and geosynchronous earth orbit
(GEO).
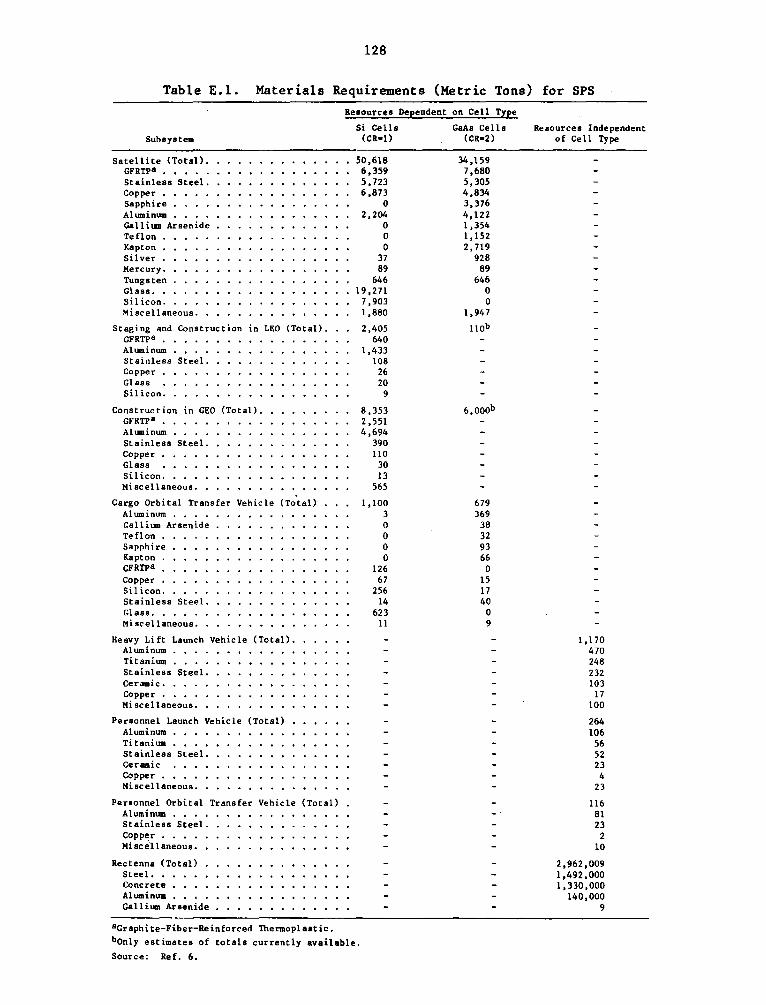
128
Table E. l. Materials Requirements (Metric Tons) for SPS Resource• Dependent on Cell Type
Subsystem
Satellite (Total). GFRTPa ••••. Stainless Steel. Copper • Sapphire • , •• Allnninum •••• Gall i11111 Arsenide Teflon Kapton • Silver • Mercury. Tungsten Glass. , Silicon. Miscellaneous.
Staging and Construction in LEO (Total). GFRTPa ..••• Aluminum .••• Stainless Steel. Copper . Glass Silicon ••
Construction in GEO (Total). GFRTPa •• Aluminum . Stainless Steel. Copper • Glass Sil icon. • • • Miscellaneous.
Cargo Orbital Transfer Vehicle (Total) Aluminum •... Gallium Arsenide Teflon • Sapphire Ka pt on GFRtpa • Copper • Silicon. Stainless Steel. Glass. . • . • • Miscellaneous •.
Heavy Lift Launch Vehicle (Total). Aluminum .••• Titanium •••• Stainless Steel. Ceramic •... Copper • • •• Miscellaneous.
Personnel Launch Vehicle (Total) Aluminum ••• Titanium ••• Stainless Steel. Ceramic Copper ••••• Miscellaneous. •
Personnel Orbital Transfer Vehicle (Total) Aluminum .••• Stainless Steel. Copper •••. Mi SC ell aneous,
Rectenna (Total) Steel •• Concrete • • • Aluminum .•• Galli ... Arsenide
Si Cells (CR•l)
50,618 6,359 5, 723 6,873
0 2,204
0 0 0
37 89
646 19,271
7,903 1,880
2,405 640
1,433 108
26 20
9
8,353 2,551 4,694
390 110
30 13
565
1,100 3 0 0 0 0
126 67
256 14
623 11
aGraphite-Fiber-Reinforced Thermoplastic. bonly estimates of totals currently available.
Source: Ref. 6.
GaAs Cells (CR•2)
34 ,159 7,680 5,305 4,834 3,376 4,122 1,354 1, 152 2, 719
928 89
646 0 0
1,947
nob
6,ooob
679 369
38 32 93 66
0 15 17 40
0 9
Resources Independent of Cell Type
l, 170 470 248 232 103
17 100
264 106
56 52 23
4 23
ll6 81 23
2 10
2,962,009 1,492,000 l, 330 ,000
140,000 9

129
Table E.2. Masses of SPS Subsystems
Mass. 106 kg
Subsystem
Solar Array
Primary Structure
Secondary Structure
Solar Blankets
Concentrators
Power Distribution and Conditioning
Information Management and Control
Attitude Control and Stationkeeping
Antenna
Primary Structure
Secondary Structure
Transmitter Subarrays
Power Distribution and Conditioning
Thermal Control
Information Management and Control
Attitude Control
Array Antenna Interfacesa
Primary Structure
Secondary Structure
Mechanisms
Power Distribution
Subtotal
Contingency (25%)
Total
GaAlAs CR = 2
4.172
0.581
6.696
0.955
1.144
0.050
0.200
0.250
0.786
7.178
2.189
2.222
0.630
0.128
0.094
0.003
0.033
0.017
13.798
13. 382
0.147
27.327
6.832
34.159
aRotary joint, slip rings, antenna yoke.
Source: Ref. 6.
Sil icon CR = 1
3.388
0.436
22.051
1.134
0.050
0.200
0.250
0.786
7.178
2.189
2.222
0.630
0.128
0.094
0.003
0.033
0.017
27.258
13.382
0.147
40.787
10.197
50.984

130
Heavy Lift Launch Vehicle (HLLV). The reference HLLV is a two-stage
(booster and orbiter), vertical take-off, horizontal landing, fully reusable,
winged launch vehicle. The vehicle uses 16 liquid methane/liquid oxygen
engines on the booster (first stage) and 14 standard Space Shuttle Main
Engines (SSME) on the orbiter (second stage). Cargo is transported from the
earth's surface to LEO by the HLLV.
Personnel Launch Vehicle (PLV). The PLV provides for the transpor-
tation of personnel and priority cargo between earth and LEO. The reference
vehicle is derived from the current space shuttle system. It uses methane
fueled, winged flyback boosters with smaller external tanks than those on the
existing shuttle. The booster employs 4 methane/oxygen engines similar to
those on the HLLV booster.
Cargo Orbital Transfer Vehicle (COTV). The function of the COTV is
to deliver SPS cargo to GEO from the LEO staging area. The basic concept
involves constructing a fleet of reusable round-trip vehicles powered by
solar-electric arrays in LEO. The vehicles would use ion-bombardment thrust
ers, with cryogenic argon as the propellant.
Personnel Orbital Transfer Vehicle (POTV). The functions of the
POTV are to deliver personnel and priority cargo from LEO to GEO and to return
personnel from GE9 and LEO at 90-day intervals. The reference vehicle has two
stages and is fueled with oxygen and hydrogen; it could make the trip in about
one day.
E.3 ENERGY BALANCE PARAMETERS
Figure E.2 shows the primary energy flow for the GaAlAs and Si cell
options, with. the satellite designed to provide 5 GW of DC power to the
utility busbar and overall efficiencies of 6.9% and 7.0%, respectively. The
system, based on a 5-GWe unit operating at a plant factor of 92%, generates
145.18 x 10¹⁵ J/yr (40. 32 x 109 kWh/yr). It 1s necessary to size the solar
arrays to intercept approximately 2, 100 x 1015 J of solar energy as indi
cated in Fig. E.2.
Table E. 3 summarizes the energy balance parameters. Table E.4 sum-
marizes the system materials requirements, and Table E.5 shows the conversion

2107.53 GaAlAs CR = 2
SUNLIGHT IN Si CR= 1
2079.41
277 .67 -GaAlAs
Si
287.47
8 _ _,~-J• -·
GaAlAs REFLECTOR CELL TEMP ARRAY REFLECTIVITY I-to DEGRADATlOt ~ PACKING
"- DESIGN
68.49 183.52 DEGRADATION 0113° FACTOR I= ACTOR 157.72 1389.48 15.41 15.24
aAlAs
SUMMER SOLSTICE i- SEASONAL ~ FACTOR VARIATION
67 .58 181.06 SOLAR CELL Si EFFOAMO CELL TEMP. CELL· TO.CELL PANEL
2a0c - DEGRADATION ~ MISMATCH ~ LOST AREA
1.514.05 14.57 2 O? 11 £L
316.72 302.15 299.13 287.47 to-'
266.57 ""' to-'
11.10 249. 72 249.60 240.36 204.31 197 22
ULTRAVIOLET ARRAY & RADIATION POWER J-1 SLIP J-.1 _._ o.rai•n J_.J DC-RF HTRANSMITIING
POWER DEGRADATION DISTRIBUTION RINGS ....................... u CONVERSION ANTENNA
20.90 16.85 I I 0.12 266.57
193.27 170.08 149 .67
197.22 I A'JMOSPHERIC RECTENNA ·f 145.18 x 10¹⁵
ENERGY RF-DC GRID joules at LOSSES COLLECTION CONVERSION INTERFACES utility ~usba:
3.95 23.19 20.41 4.49 (5 GW)
Fig. E.2. Primary Energy Flow Diagram for SPS (1015 J/yr)

System Element
Collection System
Si
GaAlAs
Power Distribution
Microwave Transmission
Entire System
Si GaAlAs
Table E.3. Energy Balance Parameters for SPS
Annual Primary Input
Type Quantity Energya
(109 kWhe) (1015 J)
Solar Radiation - 2079.41 Solar Radiation - 2107.53
Electricity 74.05 266.57
Electricity 66. 77 240.36
Total Capital Input: Energy
(1015 J)
_c
-C
_c
_c
871.246C 186.40JC
Annual Operating Input: Energyb
(1015 J)
-
-
-
-
s.112b l.867b
Annual Output, Electricity
Quantity (109 kWhe)
74.05
74.05
66. 77
40. 33d
Energya (1015 J)
266.57
266.57
240.36
145.18d
aEnergy input and output is computed as the heat content of fuels and materials or joule equivalent of electricity generated.
bAnnual operating input is asswned to be 30% of capital input, amortized over a 30-yr system lifetime.
cnetails are shown in Tables E.4 and E.5.
dGross and net: none of the output is tapped for internal use.
I-' w N

133
Table E.4. Total Masses of All SPS Program Components
Mass, Metric Tons
Satellite Throu~h First 5-GW SP Sa Two 5-rGW Satellites/Year
Program Materials Si (CR=l) GaAlAs (CR=2) Si (CR=l) GaAlAs (CR=2)
GFRTP 12,447 7. 680 12,716 15,360
Stainless Steel 7,621 6,511 11,446 10,610
Glass 33,650 0 38,542 0
Silicon 13,813 0 15,806 0
Copper 8,630 5,030 13 '746 9,668
Aluminum 150,654 149,227 284,408 288,244
Silver 37 928 74 1,856
Molybdenum 2 0 4 0
Mercury 89 89 178 178
Tungsten 646 646 1,292 1,292
Steel 1,492,000 1,492,000 2,984,000 2,984,000
Concrete 1,330,000 1,330,000 2,660,000 2,660,000
Gallium Arsenide 7 1,696 14 2,708
Titanium. 1,104 856 248 124
Ceramics 458 355 103 52
Misc. & Organics 3,084 8,663b 3,700 3,984
Argonc 20,559 4,876 18,690 4,664
H2c 107,406 61,227 128,547 80, 920
02c 2,268,033 1,164,528 2,728,506 1,680,710
CH4c 540, 572 265,539 651,599 379,930
Sapphire 0 4,213 0 6,752
Teflon 0 1,441 0 2,306
Ka pt on 0 3,313 0 5,438
aThe first satellite includes not only transportation and rectenna, but also the orbital staging and construction bases, plus the construction of the cargo orbital vehicles.
bAlso included is total mass estimates for LEO and GEO construction bases and OTV construction.
CPropellants of space transport used for the construction.
Source: Refs. 1 and 6.

Table E.5. Total Capital Inputs for SPS
LEO/GEO Satelli tea Constructionb Flight Vehicles Other
Si Sptem GaAlAs S:£stem Si S;!stem Si S:£stem GaAlAs S;r:stem Rectenna (both sistems) Si S;r:stem GaAlAs Sistem
Material t tol5 J t toL5 J t tol5 J t tol5 J t tolS J t tol5 J t iot5 J t 1015 J
GFRTP< 6,359 4.100 7,680 4.950 3 '191 2.060 126 0.080 -- -- -- -- 2,77l L. 785
Stainless Steel 5,723 0.550 5,305 0.510 498 0.048 321 0.031 347 0.033 -- -- l ,079 0.103 859 0.082
GlaBS 19,271 3.399 -- -- 50 0.009 623 0 .110 -- -- -- -- 13,706 2.418
Silicon 7,903 395.466d -- -- 22 l. 10 td 256 t2 .s10d -- -- -- -- 5,632 28 l .825d
Copper 6,873 l.H7 4,834 l.236 136 0.035 90 0.023 38 0.010 -- -- l,531 0.391 158 0.040
Aluminum 2,204 l. l54 4,122 2.159 6, 127 3.209 660 0.346 l ,026 0.537 L40,000 73.332 1,663 0.871 4,079 2.137
Silver 37 0.010 928 0.254
Molybdenum -- -- -- -- -- -- -- -- -- -- -- -- 2 0.001
Mercury 89 0.016 89 0.016
Tungsten 646 0.116 646 0.116
Steel -- - -- -- -- -- -- -- -- -- l,492,000 40.433
Concrete - -- -- -- -- -- -- -- -- -- l,330,000 4.788
Gallium Arsenide -- -- l,354 26.81() -- -- -- -- 38 0. 752 -- -- -- -- 295 5.84l .-Titanium - - -- -- -- -- 304 0.055 304 0.055 -- -- 800 0.144 552 0.099 ~
~ Cer-.-:ics -- -- -- -- -- -- 126 0.023 L26 0.023 -- -- 332 0.060 229 0.041
Misc. & Organics 1,880 0.338 1,947 0.350 565 0.102 144 0.026 l42 0.026 -- -- 495 0.089 6,574 l.183
Argon - -- -- -- -- -- -- -- -- -- -- -- 20,559 0.529 4,876 0.126
Hydrogen -- -- -- -- -- -- -- -- -- -- -- -- 107 ,406 2.533 61,227 1.444
Oxygen -- -- -- -- -- -- -- -- -- -- -- -- 2,268,033 19. 596 l,164,528 10.062
Clll, -- -- -- -- -- -- -- -- -- -- -- -- 540 ,572 LS.374 265,539 7.552
Sapphire -- - 3,376 0.462 -- -- -- -- 93 O.Ol3 -- -- -- -- 744 0.102
Teflon -- -- 1,152 0.158 -- -- -- -- 32 0.004 -- -- -- -- 257 0.035
Kapton -- -- 2,719 0.372 -- -- -- - 66 0.009 -- -- -- -- 528 0.072
TOTAL 406.906 37.393 6.564 13.504 L.462 118.553 -- 325 ,719 -- 28.8l6 - - -- -- -- --"one 5-GW satellite and one rectenna site.
bThe LEO/CEO construction requirements of the CaAlAs satellite are not c0111pletely defined. 0cla•o fiber reinforced thermoplastic.
dsased on 13,900 kWhe/kg for silicon production; current state-of-the-art of manufacturing.

135
of these requirements into capital energy investment using the intensity
factors from Appendix A.
E.4 IDENTIFICATION OF SENSITIVE DATA
Because of the uncertainties and limitations of data, it is extremely
important, but also very difficult at this time, to perform a sensitivity
analysis of the SPS. The impact of silicon energy requirements and the energy
intensity of other materials have already been discussed in Sect. 4.

136
REFERENCES FOR APPENDIX E
1. Satellite Power System Baseline ReviebJ by The Marshall Space Flight Center and the Lyndon B. Johnson Space Center, NASA, Washington, D.C. (July 13, 1978).
2. Satellite Power System Concept Evaluation Program (July 1977 - August 1980) -- A Recommended Preliminary Baseline Concept, NASA, Lyndon B. Johnson Space Center, Houston (Jan. 25, 1978).
3. Preliminary Baseline SPS Concept Recommendations to DOE/NASA by the Marshall Space Flight Center, NASA, Washington, D.C. (Jan. 24, 1978).
4. Satellite Power System Concept Definition Study First Quarterly ReviebJ, prepared for Marshall Space Flight Center by Rockwell International Space Division (June 23, 1977).
5. Herendeen, R. A., Energy Analysis of Tl»o Technologies: Gasohol and Solar Satellite Power Station, Energy Research Group, University of lllinois, 1 Urbana, Ill. (1978).
6. Satellite Power System Concept Development and Evaluation Program Reference System Report, Report No. DOE/ER-0023, U.S. Department of Energy (Oct. 1978).
7. Glaser, P.E., Poruer from the Sun: Its Future, Science 162, pp. 857-886 (1968).
8. Pilati, D., Energy Analysis of Electricity Supply and Energy Conservation Options, Energy 2, pp. 1-7 (1977).
9. Herendeen, R., T. Kary, and J. Rebitzer, Energy Analysis of Solar Satellite PCR»er Station, printed in Hearing Record, Committee on Science and Technology, U.S. House of Representatives, Bill on H.R. 11725, p. 429-431, (Apr. 12-14, 1978).
10. Herendeen, R., and c. Bullard, Energy Cost of Consumer Good.a 1968/67, CAC Doc. 140, Center for Advanced Computation, University of Illinois, Urbana, Ill. (November 1974).
•u.s. GOVEllJQIJ!lil'r PRill'l'IBG OFl'ICE I 1980 0-620-309/47


![LCD8000-97C Operation Guide - Farnell · PDF file · 2013-12-07The LCD8000-97C has an LVDS interface and supports a resolution of up to ... phy reset FEC0 [PRIME] ... Microsoft Word](https://static.fdocuments.in/doc/165x107/5ab530cd7f8b9a6e1c8c87f0/lcd8000-97c-operation-guide-farnell-lcd8000-97c-has-an-lvds-interface-and-supports.jpg)