Comparación de 3 hidrogramas unitarios sintéticos
16
ANÁLISIS COMPARATIVO DE TRES HIDROGRAMAS UNITARIOS SINTÉTICOS EN DOS CUENCAS MEDITERRÁNEAS DE CHILE, REGIÓN DEL MAULE COMPARATIVE ANALYSIS OF THREE SYNTHETIC UNIT HYDROGRAPHS IN TWO MEDITERRANEAN WATERSHEDS IN THE MAULE REGION OF CHILE Roberto Pizarro-Tapia 1 ; Francisco Balocchi-Contreras 1* ; Fernando Andrade-Vilaró 2 ; Claudia Sangüesa-Pool 1 ; José Vargas-Baecheler 3 ; Carolina Morales-Calderón 1 ; Mauricio Vera-Camiroaga 1 ; Rodrigo Valdés-Pineda 1 ; Carlos Vallejos-Carrera 1 ; Romina Mendoza-Mendoza 1 ; Claudio Olivares-Santelices 1 ; Alejandro Abarza-Martínez 1 ; Roberto Fuentes-Lagos 1 1 Centro Tecnológico de Hidrología Ambiental, Universidad de Talca. 2 norte 685. C. P. 3465548. Talca, CHILE. Correo-e: [email protected] Tel. 56-71-200370 (*Autor para correspondencia). 2 SEREMI de Bienes Nacionales Región de Los Lagos. Av. Décima Región 480, piso 1. C. P. 5480000. Puerto Montt, CHILE. 3 Facultad de Ingeniería, Universidad de Concepción. Edmundo Larenas 215. C. P. 4070043. Concepción, Chile. 3 Facultad de Estudios Superiores Iztacala-Universidad Nacional Autónoma de México. Av. de los Barrios núm 1. Los Reyes Iztacala, Tlalnepantla, Estado de México. MÉXICO. RESUMEN E n el presente artículo se realiza un análisis comparativo de tres métodos para obtener hidrogra- mas unitarios sintéticos (HUS). Los métodos de Snyder, de “U.S. Bureau of Reclamation” y el de Témez se analizaron en dos cuencas de la zona mediterránea de Chile. Para ello, se realizó una caracterización morfológica y vegetacional de cada cuenca. Además, se utilizó la informa- ción de tres tormentas reales con intensidades clasificadas como alta, media y baja, a fin de obtener los hidrogramas de escorrentía directa (HED) para ambas cuencas. La escorrentía asociada a los eventos de precipitación se obtuvo utilizando la metodología del número de curva. Los resultados demostraron que, a nivel general, los HUS utilizados no presentaron diferencias estadísticamente significativas (P = 0.05) para ambas cuencas. Por otra parte, la metodología del HUS de Snyder fue la única que detectó diferen- cias estadísticamente significativas en los HED respecto a los otros métodos y sólo bajo una tormenta de alta intensidad en la cuenca Cunculén. ABSTRACT T his paper compares three methods to obtain synthetic unit hydrographs (SUH). The Snyder (modified for Chile by Astorga and Benítez), the US Bureau of Reclamation, and the Témez methods are analyzed on two watersheds located in Mediterranean areas of Chile. To do so, each watershed was characterized in terms of its morphology and vegetation type. In addi- tion, data from three actual storms, with high, medium, and low rainfall intensities, were used to obtain direct runoff hydrographs (DRH) for both watersheds. The NRCS Curve Number method was used to estimate runoff responses to storm events. Our results suggest that, in general, the SUH used had no significant differences between watersheds. On the other hand, the Snyder SUH method was the only one that found significant differences in the DRHs relative to the other methods and only under a high- intensity storm in the Cunculén watershed. Recibido: 21 de septiembre, 2012 Aceptado: 11 de julio, 2013 doi: 10.5154/r.rchscfa.2012.09.054 http://www.chapingo.mx/revistas PALABRAS CLAVE: Precipitación efectiva, escorrentía directa, escorrentía superficial, hidrogramas de crecida. KEYWORDS: Effective precipitation, direct runoff, surface runoff, runoff hydrographs.
-
Upload
carloscartasine -
Category
Documents
-
view
20 -
download
0
description
Comparación de 3 hidrogramas unitarios
Transcript of Comparación de 3 hidrogramas unitarios sintéticos
ANÁLISIS COMPARATIVO DE TRES HIDROGRAMAS UNITARIOS SINTÉTICOS EN DOS CUENCAS MEDITERRÁNEAS DE CHILE, REGIÓN DEL MAULE
COMPARATIVE ANALYSIS OF THREE SYNTHETIC UNIT HYDROGRAPHS IN TWO MEDITERRANEAN WATERSHEDS IN THE MAULE REGION OF CHILE
Roberto Pizarro-Tapia1; Francisco Balocchi-Contreras1*; Fernando Andrade-Vilaró2; Claudia Sangüesa-Pool1; José Vargas-Baecheler3; Carolina Morales-Calderón1; Mauricio Vera-Camiroaga1; Rodrigo Valdés-Pineda1; Carlos Vallejos-Carrera1; Romina Mendoza-Mendoza1; Claudio Olivares-Santelices1; Alejandro Abarza-Martínez1; Roberto Fuentes-Lagos1
1Centro Tecnológico de Hidrología Ambiental, Universidad de Talca. 2 norte 685. C. P. 3465548. Talca, CHILE. Correo-e: [email protected] Tel. 56-71-200370 (*Autor para correspondencia). 2SEREMI de Bienes Nacionales Región de Los Lagos. Av. Décima Región 480, piso 1. C. P. 5480000. Puerto Montt, CHILE. 3Facultad de Ingeniería, Universidad de Concepción. Edmundo Larenas 215. C. P. 4070043. Concepción, Chile. 3Facultad de Estudios Superiores Iztacala-Universidad Nacional Autónoma de México. Av. de los Barrios núm 1. Los Reyes Iztacala, Tlalnepantla, Estado de México. MÉXICO.
RESUMEN
En el presente artículo se realiza un análisis comparativo de tres métodos para obtener hidrogra-mas unitarios sintéticos (HUS). Los métodos de Snyder, de “U.S. Bureau of Reclamation” y el de Témez se analizaron en dos cuencas de la zona mediterránea de Chile. Para ello, se realizó una caracterización morfológica y vegetacional de cada cuenca. Además, se utilizó la informa-
ción de tres tormentas reales con intensidades clasificadas como alta, media y baja, a fin de obtener los hidrogramas de escorrentía directa (HED) para ambas cuencas. La escorrentía asociada a los eventos de precipitación se obtuvo utilizando la metodología del número de curva. Los resultados demostraron que, a nivel general, los HUS utilizados no presentaron diferencias estadísticamente significativas (P = 0.05) para ambas cuencas. Por otra parte, la metodología del HUS de Snyder fue la única que detectó diferen-cias estadísticamente significativas en los HED respecto a los otros métodos y sólo bajo una tormenta de alta intensidad en la cuenca Cunculén.
ABSTRACT
This paper compares three methods to obtain synthetic unit hydrographs (SUH). The Snyder (modified for Chile by Astorga and Benítez), the US Bureau of Reclamation, and the Témez methods are analyzed on two watersheds located in Mediterranean areas of Chile. To do so, each watershed was characterized in terms of its morphology and vegetation type. In addi-
tion, data from three actual storms, with high, medium, and low rainfall intensities, were used to obtain direct runoff hydrographs (DRH) for both watersheds. The NRCS Curve Number method was used to estimate runoff responses to storm events. Our results suggest that, in general, the SUH used had no significant differences between watersheds. On the other hand, the Snyder SUH method was the only one that found significant differences in the DRHs relative to the other methods and only under a high-intensity storm in the Cunculén watershed.
Recibido: 21 de septiembre, 2012Aceptado: 11 de julio, 2013doi: 10.5154/r.rchscfa.2012.09.054http://www.chapingo.mx/revistas
PALABRAS CLAVE: Precipitación efectiva, escorrentía directa, escorrentía superficial, hidrogramas de crecida.
KEYWORDS: Effective precipitation, direct runoff, surface runoff, runoff hydrographs.

Análisis comparativo... Balocchi-Contreras et al.
6
INTRODUCCIÓN
A nivel internacional, existen numerosos estudios referi-dos a la modelación de hidrogramas unitarios sintéticos (HUS). Recientemente, Jena y Tiwari (2006) lograron ajus-tar el HUS de Snyder (1938) en la modelación de crecidas de cuencas subtropicales, a partir de los datos obtenidos en dos cuencas agrícolas de la zona este de India. Por otra parte, Usul y Küpcü (1997), con el uso de sistemas de información geográfica, ajustaron los parámetros del hidrograma uni-tario (proporcionado por el “Soil Conservation Service”) a las cuencas del noroeste de Turquía, como respuesta a la carencia de modelos para determinar los caudales de diseño en obras hidráulicas. López, Gimena, Goñi, y Agirre (2005) fueron más allá al proponer y analizar, con resultados sa-tisfactorios, un método para la obtención de hidrogramas unitarios, desarrollado bajo una cuenca de uso agrícola. Sin embargo, no existen mayores estudios que comparen las me-todologías propuestas en el presente estudio, salvo estudios específicos de HUS locales (Sen, 2006, 2007) y los utilizados por Singh, Bhunya, Mishra, y Chaube (2007) para el caso de HUS híbridos. Actualmente, en Chile es muy común el cambio de uso del suelo tanto en la zona periurbana como en áreas rurales, lo que incide directamente en el comportamiento hidrológico de una cuenca. Un ejemplo de lo anterior es la zona de seca-no de la Región del Maule, Chile, la cual ha sufrido numero-sos cambios territoriales, pues su uso fue mayoritariamente agrícola generando la degradación de sus suelos. En la ac-tualidad, ha surgido un fuerte desarrollo forestal a través de plantaciones de especies arbóreas exóticas, lo que implica cambiar de un uso agrícola y de praderas a una mayor su-perficie cubierta con bosques. Este es el caso de la cuenca Tutuvén que posee más de 60 % de su superficie cubierta por bosques (nativos y exóticos). En cambio, la cuenca Cunculén mantiene un uso agrícola y de praderas en más de 50 % de su superficie. Ambas cuencas fueron parte de este estudio.
En Chile, los estudios hidrológicos para encontrar la formu-lación matemática que proporcione los datos de caudales ge-nerados por una cuenca, bajo determinadas características de precipitación, datan de 1974. En ese año, Benítez y Rodrí-guez ajustaron los coeficientes Ct y Cp del HUS de Snyder, a partir de las características edafoclimáticas chilenas de cuencas del centro sur del país (Pizarro & Novoa, 1986). En 1985 aparece nuevamente otro estudio con el objetivo de ve-rificar la veracidad de lo propuesto en 1974 e introducir mo-dificaciones. Arteaga y Benítez (1985) fueron quienes deter-minaron tres hidrogramas unitarios tras la recopilación de información fluviométrica, pluviométrica y fisiográfica de 34 cuencas controladas entre el valle de Aconcagua, Quinta Región y el río Chamiza, Décima Región, sirviendo de base el procedimiento de Snyder modificado por Benítez y Ro-dríguez (1974).
En este marco y para aportar conocimiento a los hidrogra-
INTRODUCTION
Internationally, there are several studies related to synthetic unit hydrograph (SUH) modeling. Recently, Jena and Ti-wari (2006) were able to adjust the Snyder SUH (1938) to the modeling of subtropical basin runoff based on the data obtained in two agricultural watersheds located in eastern India. On the other hand, Usul and Küpcü (1997) used geo-graphical information systems to adjust the unit hydrograph parameters (provided by the Soil Conservation Service) to the northwestern basins of Turkey as a response to the lack of models for determining water flows for the engineering of hydraulic structures. In addition, López, Gimena, Goñi, and Agirre (2005) went further by proposing and analyzing, with satisfactory results, a method to obtain unit hydro-graphs; this method was developed in an agricultural basin. Nonetheless, there are no further studies that compare the methodologies proposed in this article, with the exception of specific studies of local SUHs (Sen, 2006, 2007) and those used by Singh, Bhunya, Mishra, and Chaube (2007) in the case of hybrid SUHs.
At present, land-use changes are quite common in peri-urban and rural areas in Chile, a situation that has a direct impact on a watershed’s hydrological behavior. An example of this is the non-irrigated area located in Chile’s Maule re-gion, which has undergone several territorial changes due to the fact that its usage was mostly agricultural, causing soil degradation. Recently, a strong forestry component has emerged due to the planting of exotic tree species, which implies a transition from agricultural and pasture use to a larger surface area covered by forests. This is the case of the Tutuvén watershed, which has more than 60 % of its area covered by forest (native and exotic). By contrast, more than 50 % of the Cunculén basin is still used for agricul-tural and pasture purposes. Both watersheds were part of this study.
In Chile, hydrological studies to find the mathematical for-mulation that can provide data on water flow generated by a watershed, under specific precipitation characteristics, started in 1974. In that year, Benítez and Rodríguez adjusted the Snyder SUH Ct and Cp coefficients from the edaphocli-matic characteristics found in the south-central Chilean wa-tersheds (Pizarro and Novoa, 1986). In 1985, another study came out aimed at verifying what was proposed in 1974 and introducing modifications. Arteaga and Benítez (1985) were the ones to determine three unit hydrographs after gather-ing stream gauge, rainfall, and physiographic information related to 34 controlled basins located between the Acon-cagua valley (Vth Region) and the Chamiza river (Xth Region) by using the Benítez and Rodríguez modified version (1974) of Snyder’s procedure.
In this context, and in order to contribute knowledge on synthetic unit hydrographs used in Chile, this study com-paratively analyzed the behavior of three synthetic unit hy-
Revista Chapingo Serie Ciencias Forestales y del Ambiente
7
mas unitarios sintéticos utilizados en Chile, el presente es-tudio analizó comparativamente el comportamiento de tres modelos de hidrogramas unitarios sintéticos en dos cuencas de la Región del Maule, Chile Central. Esta comparación se realizó debido a que los HUS constituyen la base para la estimación del hidrograma de crecida en cuencas sin datos a través de la información de datos pluviométricos, donde la estimación se realiza de forma empírica con modelos ba-sados en las características morfométricas de las cuencas. Asimismo, las escorrentías directas generadas en un marco diferencial de precipitaciones efectivas se analizaron a partir de los HUS, con el fin de comparar los resultados obtenidos en cada uno de éstos.
MATERIALES Y MÉTODOS
Área de estudio
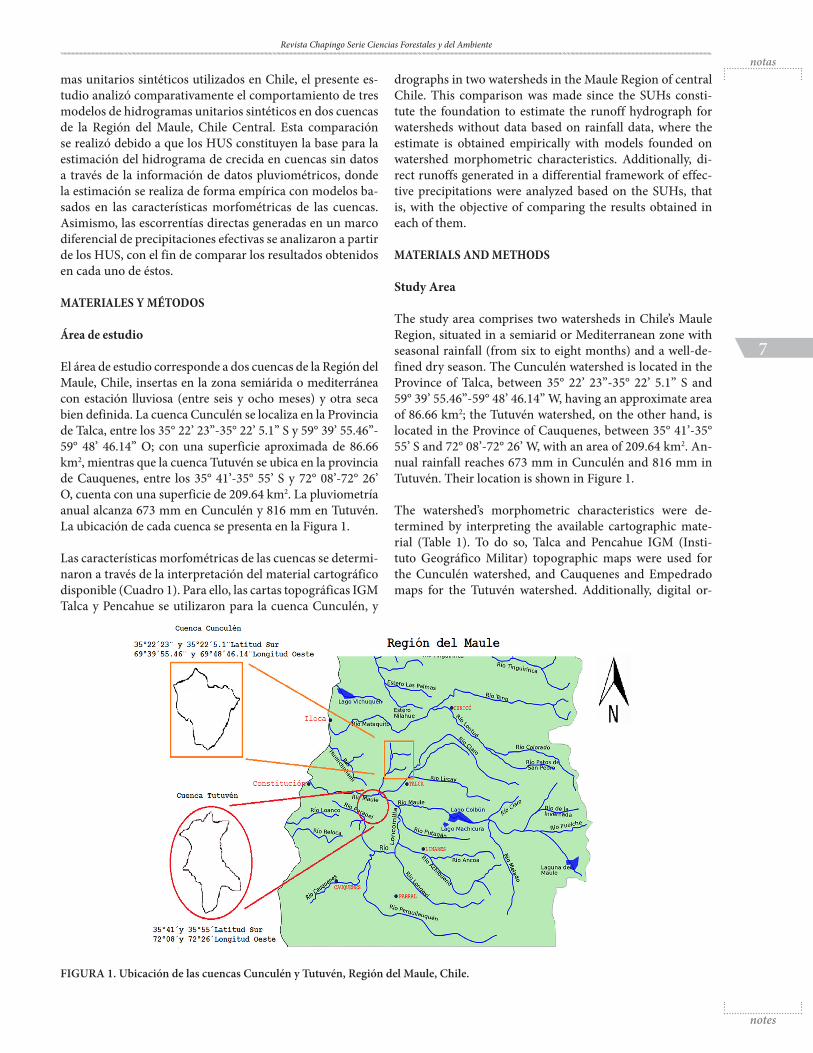
El área de estudio corresponde a dos cuencas de la Región del Maule, Chile, insertas en la zona semiárida o mediterránea con estación lluviosa (entre seis y ocho meses) y otra seca bien definida. La cuenca Cunculén se localiza en la Provincia de Talca, entre los 35° 22’ 23’’-35° 22’ 5.1’’ S y 59° 39’ 55.46’’-59° 48’ 46.14’’ O; con una superficie aproximada de 86.66 km2, mientras que la cuenca Tutuvén se ubica en la provincia de Cauquenes, entre los 35° 41’-35° 55’ S y 72° 08’-72° 26’ O, cuenta con una superficie de 209.64 km2. La pluviometría anual alcanza 673 mm en Cunculén y 816 mm en Tutuvén. La ubicación de cada cuenca se presenta en la Figura 1. Las características morfométricas de las cuencas se determi-naron a través de la interpretación del material cartográfico disponible (Cuadro 1). Para ello, las cartas topográficas IGM Talca y Pencahue se utilizaron para la cuenca Cunculén, y
FIGURA 1. Ubicación de las cuencas Cunculén y Tutuvén, Región del Maule, Chile.
drographs in two watersheds in the Maule Region of central Chile. This comparison was made since the SUHs consti-tute the foundation to estimate the runoff hydrograph for watersheds without data based on rainfall data, where the estimate is obtained empirically with models founded on watershed morphometric characteristics. Additionally, di-rect runoffs generated in a differential framework of effec-tive precipitations were analyzed based on the SUHs, that is, with the objective of comparing the results obtained in each of them.
MATERIALS AND METHODS
Study Area
The study area comprises two watersheds in Chile’s Maule Region, situated in a semiarid or Mediterranean zone with seasonal rainfall (from six to eight months) and a well-de-fined dry season. The Cunculén watershed is located in the Province of Talca, between 35° 22’ 23’’-35° 22’ 5.1’’ S and 59° 39’ 55.46’’-59° 48’ 46.14’’ W, having an approximate area of 86.66 km2; the Tutuvén watershed, on the other hand, is located in the Province of Cauquenes, between 35° 41’-35° 55’ S and 72° 08’-72° 26’ W, with an area of 209.64 km2. An-nual rainfall reaches 673 mm in Cunculén and 816 mm in Tutuvén. Their location is shown in Figure 1.
The watershed’s morphometric characteristics were de-termined by interpreting the available cartographic mate-rial (Table 1). To do so, Talca and Pencahue IGM (Insti-tuto Geográfico Militar) topographic maps were used for the Cunculén watershed, and Cauquenes and Empedrado maps for the Tutuvén watershed. Additionally, digital or-

Análisis comparativo... Balocchi-Contreras et al.
8
Cauquenes y Empedrado para la cuenca Tutuvén. También se utilizaron ortofotos formato digital de Botalcura, Estación Panguilemu, Pencahue y Talca Poniente para la cuenca Cun-culén, y las ortofotos análogas 3,530-7,200 D, 3,530-7,200 E, 3,550-7,200 A y 3,550-7,200 B para la cuenca Tutuvén, junto a las redes hidrográficas y curvas de nivel de los sectores en estudio. Las series de suelos determinadas fueron interpre-tadas mediante el manual “Materiales y símbolos” (Centro de Información de Recursos Naturales [CIREN]-Corpora-ción de Fomento de la Producción [CORFO], 1983).
De acuerdo con el Cuadro 1, la cuenca Cunculén, además de ser más pequeña que la de Tutuvén, tiene una mayor pendiente y presenta una superficie (44 %) importante de drenaje imperfecto (Cuadro 2), por lo que se espera que res-ponda más rápidamente a la precipitación, incrementando los caudales punta.
Por otro lado y de acuerdo con el Cuadro 3, las cuencas tie-nen diferencias en su cobertura vegetacional, ya que la de Tutuvén es más bien de uso forestal, mientras que la de Cun-culén es de uso mayoritariamente agrícola y de praderas. La suma de estas características incide en el comportamiento hidrológico de cada cuenca.
Obtención de los hidrogramas unitarios sintéticos
El hidrograma se obtiene de forma directa a través de las estadísticas fluviométricas. En el caso de carecer de esta in-formación y contar sólo con estaciones de medición de pre-cipitaciones, se utilizan las características morfométricas de la cuenca como la pendiente, cotas, áreas, el largo del curso principal, entre otras, para así construir el hidrograma in-directamente.
thophotos from Botalcura, Estación Panguilemo, Pencahue and Talca Poniente were used for the Cunculén watershed, and similar 3,530-7,200 D, 3,530-7,200 E, 3,550-7,200 A and 3,550-7,200 B orthophotos for the Tutuvén watershed, along with hydrographic networks and contour lines from the study areas. Certain soil series were interpreted using the “Materiales y símbolos” manual (Centro de Información de Recursos Naturales [CIREN]-Corporación de Fomento de la Producción [CORFO], 1983).
According to Table 1, the Cunculén watershed, besides be-ing smaller than the Tutuvén one, is steeper and has a sig-nificant imperfect drainage area (44 %) (Table 2); therefore, it is expected to respond more rapidly to precipitation, in-creasing the peak flows.
On the other hand, and according to Table 3, the watersheds have differences in vegetation cover, since Tutuvén’s is mainly used for forestry, while Cunculén’s is mostly devoted to agri-cultural and pasture use. The sum of these characteristics has an impact on the hydrological behavior of each watershed.
Obtaining synthetic unit hydrographs
Hydrographs are directly obtained through stream gauge statistics. In the event this information is lacking and there are only rainfall measuring stations, watershed morphomet-ric characteristics such as gradient, height, area, and length of the main flow, among others, are used to build hydro-graphs indirectly.
In this study, three methods were used to obtain SUHs: the Snyder Synthetic Unit Hydrograph (1938), the U.S. Bureau of Reclamation Triangular Hydrograph, and the Témez Tri-
FIGURE 1. Location of the Cunculén and Tutuvén watersheds, Maule Region, Chile.

Revista Chapingo Serie Ciencias Forestales y del Ambiente
9
CUADRO 1. Características morfométricas de las cuencas Cunculén y Tutuvén, Región del Maule, Chile.TABLE 1. Morphometric characteristics of the Cunculén and Tutuvén watersheds, Maule Region, Chile.
Parámetro morfométrico / Morphometric parameter Cunculén Tutuvén
Superficie / Area (km²) 86.6 209.6
Perímetro / Perimeter (km) 42.6 82.1
Cota máxima / Maximum height (m)* 550.0 150.0
Cota mínima / Minimum height (m)* 75.0 650.0
Longitud de la curva de nivel de la cota máxima / Maximum height contour length (m) 65.8 37.0
Longitud de la curva de nivel de la cota mínima / Minimum height contour length (m) 228.1 115.9
Longitud cauce principal / Main flow length (km) 25.6 35.3
Longitud del punto del cauce más próximo al centro gravedad / (km)Length of the closest riverbed point to the gravity center (km)
11.7 16.2
Pendiente media de la cuenca / Average watershed gradient (%) 18.5 14.2
Coeficiente de compacidad / Gravelius compactness coefficient 1.3 1.6
*Metros sobre el nivel del mar*Meters above sea level
CUADRO 2. Porcentajes de calidad de drenaje en las cuencas Tutuvén y Cunculén, Región del Maule, Chile. TABLE 2. Drainage quality percentages in the Tutuvén and Cunculén watersheds, Maule Region, Chile.
Drenaje / DrainageCuenca Cunculén /
Cunculén Watershed (%)Cuenca Tutuvén / Tutuvén
Watershed (%)Total (%)
Bueno / Good 11.1 80.0 47.6
Bueno a moderado / Good to moderate
33.3 20.0 28.6
Moderado / Moderate 11.1 0.0 4.8
Imperfecto / Imperfect 44.4 0.0 19.0
Total 100.0 100.0 100.0
Fuente: (CIREN-CORFO, 1983)Source: (CIREN-CORFO, 1983)
En este estudio se utilizaron tres métodos para obtener HUS: el Hidrograma Unitario Sintético de Snyder (1938), el Hi-drograma Triangular del “U. S. Bureau of Reclamation” y el Hidrograma Triangular de Témez (1978). El HUS de Snyder (Figura 2a) fue muy utilizado en Chile hasta que Benítez y Rodríguez (1974) lo definen y adaptan a la zona central de Chile. Posteriormente, Arteaga y Benítez (1985) lo modifi-can aún más, estableciendo los parámetros para otras zonas del país (Pizarro, González, Wittersheim, Saavedra, & Soto, 1993). Así, la propuesta de Arteaga y Benítez (1985) plantea lo siguiente para la zona Aconcagua-Maule:
angular Hydrograph (1978). The Snyder SUH (Figure 2a) was commonly used in Chile until Benítez and Rodríguez (1974) defined and adapted it to the country’s central area. Later, Arteaga and Benítez (1985) modified it even more, establishing the parameters for other areas of the country (Pizarro, González, Wittersheim, Saavedra, and Soto, 1993). Thus, the Arteaga and Benítez (1985) proposal suggests the following for the Aconcagua-Maule area:

Análisis comparativo... Balocchi-Contreras et al.
10
Donde:
tp = Tiempo de retardo de la cuenca (h)L: Longitud del curso principal (km)
: Distancia desde el desagüe de la hoya hasta el punto más cercano sobre la corriente, al centroide de la cuenca (km)Tb: Tiempo base (h)qp: Caudal (litros·s-1·km-2)tu: Tiempo unitario (h)El National Weather Service y el National Operational Hy-drologic Remote Sensing Center (NWS-NOHRSC, 2005) señalan al HUS del “U. S. Bureau of Reclamation” (Figura 2b) como uno de los métodos más utilizados a nivel mun-
Where:
tp = Watershed delay time (h)L: Main flow length (km)
: Length of the closest riverbed point to the gravity center (km)Tb: Base time (h)qp: Flow (liters·s-1·km-2)tu: Unit time (h)
The National Weather Service and the National Operational Hydrologic Remote Sensing Center (NWS-NOHRSC, 2005) point out that the U. S. Bureau of Reclamation SUH method (Figure 2b) is one of the most used worldwide. This hydro-graph was developed by Victor Mockus, based on a review
CUADRO 3. Coberturas de vegetación en las cuencas Tutuvén y Cunculén, Región del Maule, Chile.TABLE 3. Plant covers in the Tutuvén and Cunculén watersheds, Maule Region, Chile.
Tipos de vegetación / Vegetation types Tutuvén (ha) Cunculén (ha)
Bosque nativo-exótico asilvestrado semidenso / Untamed semi-dense native-exotic forest
59 -
Bosque nativo-plantación semidenso / Semi-dense native-plantation forest
97 -
Matorral abierto / Open shrubland 1,214 1,180Matorral arborescente abierto / Open arboreal shrubland 67 162Matorral arborescente denso / Dense arboreal shrubland 24 -Matorral arborescente semidenso / Semi-dense arboreal shrubland 1,374 2Matorral pradera denso / Dense prairie shrubland - 2,338
Matorral semidenso / Semi-dense shrubland 1,615 415
Plantación / Plantation 8,198 -Plantación joven o recién cosechada / Young or recently harvested plantation
4,344 -
Praderas anuales / Annual pastures 140 20Renoval abierto / Open secondary forest 125 -Renoval denso / Dense secondary forest 660 -Renoval semidenso / Semi-dense secondary forest 62 -Rotación cultivo-pradera / Crop-pasture rotation 2,817 1,207
Terrenos de uso agrícola / Agricultural lands 168 3,158
Total 20,963 8,483
Fuente: Catastro de Bosque Nativo (Corporación Nacional Forestal [CONAF]-Comisión Nacional del Medio Ambiente [CONAMA], 1997).
Source: Native Forest Cadastre (Corporación Nacional Forestal [CONAF]-Comisión Nacional del Medio Ambiente [CONAMA], 1997).

Revista Chapingo Serie Ciencias Forestales y del Ambiente
11FIGURA 2. a) Hidrograma unitario sintético de Snyder, b) Hidrograma triangular del “US Bureau of Reclamation”. Fuente: Chow,
Maidment y Mays (1994). tpR: Retardo de la cuenca, tb: Tiempo base, qpR: Caudal punta por unidad de área, W50 : Ancho al 50 % caudal punta, W75 : Ancho al 75 % caudal punta, qp: Caudal pico, D: Tiempo unitario, tp: Tiempo de retardo.
FIGURE 2. a) Snyder’s synthetic unit hydrograph, b) US Bureau of Reclamation triangular hydrograph. Source: Chow, Maidment and Mays (1994). tpR: Watershed delay; tb: Base time; qpR: Peak flow per unit area; W50 : 50% peak flow width; W75 : 75% peak flow width; qp: Peak flow; D: Unit time, tp: Delay time.
dial. El hidrograma fue desarrollado por Víctor Mockus, con base en la revisión de un gran número de hidrogramas sintéticos en cuencas con características variadas en tama-ño y ubicación geográfica. Al respecto, Farías (2007) señala que el método es aplicable para cuencas pequeñas, menores de 8 km2, y agrega que es muy usado cuando no se cuenta con suficientes datos hidrológicos. El hidrograma define un triángulo de base Tb, altura Qp y tiempo de retardo (tp) con las siguientes formulaciones (Pizarro et al., 1993):
Donde:
Tb = Tiempo base del hidrograma unitario (h)D = Tiempo unitario (h)tc = Tiempo de concentración de la cuenca (h)Qp = Caudal pico (m3·s-1)A = Área de la cuenca (km2)E = Precipitación que cae en un tiempo unitario D produci-do por el hidrograma unitario, normalmente toma el valor 1 mm.tp = Tiempo de retraso o retardo (h), no equivalente a la expresión de Snyder
Para obtener el valor de tc se recomienda aplicar una de las fórmulas empíricas presentadas anteriormente. En el caso
of a large number of synthetic hydrographs for watersheds with varied characteristics in size and geographical location. In this regard, Farías (2007) points out that this method can be applied to small watersheds, smaller than 8 km2, and that it is commonly used when there is not enough hydrological data. This hydrograph defines a Tb base triangle, Qp height, and delay time (tp) with the following formulations (Pizarro et al., 1993):
Where:
Tb = Unit hydrograph base time (h)D = Unit time (h)tc = Watershed concentration time (h)Qp = Peak flow (m3·s-1)A = Watershed area (km2)E = Rainfall in unit time D produced by the unit hydrograph normally takes the value 1 mm.tp = Delay time (h), which is not equivalent to Snyder’s ex-pression.
To get the tc value, it is recommended to apply one of the empirical formulas presented above. In regard to the D val-ue, it is suggested to use the Snyder SUH (1938) unit time, or it should otherwise be assimilated to the unit:
Análisis comparativo... Balocchi-Contreras et al.
12
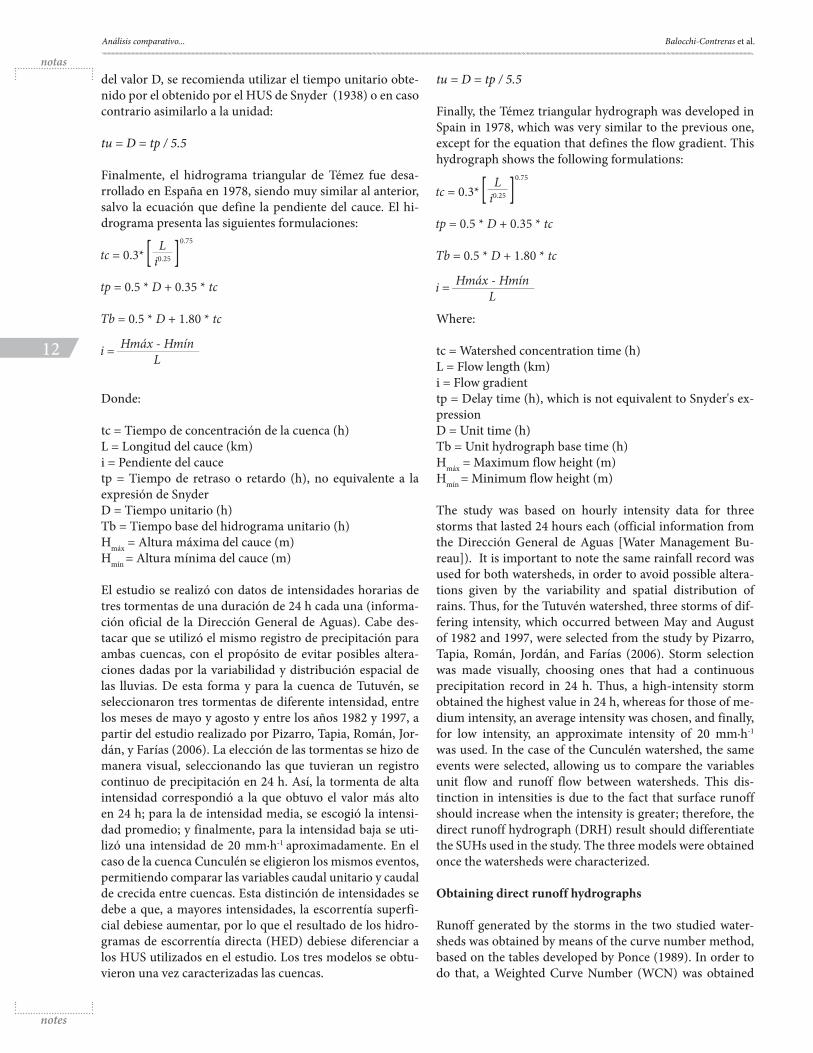
del valor D, se recomienda utilizar el tiempo unitario obte-nido por el obtenido por el HUS de Snyder (1938) o en caso contrario asimilarlo a la unidad:
tu = D = tp / 5.5
Finalmente, el hidrograma triangular de Témez fue desa-rrollado en España en 1978, siendo muy similar al anterior, salvo la ecuación que define la pendiente del cauce. El hi-drograma presenta las siguientes formulaciones:
Donde:
tc = Tiempo de concentración de la cuenca (h)L = Longitud del cauce (km)i = Pendiente del caucetp = Tiempo de retraso o retardo (h), no equivalente a la expresión de SnyderD = Tiempo unitario (h)Tb = Tiempo base del hidrograma unitario (h)Hmáx = Altura máxima del cauce (m)Hmín = Altura mínima del cauce (m)
El estudio se realizó con datos de intensidades horarias de tres tormentas de una duración de 24 h cada una (informa-ción oficial de la Dirección General de Aguas). Cabe des-tacar que se utilizó el mismo registro de precipitación para ambas cuencas, con el propósito de evitar posibles altera-ciones dadas por la variabilidad y distribución espacial de las lluvias. De esta forma y para la cuenca de Tutuvén, se seleccionaron tres tormentas de diferente intensidad, entre los meses de mayo y agosto y entre los años 1982 y 1997, a partir del estudio realizado por Pizarro, Tapia, Román, Jor-dán, y Farías (2006). La elección de las tormentas se hizo de manera visual, seleccionando las que tuvieran un registro continuo de precipitación en 24 h. Así, la tormenta de alta intensidad correspondió a la que obtuvo el valor más alto en 24 h; para la de intensidad media, se escogió la intensi-dad promedio; y finalmente, para la intensidad baja se uti-lizó una intensidad de 20 mm·h-1 aproximadamente. En el caso de la cuenca Cunculén se eligieron los mismos eventos, permitiendo comparar las variables caudal unitario y caudal de crecida entre cuencas. Esta distinción de intensidades se debe a que, a mayores intensidades, la escorrentía superfi-cial debiese aumentar, por lo que el resultado de los hidro-gramas de escorrentía directa (HED) debiese diferenciar a los HUS utilizados en el estudio. Los tres modelos se obtu-vieron una vez caracterizadas las cuencas.
tu = D = tp / 5.5
Finally, the Témez triangular hydrograph was developed in Spain in 1978, which was very similar to the previous one, except for the equation that defines the flow gradient. This hydrograph shows the following formulations:
Where:
tc = Watershed concentration time (h)L = Flow length (km)i = Flow gradienttp = Delay time (h), which is not equivalent to Snyder's ex-pressionD = Unit time (h)Tb = Unit hydrograph base time (h)Hmáx = Maximum flow height (m)Hmín = Minimum flow height (m)
The study was based on hourly intensity data for three storms that lasted 24 hours each (official information from the Dirección General de Aguas [Water Management Bu-reau]). It is important to note the same rainfall record was used for both watersheds, in order to avoid possible altera-tions given by the variability and spatial distribution of rains. Thus, for the Tutuvén watershed, three storms of dif-fering intensity, which occurred between May and August of 1982 and 1997, were selected from the study by Pizarro, Tapia, Román, Jordán, and Farías (2006). Storm selection was made visually, choosing ones that had a continuous precipitation record in 24 h. Thus, a high-intensity storm obtained the highest value in 24 h, whereas for those of me-dium intensity, an average intensity was chosen, and finally, for low intensity, an approximate intensity of 20 mm·h-1
was used. In the case of the Cunculén watershed, the same events were selected, allowing us to compare the variables unit flow and runoff flow between watersheds. This dis-tinction in intensities is due to the fact that surface runoff should increase when the intensity is greater; therefore, the direct runoff hydrograph (DRH) result should differentiate the SUHs used in the study. The three models were obtained once the watersheds were characterized.
Obtaining direct runoff hydrographs
Runoff generated by the storms in the two studied water-sheds was obtained by means of the curve number method, based on the tables developed by Ponce (1989). In order to do that, a Weighted Curve Number (WCN) was obtained

Revista Chapingo Serie Ciencias Forestales y del Ambiente
13
Obtención de los hidrogramas de escorrentía directa
La escorrentía generada por las tormentas en las dos cuen-cas de estudio se obtuvo mediante el método del número de curva (o curva numérica), basándose en las tablas de-sarrolladas por Ponce (1989). Para ello, se obtuvo un nú-mero de curva ponderado (NCP) para cada cuenca y se determinaron los valores de P0 (umbral de escorrentía) y S (máxima infiltración). Luego, se estimó el hietograma de precipitación efectiva en ambas cuencas para las tres tor-mentas seleccionadas. Los valores que representan el hie-tograma (intensidad de precipitación en función del tiem-po) fueron transformados a un pluviograma, acumulando los valores de intensidad. Posteriormente y acorde con la metodología del número de curva, se determinó el plu-viograma neto. Finalmente, el hietograma de precipitación efectiva sumado a los HUS y mediante la convolución de hidrogramas, permitió la estimación de los HED de ambas cuencas, bajo las tres intensidades de precipitación seña-ladas. La técnica de convolución de hidrogramas utiliza la siguiente expresión:
HED = Pe * HU
Donde:
HED: Hidrograma de escorrentía directaPe: Precipitación efectiva (mm)HU: Hidrogramas unitarios sintéticos
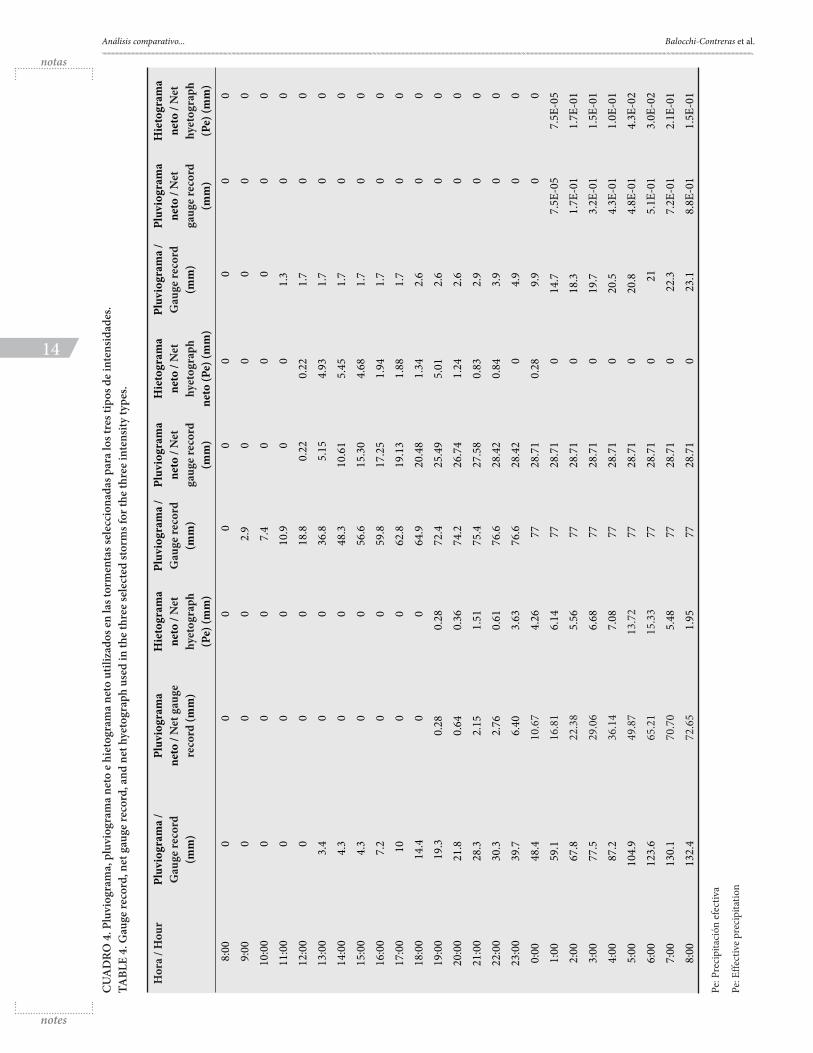
El Cuadro 4 muestra los montos de precipitación de las tor-mentas, el hietograma, pluviograma, hietograma neto y plu-viograma neto, utilizados en cada cuenca.
Análisis estadístico
Con el fin de tener mayores herramientas en la discusión de resultados, en la presente investigación se utilizaron las siguientes pruebas estadísticas:
a) Kruskall-Wallis. Prueba no paramétrica que trabaja con un mínimo de tres poblaciones independientes. La idea central radica en probar la hipótesis nula, es decir, que las muestras provienen de poblaciones con medianas iguales (Triola, 2009). En el caso de nuestra investigación, el test se utilizó sobre los montos de caudal para cada tiempo en cada cuenca.
b) U-Mann Whitney. Prueba no paramétrica que deter-mina si dos muestras independientes provienen de la misma población (Mendenhall & Sincich, 1997; Montgo-mery & Runger, 1996). El test se utilizó para verificar que todos los pares posibles entre los HED, generados por los HUS y las correspondientes precipitaciones efectivas, po-seen diferencias significativas entre ellos en una misma cuenca.
for each watershed and the P0 (runoff threshold), and S (maximum infiltration) values were determined. Then the effective rainfall hyetograph was estimated for both water-sheds for the three selected storms. The values representing the hyetograph (precipitation intensity based on time) were transformed to a gauge record diagram, gathering intensity values. Subsequently, and according to the curve number method, the net gauge record was determined. Finally, the effective rainfall hyetograph added to the SUHs, through convolving hydrographs, allowed us to estimate the DRHs of both watersheds, under the three precipitation intensities indicated. The hydrograph convolving technique uses the following expression:
DRH = Pe * UH
Where:
DRH: Direct runoff hydrograph.Pe: Effective precipitation (mm)HU: Synthetic unit hydrographs
Table 4 shows the storm rainfall amounts, the hyetograph, the gauge record, net hyetograph and net gauge record used in each watershed.
Statistical analysis
In order to have more tools to discuss the results, the follow-ing statistical tests were used in this study:
a) Kruskall-Wallis. A non-parametric test that works with three independent populations. The main goal is to test the null hypothesis or, in other words, that the populations come from samples with equal medians (Triola, 2009). In regard to our study, this test was used on the flow amounts for each time in each watershed.
b) Mann-Whitney U. A non-parametric test that determines if two independent samples come from the same population (Mendenhall and Sincich, 1997; Montgomery and Runger, 1996). This test was used to verify that all possible DRH pairs, generated by SUHs, had significant differences be-tween them in regard to the same watershed.
RESULTS AND DISCUSSION
Synthetic unit hydrographs (SUH)
Figure 3 shows the three SUH models obtained in the Cun-culén and Tutuvén watersheds. Estimates provided by the Snyder (1938) and Témez (1978) SUHs are fairly similar in peak flow and base time, whereas the values modeled by the US Bureau of Reclamation SUH are higher in flow, with val-ues of 6.5 m3·s-1 for Cunculén and 11.9 m3·s-1 for Tutuvén, and with a lower base time for both watersheds. Nonetheless,
Análisis comparativo... Balocchi-Contreras et al.
14
CU
AD
RO 4
. Plu
viog
ram
a, p
luvi
ogra
ma
neto
e h
ieto
gram
a ne
to u
tiliz
ados
en la
s tor
men
tas s
elec
cion
adas
par
a lo
s tre
s tip
os d
e in
tens
idad
es.
TABL
E 4.
Gau
ge re
cord
, net
gau
ge re
cord
, and
net
hye
togr
aph
used
in th
e th
ree
sele
cted
stor
ms f
or th
e th
ree
inte
nsity
type
s.
Hor
a / H
our
Pluv
iogr
ama
/ G
auge
reco
rd(m
m)
Pluv
iogr
ama
neto
/ N
et g
auge
re
cord
(mm
)
Hie
togr
ama
neto
/ N
et
hyet
ogra
ph
(Pe)
(mm
)
Pluv
iogr
ama
/ G
auge
reco
rd(m
m)
Pluv
iogr
ama
neto
/ N
et
gaug
e re
cord
(m
m)
Hie
togr
ama
neto
/ N
et
hyet
ogra
phne
to (P
e) (m
m)
Pluv
iogr
ama
/ G
auge
reco
rd(m
m)
Pluv
iogr
ama
neto
/ N
et
gaug
e re
cord
(m
m)
Hie
togr
ama
neto
/ N
et
hyet
ogra
ph
(Pe)
(mm
)8:
000
00
00
00
00
9:00
00
02.
90
00
00
10:0
00
00
7.4
00
00
011
:00
00
010
.90
01.
30
012
:00
00
018
.80.
220.
221.
70
013
:00
3.4
00
36.8
5.15
4.93
1.7
00
14:0
0 4
.30
048
.310
.61
5.45
1.7
00
15:0
0 4
.30
056
.615
.30
4.68
1.7
00
16:0
0 7
.20
059
.817
.25
1.94
1.7
00
17:0
0 1
00
062
.819
.13
1.88
1.7
00
18:0
014
.40
064
.920
.48
1.34
2.6
00
19:0
019
.30.
28 0
.28
72.4
25.4
95.
012.
60
020
:00
21.
80.
64 0
.36
74.2
26.7
41.
242.
60
021
:00
28.
32.
15 1
.51
75.4
27.5
80.
832.
90
022
:00
30.
32.
76 0
.61
76.6
28.4
20.
843.
90
023
:00
39.
76.
40 3
.63
76.6
28.4
20
4.9
00
0:00
48.
4
10.
67 4
.26
7728
.71
0.28
9.9
00
1:00
59.
1
16.
81 6
.14
7728
.71
014
.77.
5E-0
57.
5E-0
52:
00 6
7.8
2
2.38
5.5
677
28.7
10
18.3
1.7E
-01
1.7E
-01
3:00
77.
5
29.
06 6
.68
7728
.71
019
.73.
2E-0
11.
5E-0
14:
00 8
7.2
3
6.14
7.0
877
28.7
10
20.5
4.3E
-01
1.0E
-01
5:00
104.
9
49.
87
1
3.72
7728
.71
020
.84.
8E-0
14.
3E-0
26:
0012
3.6
6
5.21
15.
3377
28.7
10
215.
1E-0
13.
0E-0
27:
0013
0.1
7
0.70
5.4
877
28.7
10
22.3
7.2E
-01
2.1E
-01
8:00
132.
4
72.
65 1
.95
7728
.71
023
.18.
8E-0
11.
5E-0
1
Pe: P
reci
pita
ción
efe
ctiv
a
Pe: E
ffect
ive
prec
ipita
tion

Revista Chapingo Serie Ciencias Forestales y del Ambiente
15
RESULTADOS Y DISCUSIÓN
Hidrogramas unitarios sintéticos (HUS)
En la Figura 3 se presentan los tres modelos de HUS obtenidos en las cuencas Cunculén y Tutuvén. Las estimaciones proporcionadas por los HUS de Snyder (1938) y Témez (1978) son bastante similares, tanto en el caudal punta como en el tiempo base, mientras que los valores modelados por el “HUS Bureau of Reclamation” son más altos en caudal con valores de 6.5 m3·s-1 para Cunculén y 11.9 m3·s-1 para Tutuvén y con un tiempo base menor para ambas cuencas. No obstante, la comparación entre los montos de caudal para cada tiempo en cada cuenca, al aplicar la prueba estadística de rangos múltiples de Kruskall-Wallis, determinó que no existen diferencias significativas entre los tres HUS calculados (P = 0.05).
El NCP se calculó obteniendo valores de 78 y 72, para las cuencas Cunculén y Tutuvén, respectivamente. Esto indica que la cuenca Cunculén presenta suelos menos permeables y tiende a producir una mayor escorrentía, aunque las varia-ciones entre las cuencas son bajas.
FIGURA 3. Hidrogramas unitarios sintéticos (HUS) obtenidos para las cuencas Cunculén (a) y Tutuvén (b), Región del Maule, Chile.FIGURE 3. Synthetic unit hydrographs (SUH) obtained for the Cunculén (a) and Tutuvén (b) watersheds, Maule Region, Chile.
the comparison between the flow amounts for each time in each watershed, while applying the Kruskall-Wallis multiple range statistical test, determined that there are no significant differences between the three calculated SUHs (P = 0.05).
As a result of the WCN calculation, the values obtained for the Cunculén and Tutuvén watersheds were 78 and 72, re-spectively. This indicates that the Cunculén watershed has less permeable soil and tends to produce more runoffs, al-though variations between the watersheds are low.
Direct runoff hydrographs
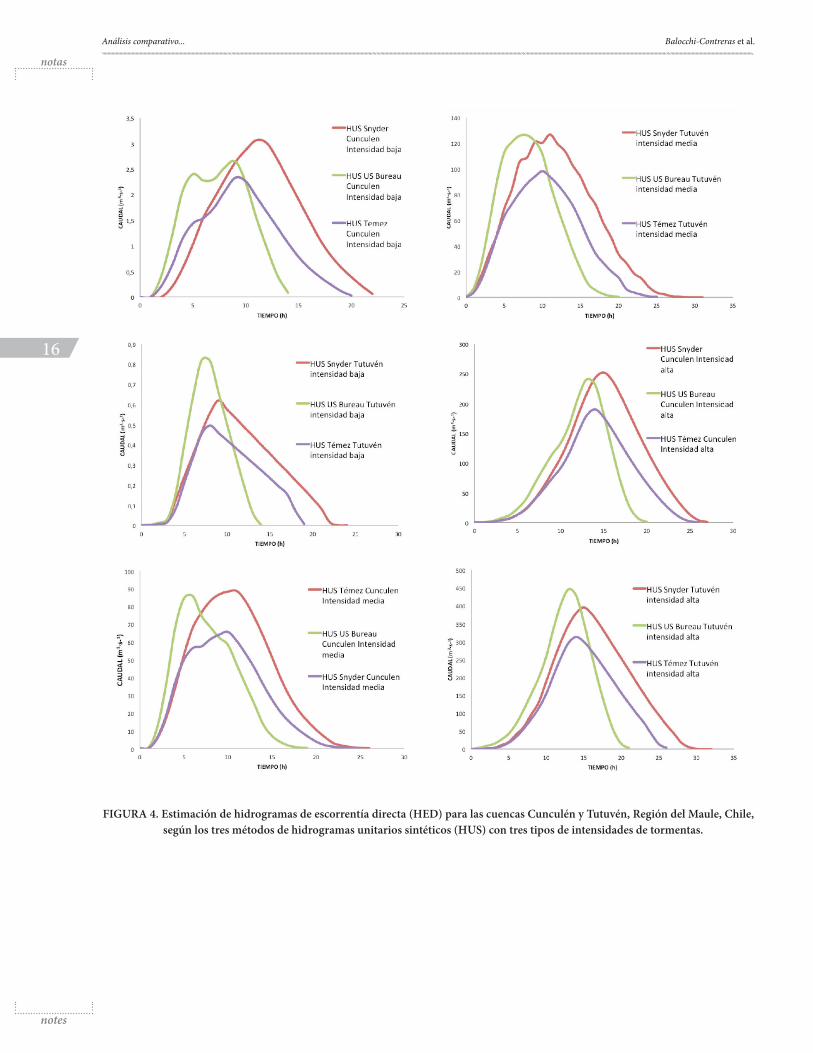
Figure 4 presents the DRH estimates, based on the SUHs, according to the method analyzed and the storms consid-ered. As can be seen, there are small differences between the three SUHs in regard to peak flows. It is worth stressing that the sinuosity of the plotted curves is perceptible when there are medium intensities. Generally, in graphical terms, there is a similarity between the Snyder and Témez SUHs, with the US Bureau of Reclamation SUH being the highest in the Tutuvén watershed. In the Cunculén watershed, on the other hand, the Snyder SUH was the method that provided
Análisis comparativo... Balocchi-Contreras et al.
16
FIGURA 4. Estimación de hidrogramas de escorrentía directa (HED) para las cuencas Cunculén y Tutuvén, Región del Maule, Chile, según los tres métodos de hidrogramas unitarios sintéticos (HUS) con tres tipos de intensidades de tormentas.

Revista Chapingo Serie Ciencias Forestales y del Ambiente
17
FIGURE 4. Direct runoff hydrograph (DRH) estimation for the Cunculén and Tutuvén watersheds, Maule Region, Chile, according to the three synthetic unit hydrographs methods with three storm intensity types.

Análisis comparativo... Balocchi-Contreras et al.
18
Hidrogramas de escorrentía directa
En la Figura 4 se presentan las estimaciones de los HED a partir de los HUS, según el método analizado y las tormentas consideradas. Como se puede observar, hay pequeñas dife-rencias entre los tres HUS con respecto a los caudales punta. Cabe destacar que con intensidades medias, se advierte la sinuosidad de las curvas graficadas. En general, en términos gráficos, existe una similitud entre el HUS de Snyder y el de Témez, siendo el de “US Bureau of Reclamation” el más alto en la cuenca Tutuvén, mientras que en la cuenca Cunculén, el método que arrojó mayores valores de caudal punta es el HUS de Snyder. El test U-Mann Whitney (Cuadros 5 y 6) se hizo para todos los pares posibles entre HED generados por los HUS y las respectivas precipitaciones efectivas, con el fin de establecer si existen diferencias significativas de és-tos en una misma cuenca. En este contexto, solo se generan diferencias en la estimación del HED de la cuenca Cunculén provocado por una precipitación de alta intensidad, mode-lado a través del HUS de Snyder según Arteaga y Benítez (1985), con respecto a los otros dos modelos. En la cuen-ca Tutuvén no se encontraron diferencias estadísticamente significativas (P = 0.05) entre los hidrogramas de crecida en estudio, no influyendo la intensidad de precipitación. Sin embargo, el número de curva es esencial en este tipo de estudios, pues los errores en la interpretación de la cober-tura vegetal pueden generar valores irreales de escorrentía. Esto, debido a las desventajas que posee el número de curva ya que no contempla efectos espaciales; es decir, un número de curva no representa necesariamente un área en particular y no explica como caracterizar estados anteriores (Elhakeem & Papanicolaou, 2009; Ponce & Hawkins, 1996).
higher peak flow values. The Mann-Whitney U test (Tables 5 and 6) was performed for all possible pairs between the DRHs generated by the SUHs, and the respective effective precipitations, in order to establish whether there are sig-nificant differences between them in the same watershed. In this context, differences were only generated in the DRH estimate for the Cunculén watershed due to a high-intensity rainfall, modelled through the Snyder SUH as modified by Arteaga and Benítez (1985), relative to the other two mod-els. In the Tutuvén watershed, no statistically significant differences (P = 0.05) were found among the studied run-off hydrographs, with precipitation intensity having no ef-fect. However, the curve number is essential in this type of study, since interpretation errors related to vegetation cover can generate untrue runoff values. This happens due to the disadvantages that the curve number has since it does not consider spatial effects; in other words, a curve number does not necessarily represent a particular area and it does not explain how to characterize previous conditions (Elhakeem and Papanicolaou, 2009; Ponce and Hawkins, 1996).
In the specific case of the SUHs used, no limits in their use were observed for larger area watersheds, since the water-sheds studied here have different areas. However, the Témez SUH has been recommended for watersheds smaller than 2,000 km2 (Témez, 1978) and could explain, in a certain way, its behavior with high-intensity storms, despite the ab-sence of strong evidence that this methodology is affected by intensities greater than 100 mm·h-1. In this context, the U. S. Bureau of Reclamation SUH, contradicting the posi-tion taken by Farías (2007) who recommended it for smaller watersheds (8 km2), demonstrated that it can be applied to
CUADRO 5. Resultados tests U-Mann Whitney para los valores Q de crecida, tormentas de alta, media y baja intensidad de la cuenca Cunculén, Región del Maule, Chile.
TABLE 5. Mann-Whitney U test results for runoff Q values for high, medium and low intensity storms in the Cunculén watershed, Maule Region, Chile.
Metodologías de HED / DRH Methodologies
Intensidad altaValor P / High
intensityP value
Intensidad mediaValor P / Medium
intensityP value
Intensidad bajaValor P / Low
intensityP value
Snyder-Triangular de Témez / Snyder-Témez Triangular 0.00008* 0.3198 0.3016
Snyder-“Triangular Bureu of Reclamation” / Snyder-Bureau of Reclamation Triangular 0.0029* 0.7768 0.9629
Triangular “Bureu of Reclamation”-Triangular de Témez / Bureau of Reclamation Triangular-Témez Triangular 0.1946 0.4128 0.2224
HED: Hidrograma de escorrentía directa. *Diferencia estadísticamente significativa (P = 0.05)
DRH: Direct Runoff Hydrograph. *Statistically significant difference (P = 0.05)

Revista Chapingo Serie Ciencias Forestales y del Ambiente
19
En el caso particular de los HUS utilizados, no se observan limitantes de su uso en cuencas de área mayor, puesto que en el presente estudio éstas cuentan con diferentes áreas. Sin embargo, el HUS de Témez se ha recomendado para cuencas menores de 2,000 km2 (Témez, 1978) y podría ex-plicar, de cierta manera, su comportamiento con tormentas de alta intensidad, a pesar de no existir mayores evidencias que discriminen si esta metodología es afectada por inten-sidades mayores a 100 mm·h-1. En este marco, el HUS del “U. S. Bureau of Reclamation”, contradiciendo lo indicado por Farías (2007) quien lo recomienda para cuencas peque-ñas (8 km2), demostró que puede ser aplicado a cuencas de mayor tamaño, situación que limitaba el uso de esta meto-dología en cuencas de mayores dimensiones.
CONCLUSIONES
En este tipo de estudios, la caracterización de la cobertura vegetal en la utilización del número de curva es vital pues condiciona los parámetros del HUS. Por otro lado, la apli-cación de los HUS en zonas donde se carece de información fluviométrica es esencial, ya que realiza una estimación de los flujos de la cuenca y utiliza variables de fácil medición, transformándose en una herramienta simple y potente. En este marco, la utilización de los tres HUS analizados es indi-ferente, ya que no se observaron diferencias entre ellos. Sin embargo, al analizar los resultados se encontró que el HUS de Témez es el único que arroja diferencias estadísticamente significativas entre las dos cuencas, lo que estaría determi-nado por el tamaño de las mismas. El HUS de Snyder genera dudas en el caso de las tormentas de alta intensidad, princi-palmente por los mayores volúmenes de crecida obtenidos, por lo que el uso de este hidrograma no se recomienda en intensidades mayores a 100 mm·h-1. Finalmente, los HUS y la metodología del número de curva se transforman en una
CUADRO 6. Resultados tests U-Mann Whitney para los valores Q de crecida, tormentas de alta, media y baja intensidad de la cuenca Tutuvén, Región del Maule, Chile.
TABLE 6. Mann-Whitney U test results for runoff Q values for high, medium and low intensity storms in the Tutuvén watershed, Maule Region, Chile.
Metodologías de HED / DRH Methodologies
Intensidad altaValor P / High intensity
P value
Intensidad mediaValor P / Medium intensity
P value
Intensidad bajaValor P / Low intensity
P value
Snyder-Triangular de Témez 0.7606 0.7191 0.7852
Snyder-Triangular Bureu of Reclamation / Snyder-Bureau of Reclamation Triangular
0.5943 0.5729 0.4912
Triangular Bureu of Reclamation- Triangular de Témez / Bureau of Reclamation Triangular-Témez Triangular
0.5200 0.4285 0.5357
HED: Hidrograma de escorrentía directa. Diferencia estadísticamente significativa (P = 0.05)
DRH: Direct Runoff Hydrograph. *Statistically significant difference (P = 0.05)
bigger basins, which had limited the use of this methodol-ogy in bigger watersheds.
CONCLUSIONS
In this type of study, characterizing plant cover in curve number use is vital since it conditions the SUH parameters. On the other hand, applying SUHs in zones where there is a gap of stream gauge information is essential, since they pro-vide an estimate of watershed flows and use variables that are easy to measure, making it a simple yet powerful tool. In this context, the use of the three analyzed SUHs is indiffer-ent, since there were no differences observed among them. However, while analyzing the results it was found that the Témez SUH is the only one that shows statistically signifi-cant differences between the two watersheds, which would be determined by their size. The Snyder SUH raises dou-bts in the case of high-intensity storms, mainly due to the higher runoff volumes obtained; therefore, the use of this hydrograph is not recommended for intensities higher than 100 mm·h-1. Finally, SUHs and curve number methodology provide a reliable and simple to use tool in places where the-re is only rainfall information available.
End of English Version

Análisis comparativo... Balocchi-Contreras et al.
20
herramienta confiable y de fácil aplicación en lugares donde sólo se maneja información pluvial.
REFERENCIAS
Arteaga, E., & Benítez, A. (1985). Método para la determinación de hidrogramas unitarios sintéticos en Chile. Tesis, Universidad de Chile, Santiago, Chile.
Benítez, A., & Rodríguez, Z. (1974). Método para la determinación de hidrogramas unitarios sintéticos en Chile. Chile: ENDESA
Centro de Información de Recursos Naturales (CIREN), & Corporación de Fomento de la Producción (CORFO). (1983). Materiales y símbolos: Estudio agrológico VII región. Santiago, Chile: Autor.
Chow, V., Maidment, D., & Mays, L. (1994). Hidrología aplicada. Santa Fé de Bogotá, Colombia: McGraw-Hill.
Corporación Nacional Forestal (CONAF), & Comisión Nacional del Medio Ambiente (CONAMA). (1997). Catastro y evaluación de los recursos vegetacionales nativos de Chile. Santiago, Chile: Autor.
Elhakeem, M., & Papanicolaou, A. (2009). Estimation of the runoff curve number via direct rainfall simulator measurements in the state of Iowa, USA. Water Resour Manage, 23(12), 2455–2473. doi: 10.1007/s11269-008-9390-1
Farías, M. (2007). Hidrología avanzada: Caudal máximo e hidrograma de diseño. Perú: Universidad de Piura.
Jena, S. K., & Tiwari, K. N. (2006). Modeling synthetic unit hydrograph parameters with geomorphologic parameters of watersheds. Journal of Hydrology, 319(1-4), 1–14. doi: 10.1016/j.jhydrol.2005.03.025
López, J. J., Gimena, F. N., Goñi, M., & Agirre, U. (2005). Analysis of a unit hydrograph model based on watershed geomorphology represented as a cascade of reservoirs. Agricultural Water Management, 77(1-3), 128–143. doi: 10.1016/j.agwat.2004.09.025
Mendenhall, W., & Sincich, T. (1997). Probabilidad y estadística para ingeniería y ciencias (4a. ed.). México: Prentice-Hall Hipanoamericana.
Montgomery, D., & Runger, G. (1996). Probabilidad y estadística aplicadas a la ingeniería. México: McGraw-Hill.
National Weather Service (NWS), & National Operational Hydro-logic Remote Sensing Center (NOHRSC). (2005). Unit Hy-
drograph (UHG).Technical Manual. Consultado 12-08-12 en http://www.nohrsc.noaa.gov/technology/gis/uhg_man-ual.html
Pizarro, R., González, P., Wittersheim, M., Saavedra, J., & Soto, C. (1993). Elementos técnicos de hidrología III. Talca, Chile: Universidad de Talca.
Pizarro, R., & Novoa, P. (1986). Elementos técnicos de hidrología I. La Serena, Chile: Universidad de Chile.
Pizarro, R., Tapia, M., Román, L., Jordán, C., & Farías, C. (2006). Coeficientes de escorrentía instantáneos para la cuenca del río Tutuvén, VII Región del Maule, Chile. Revista Bosque, 27(2), 83–91. Obtenido de http://www.scielo.cl/pdf/bosque/v27n2/art02.pdf
Ponce, V. (1989). Engineering hydrology, principles and practices. New Jersey, USA: Prentice Hall PTR.
Ponce, V., & Hawkins, R. (1996). Runoff curve number: Has It Reached Maturity? Journal of Hydrologic Engineering, 1(1), 11–19. doi: 10.1061/(ASCE)1084-0699(1996)1:1(11)
Sen, Z. (2006). Hydrograph and unit hydrograph derivation in arid regions. Hydrological Processes, 22(3), 356–365. doi: 10.1002/hyp.6272
Sen, Z. (2007). Modified hydrograph method for arid regions. Hydrological Processes, 21(8), 1006–1014. doi: 10.1002/hyp.6601
Singh, P. K., Bhunya, P. K., Mishra, S. K., & Chaube, U. C. (2007). An extended hybrid model for synthetic unit hydrograph derivation. Journal of Hydrology, 336(3-4), 347–360. doi: 10.1016/j.jhydrol.2007.01.006
Snyder, F. (1938). Synthetic unit hydrographs. Trans Am Geophysics Union, 19, 447–54.
Témez, J. R. (1978). Cálculo hidrometeorológico de caudales máximos en pequeñas cuencas naturales. España: Dirección General de Carreteras-MOPU.
Triola, M. (2009). Estadística (10° ed.). México: Editorial Pearson.Usul, N., & Küpcü, O. (1997). Obtaining SCS synthetic unit
hydrograph by GIS techniques. Consultado 01-08-12 en http://proceedings.esri.com/library/userconf/proc97/proc97/to600/pap594/p594.htm