Comparability of TOEFL CBT Writing Prompts: Response Mode ... · Comparability of TOEFL CBT Writing...
52
Comparability of TOEFL CBT Writing Prompts: Response Mode Analyses Hunter Breland Yong-Won Lee Eiji Muraki Research Reports RR - 75 July 2004
Transcript of Comparability of TOEFL CBT Writing Prompts: Response Mode ... · Comparability of TOEFL CBT Writing...

Comparability of TOEFL
CBT Writing Prompts:
Response Mode Analyses
Hunter Breland
Yong-Won Lee
Eiji Muraki
Research ReportsRR - 75July 2004
Comparability of TOEFL CBT Writing Prompts:
Response Mode Analyses
Hunter Breland and Yong-Won Lee
ETS, Princeton, NJ
Eiji Muraki
Tohoku University, Japan
RR-04-23

ETS is an Equal Opportunity/Affirmative Action Employer. Copyright © 2004 by ETS. All rights reserved. No part of this report may be reproduced or transmitted in any form or by any means, electronic or mechanical, including photocopy, recording, or any information storage and retrieval system, without permission in writing from the publisher. Violators will be prosecuted in accordance with both U.S. and international copyright laws. EDUCATIONAL TESTING SERVICE, ETS, the ETS logos, Graduate Record Examinations, GRE, TOEFL, and the TOEFL logo are registered trademarks of Educational Testing Service. The Test of English as a Foreign Language is a trademark of Educational Testing Service. College Board is a registered trademark of the College Entrance Examination Board. Graduate Management Admission Test and GMAT are registered trademarks of the Graduate Management Admission Council.

Abstract
Eighty-three Test of English as a Foreign Language™ (TOEFL®) CBT writing prompts that
were administered between July 1998 and August 2000 were examined in order to identify
differences in scores that could be attributed to the response mode chosen by examinees
(handwritten or word processed). Differences were examined statistically using polytomous
logistic regression. An English language ability (ELA) variable was developed from the
multiple-choice components of the TOEFL examination and used as a matching variable.
Although there was little observed difference in mean writing scores, when examinees were
matched on English language ability, small differences were observed in effect sizes consistently
favoring the handwritten response mode. The difference favoring the handwritten response mode
occurred for all of the writing prompts analyzed; however, the differences for individual writing
prompts were small. This difference suggests a general effect for response mode.
Key words: Computer-based writing assessment, essay prompts, comparability, fairness,
response mode, logistic regression, proportional odds-ratio model
i

The Test of English as a Foreign Language™ (TOEFL®) was developed in 1963 by the National Council on the Testing of English as a Foreign Language. The Council was formed through the cooperative effort of more than 30 public and private organizations concerned with testing the English proficiency of nonnative speakers of the language applying for admission to institutions in the United States. In 1965, Educational Testing Service® (ETS®) and the College Board® assumed joint responsibility for the program. In 1973, a cooperative arrangement for the operation of the program was entered into by ETS, the College Board, and the Graduate Record Examinations (GRE®) Board. The membership of the College Board is composed of schools, colleges, school systems, and educational associations; GRE Board members are associated with graduate education. ETS administers the TOEFL program under the general direction of a policy board that was established by, and is affiliated with, the sponsoring organizations. Members of the TOEFL Board (previously the Policy Council) represent the College Board, the GRE Board, and such institutions and agencies as graduate schools of business, junior and community colleges, nonprofit educational exchange agencies, and agencies of the United States government.
A continuing program of research related to the TOEFL test is carried out in consultation with the TOEFL Committee of Examiners. Its members include representatives of the TOEFL Board and distinguished English as a second language specialists from the academic community. The Committee advises the TOEFL program about research needs and, through the research subcommittee, reviews and approves proposals for funding and reports for publication. Members of the Committee of Examiners serve four-year terms at the invitation of the Board; the chair of the committee serves on the Board. Because the studies are specific to the TOEFL test and the testing program, most of the actual research is conducted by ETS staff rather than by outside researchers. Many projects require the cooperation of other institutions, however, particularly those with programs in the teaching of English as a foreign or second language and applied linguistics. Representatives of such programs who are interested in participating in or conducting TOEFL-related research are invited to contact the TOEFL program office. All TOEFL research projects must undergo appropriate ETS review to ascertain that data confidentiality will be protected. Current (2004-2005) members of the TOEFL Committee of Examiners are: Micheline Chalhoub-Deville University of Iowa Deena Boraie The American University in Cairo Catherine Elder Monash University Glenn Fulcher University of Dundee William Grabe Northern Arizona University Keiko Koda Carnegie Mellon University Tim McNamara The University of Melbourne James E. Purpura Teachers College, Columbia University Terry Santos Humboldt State University
To obtain more information about the TOEFL programs and services, use one of the following:
E-mail: [email protected]
Web site: www.ets.org/toefl
ii

Acknowledgements
Several members of the ETS staff in addition to the authors contributed to this project.
Robert Kantor of the ETS Assessment Development served as a general advisor on a
number of matters. Corinne Reslier provided the TOEFL data tape used for the analyses
and explained numerous details of the data, and Tom Jirele advised on some of the initial
data analyses. Youn-Hee Lim, Ting Lu, and Cindy Nguyen also helped us with data preparation
and analyses. We also thank Lyle Bachman, Brenda Lim, and Brent Bridgeman for helpful
review comments.
iii


Table of Contents
Page
Introduction................................................................................................................................1
Methods......................................................................................................................................5
Sample .........................................................................................................................5
Instruments ..................................................................................................................5
Variables......................................................................................................................5
Data Analysis .............................................................................................................................6
Results........................................................................................................................................9
Discussion................................................................................................................................16
Conclusion ...............................................................................................................................17
References................................................................................................................................19
Appendixes
A - Derivation of the Logistic Regression Model for Polytomous Items: The Proportional Odds-ratio Model............................................................................22
B - Number of Essays, Mean and Standard Deviations of Essay Scores, and English Language Ability Scores for Word-processed and Handwritten Essay Groups.........25
C - Mean Expected Essay Scores, Residuals, and Standardized Mean Group Differences ......................................................................................................29
D - Uniform and Nonuniform Effect Sizes.......................................................................32
E - Scoring Rubrics for TOEFL-CBT Writing Prompts ..................................................38
v

List of Tables
Page
Table 1. Observed Means, Standard Deviations, and Standardized Mean Differences
Between Word-processed and Handwritten Response Mode Groups for TOEFL
Essay and English Language Ability Scores ..........................................................9
Table 2. Expected Mean Essay Scores, Residuals, and Standardized Mean Group
Differences After Controlling for English Language Ability...............................11
Table 3. Means of Slope Parameters and Increased R2 Values for the Added Predictor
Variables in the Logistic Regression ....................................................................13
Table 4. Five Prompts With the Largest Uniform R2 Effect Sizes Estimated From the
Three-step Modeling Procedure ...........................................................................14
Table 5. Five Prompts With the Largest Nonuniform R2 Effect Sizes Estimated From
the Three-step Modeling Procedure......................................................................14
Table B1. Number of Examinees for Word-processed and Handwritten Essay Groups
for 83 Prompts ......................................................................................................25
Table B2. Mean English Language Ability (ELA) and Raw Essay Scores for
Word-processed and Handwritten Essay Groups for 83 prompts ........................26
Table C1. Mean Expected Essay Scores and Residual–based Effect Sizes ..........................29
Table D1. Uniform, Nonuniform, and Total R2 Effect Sizes for 83 Prompts........................32
Table D2. Intercept and Slope Parameters for the Logistic Regression for 83 Prompts .......35
vi
List of Figures
Page
Figure 1. Mean English language ability for word-processed and handwritten essay
groups for each prompt...........................................................................................10
Figure 2. Observed essay mean scores for word-processed and handwritten essay
groups for each prompt...........................................................................................10
Figure 3. Mean residual essay scores (observed–expected) of word-processed and
handwritten essay groups for each prompt after controlling for English
language ability.......................................................................................................12
Figure 4. Residual-based effect sizes for the group differences. ...........................................12
Figure 5. Separate expected score curves for the word-processed and handwritten
essay groups based on the full logistic regression model: Largest dominantly
uniform effect. ........................................................................................................15
Figure 6. Separate expected score curves for the word-processed and handwritten
essay groups based on the full logistic regression model: Largest dominantly
nonuniform effect. ..................................................................................................16
vii


Introduction
Computer-based testing (CBT) administrations of the Test of English as a Foreign
Language™ (TOEFL®) began in the summer of 1998. These administrations included a
computer-based linear on-the-fly test (LOFT) of reading, computer-adaptive multiple-choice
tests of listening and structure (i.e., a multiple-choice test of grammar and sentence structure),
and a single-prompt writing test. The writing test consists of a brief essay assessment for which
responses can be made in either a word-processed or handwritten response mode. The prompts
for the CBT essay are selected for each examinee from a pool of prompts in a near-random
manner (a complex prompt selection algorithm is used that includes random selection). Thus, all
examinees do not receive the same prompt. It is therefore important that the prompts be of
reasonably equivalent difficulty. Moreover, questions arise as to whether the prompts are of
equivalent difficulty for different groups of examinees, such as those choosing word processing
or handwriting as the response mode. The objective of the present investigation was to compare
the difficulty of TOEFL CBT writing prompts for groups of examinees choosing to word process
or handwrite their responses.
No previous research has compared the difficulty of individual writing prompts for
examinees choosing to word process or handwrite their responses. There has been research,
however, on the more general question of word-processed versus handwritten responses to
writing prompts. Powers, Fowles, Farnum, and Ramsey (1994) conducted an experimental
investigation of the effects on essay scores of intermingling handwritten and word-processed
versions of student essays. Student essays produced originally in handwriting were converted to
word-processed versions, and essays produced originally using word-processors were converted
to handwritten versions. Analyses showed that essays in handwritten mode received higher
average scores than essays that were word processed regardless of the mode in which the essays
were originally produced. It was hypothesized that readers tended to favor handwritten essays,
and a subsequent repetition of the experiment showed that reader training and modified
instructions could reduce the effect favoring handwriting
Wolfe, Bolton, Feltovich, and Welch (1993) reported on two studies comparing word
processing to pen and paper writing assessments. The first study examined differences in test
administration and writing processes associated with each type of assessment. It was concluded
that there are differences in the way students approach writing when given a choice between the
1

two formats. The second study examined how raters evaluate handwritten versus word-processed
responses. The results showed that transcribed versions of essays received lower scores than
original versions regardless of the mode of composition.
Wolfe, Bolton, Feltovich, and Bangert (1996) investigated how word-processing
experience influences student performance on direct writing assessments. Students with different
levels of word-processing experience wrote two essays, one with word processors and one with
pen and paper. Students with less word processing experience scored higher when they wrote
with pen and paper. Only small differences between response modes were observed for students
with more word-processing experience.
Russell and Haney (1997) conducted an investigation of National Assessment of
Educational Progress (NAEP) examinees who wrote essays both on paper and on computer. The
results of this study showed that examinees who wrote on computers performed significantly
better than examinees who wrote on paper. These results are contrary to those obtained in most
other research, but it was pointed out that all of the examinees involved in the NAEP experiment
had substantial experience writing with word processors.
Bridgeman and Cooper (1998) studied the comparability of word-processed and
handwritten essays in the Graduate Management Admission Test® (GMAT®) for different
gender, ethnic, and language fluency groups. A random sample of students who registered to
take the regular paper-and-pencil GMAT was invited to take a new computerized version of the
GMAT. Half were randomly chosen to take the computerized text first, and half took the paper-
and-pencil version first. Data on student word-processing experience was obtained in a posttest
questionnaire. Both versions of the GMAT contained two 30-minute essay questions. Usable
data were obtained from 3,470 examinees. Comparisons of rater reliability revealed higher
reliabilities for word-processed than for handwritten essays. A three-way analysis of variance—
gender × ethnic-group × word-processing experience—indicated a significant effect for word-
processing experience but not for gender or ethnic group. The dependent variable used was the
difference between scores on the word-processed and handwritten essays. A similar analysis
comparing examinees with different English language abilities produced similar nonsignificant
effects for language fluency; but there was found to be a significant experience effect (examinees
with more word-processing experience tended to receive higher scores).
2

Previous TOEFL program research on nonessay tests did not reveal any meaningful
relationship between the level of computer familiarity and performance on computerized TOEFL
language tasks (Kirsch, Taylor, Jamieson, & Eignor, 1998; Taylor, Jamieson, Eignor, & Kirsch,
1998). It is important to note that computer familiarity was assessed through questionnaires in
these and other studies, rather than using an actual test of word-processing skill in English.
Gentile (1999) studied 29 students attending an English-language institute at a major
southeastern university. Students composed one essay by hand and another on a computer. The
responses were scored holistically and analyzed for development, organization, language use,
and grammar. Background information was obtained about students’ experience with word
processors, English language ability, years of English study, and experience studying writing in
English. The results showed that students who composed handwritten essays tended to have
higher mean scores as well as higher scores on development, organization, and language use.
Gentile, Riazantseva, and Cline (2001) replicated the Gentile (1999) study with a larger
sample of 365 English as a second language (ESL) examinees. The results of the study showed
that, when the quality of writing was evaluated through holistic scoring, examinees’ handwritten
essays received higher scores. Even when analytic scoring was used to evaluate the examinees’
essays, the handwritten essays appeared to be better on most of the specific dimensions (i.e.,
development, organization, vocabulary, and language use), except mechanics. They also found
that examinee essays that were transformed from a word-processed to a handwritten format were
more likely to receive high scores than those transformed from a handwritten to a word-
processed format.
In their summary of prior research on word processing in language education, Wolfe and
Manalo (2001) presented two intriguing possibilities: (1) Examinees with limited word-
processing skills could be distracted from the writing task at hand because of the added cognitive
demands of familiarizing themselves with the layout and functions of the keyboard (Dalton &
Hannafin, 1987; Porter, 1986) and of writing on a keyboard (Cochran-Smith, Paris, & Kahn,
1991); and (2) even for examinees who have word-processing experience, surface-level changes
rather than deeper, meaning-based changes might be facilitated in their writing (Hawisher, 1987;
Kurth, 1987; Lutz, 1987).
3
Wolfe and Manalo (2001) compared word-processed and handwritten responses to the
TOEFL writing test. Comparisons were made of the reliability of ratings, correlations of writing
scores with other parts of the TOEFL examination, and mean differences on writing scores for
word-processed and handwritten responses. It was concluded that rater reliability was slightly
higher for word-processed essays, that correlations with other parts of the TOEFL examination
were higher for word-processed essays, and that the observed mean scores for word-processed
essays were about the same as those for handwritten essays. When ability differences between
groups choosing to word process and handwrite was controlled by analysis of covariance
procedures, the means for the group choosing to write by hand slightly exceeded the means for
the group choosing to word process their essays. It was also observed that the group with higher-
level word-processing skills performed better on all other parts of the TOEFL examination.
Performance on a multiple-choice composite of listening, reading, and structure scores favored
the group who word processed their responses by over one half of a standard deviation. Wolfe
and Manalo concluded that the double-translation required to compose an essay using a word
processor distracts examinees who have poor English-language skills (see also Manalo & Wolfe,
2000a, 2000b).
Hollenbeck, Tindal, Stieber, and Harniss (2003) studied handwritten essays and
transcriptions of those essays prepared with a word processor. Raters used for the Oregon
statewide assessment scored both types of essays. Analyses indicated that the original
handwritten essays were rated significantly higher than the word-processed essays.
While all of the previous research studies do not agree perfectly in their findings, it would
appear that handwritten essays tend to be scored higher than word-processed essays, especially
when student ability is controlled. The purpose of the present investigation was to examine
response mode effects within individual TOEFL writing prompts. It was hypothesized that the
examinees choosing to word process their responses and those choosing to handwrite their
responses might possibly differ in some systematic ways. For example, it is possible that
examinees who choose to word process their responses do so because of their superior word-
processing skills and that those who choose to handwrite do so because of their lack of word-
processing skills. It is also possible that those examinees with superior word-processing skills are
of higher socioeconomic status and thus may have had systematically different life experiences,
which could be related to their ability to respond to certain prompts.
4

Methods
Sample
The data analyzed were based on all test administrations conducted between July 1998
and August 2000. There were 632,246 essays written on 87 different topics. Four prompts with
insufficient data were dropped from the current analysis. Of 622,859 essays written on 83
prompts included in the analysis, 365, 683 examinees chose the word-processing response mode
and 257,176 chose the handwritten mode (see Table B1 for more detailed information).
Instruments
The data analyzed included scores on the reading, listening, structure, and writing
subtests of the TOEFL CBT. The listening and structure tests are adaptive, the reading test is
linear, and the writing test score is the average of two reader ratings. Readers are trained using
intermingled handwritten and word-processed responses, so that benchmarks and rangefinders
are not associated with the response mode. The reading, listening, and structure scores were
summed to create an English language ability (ELA) variable. The ELA variable was used as a
control variable in the data analyses.
Variables
The following variables were selected from the TOEFL database:
1. TOEFL Reading score. This score is based on a linear multiple-choice test of
reading and has a score range from 0 to 30.
2. TOEFL Listening score. This score is based on an adaptive multiple-choice test of
listening comprehension and has a score range from 0 to 30.
3. TOEFL Structure score. This score is based on an adaptive multiple-choice test of
English grammar and sentence structure and has a range from 0 to 13.
4. TOEFL Essay score. This score ranges from 1 to 6 with possibilities of .5 intervals
and is based on two independent readings and holistic ratings of the essay response
on a 1 to 6 scale (see Appendix E for scoring rubrics). This score is generally the
average of two identical or adjacent scores; however, if the first two ratings differ by
more than one point, a third reader is used to adjudicate the score.
5

5. Response mode.
6. Prompt identification code.
In addition to the above variables available from the TOEFL database, the following
variables were developed:
7. Standardized ability, reading. This is a standardization of Variable 1, with a mean of
zero and a standard deviation of 1.0.
8. Standardized ability, listening. This is a standardization of Variable 2, with a mean
of zero and a standard deviation of 1.0.
9. Standardized ability, structure. This is a standardization of Variable 3, with a mean
of zero and a standard deviation of 1.0.
10. English language ability (ELA). This is the simple sum of variables 7, 8, and 9.
Data Analysis
Logistic regression analysis (Hosmer & Lemeshow, 1989) has been used mainly to detect
dichotomous differential item functioning (DIF) by specifying separate equations for reference
and focal groups of examinees (Swaminathan & Rogers, 1990). French and Miller (1996) have
demonstrated that this procedure can be extended for polytomous DIF as well. In this study, one
of the three polytomous logistic regression procedures used by French and Miller (1996) is
extended further to make it possible to compare the expected score curves for reference and focal
groups in the context of the TOEFL CBT writing prompt investigation. Logistic regression has
two main advantages over linear regression. The first is that the dependent variable does not have
to be continuous, unbounded, and measured on an interval or ratio scale. In the case of TOEFL
data, the dependent variable (the essay score) is discrete and bounded between 1 and 6. Because
the reported essay score is an average of two raters’ ratings, the dependent variable is in
increments of 0.5, with 11 valid score categories (i.e., 1.0, 1.5, 2.0, 2.5, 3.0, 3.5, 4.0, 4.5, 5.0, 5.5,
6.0). The second advantage of logistic regression is that it does not require a linear relationship
between the dependent and independent variables. Thus, it allows for the investigation of the
effect of group membership on the dependent variable, whether the relationships between the
dependent and the independent variables are linear or nonlinear. When a dependent variable is
discrete and bounded, with the independent variable being continuous, a nonlinear relationship is
6
likely among the variables. For these reasons, a logistic regression procedure was considered
preferable for the present study.
The logistic regression method employed in this study was the “proportional odds-ratio
model” that is also implemented in the SAS logistic procedure (SAS Institute, 1990). A three-
step modeling process based on logistic regression (Zumbo, 1999) was used as a main method of
analysis along with a residual-based procedure devised for this study. Polytomous essay scores
were dichotomized into 10 binary variables according to the cumulative-logit dichotomization
scheme (see Appendix A for more details). The 10 dichotomized essay variables were
simultaneously regressed on examinees’ ELA scores, the response mode dummy group variable
(word processed = 0; handwritten = 1), and the ability-by-group interaction variable in a step-by-
step fashion. Equal slopes were assumed for all of the 10 dichotomized variables from the same
prompt. Specifically, the ordinal logistic regression analysis was conducted in the following
three steps: In Step 1, the matching or conditioning variable (i.e., ELA scores) was entered into
the regression equation for all the dichotomized responses (i), as in xDxg ii 10),( ββ += . In Step
2, the group membership (i.e., word processed vs. handwritten) variable was entered
( mii DxDxg 210),( βββ ++=
mii DxDxg 210),(
). In Step 3, the interaction term (i.e., ELA-by-group) was added
( mxD3ββββ +++= ). The three nested models in steps 1–3 can be fitted to
the data and compared in terms of model-data fit (expressed in terms of χ2 statistics) and of the
size of R2 coefficients.
Three different kinds of the effects sizes from the logistic regression were used to gauge
the amount of the group differences (if any) in this study: (1) the residual-based effect size, (2)
R2 combined with p-values for the χ2 test and slope parameters, and (3) the group-specific
expected score curves. Before the full three-step modeling process began, expected essay scores,
residual scores, and the residual-based effect sizes were computed for all the prompts by using
only the matching variable (i.e., ELA scores) in the regression model. Expected essay scores for
individual examinees’ ELA scores were computed from the step-one model
( xDxg ii 10),( ββ += ). Residual scores were obtained for each examinee by subtracting their
ELA- predicted essay scores from observed essay scores, and these residual scores were
averaged separately for each response mode group on each prompt. The residual-based effect
sizes were computed by dividing the mean residual score difference between the two groups by
7
the pooled standard deviation of the essay scores for both groups. The residual-based effect size
may be viewed as a measure of the standardized group difference after controlling for the ability
difference.
The uniform R2 effect size is basically an increased portion of R2 after entering the dummy
response mode group variable into the ability-only regression model (Step 1); the nonuniform
effect size is an increased portion of R2 after adding the interaction term in the step-2 model. The
total effect size is the aggregate of the uniform and non-uniform effects.
To gauge the magnitude of effect sizes, we have used suggestions and recommendations
from the differential item functioning (DIF) literature, although the logistic regression
procedures used here are not traditional DIF procedures. For DIF analyses, Zumbo has suggested
that, for an item to be classified as displaying DIF (i.e., an aggregate of uniform and nonuniform
DIF), the 2-degrees of freedom χ2 test between Step 1 and 3 should have a p-value less than or
equal to 0.01 and the R2 difference between them should be at least 0.13. Zumbo’s DIF
classification scheme has been questioned by Jodoin and Gierl (2001), however, who prefer R2
values of 0.035 (for negligible DIF), .035 to .070 (for moderate DIF), and greater than 0.070 (for
large DIF) as proposed by Roussos and Stout (1996). Note that these recently proposed
thresholds are different from the established thresholds suggested by Cohen (1988) for R2 values
of 0.02, 0.13, and 0.26 for “small,” “medium,” and “large” effect sizes, respectively. The Cohen
thresholds for R2 effect sizes have also been linked to group mean score differences of 0.20, 0.50,
and 0.80 in standard deviation units, which we have used when working with differences
measured in standard deviation units. Given the variety of classification schemes recommended,
it is clear that some judgment is required in interpreting results.
Group-specific expected score curves were developed for those prompts that were flagged
because of statistically significant group effects, as explained in Appendix A. For those prompts
with statistically significant ability-by-group interaction effects, the two separate group-specific
curves cross at some point. For those prompts with no significant group effect, the two curves are
essentially identical. This can be regarded as a visual measure of the model-based effect sizes to
show vividly the patterns of the uniform and nonuniform effects of response mode on the essay
scores. The vertical distance between the two lines at each ELA score point can be regarded as the
expected essay score difference between examinees of the same English language ability, but from
different response mode groups.
8

Results
Table 1 gives the overall means, standard deviations, and standardized mean differences
observed between handwritten and word-processed groups for essay and English language ability
(ELA) scores. The standardized mean in ELA observed is higher for the group who chose to
word process their essay responses. The standardized mean difference between the two groups
(.47) is statistically significant (p < 0.0001) and would be viewed as a “moderate” effect size
using Cohen’s standard (Cohen, 1988). The standardized mean difference in essay scores (d)
observed for the word-processed and handwritten groups (0.09), however, is small and favors the
handwritten group. This difference is also statistically significant (p < 0.0001) because of the
large numbers of cases involved, but it would be considered a very small effect size in Cohen’s
scheme. Given the substantially higher ELA of the group who chose to word process their
responses, it would have been expected that examinees choosing to word process would have
averaged higher essay scores. These observations are similar to those made by Wolfe and
Manalo (2001) in analyses of smaller sample of the same TOEFL data.
Table 1
Observed Means, Standard Deviations, and Standardized Mean Differences Between Word-
processed and Handwritten Response Mode Groups for TOEFL Essay and English Language
Ability Scores
Variable/response mode N Mean SD d TOEFL essay score
Word-processed essay group 365,683 4.08 1.03 0.09*
Handwritten essay group 257,176 3.99 0.89
English language ability
Word-processed group 365,683 0.52 2.59 0.47*
Handwritten essay group 257,176 -0.73 2.72
* p < 0.0001 two-tailed.
Figures 1 and 2 show plots of English language ability and TOEFL prompt score means
for all 83 prompts examined. Figure 1 shows that the English Language Ability of examinees
9

who chose to word-process their essays is consistently higher than that of those who chose to
handwrite. Figure 2 shows that, despite the difference in English language ability between the
two groups, the mean essay scores for both groups are all at about the same level. The higher
average ELA for the group choosing to word process thus occurs for all of the prompts
examined, while the differences between response mode groups in total essay scores is almost
zero for all prompts.
-8.16
-5.44
-2.72
0.00
2.72
5.44
8.16
1 9 18 26 33 40 47 54 61 68 75 82Prompt No.
Abi
lity
Scor
es Word-processed
Hand-written
Figure 1. Mean English language ability for word-processed and handwritten essay groups for each prompt.
0
0.97
1.94
2.91
3.88
4.85
5.82
1 9 18 26 33 40 47 54 61 68 75 82
Prompt No.
Essa
y Sc
ore
Word-processed
Hand-written
Figure 2. Observed essay mean scores for word-processed and handwritten essay groups for each prompt.
10

Given the phenomenon observed in Table 1 and Figures 1 and 2 for observed ELA and
essay scores, it is of special interest to determine if these differences change when ELA is
controlled. Table 2 shows the results of the logistic regression analysis in which English
Language Ability was used to predict expected mean TOEFL writing scores for examinees in
both groups. The expected mean TOEFL writing score for the group who used word processors
is higher (4.17) than that for the handwritten group (3.89) even though the observed essay scores
for the two groups varied little. The differences between the observed and expected scores for the
two groups (word-processed responses were lower than expected and handwritten responses
were higher than expected) indicate that, on average, the writing tasks may favor the handwritten
group slightly. The effect size (d) of –0.19 for the difference between the two groups is small by
Cohen’s standard, however.
Table 2
Expected Mean Essay Scores, Residuals, and Standardized Mean Group Differences After
Controlling for English Language Ability
Expected score
Residual (observed-expected) Variable/response mode
M SD M SD d
TOEFL writing score
Word-processed essay group 4.17 0.57 –0.09 1.03 –0.19*
Handwritten essay group 3.89 0.59 0.09 0.89
*p < 0.01 two-tailed.
A similar, consistent pattern was observed for each individual prompt examined. Figures
3 and 4 show that the group whose responses were handwritten scored higher than expected
(positive residual in Figure 3) on all 83 prompts, while the group whose responses were word
processed scored lower than expected (negative residual in Figure 3). The negative residual
scores for the word-processed essay group in Figure 3 also suggests that examinees who chose to
word process their essays tend to be slightly disadvantaged on all the prompts. The residual-
11

based effect sizes ranged from –0.29 to –0.09, with a mean of –0.19. Prompts 73, 64, and 72 had
the largest negative effect sizes as indicated in Figure 4.
-0.200-0.150-0.100-0.0500.0000.0500.1000.1500.200
1 10 21 29 37 45 53 61 69 77 85
Prompt No.
Res
idua
l Sco
re Word-processed
Hand-written
Figure 3. Mean residual essay scores (observed–expected) of word-processed and handwritten essay groups for each prompt after controlling for English language ability.
-0.35
-0.30
-0.25
-0.20
-0.15
-0.10
-0.05
0.00
0.05
1 9 18 26 33 40 47 5Prompt No
Effe
ct S
izes
Residual
Figure 4. Residual-based effect sizes for the grou
12
Prompt 72
Prompt 644 61 68 75 82
.
EffectSize
p differences.
Prompt 73

These results are similar to those obtained by Wolfe and Manalo (2001), who used
analysis of covariance procedures to control for English language ability, and of those obtained
by Gentile, Riazantseva, and Cline (2001), who controlled English language ability
experimentally.
Table 3 shows (1) that the English language ability variable (x) was the best predictor of
essay scores (p < 0.0001) for all of the 83 prompts analyzed, (2) that the response mode group
variable (Dm) turned out to be also a significant predictor of the essay scores (p < 0.0001) for all
of the 83 prompts, (3) that all of the 83 prompts exhibited a significant ability-by-group
interaction (x* Dm) (p < 0.0001), and (4) that the uniform effect was larger than the non-uniform
effect in 64 of the 83 prompts (see also Table D1 in Appendix D).
Table 3
Means of Slope Parameters and Increased R2 Values for the Added Predictor Variables in the
Logistic Regression
English language ability (x)
Response mode group (Dm)
Ability x group interaction
(x* Dm) Group effect No. of prompts Mean
β1 Mean
R2 Mean
|β2| Mean
R2 Mean
β3 Mean
R2 No effect 0
Uniform only 0
Uniform- dominant
64 –0.73* 0.3696 –0.47* 0.3804 0.13* 0.3857
NU-dominant 19 –0.76* 0.3819 –0.31* 0.3873 0.15* 0.3948
Total 83 –0.73* 0.3724 –0.43* 0.3724 0.13* 0.3878
*p < 0.0001 two-tailed.
Table 4 gives results for five prompts selected for having the largest uniform effect sizes.
None of these effect sizes is sufficient for the item to be classified as important by Zumbo’s .13
standard, but they can be considered as small effects in Cohen’s standard for R2 effect.
13

Table 4
Five Prompts With the Largest Uniform R2 Effect Sizes Estimated From the Three-step
Modeling Procedure
No. of examinees R2 effect size Prompt no. Word-
processed Handwritten
Slope for response mode (β2) Uniform
Non- uniform Total
Prompt 73 4,274 3,152 –0.73* 0.0235 0.0048 0.0283
Prompt 64 3,481 3,217 –0.71* 0.0231 0.0061 0.0292
Prompt 72 6,465 4,546 –0.63* 0.0191 0.0063 0.0254
Prompt 09 4,221 2,959 –0.61* 0.019 0.0042 0.0232
Prompt 75 2,037 2,022 –0.61* 0.0173 0.0044 0.0217
*p < 0.0001 two-tailed.
Table 5
Five Prompts With the Largest Nonuniform R2 Effect Sizes Estimated From the Three-step
Modeling Procedure
No. of examinees R2 effect size Prompt no. Word-
processed Hand- written
Slope for interaction term (β3) Uniform Non-
uniform Total
Prompt 83 3,229 1,882 0.19* 0.0088 0.0108 0.0196
Prompt 82 4,467 3,318 0.17* 0.0048 0.0102 0.0150
Prompt 36 3,437 2,348 0.17* 0.0086 0.0101 0.0187
Prompt 84 2,985 1,782 0.17* 0.0084 0.0092 0.0176
Prompt 40 4,221 2,959 0.17* 0.0165 0.0089 0.0254
*p < 0.0001 two-tailed
14
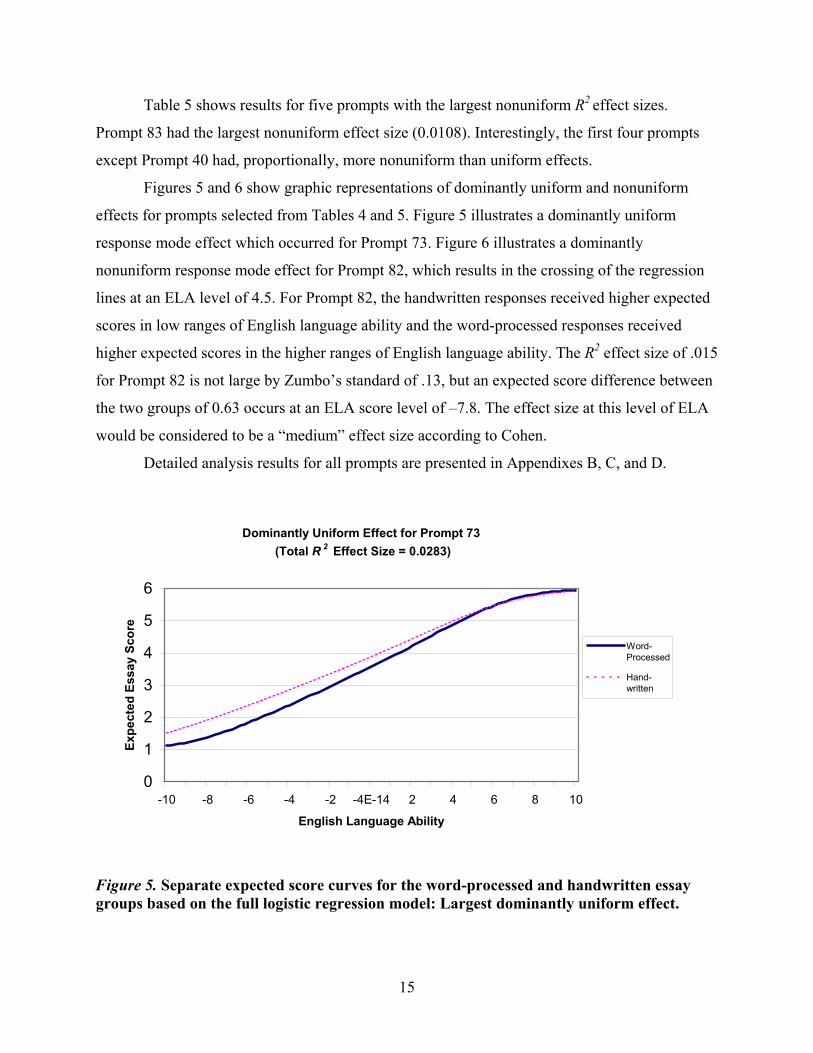
Table 5 shows results for five prompts with the largest nonuniform R2 effect sizes.
Prompt 83 had the largest nonuniform effect size (0.0108). Interestingly, the first four prompts
except Prompt 40 had, proportionally, more nonuniform than uniform effects.
Figures 5 and 6 show graphic representations of dominantly uniform and nonuniform
effects for prompts selected from Tables 4 and 5. Figure 5 illustrates a dominantly uniform
response mode effect which occurred for Prompt 73. Figure 6 illustrates a dominantly
nonuniform response mode effect for Prompt 82, which results in the crossing of the regression
lines at an ELA level of 4.5. For Prompt 82, the handwritten responses received higher expected
scores in low ranges of English language ability and the word-processed responses received
higher expected scores in the higher ranges of English language ability. The R2 effect size of .015
for Prompt 82 is not large by Zumbo’s standard of .13, but an expected score difference between
the two groups of 0.63 occurs at an ELA score level of –7.8. The effect size at this level of ELA
would be considered to be a “medium” effect size according to Cohen.
Detailed analysis results for all prompts are presented in Appendixes B, C, and D.
Dominantly Uniform Effect for Prompt 73 (Total R 2 Effect Size = 0.0283)
0
1
2
3
4
5
6
-10 -8 -6 -4 -2 -4E-14 2 4 6 8 10
English Language Ability
Expe
cted
Ess
ay S
core
Word-Processed
Hand-written
Figure 5. Separate expected score curves for the word-processed and handwritten essay groups based on the full logistic regression model: Largest dominantly uniform effect.
15

Dominantly Nonuniform Effect for Prompt 82 (Total R 2 Effect Size=0.0150)
0
1
2
3
4
5
6
-10 -8 -6 -4 -2 -0 2 4 6 8 10
English Language Ability
Expe
cted
Ess
ay S
core
Word-Processed
Hand-written
Figure 6. Separate expected score curves for the word-processed and handwritten essay groups based on the full logistic regression model: Largest dominantly nonuniform effect.
Discussion
The primary purpose of the present investigation was to investigate response mode effects
for individual TOEFL writing prompts. Initially, however, we computed average essay and English
Language Ability (ELA) scores for an aggregate of all prompts taken together for the two response
mode groups. These observed scores indicated that those students who chose to word process their
essay responses tended to have a higher ELA than examinees who chose to handwrite their essay
responses. Although it would have been expected that the word-processing group with higher ELA
would have higher average essay scores, the average essay scores for the two groups were almost
the same. This phenomenon was consistent across all individual prompts as well.
There is one hypothesis that might explain the minimal difference in observed mean
scores between examinees who used different response modes (despite the somewhat higher
English language ability of examinees who used word processors); if the responses had been
scored in separate word-processed and handwritten batches, the readers may have given similar
distributions of scores for each response mode. This hypothesis was checked with TOEFL staff
responsible for scoring and found to be highly unlikely. Although raters do at times see batches
16
of handwritten or word-processed essays, these batches are not large and the sample essays used
to establish benchmarks and rangefinders are intermingled handwritten and word-processed
responses. Moreover, it can be easily observed in readings that readers do not give consistently
similar distributions of scores within batches.
Given the higher English language ability of students who chose to word process, it was
of great interest to consider what the outcome would be if the two response mode groups were
matched on ELA. After examinees were matched on ELA, it was found that examinees who
chose to word process their essays tended to score slightly lower than would have been predicted
by their ELA scores, especially at low levels of ELA. Although all of the individual prompts
analyzed exhibited statistically significant response mode differences favoring the handwritten
mode, the differences in effect sizes across prompts were too small for any individual prompt to
be considered biased. The consistency with which response mode effects were observed across
prompts suggests a more general response mode effect, unrelated to specific prompts.
Two hypotheses have been advanced in the literature to explain why handwritten
responses may at times receive higher scores. The first hypothesis relates to differences in
computer familiarity and posits that examinees unfamiliar with word processors perform poorly
when they choose to word process. The second hypothesis relates to possible reader biases and
posits that readers may score word-processed essays more harshly for several reasons. One
reason that has been suggested is that word-processed essays often seem to be shorter in length
than handwritten essays. Another reason for possible harsher scoring of word-processed essays is
that spelling and other errors are more glaring than they are in handwritten responses.
Conclusion
Although the primary objective of this investigation was to examine individual TOEFL
writing prompts for response mode differences, the finding that handwritten responses tend to
receive higher scores than word-processed responses in general indicates that test administration
and scoring may be more important issues than prompt design. When a choice of either
handwritten or word-processed responses is offered in a test administration, examinees should be
advised that handwriting may be preferable for some examinees. Examinees should also be
advised to practice adequately with a word-processor before taking the test.
This advice may be especially important for examinees with lower English language
abilities, who tend to receive lower scores when they word process their responses. To the degree
17

that lower abilities may be associated with lower socioeconomic status, examinees of lower
socioeconomic status may have had fewer opportunities to master word-processing techniques
because they may have had less access to computer equipment.
The scoring of TOEFL writing responses may merit some attention, as suggested by
Powers et al. (1994). In this study, special reader training was used to (1) emphasize that
handwritten and word-processed essays may make different impressions on readers, (2) discuss
the influence of perceived length on essay scoring because word-processed essays may appear to
be shorter than handwritten essays, (3) introduce both handwritten and word-processed essays in
training, and (4) check for differences in standards applied to scoring essays in the two modes.
When this kind of training was used, smaller effects were observed for response mode.
Some limitations of the current study should be noted, however. One limitation was that the
ELA variable used is not an ideal matching variable. A better matching variable would have been a
measure similar to the free-response writing prompts being studied. Since the TOEFL examination
contains only one essay, there was no similar matching variable available. The use of a multiple-
choice measure such as ELA as a matching variable assumes that examinees who score high on
ELA will also perform well on the essay, and vice-versa. An important question is whether smaller
effect sizes might have been obtained if a more direct measure of writing had been used as a
matching variable. It may be possible to conduct research that would answer this question.
A second limitation of the present study is that it did not disentangle possible prompt
content and reader effects because the dependent variable was the average of ratings assigned by
two readers. Both readers and prompt content can be sources of systematic group effects as
observed in studies of reader-mediated writing assessment (Lumley, 2002; Wiegle, 1994, 1998).
It may also be useful to investigate rater cognition and behavior through verbal protocol analysis
(Ericsson & Simon, 1993; Green, 1997).
A similar protocol analysis might be useful for examinees who choose to word process
and handwrite. The results of this study, as well as much of the literature, suggest that (1) raters
have slight tendencies to be more lenient to handwritten essays than typed essays and (2) some
examinees choose to type despite poor word-processing skills. A reader protocol analysis or a
FACETS-based rater analysis (Linacre, 1989) may help in an exploration of the first hypothesis.
The second hypothesis might be investigated through verbal protocol analysis.
18
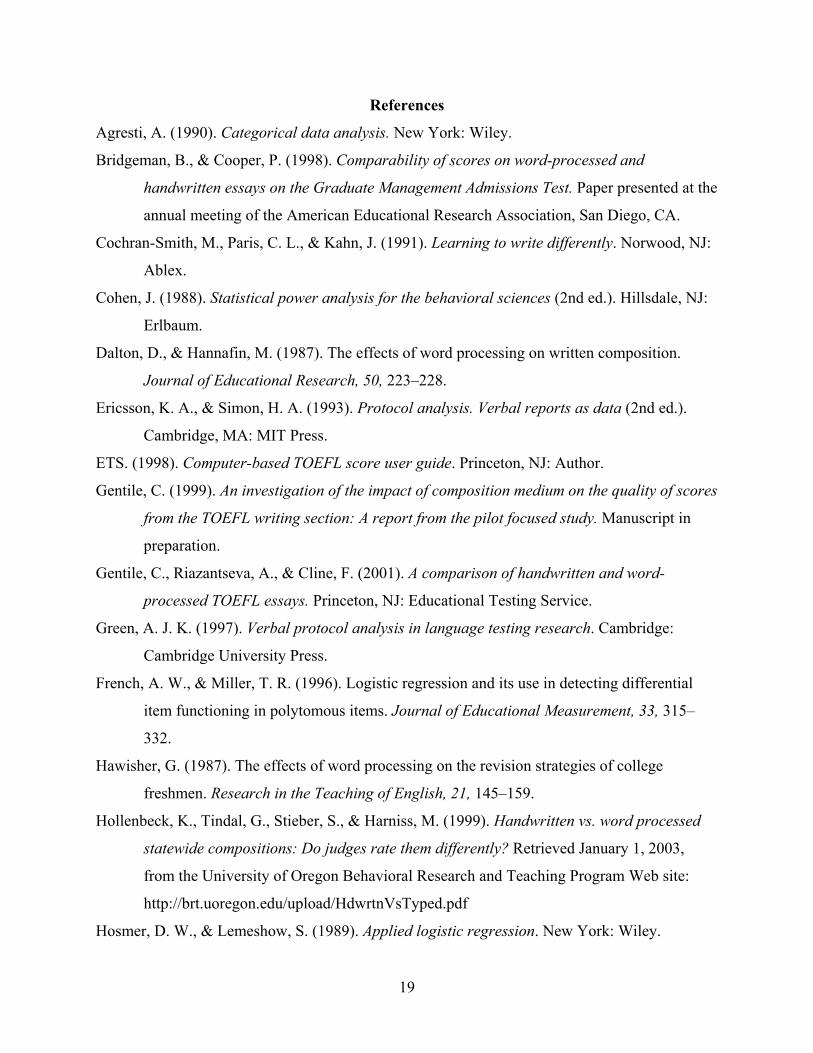
References
Agresti, A. (1990). Categorical data analysis. New York: Wiley.
Bridgeman, B., & Cooper, P. (1998). Comparability of scores on word-processed and
handwritten essays on the Graduate Management Admissions Test. Paper presented at the
annual meeting of the American Educational Research Association, San Diego, CA.
Cochran-Smith, M., Paris, C. L., & Kahn, J. (1991). Learning to write differently. Norwood, NJ:
Ablex.
Cohen, J. (1988). Statistical power analysis for the behavioral sciences (2nd ed.). Hillsdale, NJ:
Erlbaum.
Dalton, D., & Hannafin, M. (1987). The effects of word processing on written composition.
Journal of Educational Research, 50, 223–228.
Ericsson, K. A., & Simon, H. A. (1993). Protocol analysis. Verbal reports as data (2nd ed.).
Cambridge, MA: MIT Press.
ETS. (1998). Computer-based TOEFL score user guide. Princeton, NJ: Author.
Gentile, C. (1999). An investigation of the impact of composition medium on the quality of scores
from the TOEFL writing section: A report from the pilot focused study. Manuscript in
preparation.
Gentile, C., Riazantseva, A., & Cline, F. (2001). A comparison of handwritten and word-
processed TOEFL essays. Princeton, NJ: Educational Testing Service.
Green, A. J. K. (1997). Verbal protocol analysis in language testing research. Cambridge:
Cambridge University Press.
French, A. W., & Miller, T. R. (1996). Logistic regression and its use in detecting differential
item functioning in polytomous items. Journal of Educational Measurement, 33, 315–
332.
Hawisher, G. (1987). The effects of word processing on the revision strategies of college
freshmen. Research in the Teaching of English, 21, 145–159.
Hollenbeck, K., Tindal, G., Stieber, S., & Harniss, M. (1999). Handwritten vs. word processed
statewide compositions: Do judges rate them differently? Retrieved January 1, 2003,
from the University of Oregon Behavioral Research and Teaching Program Web site:
http://brt.uoregon.edu/upload/HdwrtnVsTyped.pdf
Hosmer, D. W., & Lemeshow, S. (1989). Applied logistic regression. New York: Wiley.
19

Jodion, M. G., & Gierl, M. J. (2001). Evaluating Type I error and power rates using an effect size
measure with the logistic regression procedure for DIF detection. Applied Measurement
in Education, 14(4), 329–349.
Kirsch, I., Taylor, C., Jamieson, J., & Eignor, D. (1998). Computer familiarity among TOEFL
examinees (TOEFL Research Report No. 59). Princeton, NJ: ETS.
Kurth, R. J. (1987). Using word processing to enhance revision strategies during student writing
activities. Educational Technology, 127(1), 13–19.
Linacre, J. M. (1989). Many-facet Rasch measurement. Chicago: MESA Press.
Lumley, T. (2002). Assessment criteria in a large-scale writing test: What do they really mean to
the raters? Language Testing, 19(3), 246–276.
Lutz, J. A. (1987). A study of professional and experienced writers revising and editing at the
computer and with pen and paper. Research in the Teaching of English, 21, 398–421.
Manalo, J. R., & Wolfe, E. W. (2000a). A comparison of word-processed and hand-written
essays written for the Test of English as a Foreign Language. Paper presented at the
annual meeting of the American Educational Research Association, New Orleans, LA.
Manalo, J. R., & Wolfe, E. W. (2000b). The impact of composition medium on essay raters in
foreign language testing. Paper presented at the annual meeting of the American
Educational Research Association, New Orleans, LA.
Porter, R. (1986). Writing and word processing in year one. Australian Educational Computing,
1, 18–23.
Powers, D. E., Fowles, M. E., Farnum, M., & Ramsey, P. (1994). Will they think less of my
handwritten essay if others word process theirs? Effects on essay scores of intermingling
handwritten and word-processed essays. Journal of Educational Measurement, 31(3),
220–233.
Roussos, L. A., & Stout, W. F. (1996). Simulation studies of the effects of small sample size and
studied item parameters on SIBTEST and Mantel-Haenzel Type I error performance.
Journal of Educational Measurement, 33(2), 215-230.
Russell, M., & Haney, W. (1997). Testing writing on computers: An experiment comparing
student performance on tests conducted via computer and via paper-and-pencil.
Education Policy Analysis Archives, 5(3), 1–18. Retrieved on December 1, 2003, from
http://epaa.asu.edu/epaa/v5n3.html
20

Samejima, F. (1997). Estimation of ability using a response pattern of graded scores.
Psychometrika Monograph, 17.
SAS Institute. (1990). SAS/STAT user’s guide, version six (4th ed., Vol. 2). Cary, NC: Author.
Swaminathan, H. & Rogers, H. J. (1990). Detecting differential item functioning using
logistic regression procedures. Journal of Educational Measurement, 27, 361–370.
Taylor, C., Jamieson, J., Eignor, D., & Kirsch, I. (1998). The relationship between computer
familiarity and performance on computer-based TOEFL test tasks (TOEFL Research
Report No. 61). Princeton, NJ: ETS.
Wiegle, S. C. (1994). Effects of training on raters of ESL compositions. Language Testing, 11,
197–223.
Wiegle, S. C. (1998). Using FACETS to model rater training effects. Language Testing, 15, 263–
287.
Wolfe, E. W., Bolton, S., Feltovich, B., & Welch, C. (1993). A comparison of word-processed
and handwritten essays from a standardized writing assessment (ACT Research Report
No. 93-8). Iowa City, IA: American College Testing Program.
Wolfe, E. W., Bolton, S., Feltovich, B., & Bangert, A. W. (1996). A study of word processing
experience and its effects on student essay writing. Journal of Educational Computing
Research, 14(3), 269–283.
Wolfe, E. W., & Manalo, J. R. (2001). An investigation of the impact of composition medium on
the quality of scores from the TOEFL writing section: A report from the broad-based
study. Princeton, NJ: ETS.
Zumbo, B. D. (1999). A handbook on the theory and methods of differential item functioning
(DIF): Logistic regression modeling as a unitary framework for binary and Likert-type
(ordinal) item scores. Ottawa, Ontario, Canada: Directorate of Human Resources
Research and Evaluation, Department of National Defense.
21

Appendix A
Derivation of the Logistic Regression Model for Polytomous Items:
The Proportional Odds-ratio Model
The multiple logistic regression equations for dichotomous items (i) can be written as:
))],((exp[1
1)],(exp[1
)],(exp[),|(
DxgDxgDxg
DxUPii
ii −+
=+
= (1)
where Ui represents the binary responses for dichotomized items i (Ui=0 or 1) and x is the
continuous variable score, and D is the design matrix of the covariate variables. In this equation,
the function gi (x,D) is called a logit. The logit is a linear combination of the continuous score
(x), a covariate variable (D), and an interaction term (xD). If we want to analyze the DIF for M
levels of a response mode covariate, as in our TOEFL essay data, we can rewrite the logit gi
(x,D) as:
mmii xDDxDxg 3210),( ββββ +++= (2)
where β0i is the intercept for a dichotomous item (i), β1 is the slope parameter associated with the
English language ability score, β2 is the parameter associated with the response mode group
variable, Dm, and β3 is the slope parameter associated with the ability score-by-group interaction.
In our study, Dm is 0 for the word-processed essay group and 1 for the handwritten essay group,
respectively. It should be noted that the score-by-group interaction term was also added to
examine the score difference of nonuniform nature between the two groups.
The dichtomous model in Equation 1 can be directly extended for a polytomous item case
based on the cumulative logit dichotomization scheme (Agresti, 1990; French & Miller, 1996).
For the polytomous case, K+1 response categories for the polytomous item are dichotomized into
K binary responses, and then the logistic regression is fitted to each dichotomized response for
the ordinal item, with the parallel slopes assumed for all the dichotomized responses. In the
actual TOEFL CBT essay data, there are 11 valid reported score categories (e.g., 1, 1.5 . . . 5.5,
6), and, thus, there are 10 dichotomized responses (K-1).
22

The proportional log-odds for each dichotomized response based on the cumulative logit scheme
can be expressed as:
]),(.....),(),(
),(.....),(),(ln[]
),|Pr(1),|Pr(
ln[21
10
DxPDxPDxPDxPDxPDxP
DxkyDxky
LKkk
k
j
jij +++
+++=
≤−
≤=
++
(3)
where Lij stands for the proportional log-odds ratio for a dichotomized response (i) on the
polytomous item (j), and k is a subscript of the response category (k=0,1,2 . . . K) for an
examinee score (y) on the polytomous essay item, j. It should be noted that in this scheme the
proportional log-odds ratio for this dichotomized response for prompt j is over
[1 ], which is the opposite of Samejima’s (1997) graded response model.
),|Pr( Dxky j ≤
),|1Pr( Dxky j +≤−
Category Characteristic Curves
If we define and as the regression of the binary item score method
in which all score categories smaller than k and k+1, respectively, are scored 0 for each
dichotomized item, the actual score category characteristic curve for score category k of the
graded item j in relation to the independent variables x is
),( DxPjk+ ),(1, DxP kj
++
(4) ),(),(),( 1, DxPDxPDxP jkkjjk++
+ −=
where
∑=
+ =k
vjvjk DxPDxP
0),(),(
Since the differencing scheme based on the cumulative logit logistic regression should be
the opposite of Samejima’s scheme, and can be also defined in such a way
that
),(0 DxPj+ ),(1, DxP Kj
++
0),(0 =+ DxPj
and
1),(1, =++ DxP Kj
23
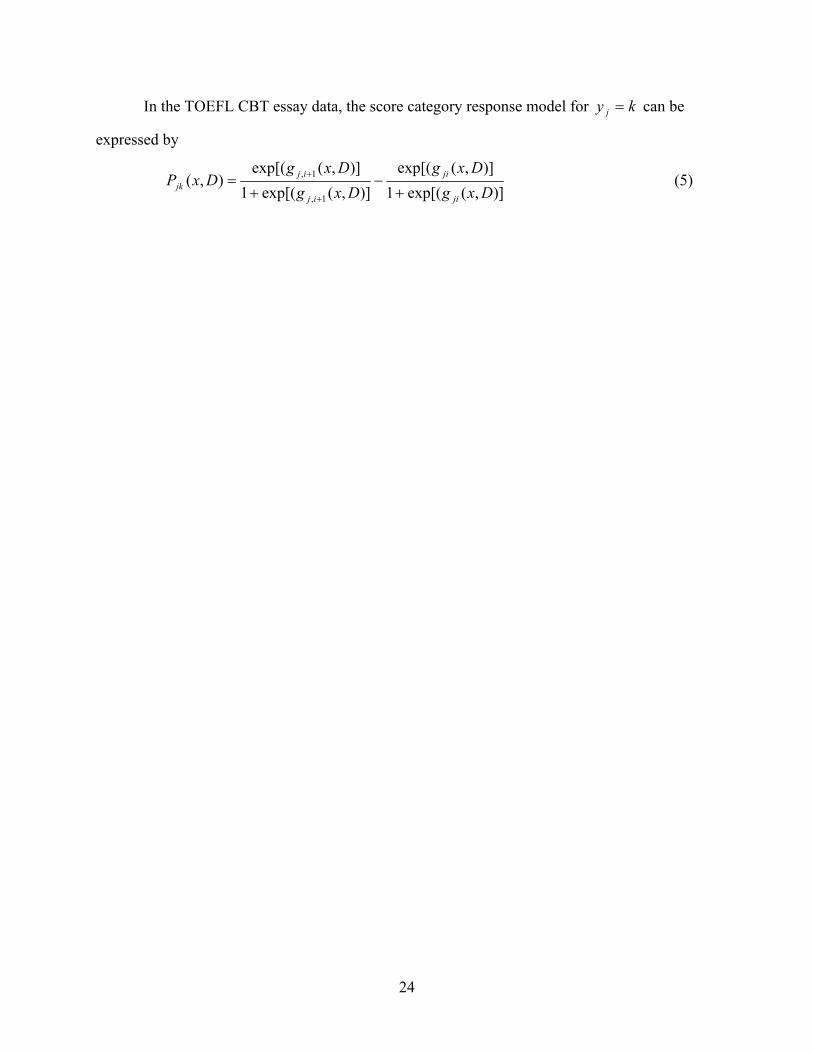
In the TOEFL CBT essay data, the score category response model for can be
expressed by
ky j =
)],(exp[(1
)],(exp[()],(exp[(1
)],(exp[(),(
1,
1,
DxgDxg
DxgDxg
DxPji
ji
ij
ijjk +
−+
=+
+ (5)
24

Appendix B
Number of Essays, Mean and Standard Deviations of Essay Scores, and English Language
Ability Scores for Word-processed and Handwritten Essay Groups
Table B1
Number of Examinees for Word-processed and Handwritten Essay Groups for 83 Prompts
Prompt no.
Word-processed
Hand-written
Total Prompt no.
Word-processed
Hand-written
Total
1 3,825 1,929 5,754 47 6,819 4,941 11,760 3 4,766 3,567 8,333 48 3,324 2,367 5,691 4 4,696 3,323 8,019 49 6,398 4,577 10,975 5 5,806 4,062 9,868 50 5,853 4,529 10,382 6 4,522 3,119 7,641 51 4,481 3,290 7,771 7 4,780 3,286 8,066 52 4,610 3,669 8,279 8 2,692 1,955 4,647 53 4,013 2,628 6,641 9 2,037 2,022 4,059 54 3,883 2,593 6,476 10 4,127 3,090 7,217 55 4,443 2,931 7,374 11 4,851 3,227 8,078 56 4,258 2,849 7,107 12 3,453 2,017 5,470 57 5,184 4,009 9,193 13 3,838 2,326 6,164 58 4,952 3,723 8,675 14 3,991 2,313 6,304 59 6,150 4,544 10,694 15 5,949 4,363 10,312 60 3,717 2,541 6,258 18 3,114 1,625 4,739 61 5,178 3,865 9,043 19 3,878 2,127 6,005 62 3,350 2,253 5,603 21 4,418 3,081 7,499 63 4,708 3,310 8,018 22 4,054 2,399 6,453 64 3,481 3,217 6,698 23 4,808 3,488 8,296 65 4,973 3,726 8,699 24 4,646 3,046 7,692 66 4,878 3,755 8,633 25 4,316 3,091 7,407 67 4,942 3,704 8,646 26 3,567 2,234 5,801 68 4,113 3,095 7,208 27 4,763 3,563 8,326 69 4,681 3,443 8,124 28 3,174 2,250 5,424 70 4,997 3,171 8,168 29 2,482 2,202 4,684 71 4,877 3,236 8,113 30 4,101 3,197 7,298 72 6,465 4,546 11,011 31 4,203 2,748 6,951 73 4,274 3,152 7,426 32 3,773 2,596 6,369 74 4,138 3,192 7,330 33 5,794 4,252 10,046 75 4,678 3,638 8,316 34 4,994 3,785 8,779 76 4,014 2,307 6,321 35 4,365 3,338 7,703 77 4,584 3,359 7,943
(Table continues)
25

Table B1 (continued)
Prompt no.
Word-processed
Hand-written
Total Prompt no.
Word-processed
Hand-written
Total
36 3,437 2,348 5,785 78 3,807 2,562 6,369 37 4,042 2,843 6,885 79 3,669 3,005 6,674 38 5,709 3,812 9,521 80 3,068 2,165 5,233 39 3,796 2,686 6,482 81 3,934 2,909 6,843 40 4,221 2,959 7,180 82 4,467 3,318 7,785 41 5,072 3,753 8,825 83 3,229 1,882 5,111 42 4,858 3,273 8,131 84 2,985 1,782 4,767 43 4,580 3,266 7,846 85 3,711 1,938 5,649 44 5,743 3,648 9,391 86 3,412 1,774 5,186 45 4,497 3,132 7,629 87 5,997 4,200 10,197 46 5,250 4,140 9,390 Total 365,683 257,176 622,859 Mean 4,406 3,099 7,504 SD 923 765 1,656
Table B2
Mean English Language Ability (ELA) and Raw Essay Scores for Word-processed and
Handwritten Essay Groups for 83 Prompts
Mean ELA scores Mean raw essay scores Word-processed Handwritten Word-processed Handwritten Prompt
no. Mean SD Mean SD Mean SD Mean SD 1 0.48 2.64 –0.75 2.70 4.16 1.02 4.02 0.85 3 0.46 2.64 –0.65 2.69 4.07 1.09 4.01 0.91 4 0.66 2.58 –0.64 2.72 4.13 1.04 4.03 0.91 5 0.57 2.56 –0.64 2.68 4.09 1.01 4.01 0.88 6 0.59 2.63 –0.67 2.71 4.08 1.06 3.98 0.93 7 0.34 2.62 –0.84 2.69 4.16 1.01 3.98 0.86 8 0.57 2.56 –0.60 2.69 4.18 0.97 4.15 0.84 9 0.73 2.48 –0.55 2.72 4.18 1.03 4.14 0.92 10 0.49 2.58 –0.62 2.70 3.98 1.05 3.92 0.92 11 0.39 2.64 –0.75 2.69 4.04 1.02 3.93 0.90 12 0.50 2.56 –0.79 2.72 4.06 0.99 3.98 0.85 13 0.40 2.67 –0.81 2.75 4.17 0.96 4.08 0.81 14 0.45 2.64 –0.74 2.67 4.07 1.04 3.97 0.86 15 0.54 2.57 –0.71 2.72 4.03 1.01 3.94 0.86 18 0.52 2.62 –0.85 2.73 4.10 1.06 3.92 0.89
(Table continues)
26

Table B2 (continued)
Mean ELA scores Mean raw essay scores Word-processed Handwritten Word-processed Handwritten Prompt
no. Mean SD Mean SD Mean SD Mean SD 19 0.46 2.66 –0.71 2.70 4.18 1.01 4.04 0.85 21 0.56 2.60 –0.68 2.72 4.10 1.04 4.00 0.91 22 0.46 2.65 –0.82 2.82 4.07 1.07 3.88 0.93 23 0.60 2.54 –0.67 2.74 4.04 1.01 3.93 0.89 24 0.46 2.58 –0.85 2.68 4.13 1.03 4.00 0.87 25 0.45 2.56 –0.71 2.71 4.12 0.99 4.02 0.85 26 0.32 2.68 –0.69 2.73 4.09 1.08 3.94 0.89 27 0.59 2.58 –0.61 2.70 4.15 0.99 4.07 0.83 28 0.59 2.55 –0.63 2.62 4.11 1.05 3.92 0.90 29 0.67 2.58 –0.64 2.69 3.97 1.09 3.86 0.96 30 0.66 2.60 –0.64 2.68 4.13 1.05 3.97 0.88 31 0.57 2.51 –0.71 2.71 4.15 1.03 4.05 0.88 32 0.38 2.60 –0.88 2.72 4.12 0.97 4.02 0.83 33 0.49 2.59 –0.70 2.70 4.12 1.00 4.07 0.85 34 0.62 2.52 –0.63 2.72 4.14 1.03 4.07 0.90 35 0.54 2.52 –0.64 2.74 4.12 1.02 4.02 0.92 36 0.51 2.58 –0.74 2.68 4.08 1.02 3.99 0.84 37 0.54 2.62 –0.62 2.67 4.09 1.02 4.02 0.86 38 0.56 2.61 –0.65 2.67 4.16 1.04 4.06 0.88 39 0.69 2.55 –0.60 2.71 4.11 1.00 4.04 0.88 40 0.73 2.49 –0.63 2.72 4.13 1.04 4.06 0.89 41 0.56 2.54 –0.65 2.72 3.99 1.04 3.89 0.91 42 0.62 2.56 –0.64 2.73 4.09 1.05 3.96 0.93 43 0.52 2.56 –0.78 2.72 4.08 1.02 3.96 0.90 44 0.38 2.64 –0.90 2.73 4.00 1.06 3.92 0.88 45 0.30 2.64 –0.80 2.69 3.98 1.04 3.90 0.87 46 0.61 2.57 –0.68 2.73 4.11 1.06 4.04 0.91 47 0.61 2.61 –0.67 2.71 4.10 1.05 4.01 0.90 48 0.44 2.59 –0.87 2.72 4.07 1.03 3.93 0.87 49 0.63 2.57 –0.70 2.69 4.13 1.01 4.01 0.89 50 0.57 2.61 –0.71 2.75 4.11 1.02 4.02 0.89 51 0.63 2.58 –0.65 2.71 4.09 1.06 4.03 0.94 52 0.67 2.57 –0.59 2.70 4.12 1.03 4.02 0.89 53 0.48 2.56 –0.62 2.67 4.09 1.03 4.02 0.88 54 0.53 2.54 –0.61 2.57 4.10 1.05 3.99 0.87 55 0.46 2.59 –0.66 2.66 4.03 1.03 4.00 0.88 56 0.46 2.61 –0.78 2.70 4.06 1.04 3.95 0.92 57 0.59 2.59 –0.71 2.74 4.07 1.02 3.99 0.89 58 0.52 2.59 –0.66 2.72 4.01 1.05 3.96 0.93
(Table continues)
27

Table B2 (continued)
Mean ELA scores Mean raw essay scores Word-processed Handwritten Word-processed Handwritten Prompt
no. Mean SD Mean SD Mean SD Mean SD 59 0.53 2.58 –0.70 2.72 4.12 1.04 4.02 0.92 60 0.37 2.58 –0.86 2.70 4.09 1.00 3.98 0.86 61 0.55 2.61 –0.68 2.71 4.08 0.97 4.04 0.85 62 0.46 2.63 –0.82 2.73 4.13 1.05 3.98 0.88 63 0.48 2.63 –0.76 2.66 4.08 1.01 4.00 0.85 64 0.68 2.55 –0.57 2.69 4.02 1.07 4.03 0.95 65 0.63 2.55 –0.69 2.70 4.13 1.02 4.03 0.87 66 0.60 2.54 –0.70 2.70 4.17 0.98 4.08 0.85 67 0.59 2.60 –0.67 2.66 4.05 1.07 3.94 0.91 68 0.60 2.58 –0.65 2.67 4.10 0.99 4.00 0.84 69 0.55 2.62 –0.70 2.75 4.11 1.02 4.02 0.89 70 0.57 2.54 –0.73 2.73 4.10 1.02 3.97 0.90 71 0.41 2.60 –0.86 2.71 4.03 0.99 3.95 0.84 72 0.55 2.60 –0.67 2.76 4.02 1.00 4.02 0.87 73 0.58 2.56 –0.68 2.72 4.04 1.08 4.05 0.94 74 0.57 2.53 –0.67 2.67 4.05 1.04 3.97 0.89 75 0.46 2.59 –0.71 2.68 3.99 1.06 3.97 0.89 76 0.48 2.63 –0.82 2.72 4.17 0.95 4.05 0.83 77 0.61 2.57 –0.65 2.73 4.20 1.02 4.08 0.88 78 0.35 2.61 –0.88 2.67 3.94 1.03 3.82 0.86 79 0.72 2.52 –0.66 2.75 4.03 1.06 3.90 0.93 80 0.52 2.56 –0.83 2.71 4.05 0.99 3.92 0.87 81 0.67 2.50 –0.52 2.68 4.02 1.06 3.94 0.93 82 0.51 2.59 –0.70 2.74 4.17 1.02 4.03 0.83 83 0.43 2.61 –0.83 2.74 4.03 1.02 3.92 0.83 84 0.51 2.60 –0.78 2.69 4.08 0.98 3.99 0.80 85 0.41 2.64 –0.90 2.72 4.07 0.99 3.98 0.84 86 0.44 2.66 –0.86 2.73 4.08 1.01 3.95 0.87 87 0.41 2.60 –0.71 2.66 3.99 1.02 3.98 0.84 Mean 0.53 2.59 –0.71 2.71 4.09 1.03 3.99 0.88
28
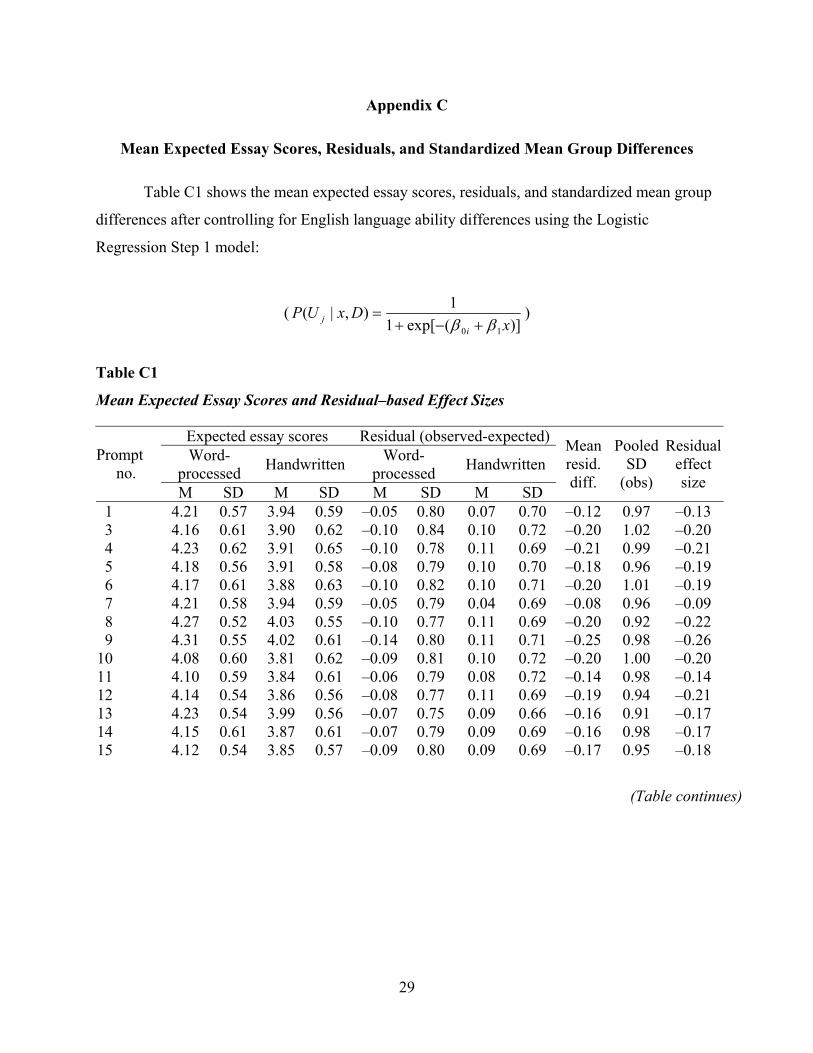
Appendix C
Mean Expected Essay Scores, Residuals, and Standardized Mean Group Differences
Table C1 shows the mean expected essay scores, residuals, and standardized mean group
differences after controlling for English language ability differences using the Logistic
Regression Step 1 model:
()](exp[1
1),|(10 x
DxUPi
j ββ +−+= )
Table C1
Mean Expected Essay Scores and Residual–based Effect Sizes
Expected essay scores Residual (observed-expected)Word-
processed Handwritten Word-processed Handwritten Prompt
no. M SD M SD M SD M SD
Mean resid. diff.
PooledSD
(obs)
Residualeffect size
1 4.21 0.57 3.94 0.59 –0.05 0.80 0.07 0.70 –0.12 0.97 –0.13 3 4.16 0.61 3.90 0.62 –0.10 0.84 0.10 0.72 –0.20 1.02 –0.20 4 4.23 0.62 3.91 0.65 –0.10 0.78 0.11 0.69 –0.21 0.99 –0.21 5 4.18 0.56 3.91 0.58 –0.08 0.79 0.10 0.70 –0.18 0.96 –0.19 6 4.17 0.61 3.88 0.63 –0.10 0.82 0.10 0.71 –0.20 1.01 –0.19 7 4.21 0.58 3.94 0.59 –0.05 0.79 0.04 0.69 –0.08 0.96 –0.09 8 4.27 0.52 4.03 0.55 –0.10 0.77 0.11 0.69 –0.20 0.92 –0.22 9 4.31 0.55 4.02 0.61 –0.14 0.80 0.11 0.71 –0.25 0.98 –0.26 10 4.08 0.60 3.81 0.62 –0.09 0.81 0.10 0.72 –0.20 1.00 –0.20 11 4.10 0.59 3.84 0.61 –0.06 0.79 0.08 0.72 –0.14 0.98 –0.14 12 4.14 0.54 3.86 0.56 –0.08 0.77 0.11 0.69 –0.19 0.94 –0.21 13 4.23 0.54 3.99 0.56 –0.07 0.75 0.09 0.66 –0.16 0.91 –0.17 14 4.15 0.61 3.87 0.61 –0.07 0.79 0.09 0.69 –0.16 0.98 –0.17 15 4.12 0.54 3.85 0.57 –0.09 0.80 0.09 0.69 –0.17 0.95 –0.18
(Table continues)
29
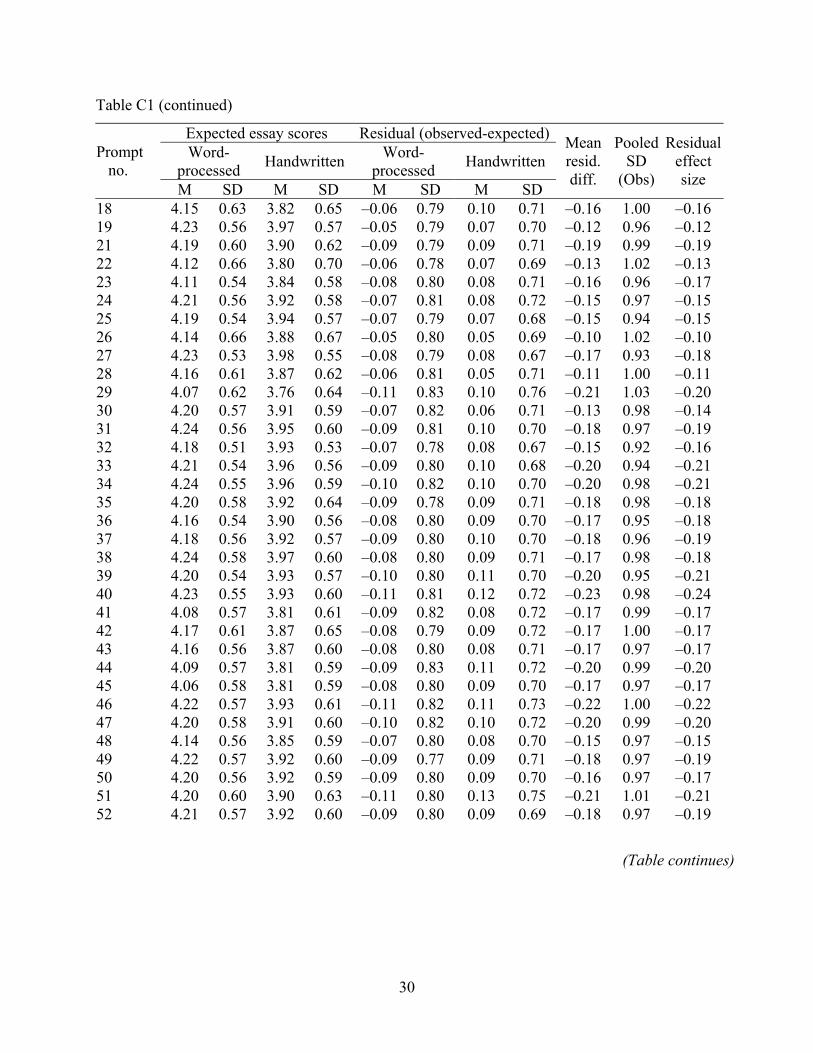
Table C1 (continued)
Expected essay scores Residual (observed-expected)Word-
processed Handwritten Word-processed Handwritten Prompt
no. M SD M SD M SD M SD
Mean resid. diff.
Pooled
(Obs)
Residualeffect size
18 4.15 3.82 0.65 –0.06 0.79 0.10 0.71 –0.16 1.00 –0.16 19 4.23 0.56 3.97 –0.05 0.79 0.07 0.70 –0.12 0.96 –0.12 21 4.19 0.60 3.90 0.62 –0.09 0.09 0.71 –0.19 0.99 –0.19 22 4.12 0.66 3.80 0.70 –0.06 0.78 0.07 –0.13 1.02 –0.13 23 4.11 0.54 3.84 0.58 –0.08 0.80 0.08 0.71 –0.16 –0.17 24 4.21 0.56 3.92 0.58 –0.07 0.81 0.08 0.72 –0.15 0.97 –0.15 25 4.19 0.54 3.94 0.57 –0.07 0.79 0.07 0.68 –0.15 0.94 –0.15 26 0.66 3.88 0.67 –0.05 0.80 0.05 0.69 –0.10 1.02 –0.10 27 4.23 0.53 0.55 –0.08 0.79 0.08 0.67 –0.17 0.93 –0.18 28 4.16 0.61
SD
0.63 0.57
0.79 0.69
0.96
4.14 3.98 3.87 0.62 –0.06 0.81 0.05 0.71 –0.11 1.00 –0.11
29 4.07 0.62 3.76 0.64 –0.11 0.83 0.10 0.76 –0.21 1.03 –0.20 30 4.20 0.57 3.91 0.59 –0.07 0.82 0.71 –0.13 0.98 –0.14 31 4.24 0.56 3.95 0.60 –0.09 0.81 0.10 0.70 –0.18 0.97 –0.19 32 4.18 0.51 3.93 0.53 –0.07 0.78 0.08 0.67 –0.15 0.92 –0.16 33 4.21 0.54 3.96 0.56 –0.09 0.80 0.10 0.68 –0.20 0.94 –0.21 34 4.24 0.55 3.96 0.59 –0.10 0.82 0.10 0.70 –0.20 0.98 –0.21 35 4.20 0.58 3.92 0.64 –0.09 0.78 0.09 0.71 –0.18 0.98 –0.18 36 4.16 0.54 3.90 0.56 –0.08 0.80 0.09 0.70 –0.17 0.95 –0.18 37 4.18 0.56 3.92 0.57 –0.09 0.80 0.10 0.70 –0.18 0.96 –0.19 38 4.24 0.58 3.97 0.60 –0.08 0.80 0.09 0.71 –0.17 0.98 –0.18 39 4.20 0.54 3.93 0.57 –0.10 0.80 0.11 0.70 –0.20 0.95 –0.21 40 4.23 0.55 3.93 0.60 –0.11 0.81 0.12 0.72 –0.23 0.98 –0.24 41 4.08 0.57 3.81 0.61 –0.09 0.82 0.08 0.72 –0.17 0.99 –0.17 42 4.17 0.61 3.87 0.65 –0.08 0.79 0.09 0.72 –0.17 1.00 –0.17 43 4.16 0.56 3.87 0.60 –0.08 0.80 0.08 0.71 –0.17 0.97 –0.17 44 4.09 0.57 3.81 0.59 –0.09 0.83 0.11 0.72 –0.20 0.99 –0.20 45 4.06 0.58 3.81 0.59 –0.08 0.80 0.09 0.70 –0.17 0.97 –0.17 46 4.22 0.57 3.93 0.61 –0.11 0.82 0.11 0.73 –0.22 1.00 –0.22 47 4.20 0.58 3.91 0.60 –0.10 0.82 0.10 0.72 –0.20 0.99 –0.20 48 4.14 0.56 3.85 0.59 –0.07 0.80 0.08 0.70 –0.15 0.97 –0.15 49 4.22 0.57 3.92 0.60 –0.09 0.77 0.09 0.71 –0.18 0.97 –0.19 50 4.20 0.56 3.92 0.59 –0.09 0.80 0.09 0.70 –0.16 0.97 –0.17 51 4.20 0.60 3.90 0.63 –0.11 0.80 0.13 0.75 –0.21 1.01 –0.21 52 4.21 0.57 3.92 0.60 –0.09 0.80 0.09 0.69 –0.18 0.97 –0.19
0.06
(Table continues)
30
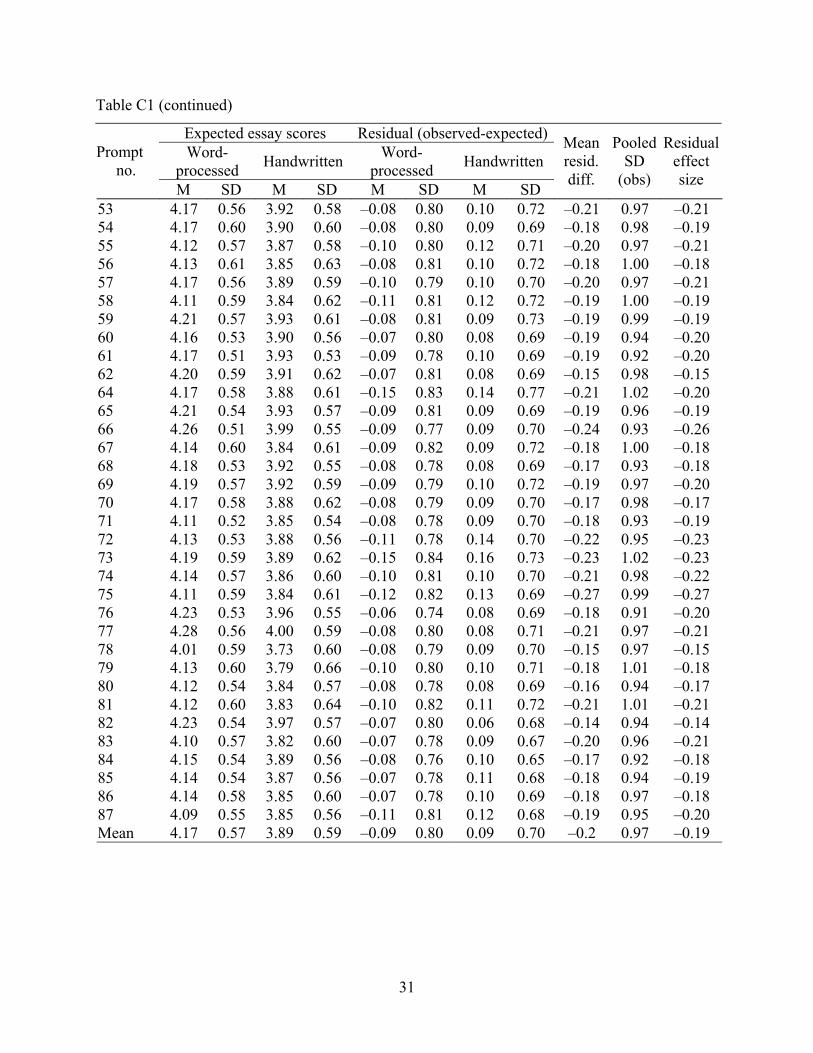
Table C1 (continued)
Expected essay scores Residual (observed-expected)Word-
processed Handwritten Word-processed Handwritten Prompt
no. M SD M SD M SD M SD
Mean resid. diff.
PooledSD
(obs)
Residualeffect size
53 4.17 0.56 3.92 0.58 –0.08 0.80 0.10 0.72 –0.21 0.97 –0.21 54 4.17 0.60 3.90 0.60 –0.08 0.80 0.09 0.69 –0.18 0.98 –0.19 55 4.12 0.57 3.87 0.58 –0.10 0.80 0.12 0.71 –0.20 0.97 –0.21 56 4.13 0.61 3.85 0.63 –0.08 0.81 0.10 0.72 –0.18 1.00 –0.18 57 4.17 0.56 3.89 0.59 –0.10 0.79 0.10 0.70 –0.20 0.97 –0.21 58 4.11 0.59 3.84 0.62 –0.11 0.81 0.12 0.72 –0.19 1.00 –0.19 59 4.21 0.57 3.93 0.61 –0.08 0.81 0.09 0.73 –0.19 0.99 –0.19 60 4.16 0.53 3.90 0.56 –0.07 0.80 0.08 0.69 –0.19 0.94 –0.20 61 4.17 0.51 3.93 0.53 –0.09 0.78 0.10 0.69 –0.19 0.92 –0.20 62 4.20 0.59 3.91 0.62 –0.07 0.81 0.08 0.69 –0.15 0.98 –0.15 64 4.17 0.58 3.88 0.61 –0.15 0.83 0.14 0.77 –0.21 1.02 –0.20 65 4.21 0.54 3.93 0.57 –0.09 0.81 0.09 0.69 –0.19 0.96 –0.19 66 4.26 0.51 3.99 0.55 –0.09 0.77 0.09 0.70 –0.24 0.93 –0.26 67 4.14 0.60 3.84 0.61 –0.09 0.82 0.09 0.72 –0.18 1.00 –0.18 68 4.18 0.53 3.92 0.55 –0.08 0.78 0.08 0.69 –0.17 0.93 –0.18 69 4.19 0.57 3.92 0.59 –0.09 0.79 0.10 0.72 –0.19 0.97 –0.20 70 4.17 0.58 3.88 0.62 –0.08 0.79 0.09 0.70 –0.17 0.98 –0.17 71 4.11 0.52 3.85 0.54 –0.08 0.78 0.09 0.70 –0.18 0.93 –0.19 72 4.13 0.53 3.88 0.56 –0.11 0.78 0.14 0.70 –0.22 0.95 –0.23 73 4.19 0.59 3.89 0.62 –0.15 0.84 0.16 0.73 –0.23 1.02 –0.23 74 4.14 0.57 3.86 0.60 –0.10 0.81 0.10 0.70 –0.21 0.98 –0.22 75 4.11 0.59 3.84 0.61 –0.12 0.82 0.13 0.69 –0.27 0.99 –0.27 76 4.23 0.53 3.96 0.55 –0.06 0.74 0.08 0.69 –0.18 0.91 –0.20 77 4.28 0.56 4.00 0.59 –0.08 0.80 0.08 0.71 –0.21 0.97 –0.21 78 4.01 0.59 3.73 0.60 –0.08 0.79 0.09 0.70 –0.15 0.97 –0.15 79 4.13 0.60 3.79 0.66 –0.10 0.80 0.10 0.71 –0.18 1.01 –0.18 80 4.12 0.54 3.84 0.57 –0.08 0.78 0.08 0.69 –0.16 0.94 –0.17 81 4.12 0.60 3.83 0.64 –0.10 0.82 0.11 0.72 –0.21 1.01 –0.21 82 4.23 0.54 3.97 0.57 –0.07 0.80 0.06 0.68 –0.14 0.94 –0.14 83 4.10 0.57 3.82 0.60 –0.07 0.78 0.09 0.67 –0.20 0.96 –0.21 84 4.15 0.54 3.89 0.56 –0.08 0.76 0.10 0.65 –0.17 0.92 –0.18 85 4.14 0.54 3.87 0.56 –0.07 0.78 0.11 0.68 –0.18 0.94 –0.19 86 4.14 0.58 3.85 0.60 –0.07 0.78 0.10 0.69 –0.18 0.97 –0.18 87 4.09 0.55 3.85 0.56 –0.11 0.81 0.12 0.68 –0.19 0.95 –0.20 Mean 4.17 0.57 3.89 0.59 –0.09 0.80 0.09 0.70 –0.2 0.97 –0.19
31

Appendix D
Uniform and Nonuniform Effect Sizes
Tables D1 and D2 show uniform and nonuniform effect sizes based on R2 Values for
English Language Ability, response mode group, and English language ability by response–
mode–group interaction terms from the full (Step 3) logistic regression model.
()](exp[1
1),|(3210 mmi
j xDDxDxUP
ββββ +++−+= )
Table D1
Uniform, Nonuniform, and Total R2 Effect Sizes for 83 Prompts
R2 changes χ2 test for added terms R2 values R2 effect size Ability
(A)* Group (G)*
A*G* Prompt no.
Ability Group A*G Uni Non Total χ2 χ2 χ2 1 0.3640 0.3676 0.3738 0.0036 0.0062 0.0098 2,034.79 33.44 55.32 3 0.3796 0.3888 0.3939 0.0092 0.0051 0.0143 3,093.42 125.25 68.65 4 0.4205 0.4322 0.4376 0.0117 0.0054 0.0171 3,272.28 162.90 75.06 5 0.3680 0.3774 0.3825 0.0094 0.0051 0.0145 3,524.12 147.44 78.41 6 0.3940 0.4029 0.4060 0.0089 0.0031 0.0120 2,945.72 114.18 39.20 7 0.3839 0.3857 0.3909 0.0018 0.0052 0.0070 3,018.84 24.55 67.21 8 0.3405 0.3536 0.3606 0.0131 0.0070 0.0201 1,549.42 92.55 49.17 9 0.3715 0.3905 0.3947 0.0190 0.0042 0.0232 1,475.10 122.88 27.40 10 0.3805 0.3910 0.3952 0.0105 0.0042 0.0147 2,670.46 122.73 49.34 11 0.3848 0.3907 0.3946 0.0059 0.0039 0.0098 3,013.79 77.16 50.49 12 0.3576 0.3685 0.3754 0.0109 0.0069 0.0178 1,899.02 94.45 58.91 13 0.3715 0.3783 0.3853 0.0680 0.0070 0.0138 2,225.63 67.29 68.34 14 0.3969 0.4043 0.4111 0.0074 0.0068 0.0142 2,426.20 78.47 70.74 15 0.3603 0.3688 0.3746 0.0085 0.0058 0.0143 3,650.96 137.99 94.08 18 0.4164 0.4223 0.4304 0.0059 0.0081 0.0140 1,927.13 48.87 65.66 19 0.3593 0.3627 0.3701 0.0034 0.0074 0.0108 2,110.03 32.18 68.06 21 0.3951 0.4050 0.4113 0.0099 0.0063 0.0162 2,877.81 122.99 78.28 22 0.4542 0.4579 0.4635 0.0037 0.0056 0.0093 2,850.71 43.94 65.17 23 0.3576 0.3666 0.3720 0.0090 0.0054 0.0144 2,925.66 116.40 68.64
(Table continues)
32

Table D1 (continued)
R2 changes χ2 test for added terms
R2 values R2 effect size Ability (A)*
Group (G)*
A*G* Prompt no.
Ability Group A*G Uni Non Total χ2 χ2 χ2 24 0.3622 0.3682 0.3756 0.0060 0.0074 0.0134 2,715.21 73.26 89.81 25 0.3628 0.3694 0.3744 0.0066 0.0050 0.0116 2,615.96 76.32 57.40 26 0.4324 0.4344 0.4421 0.0020 0.0077 0.0097 2,453.73 20.41 78.34 27 0.3507 0.3599 0.3655 0.0092 0.0056 0.0148 2,809.85 119.23 71.07 28 0.3950 0.3976 0.4024 0.0026 0.0048 0.0074 2,091.68 23.69 41.99 29 0.3937 0.4050 0.4097 0.0113 0.0047 0.0160 1,816.96 87.52 35.70 30 0.3692 0.3736 0.3804 0.0044 0.0068 0.0112 2,633.02 51.73 76.71 31 0.3680 0.3768 0.3837 0.0088 0.0069 0.0157 2,477.88 97.29 75.70 32 0.3352 0.3423 0.3460 0.0071 0.0037 0.0108 2,083.30 68.36 34.57 33 0.3502 0.3618 0.3668 0.0116 0.0050 0.0166 3,443.61 180.74 77.23 34 0.3585 0.3692 0.3731 0.0107 0.0039 0.0146 3,063.50 147.42 52.68 35 0.3938 0.4027 0.4058 0.0089 0.0031 0.0120 2,951.49 114.37 38.08 36 0.3448 0.3534 0.3635 0.0086 0.0101 0.0187 1,950.38 75.79 87.93 37 0.3609 0.3703 0.3762 0.0094 0.0059 0.0153 2,420.95 102.45 62.90 38 0.3794 0.3871 0.3934 0.0077 0.0063 0.0140 3,528.59 119.73 97.81 39 0.3518 0.3645 0.3686 0.0127 0.0041 0.0168 2,233.06 129.25 40.31 40 0.3617 0.3782 0.3871 0.0165 0.0089 0.0254 2,567.67 188.04 101.35 41 0.3677 0.3765 0.3816 0.0088 0.0051 0.0139 3,130.55 123.87 71.05 42 0.4036 0.4113 0.4177 0.0077 0.0064 0.0141 3,200.38 104.19 85.73 43 0.3693 0.3775 0.3819 0.0082 0.0044 0.0126 2,812.70 102.94 53.80 44 0.3497 0.3593 0.3664 0.0096 0.0071 0.0167 3,215.71 140.13 102.00 45 0.3725 0.3805 0.3868 0.008 0.0063 0.0143 2,760.46 97.53 75.06 46 0.3666 0.3798 0.3874 0.0132 0.0076 0.0208 3,361.33 196.50 112.97 47 0.3674 0.3776 0.3827 0.0102 0.0051 0.0153 4,230.69 190.65 94.85 48 0.3691 0.3747 0.3821 0.0056 0.0074 0.0130 2,062.92 50.75 66.15 49 0.3843 0.3939 0.3998 0.0096 0.0059 0.0155 4,123.45 171.46 104.32 50 0.3681 0.3784 0.3816 0.0103 0.0032 0.0135 3,734.68 168.90 52.88 51 0.3880 0.4029 0.4095 0.0149 0.0066 0.0215 2,975.01 190.68 84.10 52 0.3800 0.3901 0.3948 0.0101 0.0047 0.0148 3,066.95 134.37 62.07 53 0.3547 0.3637 0.3717 0.0090 0.0080 0.0170 2,287.13 92.37 81.24 54 0.3853 0.3930 0.4011 0.0077 0.0081 0.0158 2,422.76 81.37 83.90 55 0.3584 0.3718 0.3779 0.0134 0.0061 0.0195 2,578.85 155.67 69.12 56 0.3884 0.3958 0.399 0.0074 0.0032 0.0106 2,666.46 86.62 36.03 57 0.3793 0.3913 0.3955 0.0120 0.0042 0.0162 3,419.51 179.63 62.62 58 0.3808 0.3946 0.3985 0.0138 0.0039 0.0177 3,214.49 194.31 54.08 59 0.3719 0.3796 0.3831 0.0077 0.0035 0.0112 3,882.87 130.40 59.88 60 0.3483 0.3545 0.3580 0.0062 0.0035 0.0097 2,128.36 60.67 33.73
(Table continues)
33

Table D1 (continued)
R2 changes χ2 test for added terms R2 values R2 effect size Ability
(A)* Group (G)*
A*G* Prompt no.
Ability Group A*G Uni Non Total χ2 χ2 χ2 61 0.3308 0.3429 0.3463 0.0121 0.0034 0.0155 2,896.47 163.52 46.05 62 0.3879 0.3932 0.399 0.0053 0.0058 0.0111 2,126.67 48.93 52.67 63 0.3755 0.3861 0.3917 0.0106 0.0056 0.0162 2,918.29 137.28 71.76 64 0.3563 0.3794 0.3855 0.0231 0.0061 0.0292 2,370.29 239.60 63.98 65 0.3553 0.3656 0.3716 0.0103 0.006 0.0163 3,050.68 140.48 80.43 66 0.3459 0.3552 0.3614 0.0093 0.0062 0.0155 2,915.43 123.75 80.34 67 0.3758 0.3854 0.3919 0.0096 0.0065 0.0161 3,173.33 133.02 88.01 68 0.3420 0.3507 0.3572 0.0087 0.0065 0.0152 2,394.46 95.41 69.45 69 0.3739 0.3834 0.3892 0.0095 0.0058 0.0153 2,960.36 124.30 75.02 70 0.3841 0.3920 0.3969 0.0079 0.0049 0.0128 3,042.33 105.94 63.63 71 0.3403 0.3500 0.3572 0.0097 0.0072 0.0169 2,696.47 120.33 87.92 72 0.3460 0.3651 0.3714 0.0191 0.0063 0.0254 3,709.32 323.35 106.68 73 0.3715 0.3950 0.3998 0.0235 0.0048 0.0283 2,745.76 280.82 57.65 74 0.3724 0.3841 0.3892 0.0117 0.0051 0.0168 2,674.89 136.65 59.79 75 0.3829 0.4002 0.4046 0.0173 0.0044 0.0217 3,135.76 234.79 59.99 76 0.3610 0.3673 0.3738 0.0063 0.0065 0.0128 2,215.82 62.27 63.26 77 0.3683 0.3759 0.3827 0.0076 0.0068 0.0144 2,876.25 96.91 84.34 78 0.3827 0.3899 0.3986 0.0072 0.0087 0.0159 2,382.98 74.74 88.85 79 0.4170 0.4273 0.4339 0.0103 0.0066 0.0169 2,706.68 118.07 76.61 80 0.3598 0.3682 0.3720 0.0084 0.0038 0.0122 1,825.88 69.10 30.75 81 0.3914 0.4035 0.4081 0.0121 0.0046 0.0167 2,603.78 138.15 52.14 82 0.3640 0.3688 0.3790 0.0048 0.0102 0.015 2,793.72 58.38 123.57 83 0.3814 0.3902 0.4010 0.0088 0.0108 0.0196 1,878.70 73.22 88.04 84 0.3715 0.3799 0.3891 0.0084 0.0092 0.0176 1,734.58 64.03 70.95 85 0.3564 0.3661 0.3708 0.0097 0.0047 0.0144 1,966.85 86.66 40.66 86 0.3909 0.3985 0.4036 0.0076 0.0051 0.0127 1,983.93 66.15 43.72 87 0.3482 0.3629 0.3690 0.0147 0.0061 0.0208 3,446.19 231.91 96.18
*p < .0001.
34

Table D2
Intercept and Slope Parameters for the Logistic Regression for 83 Prompts
Prompt Intercepts Slopes no. β01 β02 β03 β04 β05 β06 β07 β08 β09 β10 β1 (A) β2 (G) β3 (A*G) 1 –6.21 –5.42 –3.93 –3.00 –1.50 –0.54 0.85 1.83 2.88 3.95 –0.71 –0.25 0.14 3 –5.63 –4.68 –3.46 –2.41 –1.12 –0.05 1.19 2.18 3.08 4.36 –0.72 –0.43 0.12 4 –6.13 –5.17 –3.72 –2.57 –1.06 0.03 1.38 2.44 3.38 4.56 –0.80 –0.53 0.14 5 –6.02 –5.09 –3.67 –2.60 –1.17 –0.07 1.29 2.32 3.25 4.45 –0.73 –0.45 0.13 6 –5.93 –4.83 –3.47 –2.44 –1.04 0.02 1.27 2.29 3.20 4.33 –0.70 –0.44 0.10 7 –6.70 –5.59 –4.27 –3.22 –1.79 –0.69 0.70 1.71 2.71 3.89 –0.72 –0.16 0.13 8 –6.57 –5.20 –3.80 –2.87 –1.39 –0.29 1.18 2.21 3.27 4.38 –0.73 –0.52 0.15 9 –5.92 –5.18 –3.45 –2.39 –1.00 0.09 1.40 2.46 3.37 4.56 –0.74 –0.67 0.12 10 –5.56 –4.53 –3.33 –2.22 –0.86 0.26 1.49 2.46 3.41 4.61 –0.72 –0.47 0.12 11 –5.83 –4.79 –3.64 –2.64 –1.28 –0.18 1.18 2.21 3.20 4.41 –0.70 –0.34 0.11 12 –5.90 –5.16 –3.73 –2.75 –1.07 –0.04 1.36 2.38 3.43 4.55 –0.74 –0.46 0.15 13 –6.40 –5.56 –4.18 –3.27 –1.74 –0.62 0.99 1.99 3.13 4.28 –0.73 –0.35 0.15 14 –5.74 –4.84 –3.80 –2.73 –1.30 –0.20 1.23 2.23 3.23 4.33 –0.77 –0.38 0.15 15 –5.67 –4.88 –3.52 –2.56 –1.09 –0.04 1.39 2.40 3.37 4.65 –0.72 –0.41 0.13 18 –5.93 –5.20 –3.86 –2.74 –1.16 –0.15 1.21 2.12 3.19 4.23 –0.81 –0.34 0.17 19 –5.87 –5.25 –4.14 –3.09 –1.61 –0.62 0.81 1.80 2.82 3.95 –0.72 –0.24 0.15 21 –6.16 –5.01 –3.68 –2.59 –1.10 –0.03 1.27 2.27 3.26 4.46 –0.77 –0.46 0.14 22 –5.81 –4.99 –3.82 –2.83 –1.36 –0.26 1.17 2.20 3.18 4.30 –0.81 –0.27 0.14 23 –5.87 –4.76 –3.39 –2.41 –1.03 0.07 1.45 2.42 3.39 4.64 –0.71 –0.44 0.13 24 –6.21 –5.17 –3.84 –2.83 –1.45 –0.38 0.99 1.96 2.93 4.08 –0.74 –0.32 0.15 25 –6.17 –5.28 –4.10 –2.96 –1.40 –0.30 1.07 2.12 3.10 4.29 –0.71 –0.36 0.12 26 –6.03 –5.21 –3.94 –2.96 –1.53 –0.56 0.86 1.89 2.90 4.09 –0.81 –0.18 0.16 27 –6.18 –5.20 –3.90 –2.95 –1.37 –0.28 1.21 2.24 3.23 4.38 –0.71 –0.44 0.13 28 –5.96 –4.90 –3.84 –2.75 –1.35 –0.25 0.99 2.05 2.97 4.17 –0.75 –0.24 0.13 29 –5.18 –4.20 –3.01 –1.95 –0.65 0.45 1.67 2.65 3.50 4.73 –0.75 –0.51 0.12 30 –5.98 –4.96 –3.66 –2.65 –1.25 –0.22 1.04 2.08 3.10 4.19 –0.74 –0.31 0.14
(Table continues)
35
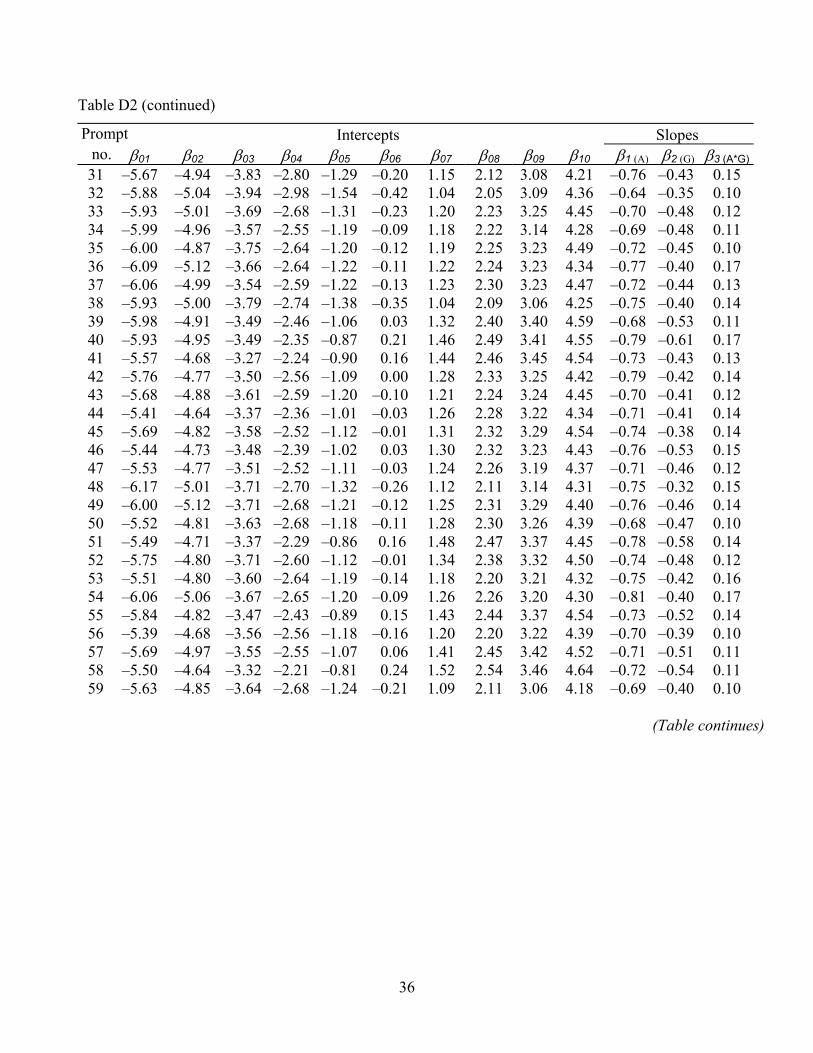
Table D2 (continued)
Prompt Intercepts Slopes no. β01 β02 β03 β04 β05 β06 β07 β08 β09 β10 β1 (A) β2 (G) β3 (A*G)31 –5.67 –4.94 –3.83 –2.80 –1.29 –0.20 1.15 2.12 3.08 4.21 –0.76 –0.43 0.15 32 –5.88 –5.04 –3.94 –2.98 –1.54 –0.42 1.04 2.05 3.09 4.36 –0.64 –0.35 0.10 33 –5.93 –5.01 –3.69 –2.68 –1.31 –0.23 1.20 2.23 3.25 4.45 –0.70 –0.48 0.12 34 –5.99 –4.96 –3.57 –2.55 –1.19 –0.09 1.18 2.22 3.14 4.28 –0.69 –0.48 0.11 35 –6.00 –4.87 –3.75 –2.64 –1.20 –0.12 1.19 2.25 3.23 4.49 –0.72 –0.45 0.10 36 –6.09 –5.12 –3.66 –2.64 –1.22 –0.11 1.22 2.24 3.23 4.34 –0.77 –0.40 0.17 37 –6.06 –4.99 –3.54 –2.59 –1.22 –0.13 1.23 2.30 3.23 4.47 –0.72 –0.44 0.13 38 –5.93 –5.00 –3.79 –2.74 –1.38 –0.35 1.04 2.09 3.06 4.25 –0.75 –0.40 0.14 39 –5.98 –4.91 –3.49 –2.46 –1.06 0.03 1.32 2.40 3.40 4.59 –0.68 –0.53 0.11 40 –5.93 –4.95 –3.49 –2.35 –0.87 0.21 1.46 2.49 3.41 4.55 –0.79 –0.61 0.17 41 –5.57 –4.68 –3.27 –2.24 –0.90 0.16 1.44 2.46 3.45 4.54 –0.73 –0.43 0.13 42 –5.76 –4.77 –3.50 –2.56 –1.09 0.00 1.28 2.33 3.25 4.42 –0.79 –0.42 0.14 43 –5.68 –4.88 –3.61 –2.59 –1.20 –0.10 1.21 2.24 3.24 4.45 –0.70 –0.41 0.12 44 –5.41 –4.64 –3.37 –2.36 –1.01 –0.03 1.26 2.28 3.22 4.34 –0.71 –0.41 0.14 45 –5.69 –4.82 –3.58 –2.52 –1.12 –0.01 1.31 2.32 3.29 4.54 –0.74 0.14 46 –5.44 –4.73 –3.48 –2.39 –1.02 0.03 1.30 2.32 3.23 4.43 –0.76 –0.53 0.15 47 –5.53 –4.77 –3.51 –2.52 –1.11 –0.03 1.24 2.26 3.19 4.37 –0.71 –0.46 0.12 48 –6.17 –5.01 –3.71 –2.70 –1.32 –0.26 1.12 2.11 3.14 4.31 –0.75 –0.32 0.15 49 –6.00 –5.12 –3.71 –2.68 –1.21 –0.12 1.25 2.31 3.29 4.40 –0.76 –0.46 0.14 50 –5.52 –4.81 –3.63 –2.68 –1.18 –0.11 1.28 2.30 3.26 4.39 –0.68 –0.47 0.10 51 –5.49 –4.71 –3.37 –2.29 –0.86 0.16 1.48 2.47 3.37 4.45 –0.78 –0.58 0.14 52 –5.75 –4.80 –3.71 –2.60 –1.12 –0.01 1.34 2.38 3.32 4.50 –0.74 –0.48 0.12 53 –5.51 –4.80 –3.60 –2.64 –1.19 –0.14 1.18 2.20 3.21 4.32 –0.75 –0.42 0.16 54 –6.06 –5.06 –3.67 –2.65 –1.20 –0.09 1.26 2.26 3.20 4.30 –0.81 –0.40 0.17 55 –5.84 –4.82 –3.47 –2.43 –0.89 0.15 1.43 2.44 3.37 4.54 –0.73 –0.52 0.14 56 –5.39 –4.68 –3.56 –2.56 –1.18 –0.16 1.20 2.20 3.22 4.39 –0.70 –0.39 0.10 57 –5.69 –4.97 –3.55 –2.55 –1.07 0.06 1.41 2.45 3.42 4.52 –0.71 –0.51 0.11 58 –5.50 –4.64 –3.32 –2.21 –0.81 0.24 1.52 2.54 3.46 4.64 –0.72 –0.54 0.11 59 –5.63 –4.85 –3.64 –2.68 –1.24 –0.21 1.09 2.11 3.06 4.18 –0.69 –0.40 0.10
–0.38
(Table continues)
36

Table D2 (continued)
Prompt Intercepts Slopes no. β01 β02 β03 β04 β05 β06 β07 β08 β09 β10 β1 (A) β2 (G) β3 (A*G)60 –5.91 –5.19 –3.82 –2.77 –1.41 –0.37 0.98 2.04 3.13 4.29 –0.66 –0.33 0.10 61 –5.79 –4.99 –3.59 –2.62 –1.20 –0.10 1.33 2.40 3.39 4.60 –0.64 –0.49 0.10 62 –5.92 –4.95 –3.77 –2.75 –1.45 –0.39 0.97 2.00 2.99 4.21 –0.74 –0.32 0.13 63 –5.93 –5.18 –3.73 –2.72 –1.21 –0.12 1.32 2.34 3.35 4.51 –0.74 –0.46 0.13 64 –5.07 –4.22 –2.96 –1.91 –0.55 0.56 1.70 2.71 3.60 4.75 –0.75 –0.71 0.14 65 –5.94 –5.00 –3.66 –2.59 –1.17 –0.06 1.23 2.30 3.26 4.39 –0.72 –0.47 0.13 66 –6.04 –5.23 –3.93 –2.93 –1.43 –0.31 1.11 2.11 3.20 4.40 –0.72 –0.44 0.14 67 –5.63 –4.69 –3.41 –2.29 –0.95 0.14 1.40 2.36 3.27 4.45 –0.76 –0.45 0.14 68 –5.82 –5.11 –3.77 –2.71 –1.22 –0.15 1.29 2.30 3.34 4.43 –0.72 –0.42 0.14 69 –6.10 –5.09 –3.64 –2.60 –1.20 –0.14 1.29 2.28 3.20 4.35 –0.73 –0.45 0.13 70 –5.84 –5.04 –3.65 –2.66 –1.18 –0.10 1.25 2.25 3.19 4.43 –0.74 –0.41 0.13 71 –5.63 –4.82 –3.70 –2.69 –1.25 –0.11 1.32 2.34 3.34 4.52 –0.71 –0.41 0.14 72 –5.69 –4.78 –3.43 –2.33 –0.82 0.28 1.64 2.68 3.64 4.79 –0.72 –0.63 0.14 73 –5.66 –4.66 –3.12 –2.02 –0.64 0.44 1.67 2.61 3.48 4.53 –0.73 –0.72 0.12 74 –5.44 –4.76 –3.42 –2.40 –0.98 0.12 1.48 2.48 3.43 4.50 –0.74 –0.50 0.13 75 –5.46 –4.56 –3.30 –2.26 –0.78 0.33 1.62 2.68 3.58 4.68 –0.74 –0.61 0.12 76 –6.77 –5.88 –4.30 –3.25 –1.62 –0.53 1.02 2.03 3.09 4.13 –0.72 –0.34 0.14 77 –6.13 –5.27 –3.88 –2.82 –1.40 –0.30 1.01 2.03 3.01 4.15 –0.74 –0.41 0.14 78 –5.62 –4.83 –3.45 –2.43 –1.05 0.08 1.43 2.46 3.46 4.68 –0.79 –0.35 0.17 79 –5.76 –4.55 –3.25 –2.20 –0.85 0.29 1.58 2.65 3.60 4.79 –0.82 –0.50 0.15 80 –5.62 –4.84 –3.59 –2.69 –1.17 –0.08 1.34 2.35 3.43 4.61 –0.69 –0.41 0.11 81 –5.48 –4.45 –3.11 –2.13 –0.81 0.31 1.55 2.59 3.54 4.74 –0.76 –0.53 0.12 82 –6.08 –5.37 –4.12 –3.04 –1.58 –0.44 0.98 1.99 2.98 4.13 –0.78 –0.30 0.17 83 –6.04 –5.18 –3.69 –2.66 –1.12 –0.07 1.35 2.43 3.37 4.52 –0.82 –0.40 0.19 84 –5.97 –5.20 –3.92 –2.85 –1.32 –0.27 1.27 2.31 3.45 4.69 –0.78 –0.40 0.17 85 –6.10 –5.13 –3.68 –2.85 –1.21 –0.22 1.27 2.24 3.26 4.43 –0.68 –0.43 0.12 86 –5.98 –5.14 –3.85 –2.76 –1.23 –0.20 1.19 2.21 3.26 4.41 –0.72 –0.39 0.13 87 –5.55 –4.77 –3.41 –2.37 –0.98 0.13 1.51 2.54 3.52 4.64 –0.72 –0.53 0.14
37
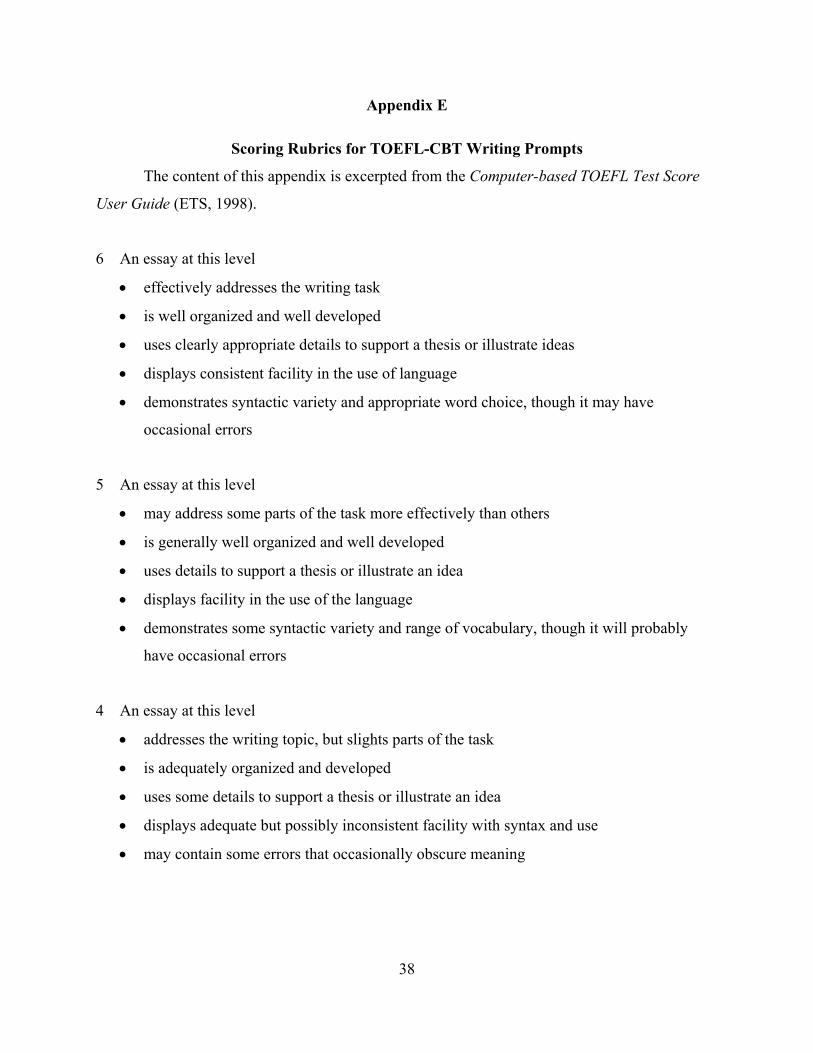
Appendix E
Scoring Rubrics for TOEFL-CBT Writing Prompts
The content of this appendix is excerpted from the Computer-based TOEFL Test Score
User Guide (ETS, 1998).
6 An essay at this level
• effectively addresses the writing task
• is well organized and well developed
• uses clearly appropriate details to support a thesis or illustrate ideas
• displays consistent facility in the use of language
• demonstrates syntactic variety and appropriate word choice, though it may have
occasional errors
5 An essay at this level
• may address some parts of the task more effectively than others
• is generally well organized and well developed
• uses details to support a thesis or illustrate an idea
• displays facility in the use of the language
• demonstrates some syntactic variety and range of vocabulary, though it will probably
have occasional errors
4 An essay at this level
• addresses the writing topic, but slights parts of the task
• is adequately organized and developed
• uses some details to support a thesis or illustrate an idea
• displays adequate but possibly inconsistent facility with syntax and use
• may contain some errors that occasionally obscure meaning
38

3 An essay at this level may reveal one or more of the following weaknesses
• inadequate organization or development
• inappropriate or insufficient details to support or illustrate generalizations
• a noticeably inappropriate choice of words or word forms
• an accumulation of errors in sentence structure and/or usage
2 An essay at this level is seriously flawed by one or more of the following weaknesses
• serious disorganization or underdevelopment
• little or no detail or irrelevant specifics
• serious and frequent errors in sentence structure or usage,
• serious problems with focus
1 An essay at this level may
• be incoherent
• be underdeveloped
• contain severe and persistent writing errors
0 An essay will be rated 0 if it
• contains no response
• merely copies the topic
• is off-topic
• is written in a foreign language
• consists only of keystroke characters
39

Test of English as a Foreign LanguagePO Box 6155
Princeton, NJ 08541-6155USA
To obtain more information about TOEFL programs and services, use one of the following:
Phone: 1-877-863-3546(US, US Territories*, and Canada)
(all other locations)
Email: [email protected]
Web site: www.ets.org/toefl
®
* America Samoa, Guam, Puerto Rico, and US Virgin Islands
1-609-771-7100
kfryer
I.N. 725613