Website Design and Development Company | Website Designing Company | Web Development Agency India
Upload
anteroresourcesCategory
view
139download
5
Company OverviewSeptember 2016
FORWARD-LOOKING STATEMENTS
This presentation contains forward-looking statements within the meaning of Section 27A of the Securities Act of 1933 and Section 21E of the Securities Exchange Act of 1934. All statements, other than statements of historical facts, included in this presentation that address activities, events or developments that Antero Resources Corporation and its subsidiaries (collectively, the “Company” or “Antero”) expects, believes or anticipates will or may occur in the future are forward-looking statements. The words “believe,” “expect,” “anticipate,” “plan,” “intend,” “estimate,” “project,” “foresee,” “should,” “would,” “could,” or other similar expressions are intended to identify forward-looking statements. However, the absence of these words does not mean that the statements are not forward-looking. Without limiting the generality of the foregoing, forward-looking statements contained in this presentation specifically include estimates of the Company’s reserves, expectations of plans, strategies, objectives and anticipated financial and operating results of the Company, including as to the Company’s drilling program, production, hedging activities, capital expenditure levels and other guidance included in this presentation. These statements are based on certain assumptions made by the Company based on management’s experience and perception of historical trends, current conditions, anticipated future developments and other factors believed to be appropriate. Such statements are subject to a number of assumptions, risks and uncertainties, many of which are beyond the control of the Company, which may cause actual results to differ materially from those implied or expressed by the forward-looking statements. These include the factors discussed or referenced under the heading “Item 1A. Risk Factors” in our Annual Report on Form 10-K for the year ended December 31, 2015 and in the Company’s subsequent filings with the SEC.
The Company cautions you that these forward-looking statements are subject to all of the risks and uncertainties, most of which are difficult to predict and many of which are beyond our control, incident to the exploration for and development, production, gathering and sale of natural gas and oil. These risks include, but are not limited to, commodity price volatility, inflation, lack of availability of drilling and production equipment and services, environmental risks, drilling and other operating risks, regulatory changes, the uncertainty inherent in estimating natural gas and oil reserves and in projecting future rates of production, cash flow and access to capital, the timing of development expenditures, and the other risks described under the heading “Risk Factors” in our Annual Report on Form 10-K for the year ended December 31, 2015 and in the Company’s subsequent filings with the SEC.
Any forward-looking statement speaks only as of the date on which such statement is made and the Company undertakes no obligation to correct or update any forward-looking statement, whether as a result of new information, future events or otherwise, except as required by applicable law.
1
Antero Resources Corporation is denoted as “AR” and Antero Midstream Partners LP is denoted as “AM” in the presentation, which are their respective New York Stock Exchange ticker symbols.
2
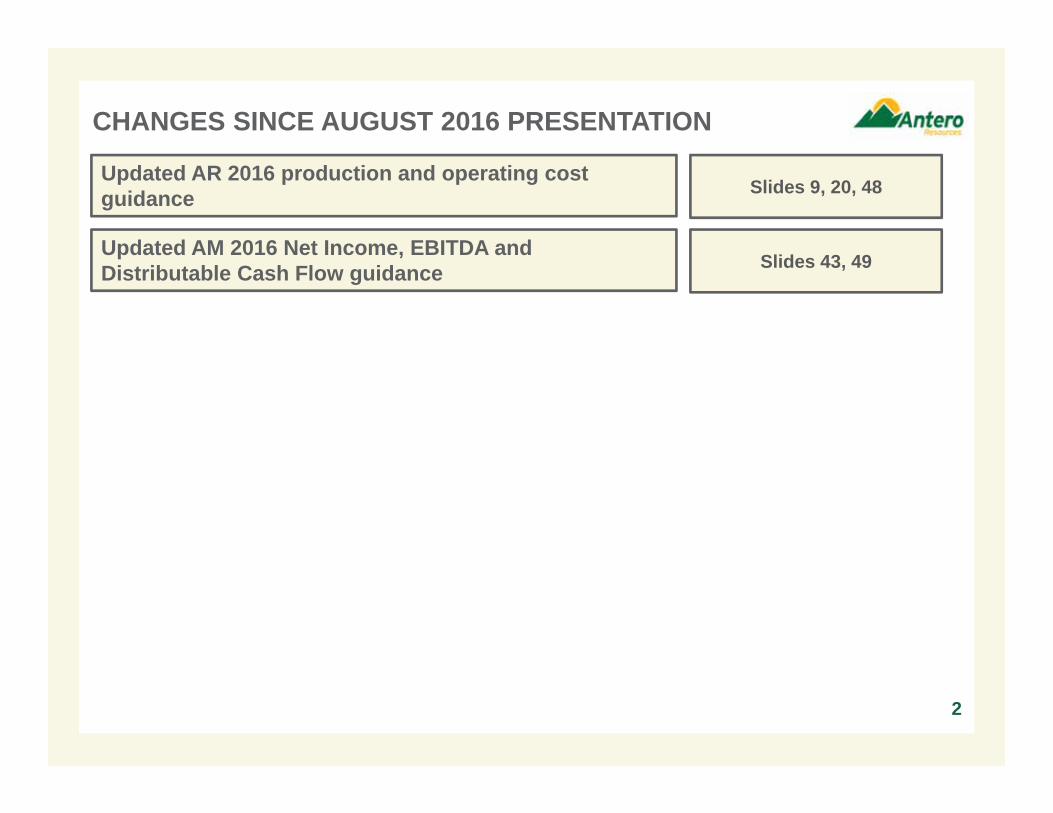
CHANGES SINCE AUGUST 2016 PRESENTATION
Updated AR 2016 production and operating cost guidance Slides 9, 20, 48
Updated AM 2016 Net Income, EBITDA and Distributable Cash Flow guidance Slides 43, 49
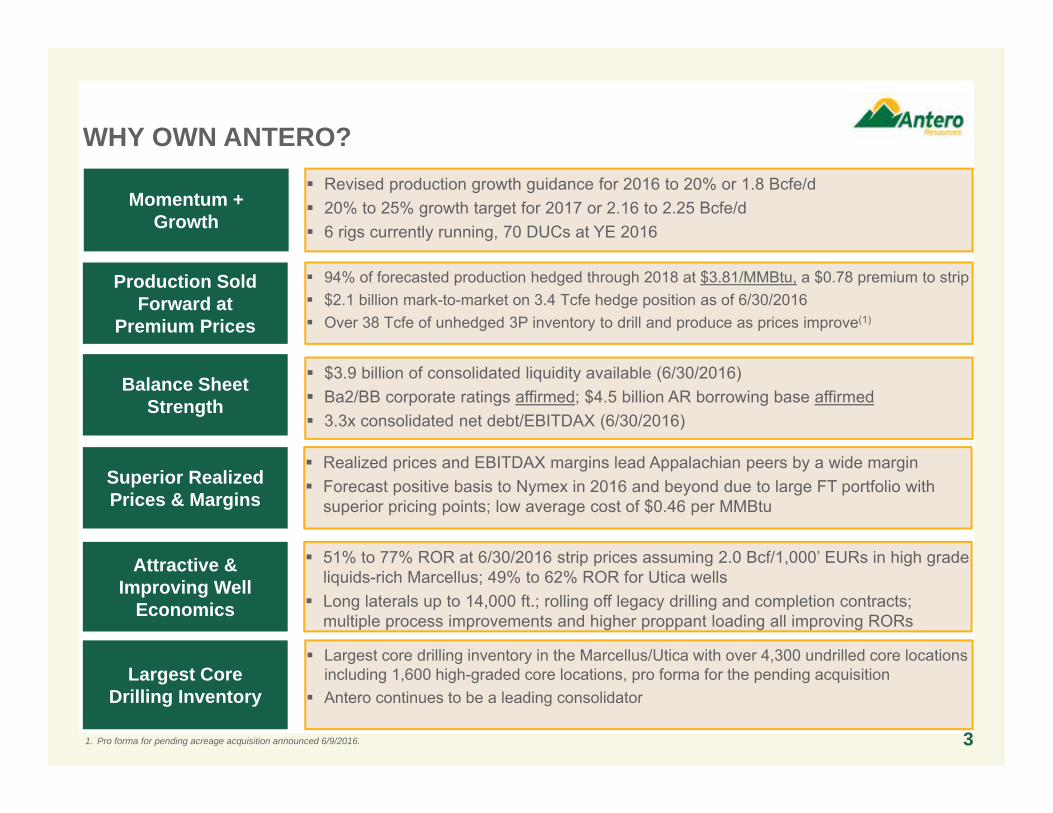
WHY OWN ANTERO?
$3.9 billion of consolidated liquidity available (6/30/2016) Ba2/BB corporate ratings affirmed; $4.5 billion AR borrowing base affirmed 3.3x consolidated net debt/EBITDAX (6/30/2016)
Balance Sheet Strength
Production Sold Forward at
Premium Prices
Momentum + Growth
Superior Realized Prices & Margins
Attractive & Improving Well
Economics
Largest Core Drilling Inventory
94% of forecasted production hedged through 2018 at $3.81/MMBtu, a $0.78 premium to strip $2.1 billion mark-to-market on 3.4 Tcfe hedge position as of 6/30/2016 Over 38 Tcfe of unhedged 3P inventory to drill and produce as prices improve(1)
Revised production growth guidance for 2016 to 20% or 1.8 Bcfe/d 20% to 25% growth target for 2017 or 2.16 to 2.25 Bcfe/d 6 rigs currently running, 70 DUCs at YE 2016
Realized prices and EBITDAX margins lead Appalachian peers by a wide margin Forecast positive basis to Nymex in 2016 and beyond due to large FT portfolio with
superior pricing points; low average cost of $0.46 per MMBtu
51% to 77% ROR at 6/30/2016 strip prices assuming 2.0 Bcf/1,000’ EURs in high grade liquids-rich Marcellus; 49% to 62% ROR for Utica wells
Long laterals up to 14,000 ft.; rolling off legacy drilling and completion contracts; multiple process improvements and higher proppant loading all improving RORs
Largest core drilling inventory in the Marcellus/Utica with over 4,300 undrilled core locations including 1,600 high-graded core locations, pro forma for the pending acquisition
Antero continues to be a leading consolidator
1. Pro forma for pending acreage acquisition announced 6/9/2016. 3
ACQUISITION OVERVIEW
4
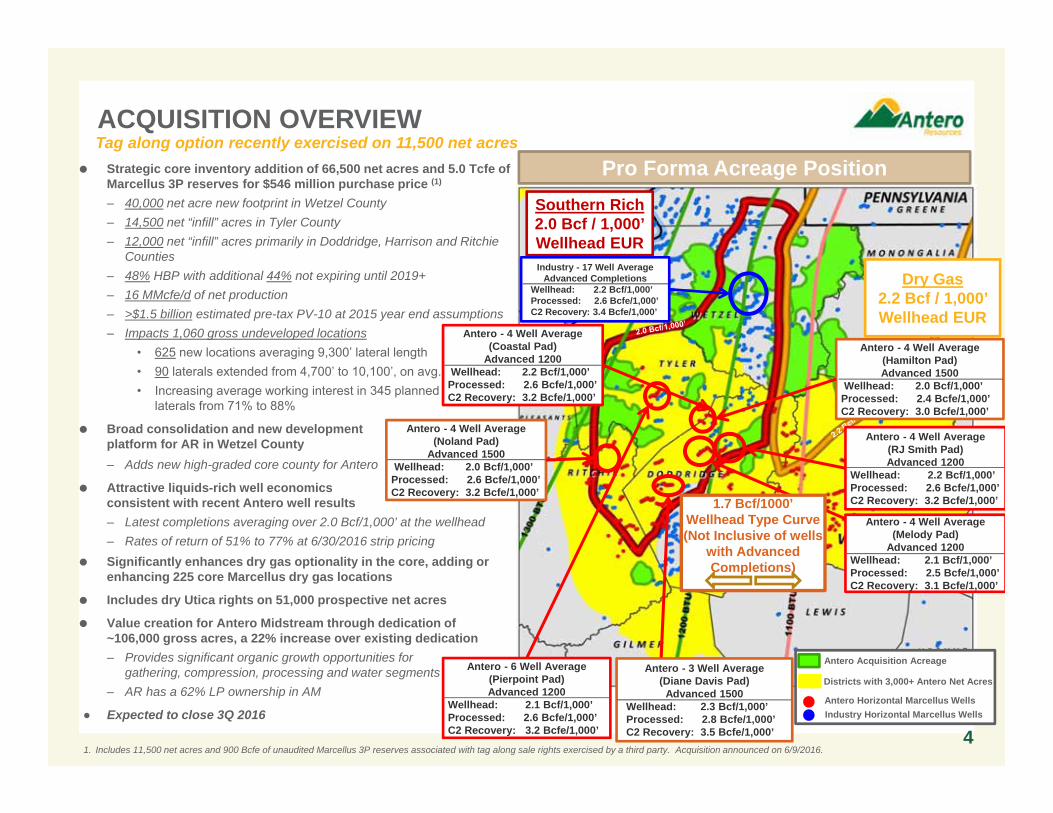
Strategic core inventory addition of 66,500 net acres and 5.0 Tcfe of Marcellus 3P reserves for $546 million purchase price (1)
– 40,000 net acre new footprint in Wetzel County– 14,500 net “infill” acres in Tyler County– 12,000 net “infill” acres primarily in Doddridge, Harrison and Ritchie
Counties– 48% HBP with additional 44% not expiring until 2019+– 16 MMcfe/d of net production– >$1.5 billion estimated pre-tax PV-10 at 2015 year end assumptions– Impacts 1,060 gross undeveloped locations
• 625 new locations averaging 9,300’ lateral length• 90 laterals extended from 4,700’ to 10,100’, on avg.• Increasing average working interest in 345 planned
laterals from 71% to 88%
Broad consolidation and new development platform for AR in Wetzel County– Adds new high-graded core county for Antero
Attractive liquids-rich well economics consistent with recent Antero well results– Latest completions averaging over 2.0 Bcf/1,000’ at the wellhead– Rates of return of 51% to 77% at 6/30/2016 strip pricing
Significantly enhances dry gas optionality in the core, adding or enhancing 225 core Marcellus dry gas locations
Includes dry Utica rights on 51,000 prospective net acres
Value creation for Antero Midstream through dedication of ~106,000 gross acres, a 22% increase over existing dedication– Provides significant organic growth opportunities for
gathering, compression, processing and water segments– AR has a 62% LP ownership in AM
● Expected to close 3Q 2016
1. Includes 11,500 net acres and 900 Bcfe of unaudited Marcellus 3P reserves associated with tag along sale rights exercised by a third party. Acquisition announced on 6/9/2016.
Pro Forma Acreage Position
Districts with 3,000+ Antero Net Acres
Antero Horizontal Marcellus WellsIndustry Horizontal Marcellus Wells
Antero Acquisition Acreage
1.7 Bcf/1000’ Wellhead Type Curve (Not Inclusive of wells
with Advanced Completions)
Dry Gas2.2 Bcf / 1,000’ Wellhead EUR
Southern Rich2.0 Bcf / 1,000’Wellhead EUR
Tag along option recently exercised on 11,500 net acres
Antero - 4 Well Average (RJ Smith Pad)Advanced 1200
Wellhead: 2.2 Bcf/1,000’Processed: 2.6 Bcfe/1,000’C2 Recovery: 3.2 Bcfe/1,000’
Antero - 4 Well Average (Melody Pad)
Advanced 1200Wellhead: 2.1 Bcf/1,000’Processed: 2.5 Bcfe/1,000’C2 Recovery: 3.1 Bcfe/1,000’
Antero - 3 Well Average (Diane Davis Pad)
Advanced 1500Wellhead: 2.3 Bcf/1,000’Processed: 2.8 Bcfe/1,000’C2 Recovery: 3.5 Bcfe/1,000’
Antero - 6 Well Average (Pierpoint Pad)Advanced 1200
Wellhead: 2.1 Bcf/1,000’Processed: 2.6 Bcfe/1,000’C2 Recovery: 3.2 Bcfe/1,000’
Industry - 17 Well AverageAdvanced Completions
Wellhead: 2.2 Bcf/1,000’Processed: 2.6 Bcfe/1,000’C2 Recovery: 3.4 Bcfe/1,000’
Antero - 4 Well Average (Noland Pad)
Advanced 1500 Wellhead: 2.0 Bcf/1,000’
Processed: 2.6 Bcfe/1,000’C2 Recovery: 3.2 Bcfe/1,000’
Antero - 4 Well Average (Hamilton Pad)Advanced 1500
Wellhead: 2.0 Bcf/1,000’Processed: 2.4 Bcfe/1,000’C2 Recovery: 3.0 Bcfe/1,000’
Antero - 4 Well Average (Coastal Pad)
Advanced 1200 Wellhead: 2.2 Bcf/1,000’
Processed: 2.6 Bcfe/1,000’C2 Recovery: 3.2 Bcfe/1,000’
Breakeven NYMEX Gas Price ($/MMBtu)(3): $2.02 $1.77 $1.57
Breakeven NYMEX Gas Price ($/MMBtu)(3): $1.22 $0.95 $0.76
$8.2 $11.1
$13.9
38%51%
66%
0%
20%
40%
60%
80%
100%
$0.0$2.0$4.0$6.0$8.0
$10.0$12.0$14.0$16.0
1.7 Bcf/1,000'2.1 Bcfe/1,000'
2.0 Bcf/1,000'2.5 Bcfe/1,000'
2.3 Bcf/1,000'2.8 Bcfe/1,000'
Pre-Tax PV-10 Pre-Tax ROR
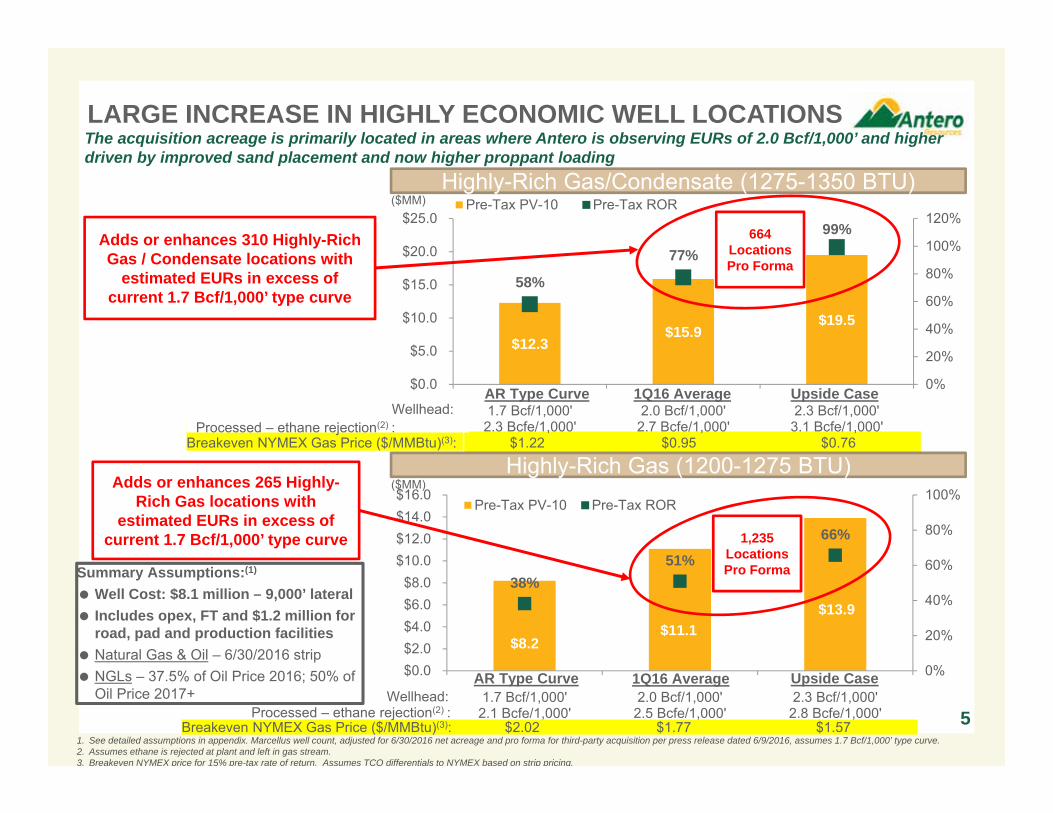
The acquisition acreage is primarily located in areas where Antero is observing EURs of 2.0 Bcf/1,000’ and higher driven by improved sand placement and now higher proppant loading
51. See detailed assumptions in appendix. Marcellus well count, adjusted for 6/30/2016 net acreage and pro forma for third-party acquisition per press release dated 6/9/2016, assumes 1.7 Bcf/1,000’ type curve. 2. Assumes ethane is rejected at plant and left in gas stream. 3. Breakeven NYMEX price for 15% pre-tax rate of return. Assumes TCO differentials to NYMEX based on strip pricing.
LARGE INCREASE IN HIGHLY ECONOMIC WELL LOCATIONS
$12.3 $15.9
$19.5
58%
77%
99%
0%
20%
40%
60%
80%
100%
120%
$0.0
$5.0
$10.0
$15.0
$20.0
$25.0
1.7 Bcf/1,000'2.3 Bcfe/1,000'
2.0 Bcf/1,000'2.7 Bcfe/1,000'
2.3 Bcf/1,000'3.1 Bcfe/1,000'
Pre-Tax PV-10 Pre-Tax RORHighly-Rich Gas/Condensate (1275-1350 BTU)
Summary Assumptions:(1)
Well Cost: $8.1 million – 9,000’ lateral Includes opex, FT and $1.2 million for
road, pad and production facilities Natural Gas & Oil – 6/30/2016 strip NGLs – 37.5% of Oil Price 2016; 50% of
Oil Price 2017+
Adds or enhances 310 Highly-Rich Gas / Condensate locations with
estimated EURs in excess of current 1.7 Bcf/1,000’ type curve
Adds or enhances 265 Highly-Rich Gas locations with
estimated EURs in excess of current 1.7 Bcf/1,000’ type curve
Wellhead:Processed – ethane rejection(2) :
Wellhead:AR Type Curve
AR Type Curve
664 Locations Pro Forma
1,235 Locations Pro Forma
1Q16 Average Upside Case
Upside Case
($MM)
($MM)Highly-Rich Gas (1200-1275 BTU)
1Q16 Average
Processed – ethane rejection(2) :
INCREASES MARCELLUS HIGH-GRADEDDRY GAS INVENTORY
6
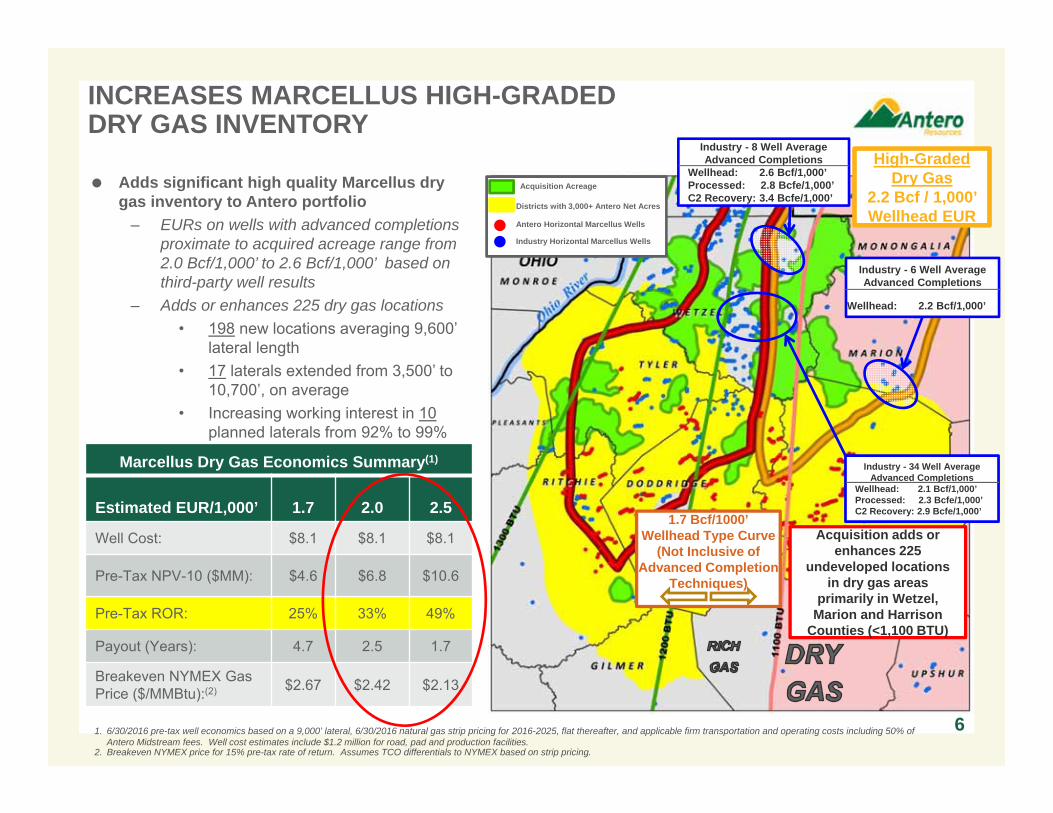
Adds significant high quality Marcellus dry gas inventory to Antero portfolio
– EURs on wells with advanced completions proximate to acquired acreage range from 2.0 Bcf/1,000’ to 2.6 Bcf/1,000’ based on third-party well results
– Adds or enhances 225 dry gas locations• 198 new locations averaging 9,600’
lateral length• 17 laterals extended from 3,500’ to
10,700’, on average• Increasing working interest in 10
planned laterals from 92% to 99%
Districts with 3,000+ Antero Net Acres
Antero Horizontal Marcellus Wells
Industry Horizontal Marcellus Wells
Acquisition Acreage
Marcellus Dry Gas Economics Summary(1)
Estimated EUR/1,000’ 1.7 2.0 2.5
Well Cost: $8.1 $8.1 $8.1
Pre-Tax NPV-10 ($MM): $4.6 $6.8 $10.6
Pre-Tax ROR: 25% 33% 49%
Payout (Years): 4.7 2.5 1.7
Breakeven NYMEX GasPrice ($/MMBtu):(2) $2.67 $2.42 $2.13
Acquisition adds or enhances 225
undeveloped locations in dry gas areas
primarily in Wetzel, Marion and Harrison
Counties (<1,100 BTU)
1. 6/30/2016 pre-tax well economics based on a 9,000’ lateral, 6/30/2016 natural gas strip pricing for 2016-2025, flat thereafter, and applicable firm transportation and operating costs including 50% of Antero Midstream fees. Well cost estimates include $1.2 million for road, pad and production facilities.
2. Breakeven NYMEX price for 15% pre-tax rate of return. Assumes TCO differentials to NYMEX based on strip pricing.
Industry - 8 Well AverageAdvanced Completions
Wellhead: 2.6 Bcf/1,000’Processed: 2.8 Bcfe/1,000’C2 Recovery: 3.4 Bcfe/1,000’
Industry - 34 Well AverageAdvanced Completions
Wellhead: 2.1 Bcf/1,000’Processed: 2.3 Bcfe/1,000’C2 Recovery: 2.9 Bcfe/1,000’
High-Graded Dry Gas
2.2 Bcf / 1,000’ Wellhead EUR
1.7 Bcf/1000’ Wellhead Type Curve
(Not Inclusive of Advanced Completion
Techniques)
Industry - 6 Well AverageAdvanced Completions
Wellhead: 2.2 Bcf/1,000’
-
500,000
1,000,000
1,500,000
2,000,000
2,500,000
3,000,000
3,500,000
4,000,000
ACQUISITION DRIVES FIRM TRANSPORT UTILIZATION
7
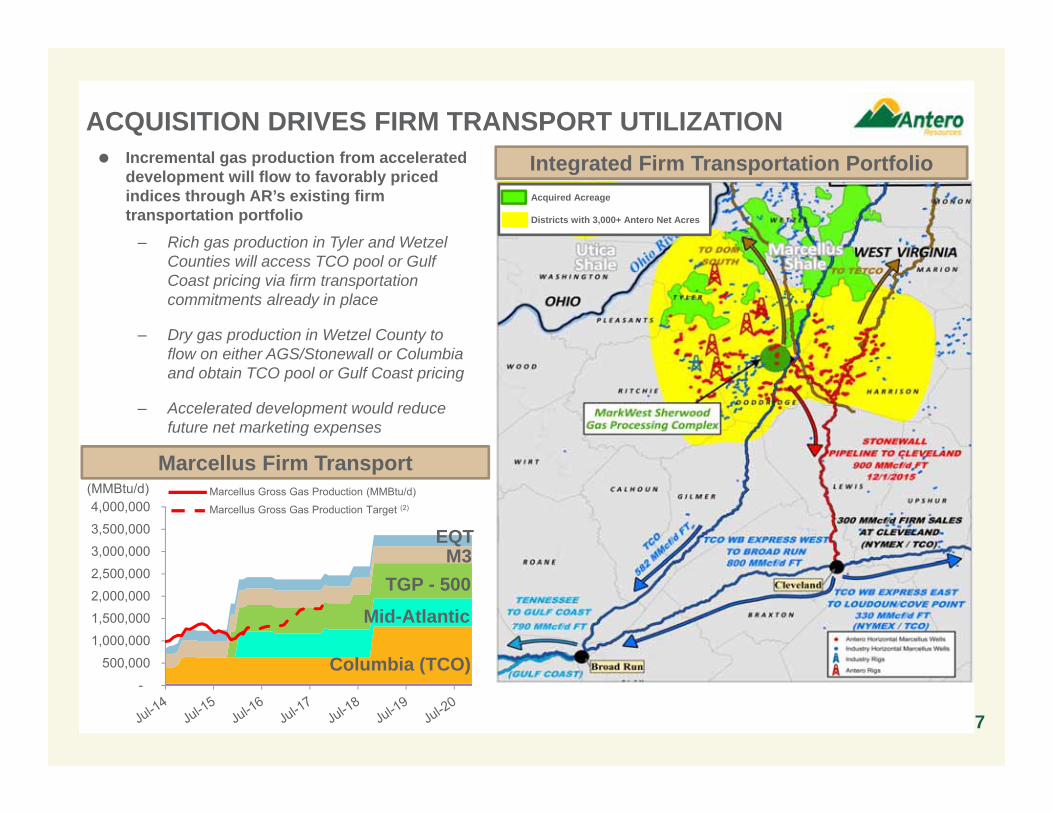
Integrated Firm Transportation Portfolio Incremental gas production from accelerated development will flow to favorably priced indices through AR’s existing firm transportation portfolio
– Rich gas production in Tyler and Wetzel Counties will access TCO pool or Gulf Coast pricing via firm transportation commitments already in place
– Dry gas production in Wetzel County to flow on either AGS/Stonewall or Columbia and obtain TCO pool or Gulf Coast pricing
– Accelerated development would reduce future net marketing expenses
Districts with 3,000+ Antero Net Acres
Acquired Acreage
Marcellus Firm Transport
TGP - 500Mid-Atlantic
Columbia (TCO)
M3EQT
(MMBtu/d) Marcellus Gross Gas Production (MMBtu/d)
Marcellus Gross Gas Production Target (2)
491
638597
744
0100200300400500600700800900
1,000
Dedicated Acreage:Gathering & Compression
Dedicated Acreage:Water Services
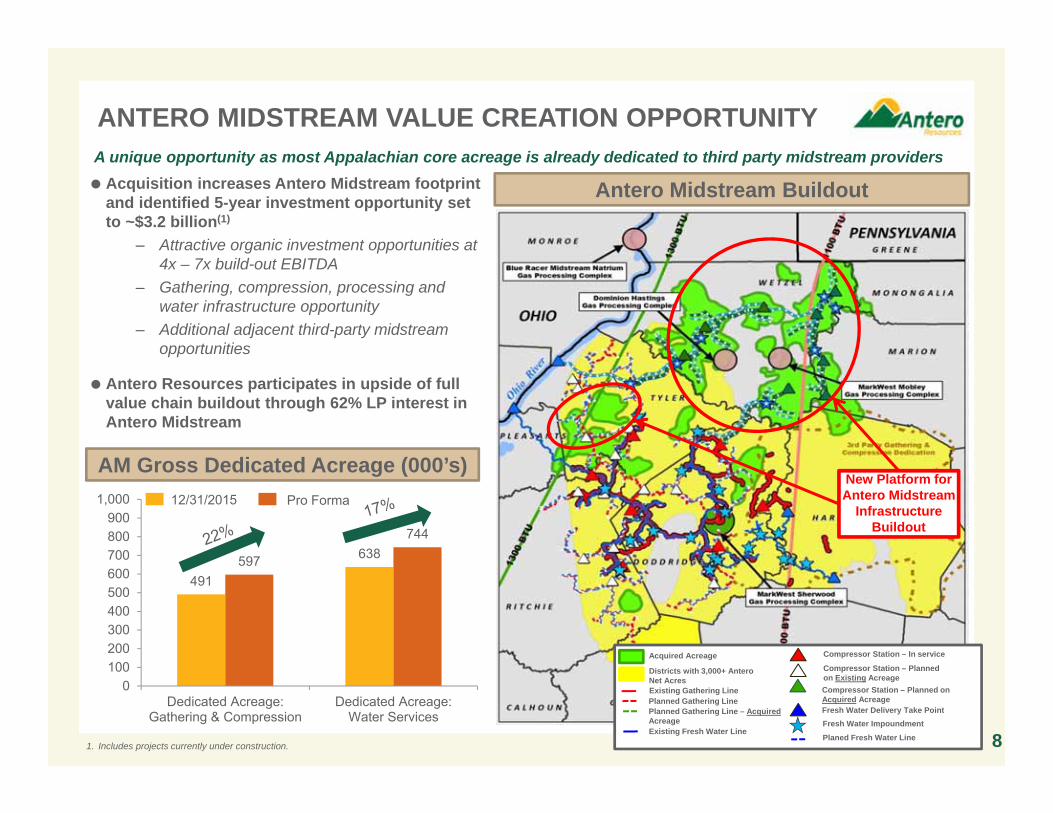
ANTERO MIDSTREAM VALUE CREATION OPPORTUNITY
8
Acquisition increases Antero Midstream footprint and identified 5-year investment opportunity set to ~$3.2 billion(1)
– Attractive organic investment opportunities at 4x – 7x build-out EBITDA
– Gathering, compression, processing and water infrastructure opportunity
– Additional adjacent third-party midstream opportunities
Antero Resources participates in upside of full value chain buildout through 62% LP interest in Antero Midstream
Antero Midstream Buildout
Compressor Station – In service
Districts with 3,000+ Antero Net Acres
Acquired AcreageCompressor Station – Planned on Existing Acreage
Existing Gathering Line
New Platform for Antero Midstream
Infrastructure Buildout
Fresh Water Delivery Take PointPlanned Gathering Line
1. Includes projects currently under construction.
AM Gross Dedicated Acreage (000’s)
A unique opportunity as most Appalachian core acreage is already dedicated to third party midstream providers
12/31/2015 Pro Forma
Fresh Water ImpoundmentExisting Fresh Water Line
Planed Fresh Water Line
Planned Gathering Line – Acquired Acreage
Compressor Station – Planned on Acquired Acreage
13,31615,770
21,225
27,473
36,00639,725
45,072
49,140
63,32869,797
73,000
0
10,000
20,000
30,000
40,000
50,000
60,000
70,000
80,000
90,000
100,000
1Q14 2Q14 3Q14 4Q14 1Q15 2Q15 3Q15 4Q15 1Q16 2Q16 2016Guidance
2017Target
Natural Gasoline (C5+) IsoButane (iC4)Normal Butane (nC4) Propane (C3)Ethane (C2)
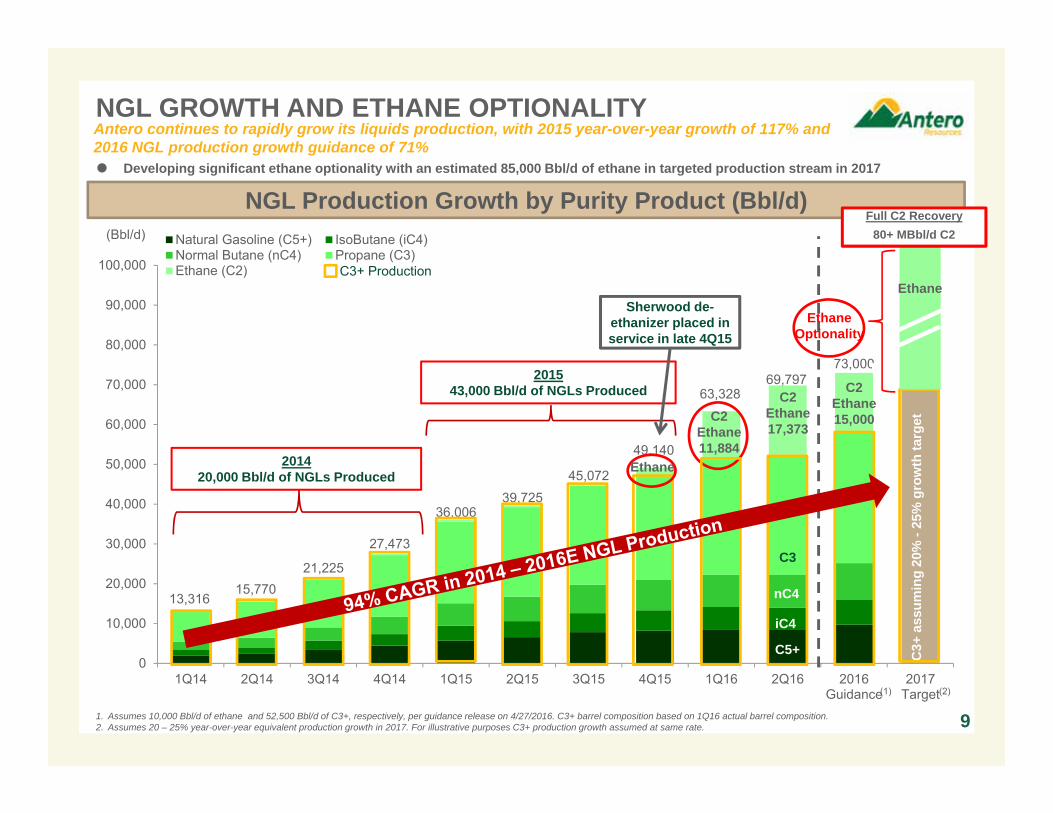
NGL GROWTH AND ETHANE OPTIONALITY
NGL Production Growth by Purity Product (Bbl/d)
C3+
ass
umin
g 20
% -
25%
gro
wth
targ
et
1. Assumes 10,000 Bbl/d of ethane and 52,500 Bbl/d of C3+, respectively, per guidance release on 4/27/2016. C3+ barrel composition based on 1Q16 actual barrel composition.2. Assumes 20 – 25% year-over-year equivalent production growth in 2017. For illustrative purposes C3+ production growth assumed at same rate.
(1)
Sherwood de-ethanizer placed in service in late 4Q15
C3+ Production
(2)
201420,000 Bbl/d of NGLs Produced
201543,000 Bbl/d of NGLs Produced
Antero continues to rapidly grow its liquids production, with 2015 year-over-year growth of 117% and 2016 NGL production growth guidance of 71% Developing significant ethane optionality with an estimated 85,000 Bbl/d of ethane in targeted production stream in 2017
C2Ethane11,884
C2Ethane15,000
Ethane
Ethane Optionality
Full C2 Recovery80+ MBbl/d C2
Ethane
9
(Bbl/d)
C2Ethane17,373
C5+
iC4
nC4
C3
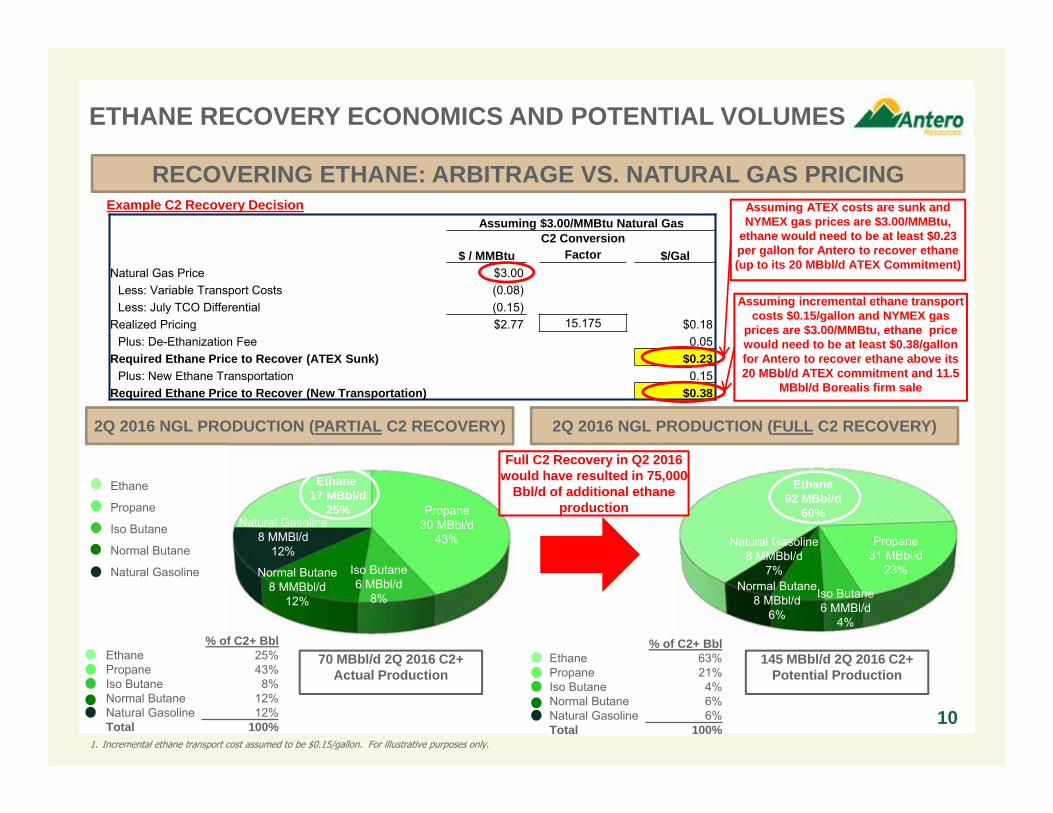
Assuming $3.00/MMBtu Natural GasC2 Conversion
$ / MMBtu Factor $/GalNatural Gas Price $3.00 $0.20
Less: Variable Transport Costs (0.08) (0.01)Less: July TCO Differential (0.15) (0.01)
Realized Pricing $2.77 15.175 $0.18 Plus: De-Ethanization Fee 0.05
Required Ethane Price to Recover (ATEX Sunk) $0.23 Plus: New Ethane Transportation 0.15
Required Ethane Price to Recover (New Transportation) $0.38
ETHANE RECOVERY ECONOMICS AND POTENTIAL VOLUMES
RECOVERING ETHANE: ARBITRAGE VS. NATURAL GAS PRICING
10
2Q 2016 NGL PRODUCTION (PARTIAL C2 RECOVERY)
% of C2+ BblEthane 63%Propane 21%Iso Butane 4%Normal Butane 6%Natural Gasoline 6%Total 100%
Ethane
Propane
Iso Butane
Normal Butane
Natural Gasoline
Propane30 MBbl/d
43%
Iso Butane6 MBbl/d
8%
Normal Butane8 MMBbl/d
12%
Natural Gasoline8 MMBl/d
12%
Ethane 17 MBbl/d
25%
% of C2+ BblEthane 25%Propane 43%Iso Butane 8%Normal Butane 12%Natural Gasoline 12%Total 100%
2Q 2016 NGL PRODUCTION (FULL C2 RECOVERY)
Full C2 Recovery in Q2 2016 would have resulted in 75,000
Bbl/d of additional ethane production
70 MBbl/d 2Q 2016 C2+ Actual Production
145 MBbl/d 2Q 2016 C2+ Potential Production
Propane31 MBbl/d
23%Normal Butane
8 MBbl/d6%
Natural Gasoline8 MMBbl/d
7%
Iso Butane6 MMBl/d
4%
Ethane92 MBbl/d
60%
Assuming ATEX costs are sunk and NYMEX gas prices are $3.00/MMBtu,
ethane would need to be at least $0.23 per gallon for Antero to recover ethane (up to its 20 MBbl/d ATEX Commitment)
Example C2 Recovery Decision
Assuming incremental ethane transport costs $0.15/gallon and NYMEX gas
prices are $3.00/MMBtu, ethane price would need to be at least $0.38/gallon for Antero to recover ethane above its 20 MBbl/d ATEX commitment and 11.5
MBbl/d Borealis firm sale
1. Incremental ethane transport cost assumed to be $0.15/gallon. For illustrative purposes only.
$0.10
$0.20
$0.30
$0.40
$0.50
$0.60
$0.70
$0.80
2016 2017 2018 2019 2020 2021
Ethane Futures (ICE)Bentek Ethane ForecastRequired Ethane Price - New Ethane TransportationRequired Ethane Price - ATEX Sunk Costs
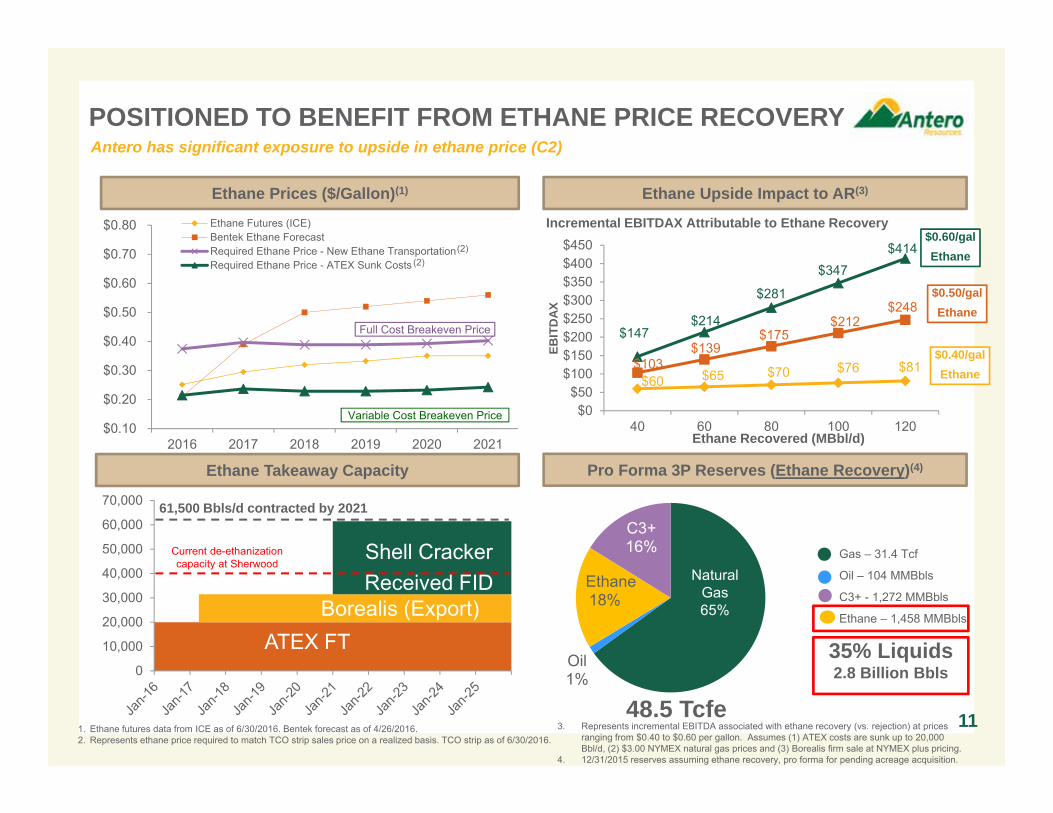
POSITIONED TO BENEFIT FROM ETHANE PRICE RECOVERY
Ethane Takeaway Capacity Pro Forma 3P Reserves (Ethane Recovery)(4)
Ethane Prices ($/Gallon)(1)
Oil 1%
18%
C3+16%
Ethane Natural Gas65%
Gas – 31.4 Tcf
Oil – 104 MMBbls
C3+ - 1,272 MMBbls
Ethane – 1,458 MMBbls
35% Liquids2.8 Billion Bbls0
10,000
20,000
30,000
40,000
50,000
60,000
70,000
1. Ethane futures data from ICE as of 6/30/2016. Bentek forecast as of 4/26/2016.2. Represents ethane price required to match TCO strip sales price on a realized basis. TCO strip as of 6/30/2016.
ATEX FTBorealis (Export)
Shell CrackerReceived FID
Antero has significant exposure to upside in ethane price (C2)
Current de-ethanizationcapacity at Sherwood
48.5 Tcfe
(2)
Ethane Upside Impact to AR(3)
ATEX FTBorealis (Export)
Shell CrackerReceived FID
Ethane Recovered (MBbl/d)
$0.60/galEthane
$0.50/galEthane
$0.40/galEthane
Incremental EBITDAX Attributable to Ethane Recovery
EBIT
DAX
$60 $65 $70 $76 $81$103$139
$175$212
$248
$147$214
$281
$347$414
$0$50
$100$150$200$250$300$350$400$450
40 60 80 100 120
3. Represents incremental EBITDA associated with ethane recovery (vs. rejection) at prices ranging from $0.40 to $0.60 per gallon. Assumes (1) ATEX costs are sunk up to 20,000 Bbl/d, (2) $3.00 NYMEX natural gas prices and (3) Borealis firm sale at NYMEX plus pricing.
4. 12/31/2015 reserves assuming ethane recovery, pro forma for pending acreage acquisition.
61,500 Bbls/d contracted by 2021
(2)
Full Cost Breakeven Price
Variable Cost Breakeven Price
11
$0.10
$0.20
$0.30
$0.40
$0.50
$0.60
01/04/16 03/04/16 05/03/16 07/02/16 08/31/16
$/G
al
MB Propane Production (MBbl/d)Pricing 30 35 40 45 50$0.85 $394 $456 $521 $586 $652$0.75 $348 $402 $460 $517 $575$0.65 $301 $349 $399 $448 $498$0.55 $255 $295 $337 $379 $422$0.45 $209 $241 $276 $310 $345
$16.69 $21.93 $24.89
$0.00
$10.00
$20.00
$30.00
$40.00
$50.00
$60.00
2016E 1Q'17E(Excluding
Mariner East 2)
2Q - 4Q'17E(Including
Mariner East 2)
Realized C3+NGL PriceWTI
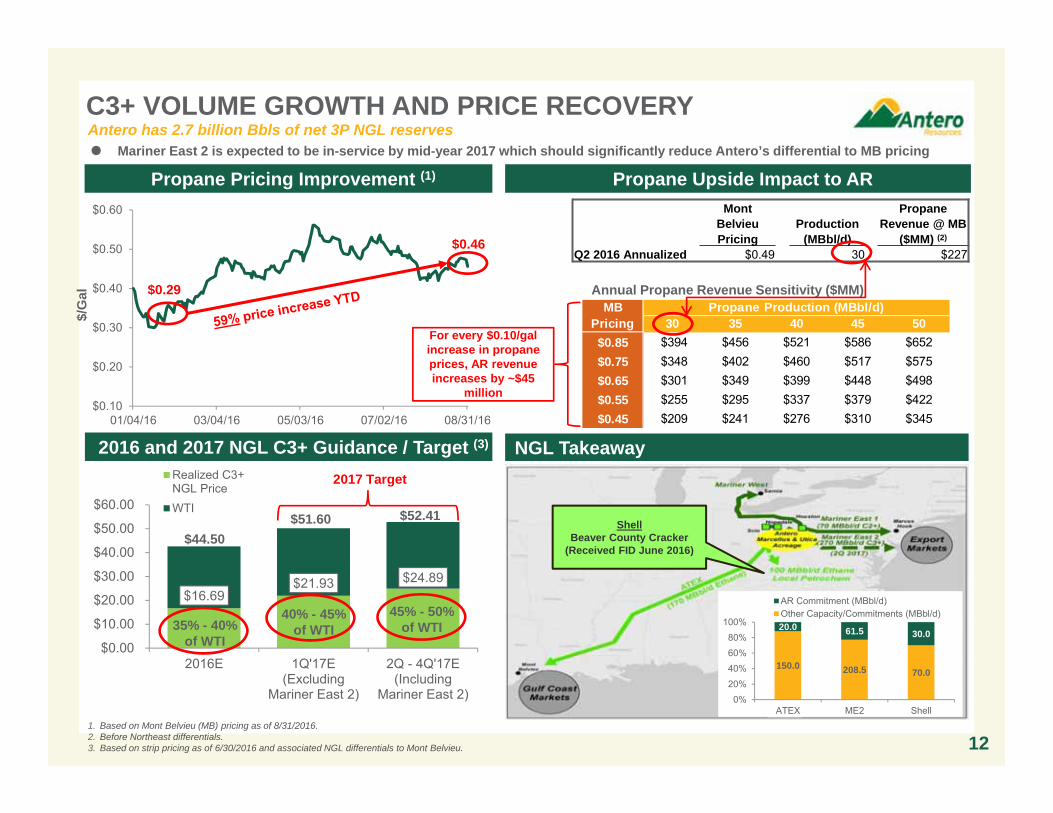
121. Based on Mont Belvieu (MB) pricing as of 8/31/2016. 2. Before Northeast differentials.3. Based on strip pricing as of 6/30/2016 and associated NGL differentials to Mont Belvieu.
NGL Takeaway
Propane Upside Impact to AR
ShellBeaver County Cracker
(Received FID June 2016)
Propane Pricing Improvement (1)
$0.29
$0.46
C3+ VOLUME GROWTH AND PRICE RECOVERY
Mont PropaneBelvieu Production Revenue @ MBPricing (MBbl/d) ($MM) (2)
Q2 2016 Annualized $0.49 30 $227
Annual Propane Revenue Sensitivity ($MM)
For every $0.10/gal increase in propane prices, AR revenue increases by ~$45
million
Antero has 2.7 billion Bbls of net 3P NGL reserves Mariner East 2 is expected to be in-service by mid-year 2017 which should significantly reduce Antero’s differential to MB pricing
150.0 208.5 70.0
20.0 61.5 30.0
0%20%
40%60%80%
100%
ATEX ME2 Shell
AR Commitment (MBbl/d)Other Capacity/Commitments (MBbl/d)
2016 and 2017 NGL C3+ Guidance / Target (3)
$44.50
35% - 40% of WTI
40% - 45% of WTI
45% - 50% of WTI
$51.60 $52.41
2017 Target
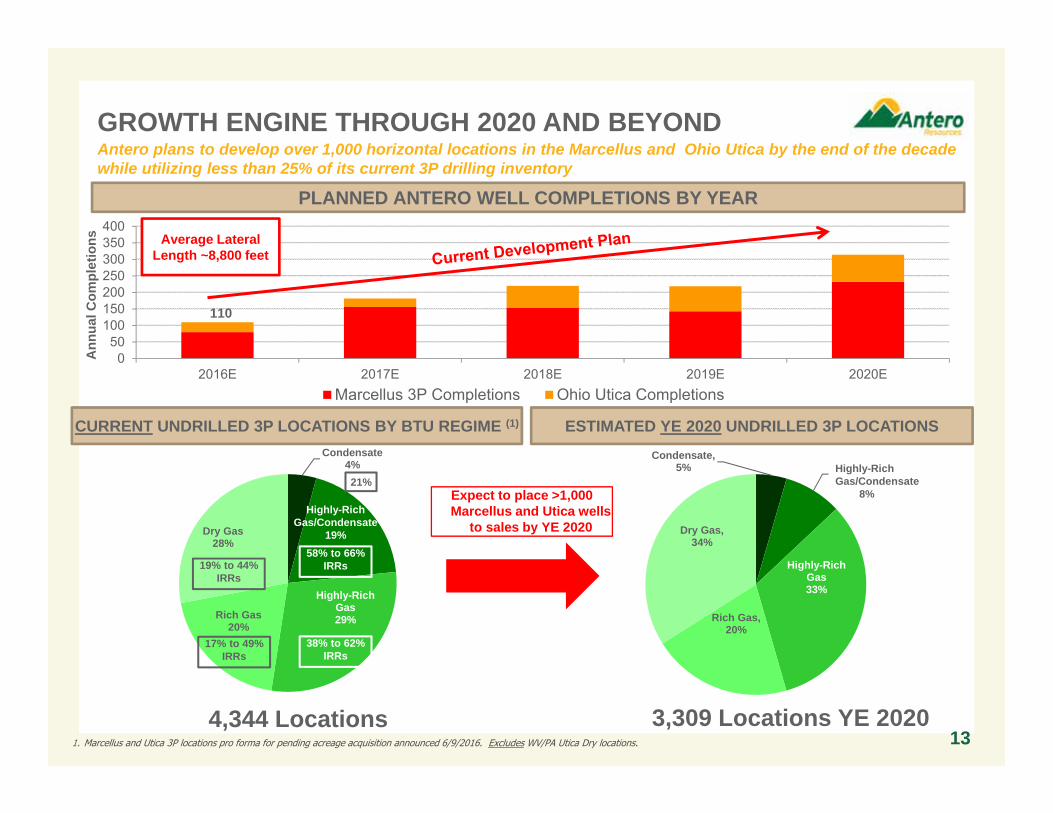
Condensate, 5%
Highly-Rich Gas/Condens
ate(8%)
Highly-Rich Gas33%
Rich Gas, 20%
Dry Gas, 34%
Highly-Rich Gas/Condensate
8%
110
050
100150200250300350400
2016E 2017E 2018E 2019E 2020E
Ann
ual C
ompl
etio
ns
Marcellus 3P Completions Ohio Utica Completions
GROWTH ENGINE THROUGH 2020 AND BEYONDAntero plans to develop over 1,000 horizontal locations in the Marcellus and Ohio Utica by the end of the decade while utilizing less than 25% of its current 3P drilling inventory
PLANNED ANTERO WELL COMPLETIONS BY YEAR
CURRENT UNDRILLED 3P LOCATIONS BY BTU REGIME (1) ESTIMATED YE 2020 UNDRILLED 3P LOCATIONS
4,344 Locations 3,309 Locations YE 2020
Expect to place >1,000 Marcellus and Utica wells
to sales by YE 2020
Condensate4%
Highly-Rich Gas29%Rich Gas
20%
Dry Gas28%
Highly-Rich Gas/Condensate
19%
1. Marcellus and Utica 3P locations pro forma for pending acreage acquisition announced 6/9/2016. Excludes WV/PA Utica Dry locations.
Average Lateral Length ~8,800 feet
13
38% to 62% IRRs
17% to 49% IRRs
58% to 66% IRRs 19% to 44%
IRRs
21%
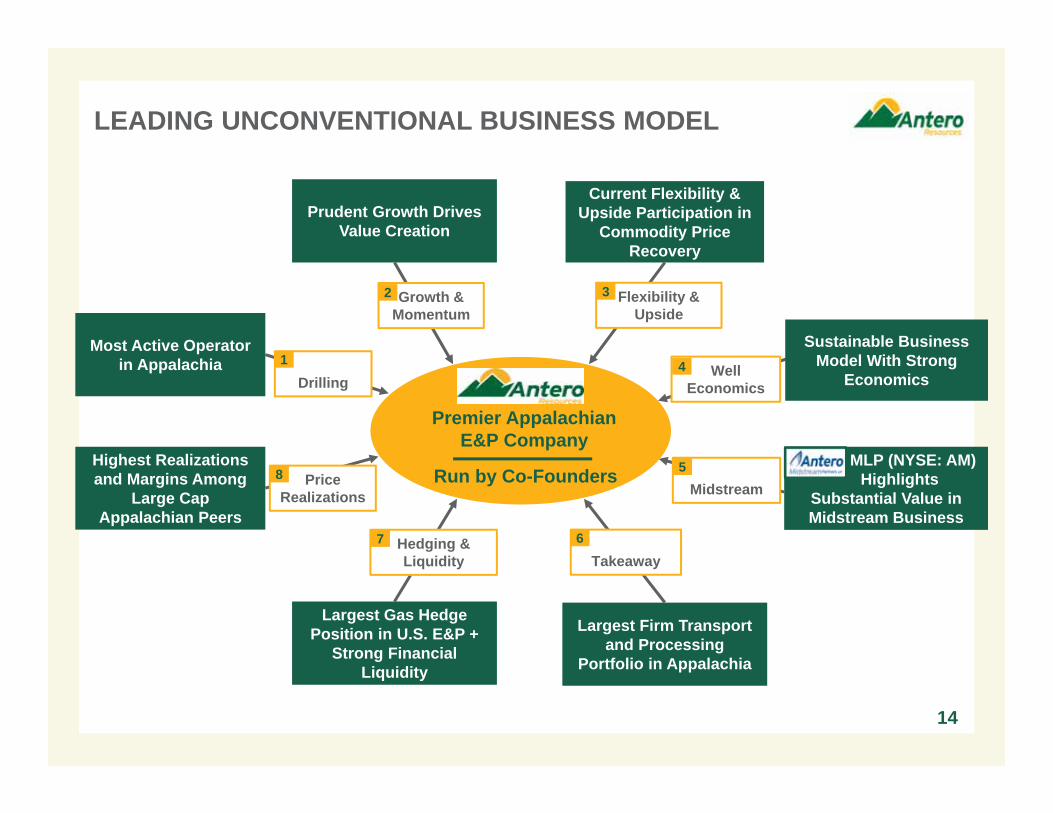
14
Most Active Operatorin Appalachia
Largest Firm Transport and Processing
Portfolio in Appalachia
Largest Gas Hedge Position in U.S. E&P +
Strong Financial Liquidity
Prudent Growth Drives Value Creation
Current Flexibility & Upside Participation in
Commodity Price Recovery
Highest Realizations and Margins Among
Large Cap Appalachian Peers
Growth & Momentum
Flexibility & Upside
Hedging &Liquidity
Midstream
Drilling
LEADING UNCONVENTIONAL BUSINESS MODEL
MLP (NYSE: AM)Highlights
Substantial Value in Midstream Business
PriceRealizations
Takeaway
Well Economics
1
2 3
4
5
67
8
Premier AppalachianE&P Company
Run by Co-Founders
Sustainable Business Model With Strong
Economics
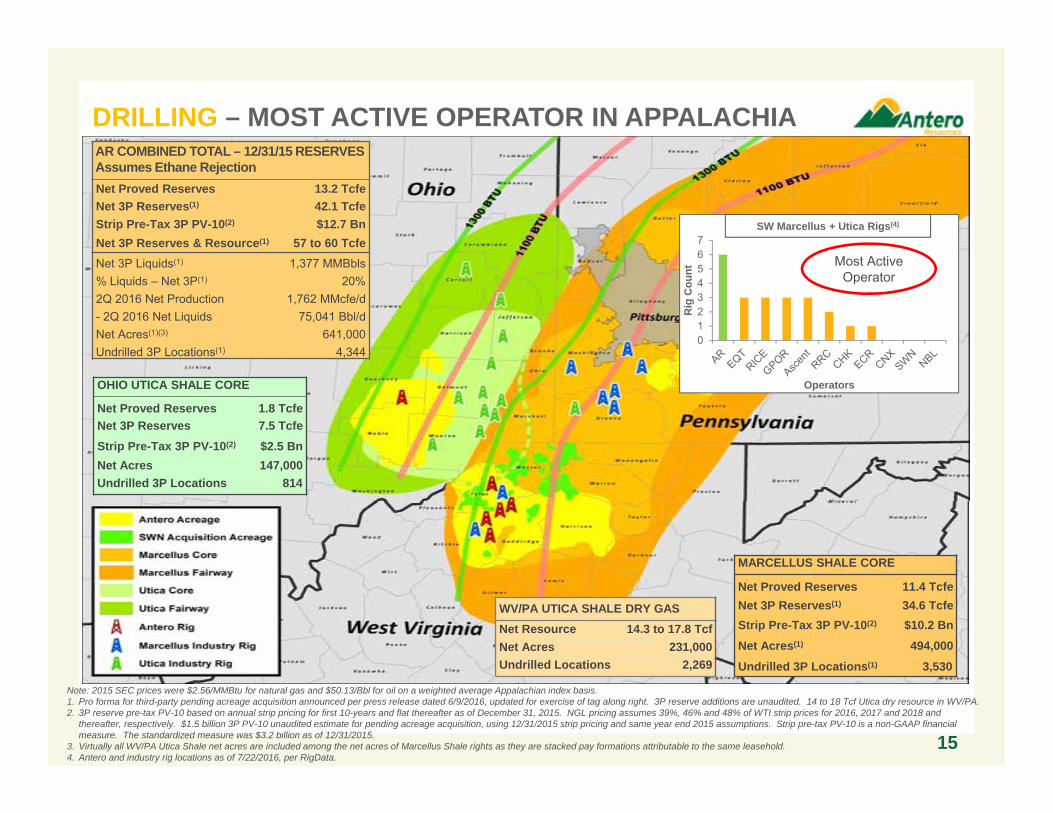
Note: 2015 SEC prices were $2.56/MMBtu for natural gas and $50.13/Bbl for oil on a weighted average Appalachian index basis. 1. Pro forma for third-party pending acreage acquisition announced per press release dated 6/9/2016, updated for exercise of tag along right. 3P reserve additions are unaudited. 14 to 18 Tcf Utica dry resource in WV/PA. 2. 3P reserve pre-tax PV-10 based on annual strip pricing for first 10-years and flat thereafter as of December 31, 2015. NGL pricing assumes 39%, 46% and 48% of WTI strip prices for 2016, 2017 and 2018 and
thereafter, respectively. $1.5 billion 3P PV-10 unaudited estimate for pending acreage acquisition, using 12/31/2015 strip pricing and same year end 2015 assumptions. Strip pre-tax PV-10 is a non-GAAP financial measure. The standardized measure was $3.2 billion as of 12/31/2015.
3. Virtually all WV/PA Utica Shale net acres are included among the net acres of Marcellus Shale rights as they are stacked pay formations attributable to the same leasehold. 4. Antero and industry rig locations as of 7/22/2016, per RigData.
15
AR COMBINED TOTAL – 12/31/15 RESERVESAssumes Ethane RejectionNet Proved Reserves 13.2 TcfeNet 3P Reserves(1) 42.1 TcfeStrip Pre-Tax 3P PV-10(2) $12.7 BnNet 3P Reserves & Resource(1) 57 to 60 TcfeNet 3P Liquids(1) 1,377 MMBbls% Liquids – Net 3P(1) 20%2Q 2016 Net Production 1,762 MMcfe/d- 2Q 2016 Net Liquids 75,041 Bbl/dNet Acres(1)(3) 641,000Undrilled 3P Locations(1) 4,344
OHIO UTICA SHALE CORE
Net Proved Reserves 1.8 TcfeNet 3P Reserves 7.5 TcfeStrip Pre-Tax 3P PV-10(2) $2.5 BnNet Acres 147,000Undrilled 3P Locations 814
MARCELLUS SHALE CORE
Net Proved Reserves 11.4 TcfeNet 3P Reserves(1) 34.6 TcfeStrip Pre-Tax 3P PV-10(2) $10.2 BnNet Acres(1) 494,000Undrilled 3P Locations(1) 3,530
WV/PA UTICA SHALE DRY GASNet Resource 14.3 to 17.8 TcfNet Acres 231,000Undrilled Locations 2,269
01234567
Rig
Cou
nt
Operators
SW Marcellus + Utica Rigs(4)
Most Active Operator
DRILLING – MOST ACTIVE OPERATOR IN APPALACHIA
Marcellus ShaleUtica Shale Ohio
16
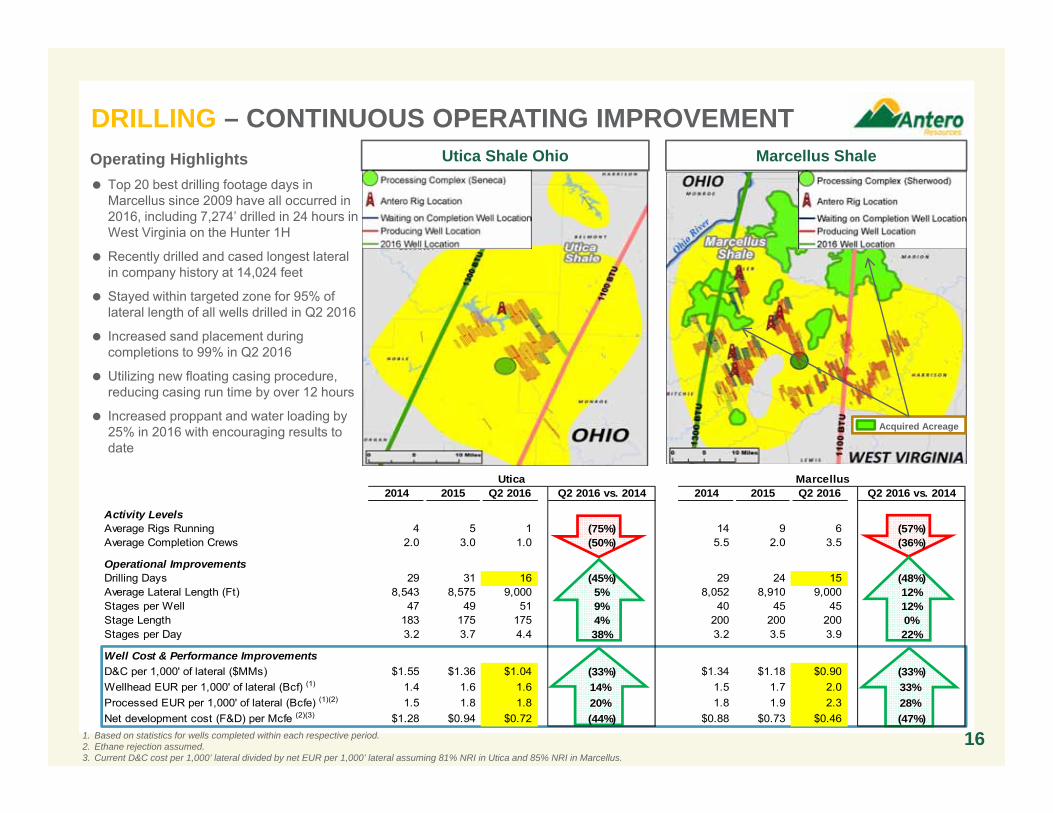
Operating Highlights Top 20 best drilling footage days in
Marcellus since 2009 have all occurred in 2016, including 7,274’ drilled in 24 hours in West Virginia on the Hunter 1H
Recently drilled and cased longest lateral in company history at 14,024 feet
Stayed within targeted zone for 95% of lateral length of all wells drilled in Q2 2016
Increased sand placement during completions to 99% in Q2 2016
Utilizing new floating casing procedure, reducing casing run time by over 12 hours
Increased proppant and water loading by 25% in 2016 with encouraging results to date
1. Based on statistics for wells completed within each respective period.2. Ethane rejection assumed.3. Current D&C cost per 1,000’ lateral divided by net EUR per 1,000’ lateral assuming 81% NRI in Utica and 85% NRI in Marcellus.
Acquired Acreage
Utica Marcellus2014 2015 Q2 2016 Q2 2016 vs. 2014 2014 2015 Q2 2016 Q2 2016 vs. 2014
Activity LevelsAverage Rigs Running 4 5 1 (75%) 14 9 6 (57%)Average Completion Crews 2.0 3.0 1.0 (50%) 5.5 2.0 3.5 (36%)
Operational ImprovementsDrilling Days 29 31 16 (45%) 29 24 15 (48%)Average Lateral Length (Ft) 8,543 8,575 9,000 5% 8,052 8,910 9,000 12%Stages per Well 47 49 51 9% 40 45 45 12%Stage Length 183 175 175 4% 200 200 200 0%Stages per Day 3.2 3.7 4.4 38% 3.2 3.5 3.9 22%
Well Cost & Performance ImprovementsD&C per 1,000' of lateral ($MMs) $1.55 $1.36 $1.04 (33%) $1.34 $1.18 $0.90 (33%)Wellhead EUR per 1,000' of lateral (Bcf) (1) 1.4 1.6 1.6 14% 1.5 1.7 2.0 33%Processed EUR per 1,000' of lateral (Bcfe) (1)(2) 1.5 1.8 1.8 20% 1.8 1.9 2.3 28%Net development cost (F&D) per Mcfe (2)(3) $1.28 $0.94 $0.72 (44%) $0.88 $0.73 $0.46 (47%)
DRILLING – CONTINUOUS OPERATING IMPROVEMENT
1,3161,699
2,111
3,6234,069
-500
500
1,500
2,500
3,500
4,500
2014 2015 Q1 2016 Q2 2016 Q3 2016
Late
ral f
t/day
0
1,000
2,000
3,000
4,000
5,000
6,000
7,000
8,000
01/01/12 12/31/12 12/31/13 12/31/14 01/01/16 12/31/16 12/31/17
DR
ILLE
D L
ATE
RA
L FO
OTA
GE
(6 A
M -
6 A
M)
Date17
Top 50 AR Marcellus Daily Footage Records
All of the top 20 daily footage records since
inception have occurred during 2016
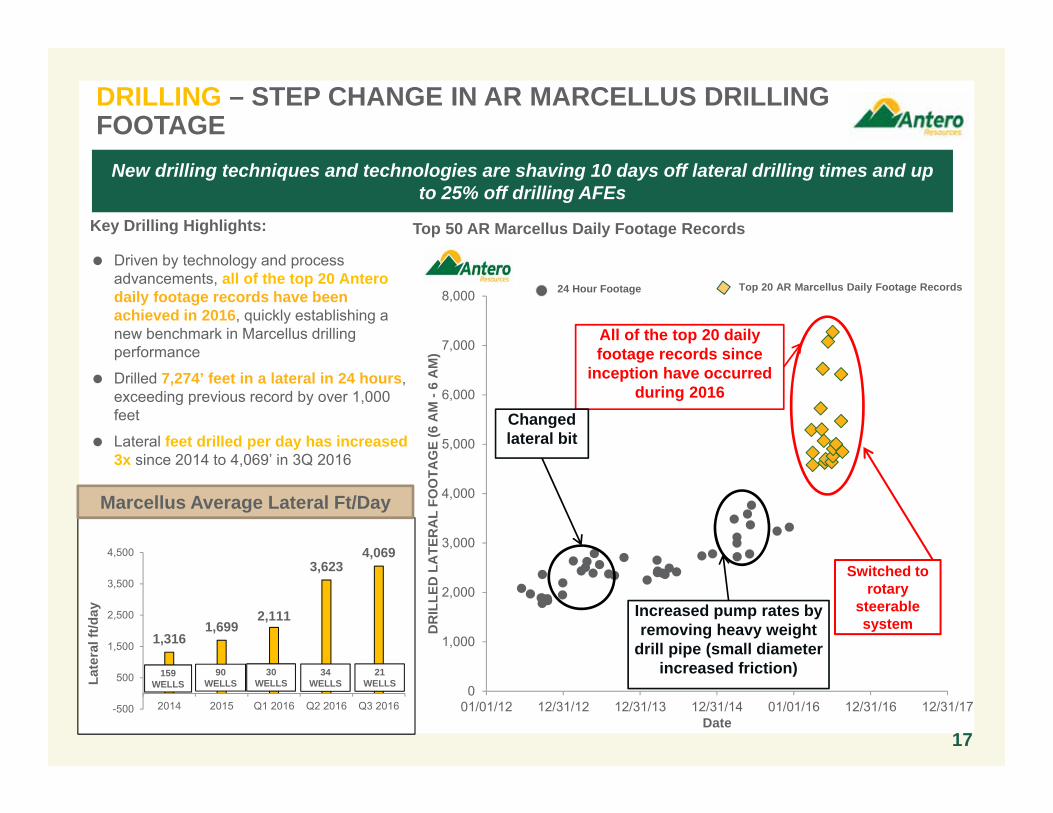
Key Drilling Highlights:
Driven by technology and process advancements, all of the top 20 Anterodaily footage records have been achieved in 2016, quickly establishing a new benchmark in Marcellus drilling performance
Drilled 7,274’ feet in a lateral in 24 hours, exceeding previous record by over 1,000 feet
Lateral feet drilled per day has increased 3x since 2014 to 4,069’ in 3Q 2016
New drilling techniques and technologies are shaving 10 days off lateral drilling times and up to 25% off drilling AFEs
Top 20 AR Marcellus Daily Footage Records
Changed lateral bit
Increased pump rates by removing heavy weight
drill pipe (small diameter increased friction)30
WELLS90
WELLS159
WELLS
Marcellus Average Lateral Ft/Day
34 WELLS
Switched to rotary
steerable system
21 WELLS
24 Hour Footage
DRILLING – STEP CHANGE IN AR MARCELLUS DRILLING FOOTAGE
0
5
10
15
20
25
30
35
4,000 5,000 6,000 7,000 8,000 9,000 10,000 11,000 12,000 13,000 14,000
Equi
vale
nt E
UR
(Bcf
e)
Lateral Length (Feet)
All Wells
2016 Wells
18
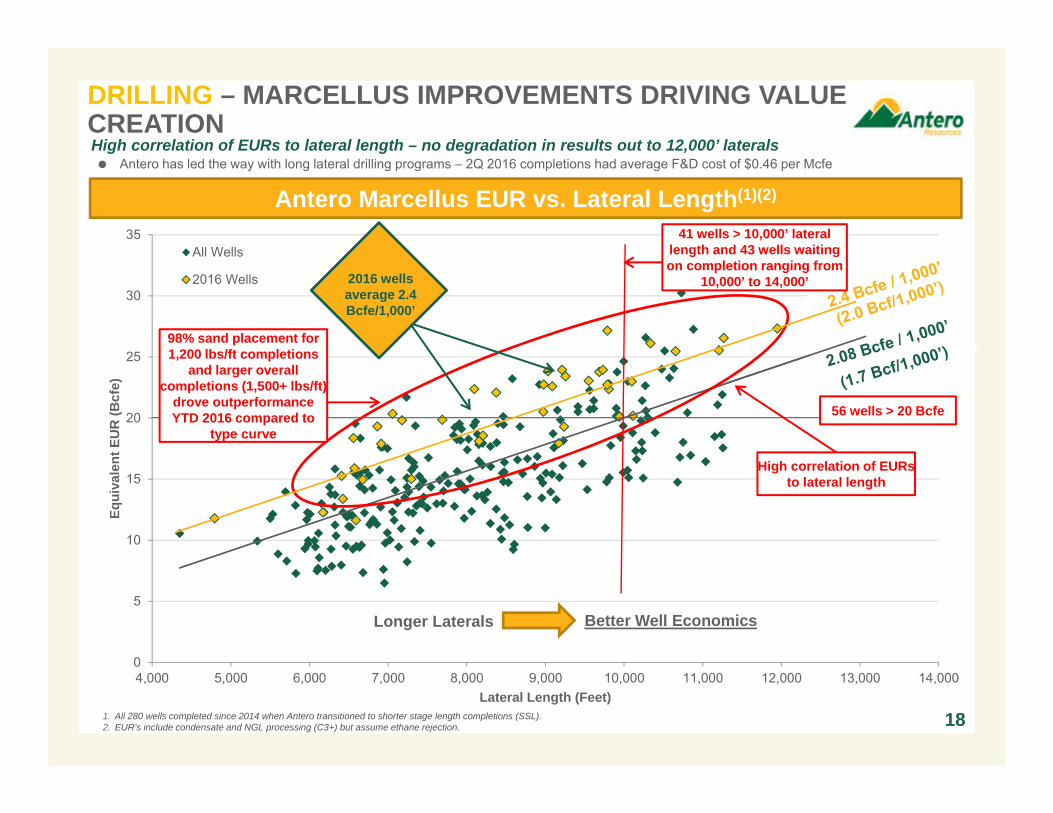
Antero Marcellus EUR vs. Lateral Length(1)(2)
1. All 280 wells completed since 2014 when Antero transitioned to shorter stage length completions (SSL).2. EUR’s include condensate and NGL processing (C3+) but assume ethane rejection.
Longer Laterals Better Well Economics
98% sand placement for 1,200 lbs/ft completions
and larger overall completions (1,500+ lbs/ft)
drove outperformance YTD 2016 compared to
type curve56 wells > 20 Bcfe
High correlation of EURs to lateral length
2016 wells average 2.4 Bcfe/1,000’
High correlation of EURs to lateral length – no degradation in results out to 12,000’ laterals Antero has led the way with long lateral drilling programs – 2Q 2016 completions had average F&D cost of $0.46 per Mcfe
41 wells > 10,000’ lateral length and 43 wells waiting on completion ranging from
10,000’ to 14,000’
DRILLING – MARCELLUS IMPROVEMENTS DRIVING VALUE CREATION
$5.3 $4.6 $5.3 $4.7 $4.7 $4.7 $4.0
$8.7$7.8 $7.6
$7.1 $7.1$5.6
$5.4
$0
$2
$4
$6
$8
$10
$12
$14
$16
Q4 2014 Q1 2015 Q2 2015 Q3 2015 Q4 2015 Q1 2016 Q2 2016
($M
M)
COMPLETION COST DRILLING COST
$4.0 $3.8 $3.4 $3.2 $3.2 $3.1 $2.8
$8.3$7.3 $7.4 $7.0 $7.0
$5.4 $5.3
$-
$2
$4
$6
$8
$10
$12
$14
Q4 2014 Q1 2015 Q2 2015 Q3 2015 Q4 2015 Q1 2016 Q2 2016
($M
M)
COMPLETION COST DRILLING COST
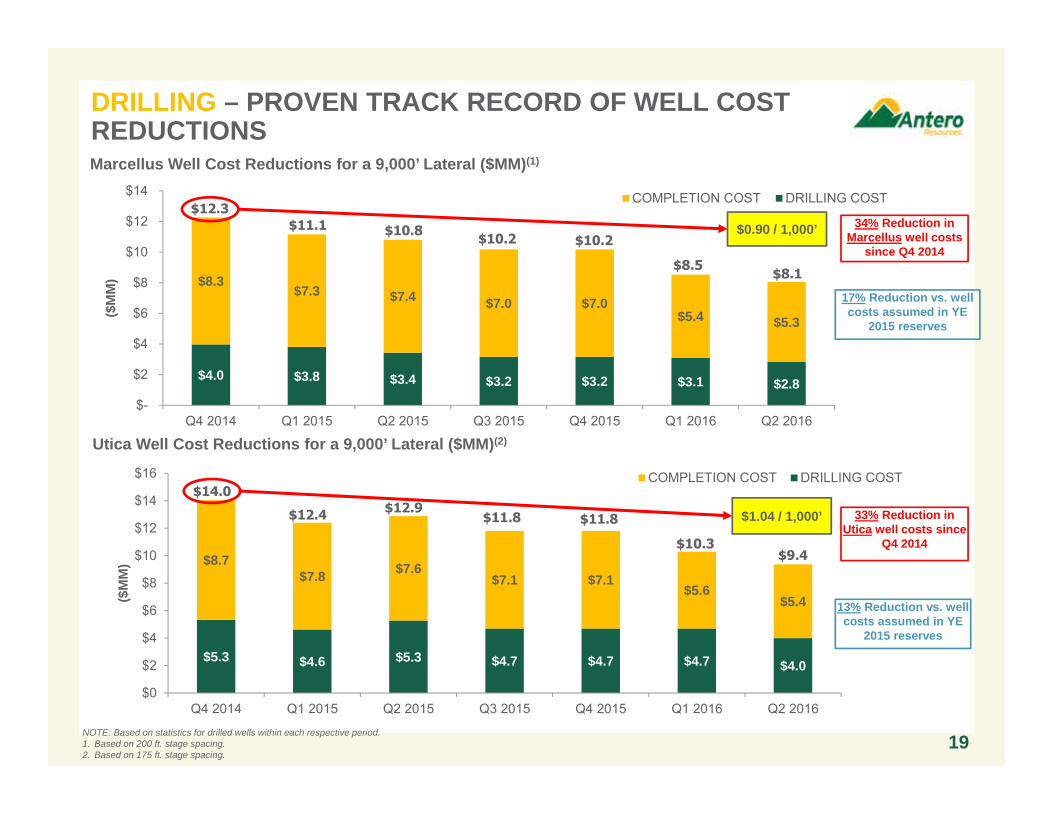
DRILLING – PROVEN TRACK RECORD OF WELL COST REDUCTIONS
19
Marcellus Well Cost Reductions for a 9,000’ Lateral ($MM)(1)
NOTE: Based on statistics for drilled wells within each respective period.1. Based on 200 ft. stage spacing.2. Based on 175 ft. stage spacing.
$14.0
$12.4 $12.9$11.8 $11.8 33% Reduction in
Utica well costs since Q4 2014
Utica Well Cost Reductions for a 9,000’ Lateral ($MM)(2)
$12.3$11.1 $10.8 $10.2 $10.2
$0.90 / 1,000’ 34% Reduction in Marcellus well costs
since Q4 2014
17% Reduction vs. well costs assumed in YE
2015 reserves
13% Reduction vs. well costs assumed in YE
2015 reserves
$1.04 / 1,000’
$8.5
$10.3
$8.1
$9.4
$198 $341
$434
$649
$1,164 $1,221
$1,386
$0
$200
$400
$600
$800
$1,000
$1,200
$1,400
$1,600
2010 2011 2012 2013 2014 2015 2016E
0
10,000
20,000
30,000
40,000
50,000
60,000
70,000
80,000
2010 2011 2012 2013 2014 2015 2016E
NGLs (C3+) Oil Ethane
5 2466,436
23,051
48,298
73,000
51% GrowthGuidance
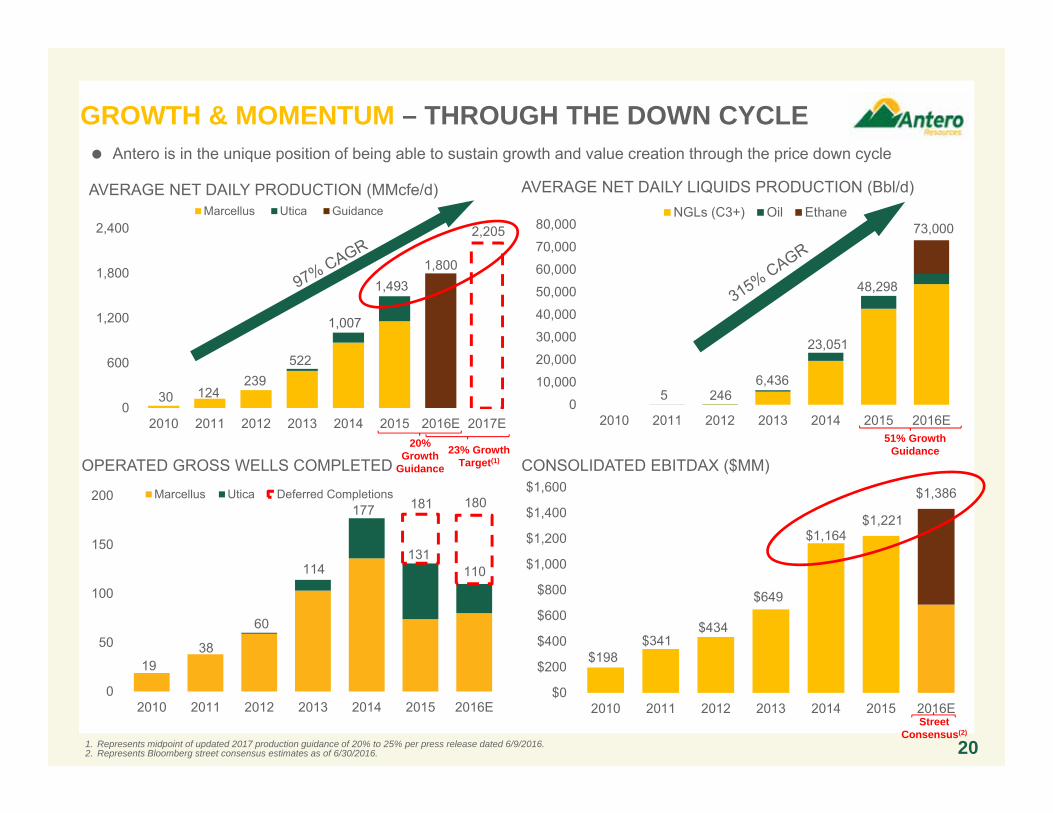
1. Represents midpoint of updated 2017 production guidance of 20% to 25% per press release dated 6/9/2016. 2. Represents Bloomberg street consensus estimates as of 6/30/2016.
1,800
2,205
0
600
1,200
1,800
2,400
2010 2011 2012 2013 2014 2015 2016E 2017E
Marcellus Utica Guidance
30 124239
522
1,007
1,493
20
AVERAGE NET DAILY PRODUCTION (MMcfe/d)
0
50
100
150
200
2010 2011 2012 2013 2014 2015 2016E
Marcellus Utica Deferred Completions
1938
60
114
177 181
131110
180
OPERATED GROSS WELLS COMPLETED
AVERAGE NET DAILY LIQUIDS PRODUCTION (Bbl/d)
20% Growth
Guidance
23% GrowthTarget(1)
Antero is in the unique position of being able to sustain growth and value creation through the price down cycle
CONSOLIDATED EBITDAX ($MM)
StreetConsensus(2)
GROWTH & MOMENTUM – THROUGH THE DOWN CYCLE
$4.6$12.7 $15.8
$23.1$30.3
$3.1
$2.5 $0.9
($0.3) ($1.6)
$3.0
$3.0 $3.0 $3.0
$3.0
$10.7 $18.2 $19.8
$25.8
$31.8
($10.00)
$0.00
$10.00
$20.00
$30.00
$40.00
$50.00
SEC Pricing 12/31/2015 Strip $60 Oil $67.50 Oil $75 Oil
$3.50 Gas $4.00 Gas $4.50 Gas
AR Ownership in AM shares ($B)
Hedge Value Pre-Tax PV-10 ($B)
3P Reserves Pre-Tax PV-10 ($B)
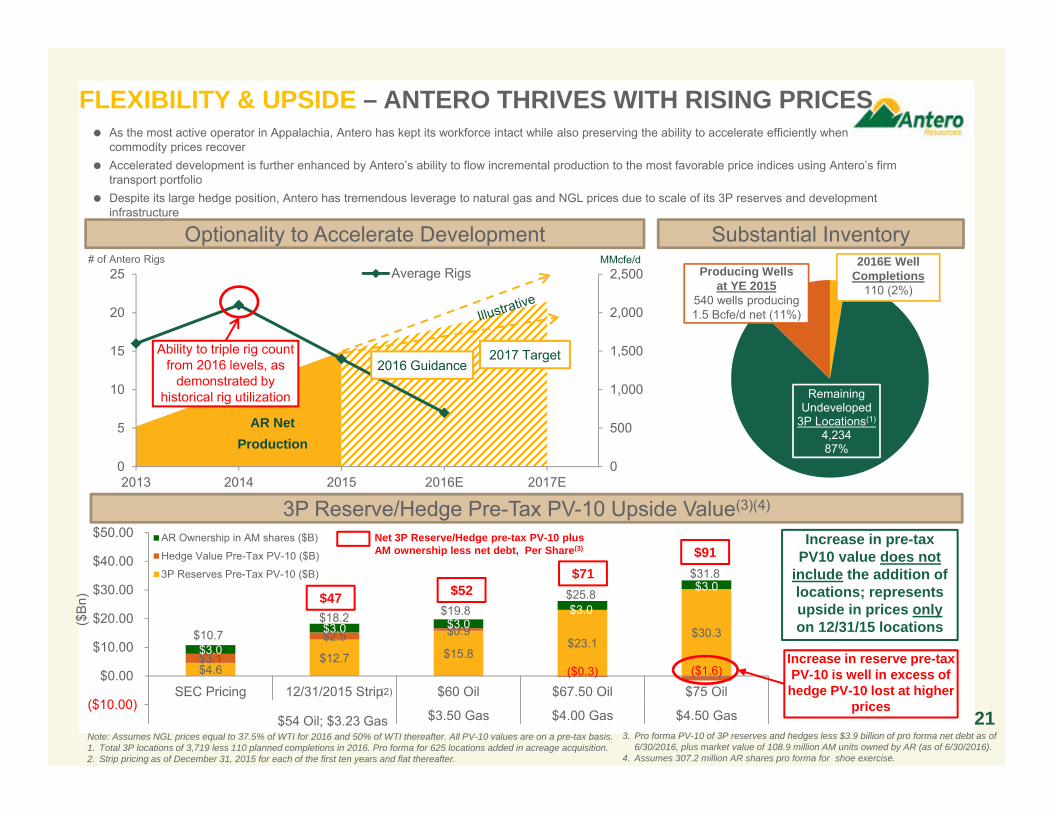
FLEXIBILITY & UPSIDE – ANTERO THRIVES WITH RISING PRICES
21
As the most active operator in Appalachia, Antero has kept its workforce intact while also preserving the ability to accelerate efficiently when commodity prices recover
Accelerated development is further enhanced by Antero’s ability to flow incremental production to the most favorable price indices using Antero’s firm transport portfolio
Despite its large hedge position, Antero has tremendous leverage to natural gas and NGL prices due to scale of its 3P reserves and development infrastructure
Net 3P Reserve/Hedge pre-tax PV-10 plus AM ownership less net debt, Per Share(3)
$52$71
$91Increase in pre-tax
PV10 value does not include the addition of locations; represents upside in prices onlyon 12/31/15 locations
Note: Assumes NGL prices equal to 37.5% of WTI for 2016 and 50% of WTI thereafter. All PV-10 values are on a pre-tax basis.1. Total 3P locations of 3,719 less 110 planned completions in 2016. Pro forma for 625 locations added in acreage acquisition.2. Strip pricing as of December 31, 2015 for each of the first ten years and flat thereafter.
$54 Oil; $3.23 Gas
Increase in reserve pre-tax PV-10 is well in excess of hedge PV-10 lost at higher
prices
3P Reserve/Hedge Pre-Tax PV-10 Upside Value(3)(4)
Substantial InventoryOptionality to Accelerate Development
$47
Remaining Undeveloped
3P Locations(1)
4,23487%
Producing Wells at YE 2015
540 wells producing 1.5 Bcfe/d net (11%)
2016E Well Completions
110 (2%)
3. Pro forma PV-10 of 3P reserves and hedges less $3.9 billion of pro forma net debt as of 6/30/2016, plus market value of 108.9 million AM units owned by AR (as of 6/30/2016).
4. Assumes 307.2 million AR shares pro forma for shoe exercise.
(2)
0
500
1,000
1,500
2,000
2,500
0
5
10
15
20
25
2013 2014 2015 2016E 2017E
Average Rigs
Ability to triple rig count from 2016 levels, as
demonstrated by historical rig utilization
# of Antero Rigs MMcfe/d
AR Net Production
2016 Guidance2017 Target
($B
n)
Maintenance Capital$275
Maintenance Capital$500
2016 Growth Capital$400
2017 Growth Capital$375
2017 Growth Capital$625
$0
$200
$400
$600
$800
$1,000
$1,200
$1,400
$1,600
2016 2017
$1.3 Bn D&C Budget
221. Revenues represent annual mark-to-market value based on 6/30/2016 strip pricing, including actual hedge gain of $324 million in 1Q 2016 and $292 million hedge gain in 2Q 2016.2. Consensus EBITDAX as of 6/30/2016.3. Includes targeted drilling and completion cost improvements.
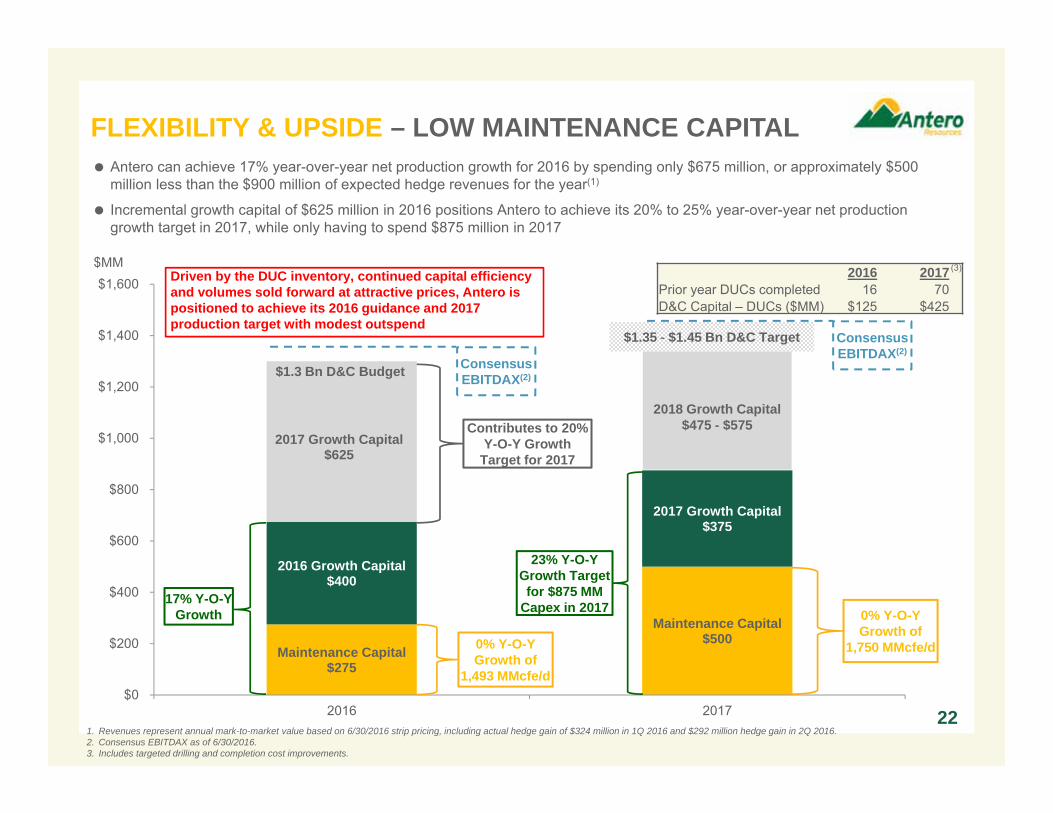
Antero can achieve 17% year-over-year net production growth for 2016 by spending only $675 million, or approximately $500 million less than the $900 million of expected hedge revenues for the year(1)
Incremental growth capital of $625 million in 2016 positions Antero to achieve its 20% to 25% year-over-year net production growth target in 2017, while only having to spend $875 million in 2017
FLEXIBILITY & UPSIDE – LOW MAINTENANCE CAPITAL
0% Y-O-YGrowth of
1,493 MMcfe/d
17% Y-O-YGrowth
Contributes to 20% Y-O-Y Growth
Target for 2017
0% Y-O-YGrowth of
1,750 MMcfe/d
23% Y-O-YGrowth Target for $875 MM
Capex in 2017
$MM2016 2017
Prior year DUCs completed 16 70 D&C Capital – DUCs ($MM) $125 $425
Driven by the DUC inventory, continued capital efficiency and volumes sold forward at attractive prices, Antero is positioned to achieve its 2016 guidance and 2017 production target with modest outspend
2018 Growth Capital
$475 – $575
(3)
Consensus EBITDAX(2)
Consensus EBITDAX(2)
$1.35 - $1.45 Bn D&C Target
2018 Growth Capital$475 - $575
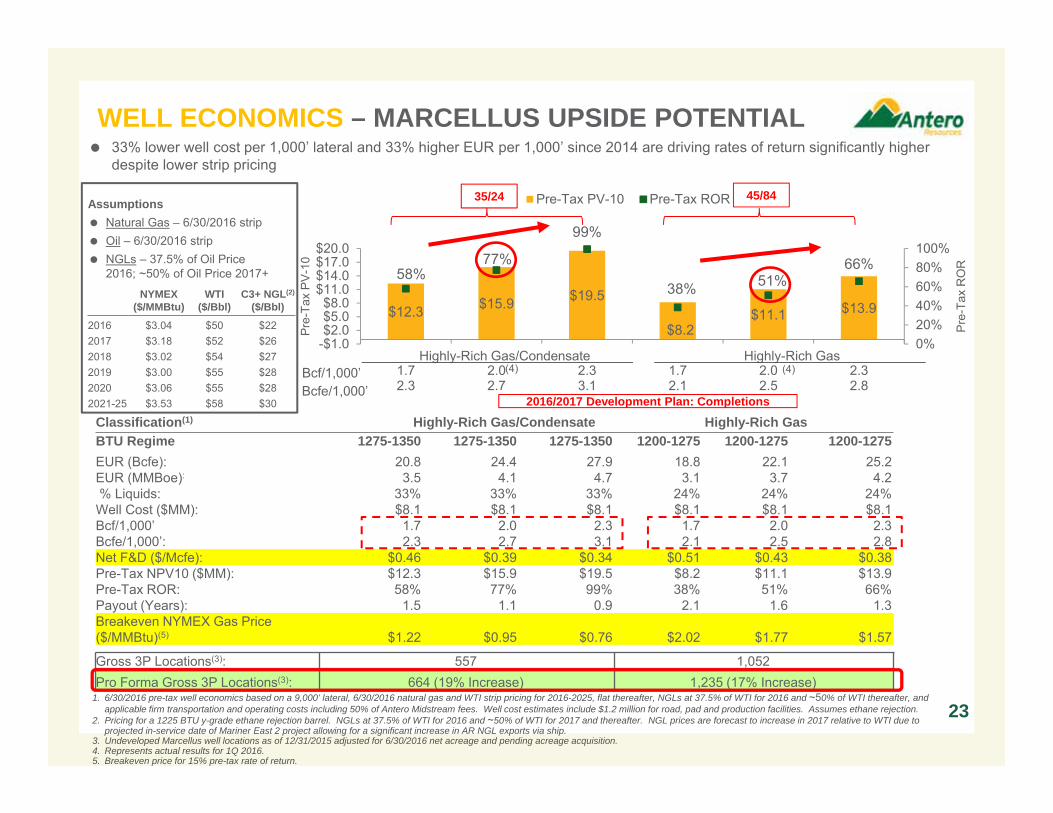
Classification(1) Highly-Rich Gas/Condensate Highly-Rich GasBTU Regime 1275-1350 1275-1350 1275-1350 1200-1275 1200-1275 1200-1275EUR (Bcfe): 20.8 24.4 27.9 18.8 22.1 25.2EUR (MMBoe): 3.5 4.1 4.7 3.1 3.7 4.2% Liquids: 33% 33% 33% 24% 24% 24%Well Cost ($MM): $8.1 $8.1 $8.1 $8.1 $8.1 $8.1Bcf/1,000’ 1.7 2.0 2.3 1.7 2.0 2.3Bcfe/1,000’: 2.3 2.7 3.1 2.1 2.5 2.8Net F&D ($/Mcfe): $0.46 $0.39 $0.34 $0.51 $0.43 $0.38Pre-Tax NPV10 ($MM): $12.3 $15.9 $19.5 $8.2 $11.1 $13.9Pre-Tax ROR: 58% 77% 99% 38% 51% 66%Payout (Years): 1.5 1.1 0.9 2.1 1.6 1.3Breakeven NYMEX Gas Price ($/MMBtu)(5) $1.22 $0.95 $0.76 $2.02 $1.77 $1.57
Gross 3P Locations(3): 557 1,052Pro Forma Gross 3P Locations(3): 664 (19% Increase) 1,235 (17% Increase)
$12.3 $15.9 $19.5
$8.2$11.1 $13.9
58%77%
99%
38% 51%66%
0%20%40%60%80%100%
-$1.0$2.0$5.0$8.0
$11.0$14.0$17.0$20.0
1.72.3
2.02.7
2.33.1
1.72.1
2.02.5
2.32.8
Pre
-Tax
RO
R
Pre
-Tax
PV
-10
Pre-Tax PV-10 Pre-Tax ROR
23
NYMEX($/MMBtu)
WTI($/Bbl)
C3+ NGL(2)
($/Bbl)
2016 $3.04 $50 $222017 $3.18 $52 $262018 $3.02 $54 $272019 $3.00 $55 $282020 $3.06 $55 $282021-25 $3.53 $58 $30
Assumptions Natural Gas – 6/30/2016 strip Oil – 6/30/2016 strip NGLs – 37.5% of Oil Price
2016; ~50% of Oil Price 2017+
45/8435/24
2016/2017 Development Plan: Completions
1. 6/30/2016 pre-tax well economics based on a 9,000’ lateral, 6/30/2016 natural gas and WTI strip pricing for 2016-2025, flat thereafter, NGLs at 37.5% of WTI for 2016 and ~50% of WTI thereafter, and applicable firm transportation and operating costs including 50% of Antero Midstream fees. Well cost estimates include $1.2 million for road, pad and production facilities. Assumes ethane rejection.
2. Pricing for a 1225 BTU y-grade ethane rejection barrel. NGLs at 37.5% of WTI for 2016 and ~50% of WTI for 2017 and thereafter. NGL prices are forecast to increase in 2017 relative to WTI due to projected in-service date of Mariner East 2 project allowing for a significant increase in AR NGL exports via ship.
3. Undeveloped Marcellus well locations as of 12/31/2015 adjusted for 6/30/2016 net acreage and pending acreage acquisition.4. Represents actual results for 1Q 2016. 5. Breakeven price for 15% pre-tax rate of return.
Highly-Rich Gas/Condensate Highly-Rich Gas(4) (4)Bcf/1,000’
Bcfe/1,000’
33% lower well cost per 1,000’ lateral and 33% higher EUR per 1,000’ since 2014 are driving rates of return significantly higherdespite lower strip pricing
WELL ECONOMICS – MARCELLUS UPSIDE POTENTIAL
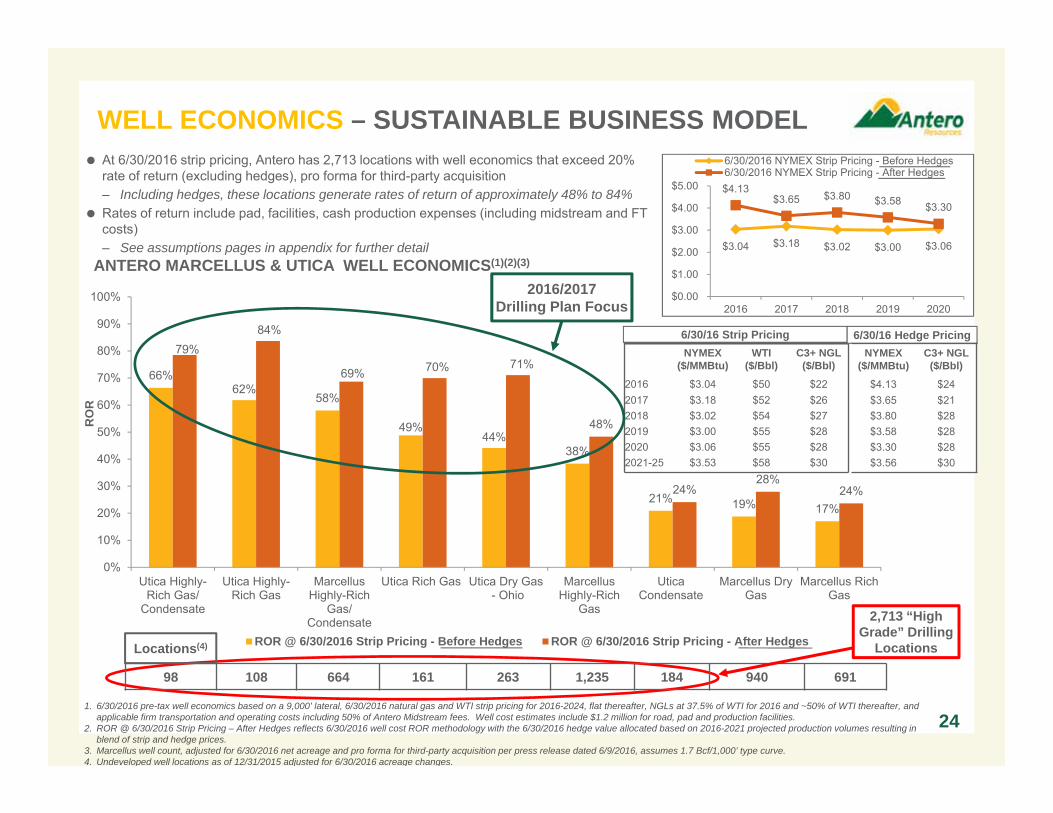
66%62%
58%
49%44%
38%
21% 19% 17%
79%84%
69% 70% 71%
48%
24%28%
24%
0%
10%
20%
30%
40%
50%
60%
70%
80%
90%
100%
Utica Highly-Rich Gas/
Condensate
Utica Highly-Rich Gas
MarcellusHighly-Rich
Gas/Condensate
Utica Rich Gas Utica Dry Gas - Ohio
MarcellusHighly-Rich
Gas
UticaCondensate
Marcellus DryGas
Marcellus RichGas
RO
R
ROR @ 6/30/2016 Strip Pricing - Before Hedges ROR @ 6/30/2016 Strip Pricing - After Hedges
2016/2017Drilling Plan Focus
98 108 664 161 263 1,235 184 940 691
$3.04 $3.18 $3.02 $3.00 $3.06
$4.13 $3.65 $3.80 $3.58 $3.30
$0.00
$1.00
$2.00
$3.00
$4.00
$5.00
2016 2017 2018 2019 2020
6/30/2016 NYMEX Strip Pricing - Before Hedges6/30/2016 NYMEX Strip Pricing - After Hedges
ANTERO MARCELLUS & UTICA WELL ECONOMICS(1)(2)(3)
1. 6/30/2016 pre-tax well economics based on a 9,000’ lateral, 6/30/2016 natural gas and WTI strip pricing for 2016-2024, flat thereafter, NGLs at 37.5% of WTI for 2016 and ~50% of WTI thereafter, and applicable firm transportation and operating costs including 50% of Antero Midstream fees. Well cost estimates include $1.2 million for road, pad and production facilities.
2. ROR @ 6/30/2016 Strip Pricing – After Hedges reflects 6/30/2016 well cost ROR methodology with the 6/30/2016 hedge value allocated based on 2016-2021 projected production volumes resulting in blend of strip and hedge prices.
3. Marcellus well count, adjusted for 6/30/2016 net acreage and pro forma for third-party acquisition per press release dated 6/9/2016, assumes 1.7 Bcf/1,000’ type curve. 4. Undeveloped well locations as of 12/31/2015 adjusted for 6/30/2016 acreage changes.
24
At 6/30/2016 strip pricing, Antero has 2,713 locations with well economics that exceed 20% rate of return (excluding hedges), pro forma for third-party acquisition– Including hedges, these locations generate rates of return of approximately 48% to 84%
Rates of return include pad, facilities, cash production expenses (including midstream and FT costs)– See assumptions pages in appendix for further detail
2,713 “High Grade” Drilling
Locations
NYMEX($/MMBtu)
WTI($/Bbl)
C3+ NGL($/Bbl)
2016 $3.04 $50 $222017 $3.18 $52 $262018 $3.02 $54 $272019 $3.00 $55 $282020 $3.06 $55 $282021-25 $3.53 $58 $30
6/30/16 Strip Pricing 6/30/16 Hedge PricingNYMEX
($/MMBtu)C3+ NGL
($/Bbl)
$4.13 $24$3.65 $21$3.80 $28$3.58 $28$3.30 $28$3.56 $30
Locations(4)
WELL ECONOMICS – SUSTAINABLE BUSINESS MODEL
0
500
1,000
1,500
2,000
2,500
3,000
3,500
4,000 Proved Developed Production (BBtu/d)
Undeveloped Production (BBtu/d)
Hedged Volume (BBtu/d)
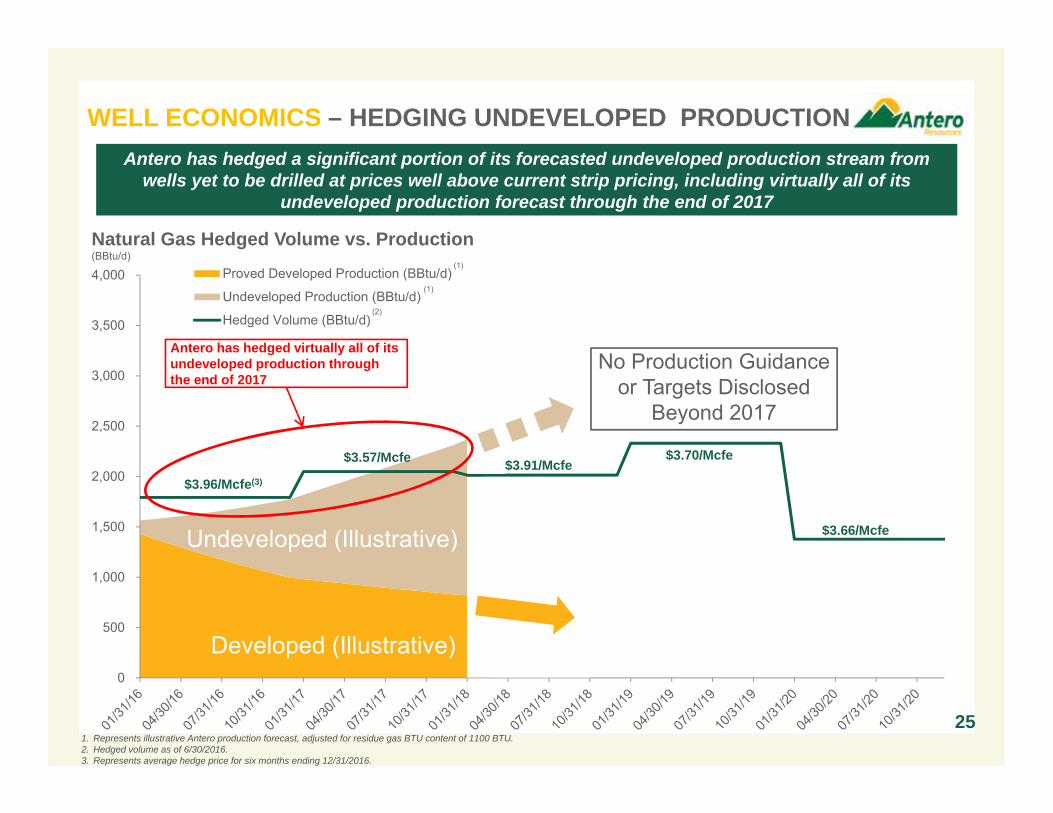
WELL ECONOMICS – HEDGING UNDEVELOPED PRODUCTION
251. Represents illustrative Antero production forecast, adjusted for residue gas BTU content of 1100 BTU.2. Hedged volume as of 6/30/2016.3. Represents average hedge price for six months ending 12/31/2016.
Antero has hedged a significant portion of its forecasted undeveloped production stream from wells yet to be drilled at prices well above current strip pricing, including virtually all of its
undeveloped production forecast through the end of 2017
Natural Gas Hedged Volume vs. Production(BBtu/d)
(1)
(1)
Antero has hedged virtually all of its undeveloped production through the end of 2017
Developed (Illustrative)
Undeveloped (Illustrative)
$3.96/Mcfe(3)
$3.57/Mcfe $3.91/Mcfe$3.70/Mcfe
$3.66/Mcfe
No Production Guidance or Targets Disclosed
Beyond 2017
(2)
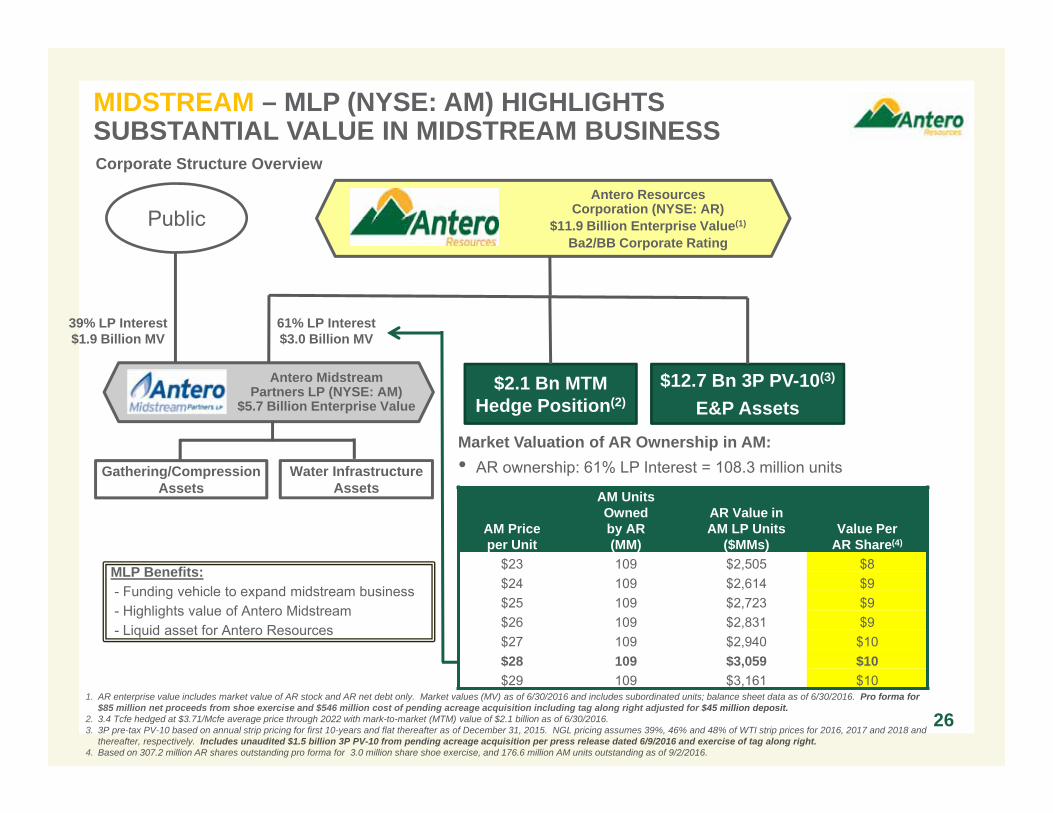
Antero ResourcesCorporation (NYSE: AR)
$11.9 Billion Enterprise Value(1)
Ba2/BB Corporate Rating
Antero MidstreamPartners LP (NYSE: AM)
$5.7 Billion Enterprise Value
61% LP Interest$3.0 Billion MV
$12.7 Bn 3P PV-10(3)
E&P Assets
Gathering/Compression Assets
1. AR enterprise value includes market value of AR stock and AR net debt only. Market values (MV) as of 6/30/2016 and includes subordinated units; balance sheet data as of 6/30/2016. Pro forma for $85 million net proceeds from shoe exercise and $546 million cost of pending acreage acquisition including tag along right adjusted for $45 million deposit.
2. 3.4 Tcfe hedged at $3.71/Mcfe average price through 2022 with mark-to-market (MTM) value of $2.1 billion as of 6/30/2016. 3. 3P pre-tax PV-10 based on annual strip pricing for first 10-years and flat thereafter as of December 31, 2015. NGL pricing assumes 39%, 46% and 48% of WTI strip prices for 2016, 2017 and 2018 and
thereafter, respectively. Includes unaudited $1.5 billion 3P PV-10 from pending acreage acquisition per press release dated 6/9/2016 and exercise of tag along right. 4. Based on 307.2 million AR shares outstanding pro forma for 3.0 million share shoe exercise, and 176.6 million AM units outstanding as of 9/2/2016.
26
Corporate Structure Overview
Market Valuation of AR Ownership in AM:• AR ownership: 61% LP Interest = 108.3 million units
AM Priceper Unit
AM UnitsOwnedby AR(MM)
AR Value in AM LP Units
($MMs)Value Per
AR Share(4)
$23 109 $2,505 $8$24 109 $2,614 $9$25 109 $2,723 $9$26 109 $2,831 $9$27 109 $2,940 $10$28 109 $3,059 $10$29 109 $3,161 $10
Water Infrastructure Assets
MLP Benefits:- Funding vehicle to expand midstream business- Highlights value of Antero Midstream- Liquid asset for Antero Resources
Public
39% LP Interest$1.9 Billion MV
$2.1 Bn MTM Hedge Position(2)
MIDSTREAM – MLP (NYSE: AM) HIGHLIGHTSSUBSTANTIAL VALUE IN MIDSTREAM BUSINESS
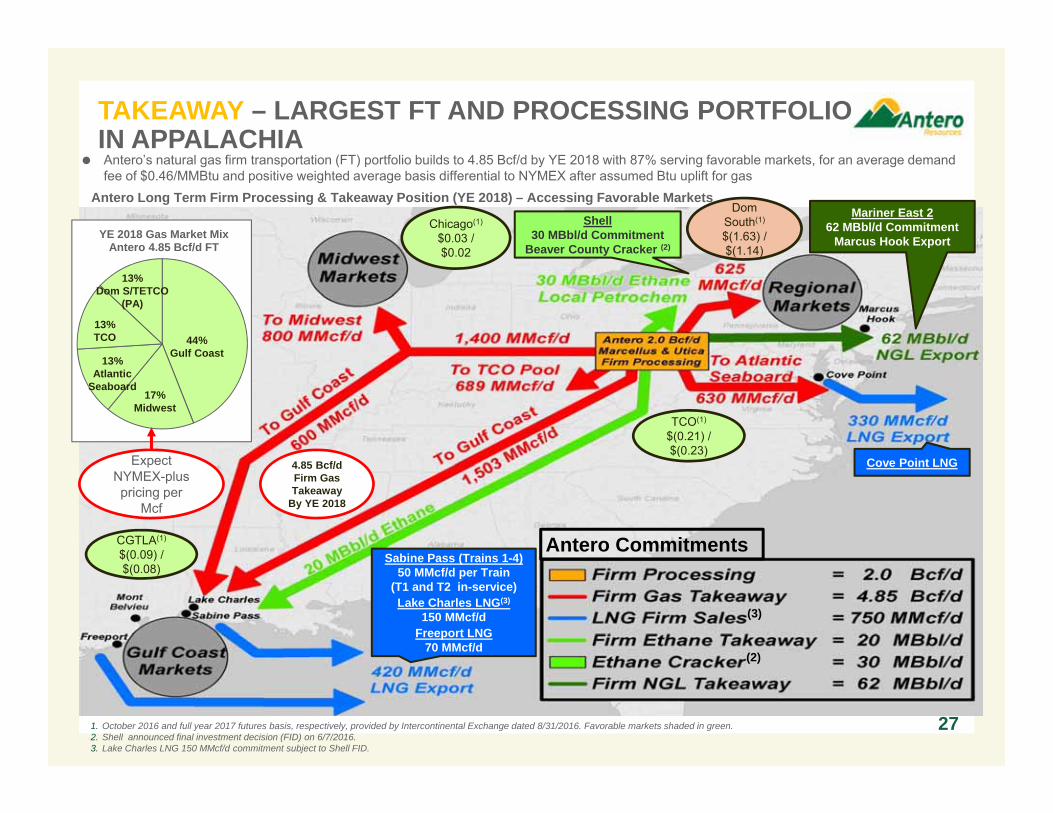
Antero Long Term Firm Processing & Takeaway Position (YE 2018) – Accessing Favorable MarketsMariner East 2
62 MBbl/d CommitmentMarcus Hook Export
Shell30 MBbl/d Commitment
Beaver County Cracker (2)
Sabine Pass (Trains 1-4)50 MMcf/d per Train
(T1 and T2 in-service)Lake Charles LNG(3)
150 MMcf/dFreeport LNG
70 MMcf/d
1. October 2016 and full year 2017 futures basis, respectively, provided by Intercontinental Exchange dated 8/31/2016. Favorable markets shaded in green. 2. Shell announced final investment decision (FID) on 6/7/2016.3. Lake Charles LNG 150 MMcf/d commitment subject to Shell FID.
Chicago(1)
$0.03 / $0.02
CGTLA(1)
$(0.09) / $(0.08)
TCO(1)
$(0.21) / $(0.23)
27
Cove Point LNG4.85 Bcf/dFirm GasTakeaway
By YE 2018
Antero’s natural gas firm transportation (FT) portfolio builds to 4.85 Bcf/d by YE 2018 with 87% serving favorable markets, for an average demand fee of $0.46/MMBtu and positive weighted average basis differential to NYMEX after assumed Btu uplift for gas
YE 2018 Gas Market MixAntero 4.85 Bcf/d FT
44%Gulf Coast
17%Midwest
13%Atlantic
Seaboard
13%Dom S/TETCO
(PA)
13%TCO
Expect NYMEX-plus pricing per
Mcf
Antero Commitments
(3)
(2)
Dom South(1)
$(1.63) / $(1.14)
TAKEAWAY – LARGEST FT AND PROCESSING PORTFOLIO IN APPALACHIA
-
500,000
1,000,000
1,500,000
2,000,000
2,500,000
3,000,000
3,500,000
4,000,000
4,500,000
5,000,000
5,500,000
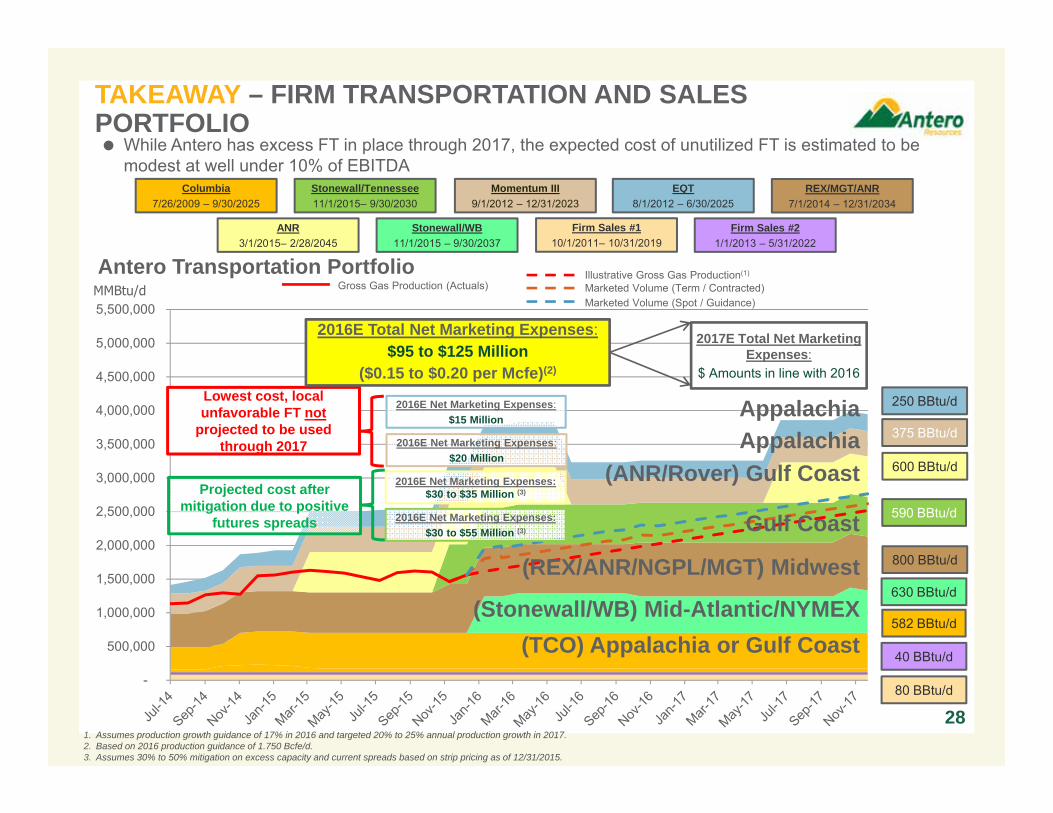
TAKEAWAY – FIRM TRANSPORTATION AND SALES PORTFOLIO
28
MMBtu/d
Columbia7/26/2009 – 9/30/2025
Momentum III9/1/2012 – 12/31/2023
EQT8/1/2012 – 6/30/2025
REX/MGT/ANR7/1/2014 – 12/31/2034
Stonewall/Tennessee11/1/2015– 9/30/2030
(Stonewall/WB) Mid-Atlantic/NYMEX
Gulf Coast
(TCO) Appalachia or Gulf Coast
AppalachiaAppalachia
(REX/ANR/NGPL/MGT) Midwest
Firm Sales #110/1/2011– 10/31/2019
Firm Sales #21/1/2013 – 5/31/2022
ANR3/1/2015– 2/28/2045
Stonewall/WB11/1/2015 – 9/30/2037
(ANR/Rover) Gulf Coast
Antero Transportation Portfolio
582 BBtu/d
590 BBtu/d
375 BBtu/d
250 BBtu/d
800 BBtu/d
600 BBtu/d
630 BBtu/d
40 BBtu/d
Gross Gas Production (Actuals)Illustrative Gross Gas Production(1)
1. Assumes production growth guidance of 17% in 2016 and targeted 20% to 25% annual production growth in 2017.2. Based on 2016 production guidance of 1.750 Bcfe/d.3. Assumes 30% to 50% mitigation on excess capacity and current spreads based on strip pricing as of 12/31/2015.
Lowest cost, local unfavorable FT not
projected to be used through 2017
2016E Net Marketing Expenses:$15 Million
2016E Net Marketing Expenses:$20 Million
2016E Net Marketing Expenses:$30 to $35 Million (3)
2016E Net Marketing Expenses:$30 to $55 Million (3)
2016E Total Net Marketing Expenses:$95 to $125 Million
($0.15 to $0.20 per Mcfe)(2)
2017E Total Net Marketing Expenses:
$ Amounts in line with 2016
While Antero has excess FT in place through 2017, the expected cost of unutilized FT is estimated to be modest at well under 10% of EBITDA
Projected cost after mitigation due to positive
futures spreads
Marketed Volume (Term / Contracted)Marketed Volume (Spot / Guidance)
80 BBtu/d
$0.00
$1.00
$2.00
$3.00
$4.00
$5.00
$6.00
$0
$50
$100
$150
$200
$250
$300
$350
$MM
29
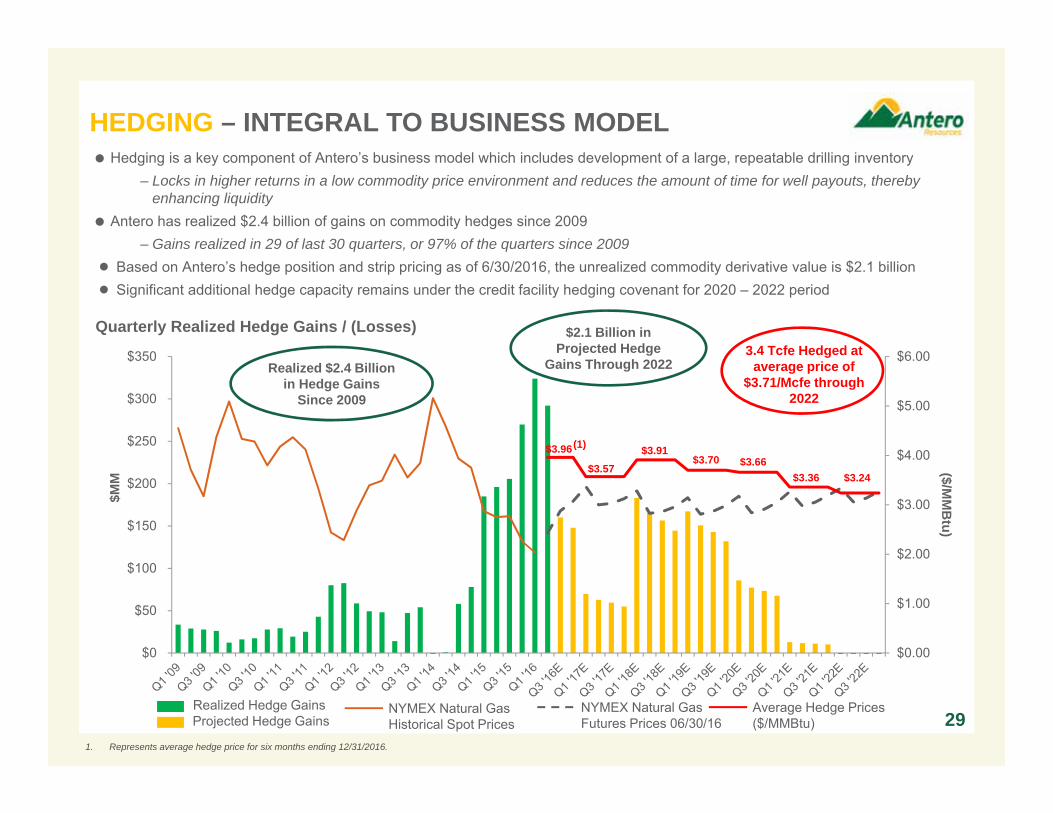
Hedging is a key component of Antero’s business model which includes development of a large, repeatable drilling inventory– Locks in higher returns in a low commodity price environment and reduces the amount of time for well payouts, thereby
enhancing liquidity Antero has realized $2.4 billion of gains on commodity hedges since 2009
– Gains realized in 29 of last 30 quarters, or 97% of the quarters since 2009● Based on Antero’s hedge position and strip pricing as of 6/30/2016, the unrealized commodity derivative value is $2.1 billion● Significant additional hedge capacity remains under the credit facility hedging covenant for 2020 – 2022 period
Quarterly Realized Hedge Gains / (Losses)
Realized Hedge GainsProjected Hedge Gains
NYMEX Natural Gas Historical Spot Prices
($/MM
Btu)
NYMEX Natural Gas Futures Prices 06/30/16
3.4 Tcfe Hedged at average price of
$3.71/Mcfe through 2022
Average Hedge Prices ($/MMBtu)
$3.36
$3.96
$3.57$3.91
$3.70 $3.66$3.24
$2.1 Billion in Projected Hedge
Gains Through 2022Realized $2.4 Billion in Hedge Gains
Since 2009
HEDGING – INTEGRAL TO BUSINESS MODEL
(1)
1. Represents average hedge price for six months ending 12/31/2016.
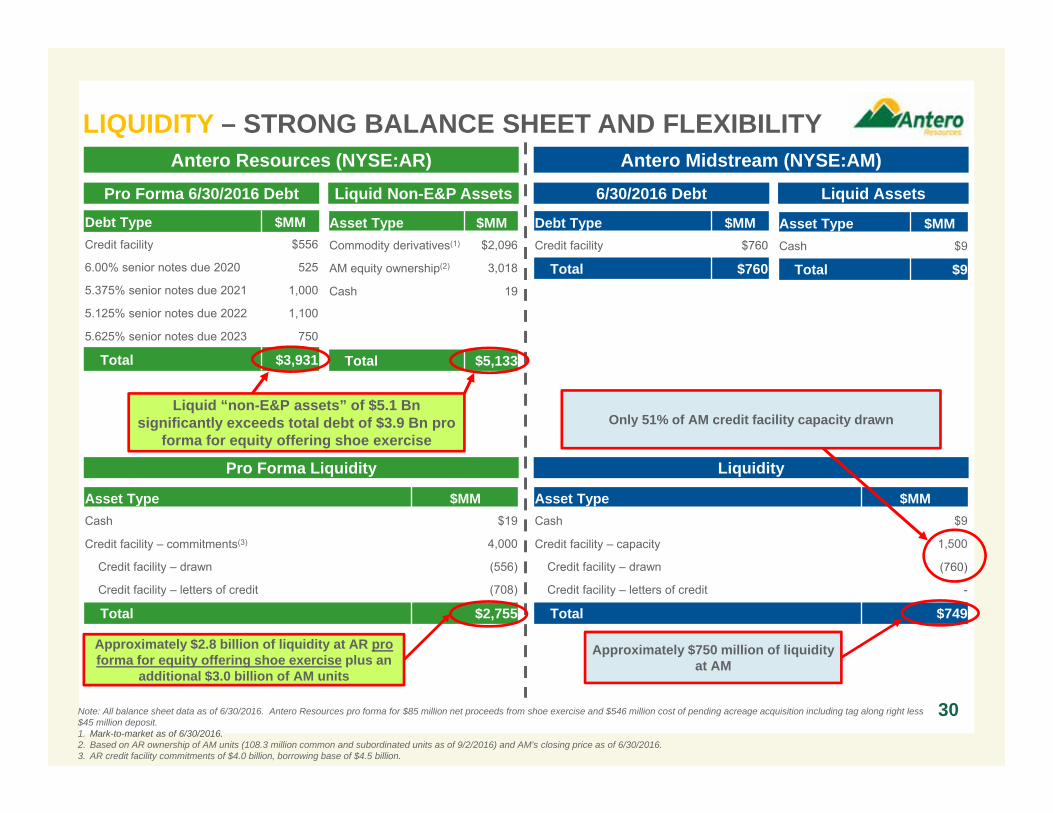
Liquid “non-E&P assets” of $5.1 Bnsignificantly exceeds total debt of $3.9 Bn pro
forma for equity offering shoe exercise
Pro Forma Liquidity
Antero Resources (NYSE:AR) Antero Midstream (NYSE:AM)
Pro Forma 6/30/2016 Debt Liquid Non-E&P Assets 6/30/2016 Debt Liquid Assets
Debt Type $MMCredit facility $556
6.00% senior notes due 2020 525
5.375% senior notes due 2021 1,000
5.125% senior notes due 2022 1,100
5.625% senior notes due 2023 750
Total $3,931
Asset Type $MMCommodity derivatives(1) $2,096
AM equity ownership(2) 3,018
Cash 19
Total $5,133
Asset Type $MMCash $19
Credit facility – commitments(3) 4,000
Credit facility – drawn (556)
Credit facility – letters of credit (708)
Total $2,755
Debt Type $MMCredit facility $760
Total $760
Asset Type $MMCash $9
Total $9
Liquidity
Asset Type $MMCash $9
Credit facility – capacity 1,500
Credit facility – drawn (760)
Credit facility – letters of credit -
Total $749
Approximately $2.8 billion of liquidity at AR pro forma for equity offering shoe exercise plus an
additional $3.0 billion of AM units
Approximately $750 million of liquidityat AM
30
Only 51% of AM credit facility capacity drawn
Note: All balance sheet data as of 6/30/2016. Antero Resources pro forma for $85 million net proceeds from shoe exercise and $546 million cost of pending acreage acquisition including tag along right less $45 million deposit. 1. Mark-to-market as of 6/30/2016.2. Based on AR ownership of AM units (108.3 million common and subordinated units as of 9/2/2016) and AM’s closing price as of 6/30/2016.3. AR credit facility commitments of $4.0 billion, borrowing base of $4.5 billion.
LIQUIDITY – STRONG BALANCE SHEET AND FLEXIBILITY
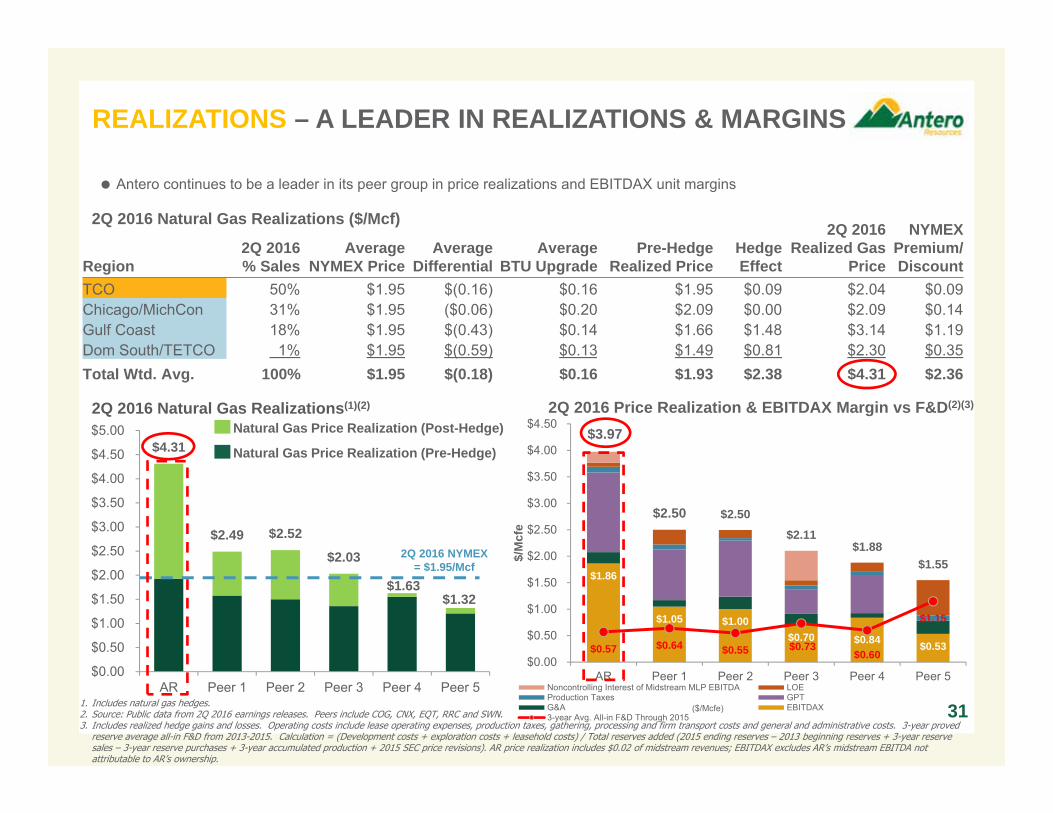
1. Includes natural gas hedges.2. Source: Public data from 2Q 2016 earnings releases. Peers include COG, CNX, EQT, RRC and SWN. 3. Includes realized hedge gains and losses. Operating costs include lease operating expenses, production taxes, gathering, processing and firm transport costs and general and administrative costs. 3-year proved
reserve average all-in F&D from 2013-2015. Calculation = (Development costs + exploration costs + leasehold costs) / Total reserves added (2015 ending reserves – 2013 beginning reserves + 3-year reserve sales – 3-year reserve purchases + 3-year accumulated production + 2015 SEC price revisions). AR price realization includes $0.02 of midstream revenues; EBITDAX excludes AR’s midstream EBITDA not attributable to AR’s ownership.
$1.86
$1.05 $1.00 $0.70 $0.84 $0.53 $0.57 $0.64 $0.55 $0.73
$0.60
$1.15
$3.97
$2.50 $2.50 $2.11
$1.88 $1.55
$0.00
$0.50
$1.00
$1.50
$2.00
$2.50
$3.00
$3.50
$4.00
$4.50
AR Peer 1 Peer 2 Peer 3 Peer 4 Peer 5
$/M
cfe
Noncontrolling Interest of Midstream MLP EBITDA LOEProduction Taxes GPTG&A EBITDAX3-year Avg. All-in F&D Through 2015
$4.31
$2.49 $2.52
$2.03
$1.63 $1.32
$0.00
$0.50
$1.00
$1.50
$2.00
$2.50
$3.00
$3.50
$4.00
$4.50
$5.00
AR Peer 1 Peer 2 Peer 3 Peer 4 Peer 5
Region2Q 2016 % Sales
Average NYMEX Price
AverageDifferential
AverageBTU Upgrade
Pre-HedgeRealized Price
Hedge Effect
2Q 2016Realized Gas
Price
NYMEX Premium/Discount
TCO 50% $1.95 $(0.16) $0.16 $1.95 $0.09 $2.04 $0.09Chicago/MichCon 31% $1.95 ($0.06) $0.20 $2.09 $0.00 $2.09 $0.14Gulf Coast 18% $1.95 $(0.43) $0.14 $1.66 $1.48 $3.14 $1.19Dom South/TETCO 1% $1.95 $(0.59) $0.13 $1.49 $0.81 $2.30 $0.35Total Wtd. Avg. 100% $1.95 $(0.18) $0.16 $1.93 $2.38 $4.31 $2.36
31
2Q 2016 Natural Gas Realizations(1)(2) 2Q 2016 Price Realization & EBITDAX Margin vs F&D(2)(3)
($/Mcfe)
Antero continues to be a leader in its peer group in price realizations and EBITDAX unit margins
2Q 2016 NYMEX = $1.95/Mcf
REALIZATIONS – A LEADER IN REALIZATIONS & MARGINS
Natural Gas Price Realization (Post-Hedge)
Natural Gas Price Realization (Pre-Hedge)
2Q 2016 Natural Gas Realizations ($/Mcf)
DOM S 23%
DOM S, 3%
TETCO M27%
TETCO M21%
TCO 40%
TCO 33% TCO, 21%
NYMEX10%
NYMEX10%
NYMEX10%
Gulf Coast2%
Gulf Coast28%
Gulf Coast49%
Chicago18%
Chicago28%
Chicago17%
0%
10%
20%
30%
40%
50%
60%
70%
80%
90%
100%
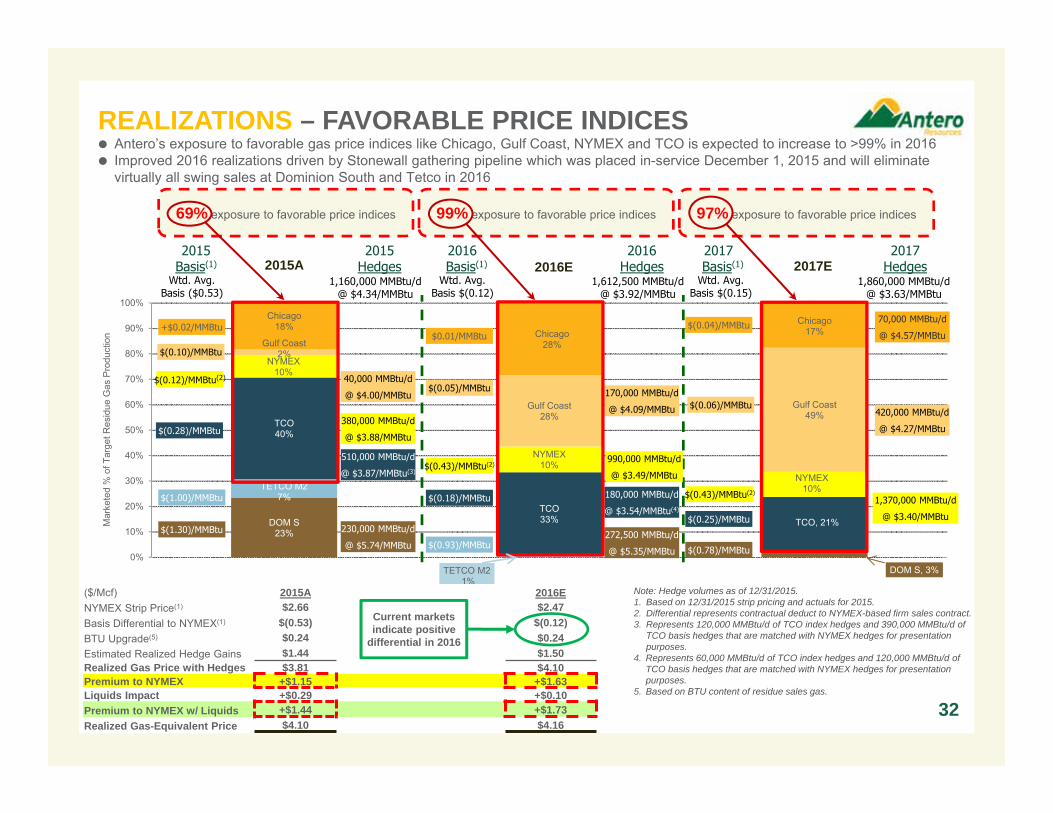
($/Mcf) 2015A 2016ENYMEX Strip Price(1) $2.66 $2.47Basis Differential to NYMEX(1) $(0.53) $(0.12)BTU Upgrade(5) $0.24 $0.24Estimated Realized Hedge Gains $1.44 $1.50 Realized Gas Price with Hedges $3.81 $4.10 Premium to NYMEX +$1.15 +$1.63Liquids Impact +$0.29 +$0.10Premium to NYMEX w/ Liquids +$1.44 +$1.73Realized Gas-Equivalent Price $4.10 $4.16
REALIZATIONS – FAVORABLE PRICE INDICES
Note: Hedge volumes as of 12/31/2015.1. Based on 12/31/2015 strip pricing and actuals for 2015. 2. Differential represents contractual deduct to NYMEX-based firm sales contract.3. Represents 120,000 MMBtu/d of TCO index hedges and 390,000 MMBtu/d of
TCO basis hedges that are matched with NYMEX hedges for presentation purposes.
4. Represents 60,000 MMBtu/d of TCO index hedges and 120,000 MMBtu/d of TCO basis hedges that are matched with NYMEX hedges for presentation purposes.
5. Based on BTU content of residue sales gas.
2015Basis(1)
2016 Basis(1)
2017 Basis(1)
2015Hedges
2016Hedges
2017Hedges
Mar
kete
d %
of T
arge
t Res
idue
Gas
Pro
duct
ion
+$0.02/MMBtu
$(0.12)/MMBtu(2)
$(1.30)/MMBtu
$(0.28)/MMBtu
$0.01/MMBtu
$(0.43)/MMBtu(2)
$(0.18)/MMBtu
$(0.04)/MMBtu
$(0.43)/MMBtu(2)
$(0.78)/MMBtu
$(0.25)/MMBtu
$(0.05)/MMBtu
$(0.06)/MMBtu
1,370,000 MMBtu/d
@ $3.40/MMBtu
40,000 MMBtu/d
@ $4.00/MMBtu
230,000 MMBtu/d
@ $5.74/MMBtu
510,000 MMBtu/d
@ $3.87/MMBtu(3)
170,000 MMBtu/d
@ $4.09/MMBtu
272,500 MMBtu/d
@ $5.35/MMBtu
180,000 MMBtu/d
@ $3.54/MMBtu(4)
99% exposure to favorable price indices69% exposure to favorable price indices 97% exposure to favorable price indices
Antero’s exposure to favorable gas price indices like Chicago, Gulf Coast, NYMEX and TCO is expected to increase to >99% in 2016 Improved 2016 realizations driven by Stonewall gathering pipeline which was placed in-service December 1, 2015 and will eliminate
virtually all swing sales at Dominion South and Tetco in 2016
$(1.00)/MMBtu
$(0.93)/MMBtu
Wtd. Avg.Basis ($0.53)
Wtd. Avg.Basis $(0.12)
1,160,000 MMBtu/d@ $4.34/MMBtu
Wtd. Avg.Basis $(0.15)
1,612,500 MMBtu/d@ $3.92/MMBtu
420,000 MMBtu/d
@ $4.27/MMBtu
2015A 2016E 2017E
32
380,000 MMBtu/d
@ $3.88/MMBtu
990,000 MMBtu/d
@ $3.49/MMBtu
70,000 MMBtu/d
@ $4.57/MMBtu
1,860,000 MMBtu/d@ $3.63/MMBtu
$(0.10)/MMBtu
Current markets indicate positive
differential in 2016
$1.86
AR P1 P3 P4 P2 P5
$332
AR P2 P3 P4 P5 P1
$2.03
AR P2 P1 P3 P4 P5
$355
AR P2 P5 P3 P1 P4
3Q 2015
$1.97
AR P3 P5 P4 P2 P1
$2.03
AR P3 P2 P1 P5 P4
$308
P2 AR P5 P3 P4 P1
$1.90
$0.00
$0.50
$1.00
$1.50
$2.00
$2.50
$3.00
AR P3 P4 P2 P5 P1
$291
P5 AR P2 P3 P4 P1
$269
$0
$100
$200
$300
$400
$500
P5 P2 AR P3 P4 P1
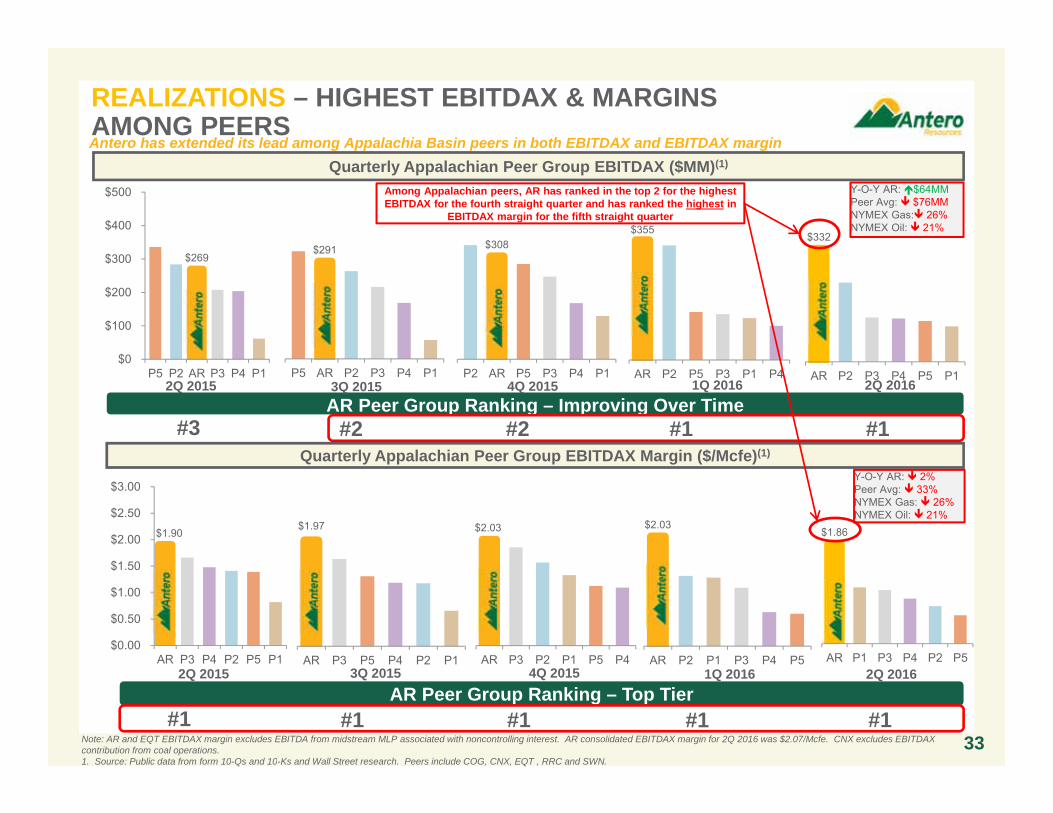
Quarterly Appalachian Peer Group EBITDAX Margin ($/Mcfe)(1)
Quarterly Appalachian Peer Group EBITDAX ($MM)(1)
2Q 2015
Note: AR and EQT EBITDAX margin excludes EBITDA from midstream MLP associated with noncontrolling interest. AR consolidated EBITDAX margin for 2Q 2016 was $2.07/Mcfe. CNX excludes EBITDAX contribution from coal operations. 1. Source: Public data from form 10-Qs and 10-Ks and Wall Street research. Peers include COG, CNX, EQT , RRC and SWN.
4Q 2015 1Q 20162Q 2015AR Peer Group Ranking – Top Tier
#1 #1 #1 #1 #1
AR Peer Group Ranking – Improving Over Time#3 #2 #2 #1 #1
Y-O-Y AR: $64MMPeer Avg: $76MMNYMEX Gas: 26%NYMEX Oil: 21%
Y-O-Y AR: 2%Peer Avg: 33%NYMEX Gas: 26%NYMEX Oil: 21%
33
3Q 2015
Among Appalachian peers, AR has ranked in the top 2 for the highest EBITDAX for the fourth straight quarter and has ranked the highest in
EBITDAX margin for the fifth straight quarter
4Q 2015 1Q 2016
Antero has extended its lead among Appalachia Basin peers in both EBITDAX and EBITDAX margin
2Q 2016
2Q 2016
REALIZATIONS – HIGHEST EBITDAX & MARGINSAMONG PEERS
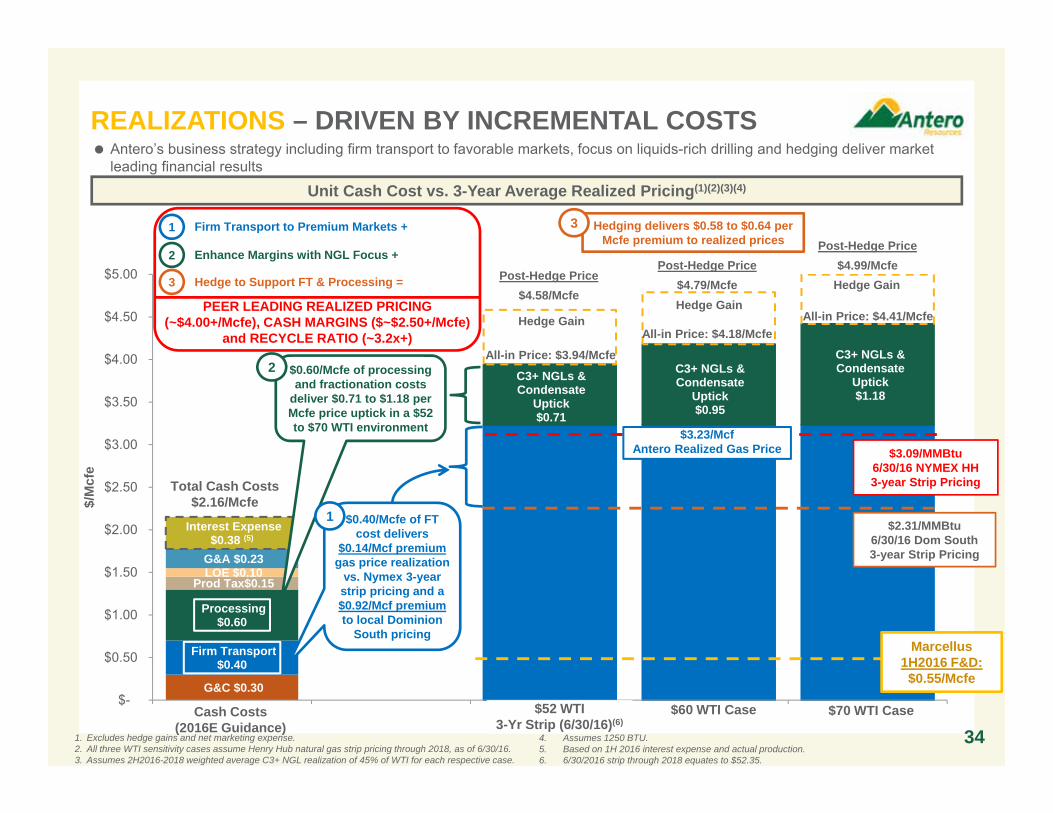
G&C $0.30
C3+ NGLs & Condensate
Uptick$0.71
C3+ NGLs &Condensate
Uptick$0.95
C3+ NGLs &Condensate
Uptick$1.18
Firm Transport$0.40
Processing$0.60
Prod Tax$0.15 LOE $0.10 G&A $0.23
Interest Expense$0.38 (5)
Hedge GainHedge Gain
Hedge Gain
$-
$0.50
$1.00
$1.50
$2.00
$2.50
$3.00
$3.50
$4.00
$4.50
$5.00
1 2 3 4 5
$/M
cfe
PEER LEADING REALIZED PRICING (~$4.00+/Mcfe), CASH MARGINS ($~$2.50+/Mcfe)
and RECYCLE RATIO (~3.2x+)
$0.60/Mcfe of processing and fractionation costs
deliver $0.71 to $1.18 per Mcfe price uptick in a $52 to $70 WTI environment
341. Excludes hedge gains and net marketing expense.2. All three WTI sensitivity cases assume Henry Hub natural gas strip pricing through 2018, as of 6/30/16.3. Assumes 2H2016-2018 weighted average C3+ NGL realization of 45% of WTI for each respective case.
Antero’s business strategy including firm transport to favorable markets, focus on liquids-rich drilling and hedging deliver market leading financial results
Cash Costs(2016E Guidance)
$52 WTI3-Yr Strip (6/30/16)(6)
$60 WTI Case $70 WTI Case
Post-Hedge Price$4.58/Mcfe
Post-Hedge Price$4.79/Mcfe
Post-Hedge Price$4.99/Mcfe
$3.09/MMBtu6/30/16 NYMEX HH 3-year Strip Pricing
4. Assumes 1250 BTU.5. Based on 1H 2016 interest expense and actual production.6. 6/30/2016 strip through 2018 equates to $52.35.
Marcellus 1H2016 F&D:$0.55/Mcfe
Total Cash Costs $2.16/Mcfe
Unit Cash Cost vs. 3-Year Average Realized Pricing(1)(2)(3)(4)
All-in Price: $3.94/Mcfe
All-in Price: $4.18/McfeAll-in Price: $4.41/Mcfe
$0.40/Mcfe of FT cost delivers
$0.14/Mcf premium gas price realization
vs. Nymex 3-year strip pricing and a $0.92/Mcf premiumto local Dominion
South pricing
$3.23/McfAntero Realized Gas Price
$2.31/MMBtu6/30/16 Dom South3-year Strip Pricing
2
1
2
3
1
Enhance Margins with NGL Focus +
Firm Transport to Premium Markets +
Hedge to Support FT & Processing =
Hedging delivers $0.58 to $0.64 per Mcfe premium to realized prices
3
REALIZATIONS – DRIVEN BY INCREMENTAL COSTS
ASSET OVERVIEW
35
$1.55$1.36
$1.04
$0.000
$0.500
$1.000
$1.500
$2.000
2014 2015 Current
$MM
/1,0
00’ L
ater
al
Well Cost ($MM/1,000' of Lateral)
12% Decrease vs. 2014
24% Decrease vs. 2015
6641,235
691 940
69%
48%
24% 28%58%
38%17% 19%
0
400
800
1,200
1,600
0%
20%
40%
60%
80%
Highly-RichGas/
Condensate
Highly-Rich Gas Rich Gas Dry Gas
Tota
l 3P
Loca
tions
RO
R
Total 3P Locations ROR @ 6/30/2016 Strip Pricing - After Hedges ROR @ 6/30/2016 Strip Pricing - Before Hedges
184
98 108 161
263
24%
79% 84%70% 71%
21%
66% 62%49% 44%
0
100
200
300
0%20%40%60%80%
100%
Condensate Highly-RichGas/
Condensate
Highly-RichGas
Rich Gas Dry Gas
Tota
l 3P
Loca
tions
RO
R
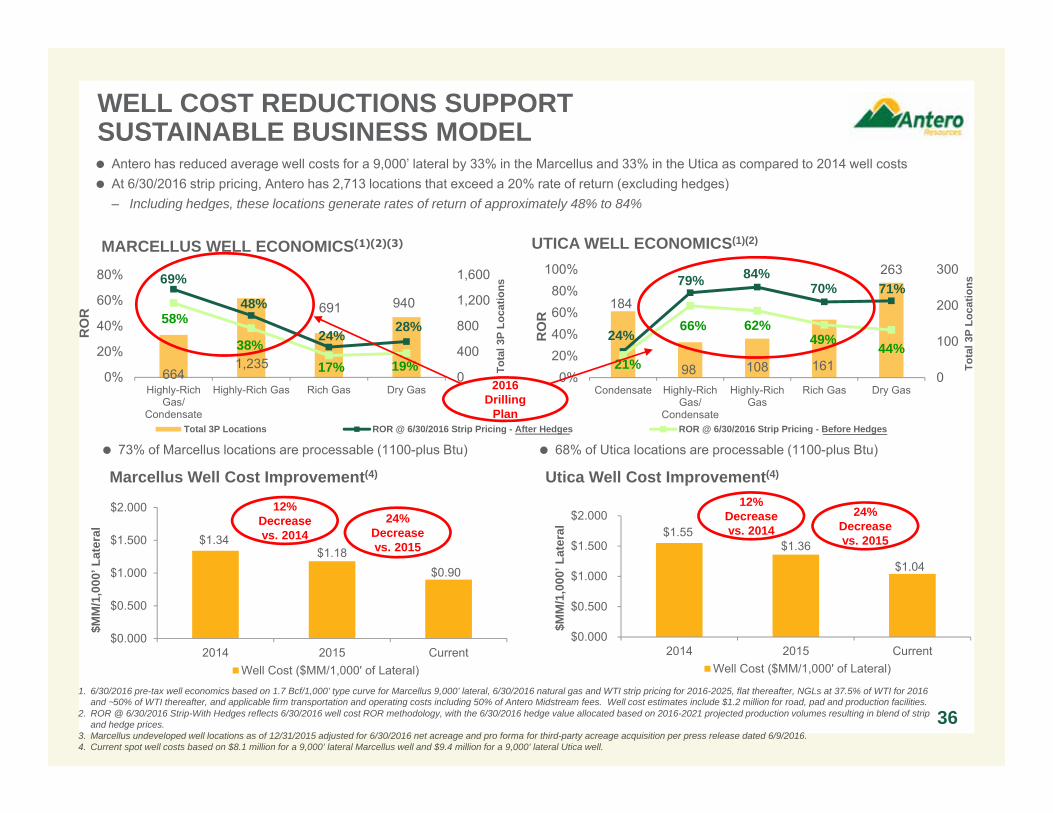
MARCELLUS WELL ECONOMICS(1)(2)(3)
WELL COST REDUCTIONS SUPPORTSUSTAINABLE BUSINESS MODEL
Marcellus Well Cost Improvement(4)
1. 6/30/2016 pre-tax well economics based on 1.7 Bcf/1,000’ type curve for Marcellus 9,000’ lateral, 6/30/2016 natural gas and WTI strip pricing for 2016-2025, flat thereafter, NGLs at 37.5% of WTI for 2016 and ~50% of WTI thereafter, and applicable firm transportation and operating costs including 50% of Antero Midstream fees. Well cost estimates include $1.2 million for road, pad and production facilities.
2. ROR @ 6/30/2016 Strip-With Hedges reflects 6/30/2016 well cost ROR methodology, with the 6/30/2016 hedge value allocated based on 2016-2021 projected production volumes resulting in blend of strip and hedge prices.
3. Marcellus undeveloped well locations as of 12/31/2015 adjusted for 6/30/2016 net acreage and pro forma for third-party acreage acquisition per press release dated 6/9/2016. 4. Current spot well costs based on $8.1 million for a 9,000’ lateral Marcellus well and $9.4 million for a 9,000’ lateral Utica well.
36
UTICA WELL ECONOMICS(1)(2)
73% of Marcellus locations are processable (1100-plus Btu) 68% of Utica locations are processable (1100-plus Btu)
2016Drilling
Plan
Antero has reduced average well costs for a 9,000’ lateral by 33% in the Marcellus and 33% in the Utica as compared to 2014 well costs At 6/30/2016 strip pricing, Antero has 2,713 locations that exceed a 20% rate of return (excluding hedges)
– Including hedges, these locations generate rates of return of approximately 48% to 84%
Utica Well Cost Improvement(4)
$1.34$1.18
$0.90
$0.000
$0.500
$1.000
$1.500
$2.000
2014 2015 Current
$MM
/1,0
00’ L
ater
al
Well Cost ($MM/1,000' of Lateral)
12% Decrease vs. 2014
24% Decrease vs. 2015
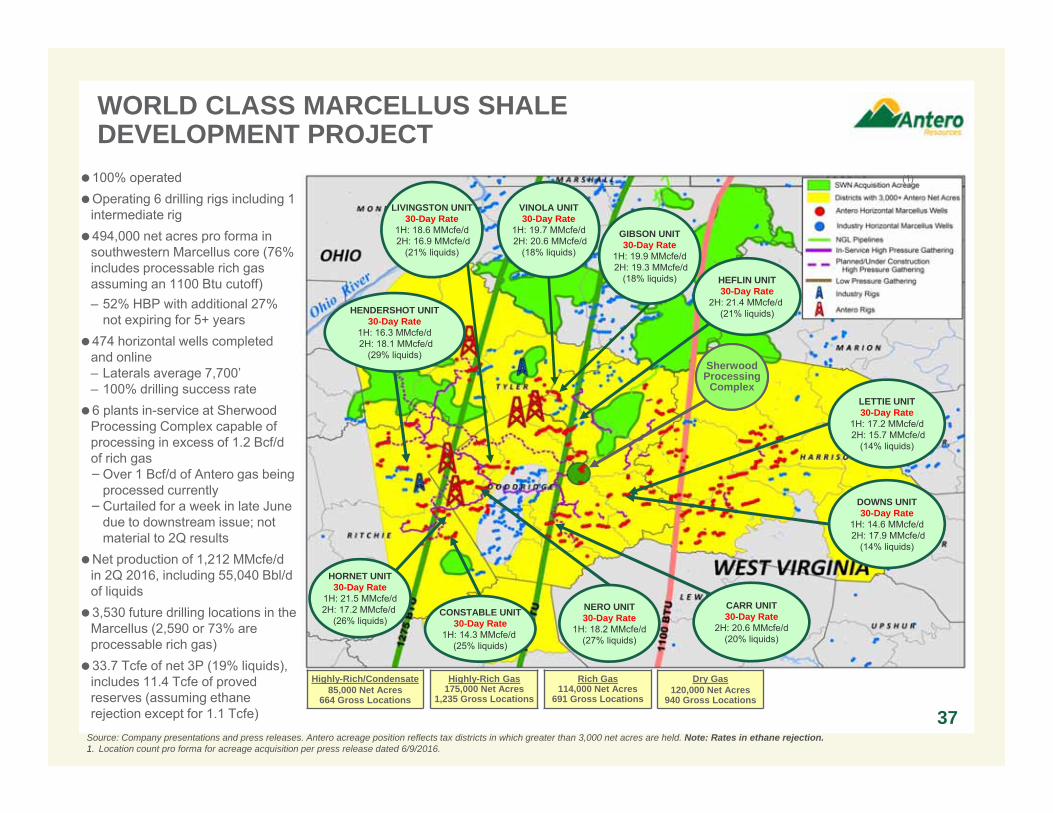
WORLD CLASS MARCELLUS SHALE DEVELOPMENT PROJECT
100% operatedOperating 6 drilling rigs including 1
intermediate rig494,000 net acres pro forma in
southwestern Marcellus core (76% includes processable rich gas assuming an 1100 Btu cutoff)– 52% HBP with additional 27%
not expiring for 5+ years474 horizontal wells completed
and online– Laterals average 7,700’– 100% drilling success rate6 plants in-service at Sherwood
Processing Complex capable of processing in excess of 1.2 Bcf/d of rich gas−Over 1 Bcf/d of Antero gas being
processed currently−Curtailed for a week in late June
due to downstream issue; not material to 2Q results
Net production of 1,212 MMcfe/d in 2Q 2016, including 55,040 Bbl/d of liquids 3,530 future drilling locations in the
Marcellus (2,590 or 73% are processable rich gas)33.7 Tcfe of net 3P (19% liquids),
includes 11.4 Tcfe of proved reserves (assuming ethane rejection except for 1.1 Tcfe)
Highly-Rich Gas175,000 Net Acres
1,235 Gross Locations
Rich Gas114,000 Net Acres
691 Gross Locations
Dry Gas120,000 Net Acres
940 Gross Locations
Highly-Rich/Condensate85,000 Net Acres
664 Gross Locations
HEFLIN UNIT30-Day Rate
2H: 21.4 MMcfe/d (21% liquids)
CONSTABLE UNIT30-Day Rate
1H: 14.3 MMcfe/d (25% liquids)
SherwoodProcessing
Complex
Source: Company presentations and press releases. Antero acreage position reflects tax districts in which greater than 3,000 net acres are held. Note: Rates in ethane rejection.1. Location count pro forma for acreage acquisition per press release dated 6/9/2016.
NERO UNIT30-Day Rate
1H: 18.2 MMcfe/d(27% liquids)
GIBSON UNIT30-Day Rate
1H: 19.9 MMcfe/d2H: 19.3 MMcfe/d
(18% liquids)
37
HENDERSHOT UNIT30-Day Rate
1H: 16.3 MMcfe/d2H: 18.1 MMcfe/d
(29% liquids)
HORNET UNIT30-Day Rate
1H: 21.5 MMcfe/d2H: 17.2 MMcfe/d
(26% liquids)CARR UNIT30-Day Rate
2H: 20.6 MMcfe/d(20% liquids)
LETTIE UNIT30-Day Rate
1H: 17.2 MMcfe/d2H: 15.7 MMcfe/d
(14% liquids)
(1)
VINOLA UNIT30-Day Rate
1H: 19.7 MMcfe/d2H: 20.6 MMcfe/d
(18% liquids)
DOWNS UNIT30-Day Rate
1H: 14.6 MMcfe/d2H: 17.9 MMcfe/d
(14% liquids)
LIVINGSTON UNIT30-Day Rate
1H: 18.6 MMcfe/d2H: 16.9 MMcfe/d
(21% liquids)
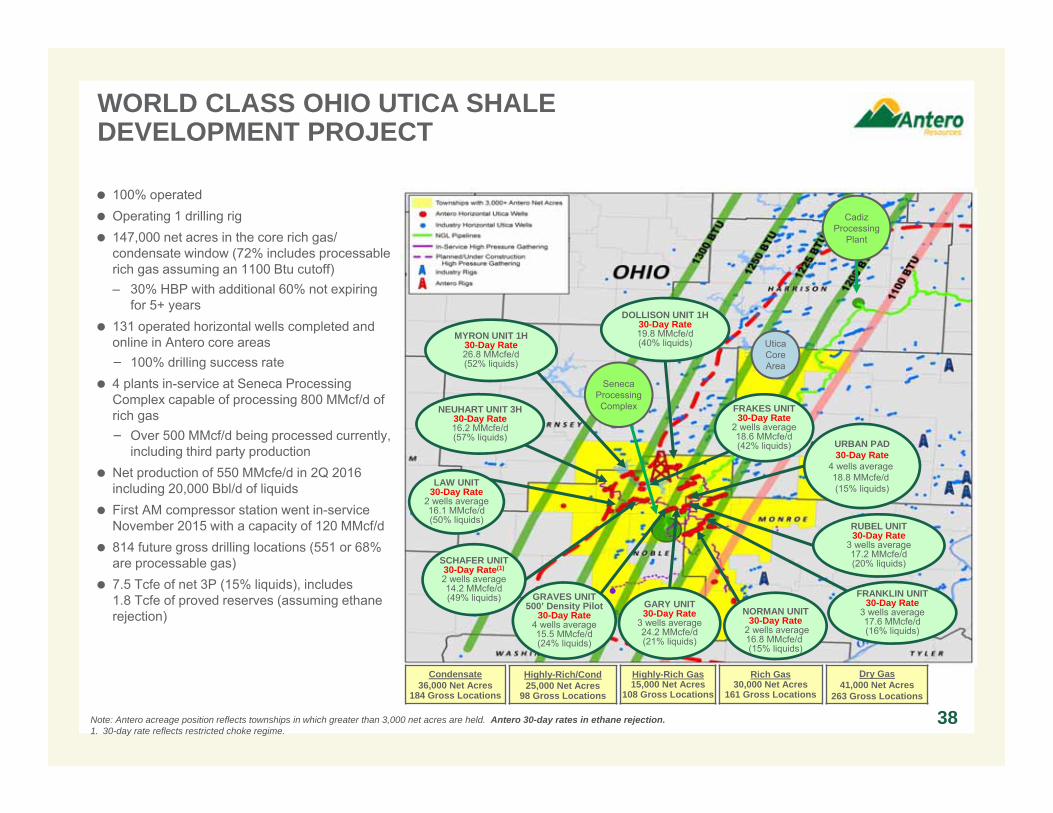
Note: Antero acreage position reflects townships in which greater than 3,000 net acres are held. Antero 30-day rates in ethane rejection.1. 30-day rate reflects restricted choke regime.
100% operated Operating 1 drilling rig 147,000 net acres in the core rich gas/
condensate window (72% includes processable rich gas assuming an 1100 Btu cutoff)– 30% HBP with additional 60% not expiring
for 5+ years 131 operated horizontal wells completed and
online in Antero core areas− 100% drilling success rate
4 plants in-service at Seneca Processing Complex capable of processing 800 MMcf/d of rich gas− Over 500 MMcf/d being processed currently,
including third party production Net production of 550 MMcfe/d in 2Q 2016
including 20,000 Bbl/d of liquids First AM compressor station went in-service
November 2015 with a capacity of 120 MMcf/d 814 future gross drilling locations (551 or 68%
are processable gas) 7.5 Tcfe of net 3P (15% liquids), includes
1.8 Tcfe of proved reserves (assuming ethane rejection)
WORLD CLASS OHIO UTICA SHALEDEVELOPMENT PROJECT
38
CadizProcessing
Plant
NORMAN UNIT30-Day Rate
2 wells average16.8 MMcfe/d (15% liquids)
RUBEL UNIT30-Day Rate
3 wells average17.2 MMcfe/d(20% liquids)
Utica Core Area
GARY UNIT30-Day Rate
3 wells average24.2 MMcfe/d(21% liquids)
Highly-Rich/Cond25,000 Net Acres
98 Gross Locations
Highly-Rich Gas15,000 Net Acres
108 Gross Locations
Rich Gas30,000 Net Acres
161 Gross Locations
Dry Gas41,000 Net Acres
263 Gross Locations
NEUHART UNIT 3H30-Day Rate16.2 MMcfe/d(57% liquids)
Condensate36,000 Net Acres
184 Gross Locations
DOLLISON UNIT 1H30-Day Rate19.8 MMcfe/d(40% liquids)
MYRON UNIT 1H30-Day Rate26.8 MMcfe/d(52% liquids)
SenecaProcessingComplex
LAW UNIT30-Day Rate
2 wells average16.1 MMcfe/d(50% liquids)
SCHAFER UNIT30-Day Rate(1)
2 wells average14.2 MMcfe/d(49% liquids)
URBAN PAD30-Day Rate
4 wells average 18.8 MMcfe/d (15% liquids)
GRAVES UNIT500’ Density Pilot
30-Day Rate4 wells average15.5 MMcfe/d(24% liquids)
FRANKLIN UNIT30-Day Rate
3 wells average17.6 MMcfe/d(16% liquids)
FRAKES UNIT30-Day Rate
2 wells average18.6 MMcfe/d(42% liquids)
39
Antero Midstream (NYSE: AM)Asset Overview
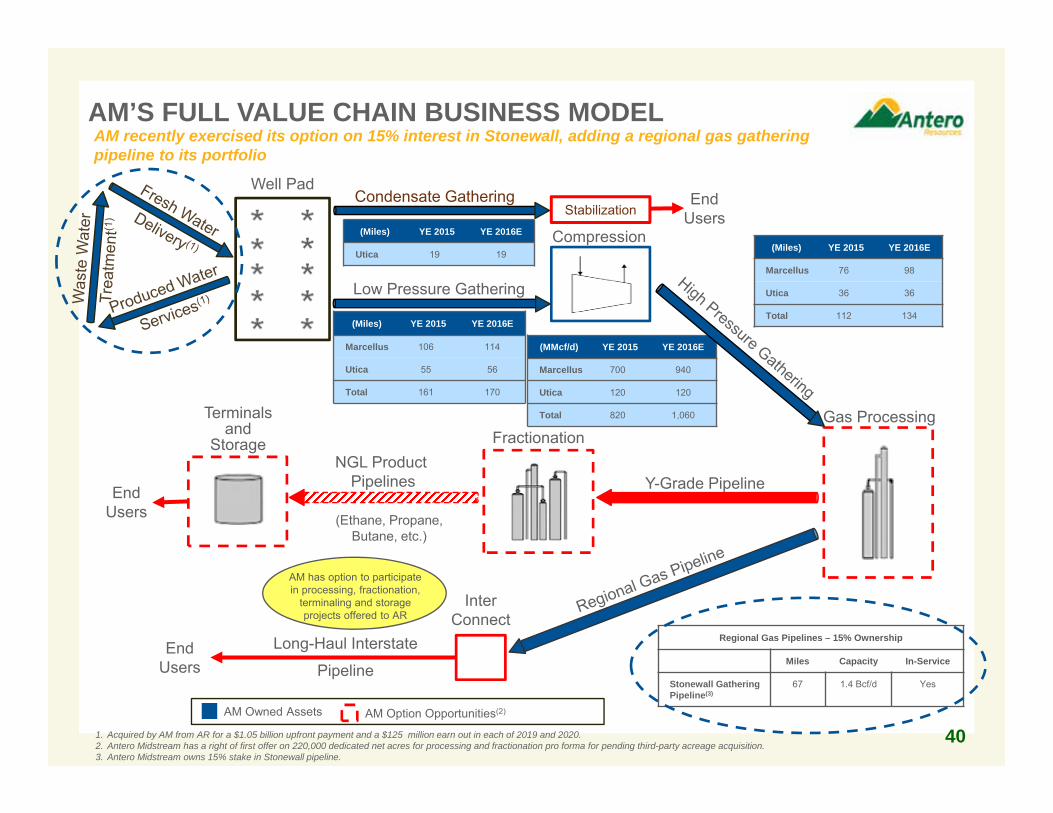
Regional Gas Pipelines – 15% Ownership
Miles Capacity In-Service
Stonewall Gathering Pipeline(3)
67 1.4 Bcf/d Yes
1. Acquired by AM from AR for a $1.05 billion upfront payment and a $125 million earn out in each of 2019 and 2020.2. Antero Midstream has a right of first offer on 220,000 dedicated net acres for processing and fractionation pro forma for pending third-party acreage acquisition.3. Antero Midstream owns 15% stake in Stonewall pipeline.
EndUsers
EndUsers
Gas Processing
Y-Grade Pipeline
Long-Haul Interstate
Pipeline
InterConnect
NGL Product Pipelines
Fractionation
Compression
Low Pressure Gathering
Well Pad
Terminalsand
Storage
(Miles) YE 2015 YE 2016E
Marcellus 106 114
Utica 55 56
Total 161 170
AM has option to participate in processing, fractionation,
terminaling and storage projects offered to AR
(Miles) YE 2015 YE 2016E
Marcellus 76 98
Utica 36 36
Total 112 134
(MMcf/d) YE 2015 YE 2016E
Marcellus 700 940
Utica 120 120
Total 820 1,060
AM Owned Assets
Condensate GatheringStabilization
(Miles) YE 2015 YE 2016E
Utica 19 19
EndUsers
(Ethane, Propane, Butane, etc.)
40AM Option Opportunities(2)
AM recently exercised its option on 15% interest in Stonewall, adding a regional gas gathering pipeline to its portfolio
AM’S FULL VALUE CHAIN BUSINESS MODEL
1. Represents inception to date actuals as of 12/31/2015 and 2016 guidance.2. Includes both expansion capital and maintenance capital.
41
UticaShale
MarcellusShale
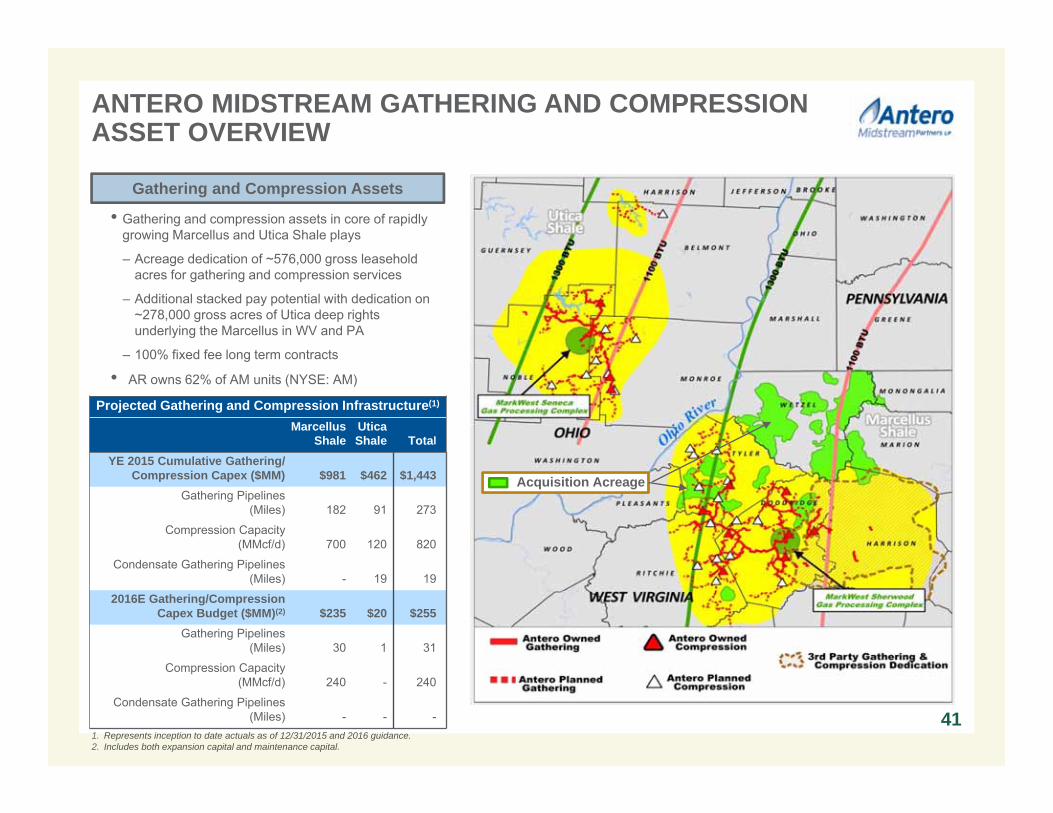
Projected Gathering and Compression Infrastructure(1)
Marcellus Shale
Utica Shale Total
YE 2015 Cumulative Gathering/ Compression Capex ($MM) $981 $462 $1,443
Gathering Pipelines(Miles) 182 91 273
Compression Capacity(MMcf/d) 700 120 820
Condensate Gathering Pipelines (Miles) - 19 19
2016E Gathering/Compression Capex Budget ($MM)(2) $235 $20 $255
Gathering Pipelines (Miles) 30 1 31
Compression Capacity(MMcf/d) 240 - 240
Condensate Gathering Pipelines (Miles) - - -
Gathering and Compression Assets
ANTERO MIDSTREAM GATHERING AND COMPRESSION ASSET OVERVIEW
• Gathering and compression assets in core of rapidly growing Marcellus and Utica Shale plays
– Acreage dedication of ~576,000 gross leasehold acres for gathering and compression services
– Additional stacked pay potential with dedication on ~278,000 gross acres of Utica deep rights underlying the Marcellus in WV and PA
– 100% fixed fee long term contracts
• AR owns 62% of AM units (NYSE: AM)
Acquisition Acreage
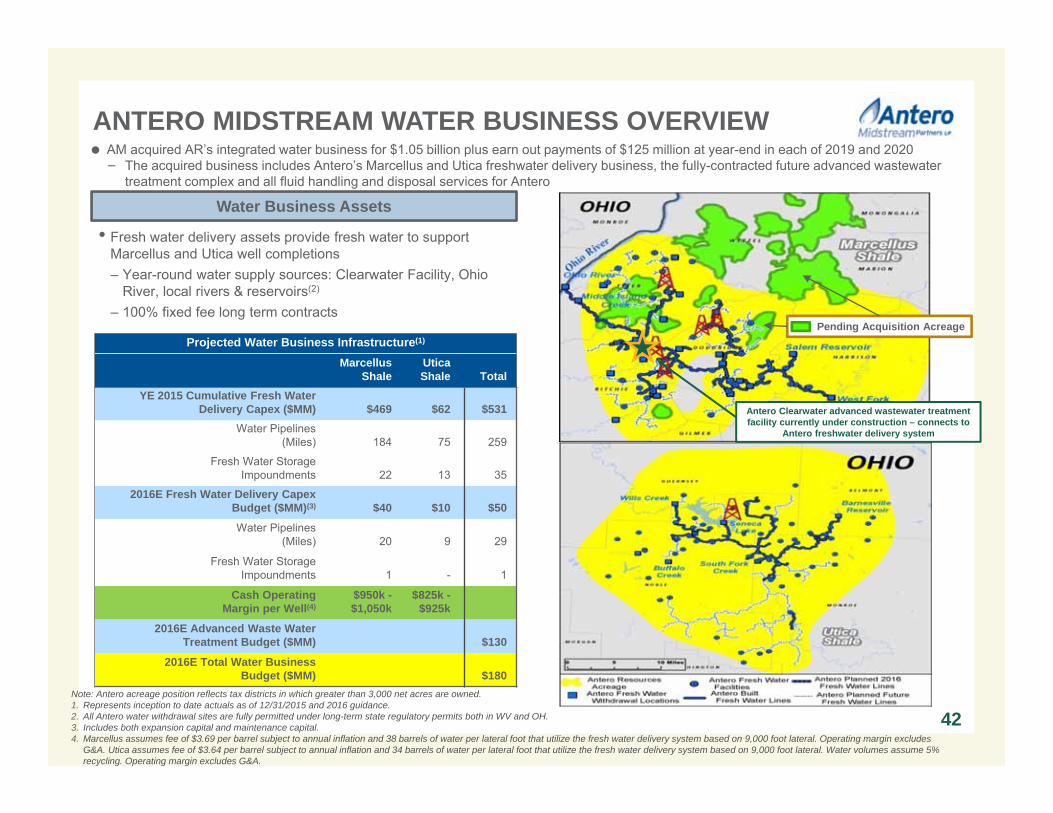
ANTERO MIDSTREAM WATER BUSINESS OVERVIEW
Note: Antero acreage position reflects tax districts in which greater than 3,000 net acres are owned.1. Represents inception to date actuals as of 12/31/2015 and 2016 guidance.2. All Antero water withdrawal sites are fully permitted under long-term state regulatory permits both in WV and OH. 3. Includes both expansion capital and maintenance capital. 4. Marcellus assumes fee of $3.69 per barrel subject to annual inflation and 38 barrels of water per lateral foot that utilize the fresh water delivery system based on 9,000 foot lateral. Operating margin excludes
G&A. Utica assumes fee of $3.64 per barrel subject to annual inflation and 34 barrels of water per lateral foot that utilize the fresh water delivery system based on 9,000 foot lateral. Water volumes assume 5% recycling. Operating margin excludes G&A.
AM acquired AR’s integrated water business for $1.05 billion plus earn out payments of $125 million at year-end in each of 2019 and 2020− The acquired business includes Antero’s Marcellus and Utica freshwater delivery business, the fully-contracted future advanced wastewater
treatment complex and all fluid handling and disposal services for Antero
Projected Water Business Infrastructure(1)
Marcellus Shale
Utica Shale Total
YE 2015 Cumulative Fresh WaterDelivery Capex ($MM) $469 $62 $531
Water Pipelines(Miles) 184 75 259
Fresh Water StorageImpoundments 22 13 35
2016E Fresh Water Delivery Capex Budget ($MM)(3) $40 $10 $50
Water Pipelines(Miles) 20 9 29
Fresh Water StorageImpoundments 1 - 1
Cash Operating Margin per Well(4)
$950k -$1,050k
$825k -$925k
2016E Advanced Waste Water Treatment Budget ($MM) $130
2016E Total Water Business Budget ($MM) $180
Water Business Assets
• Fresh water delivery assets provide fresh water to support Marcellus and Utica well completions– Year-round water supply sources: Clearwater Facility, Ohio
River, local rivers & reservoirs(2)
– 100% fixed fee long term contracts
Antero Clearwater advanced wastewater treatment facility currently under construction – connects to
Antero freshwater delivery system
Pending Acquisition Acreage
42
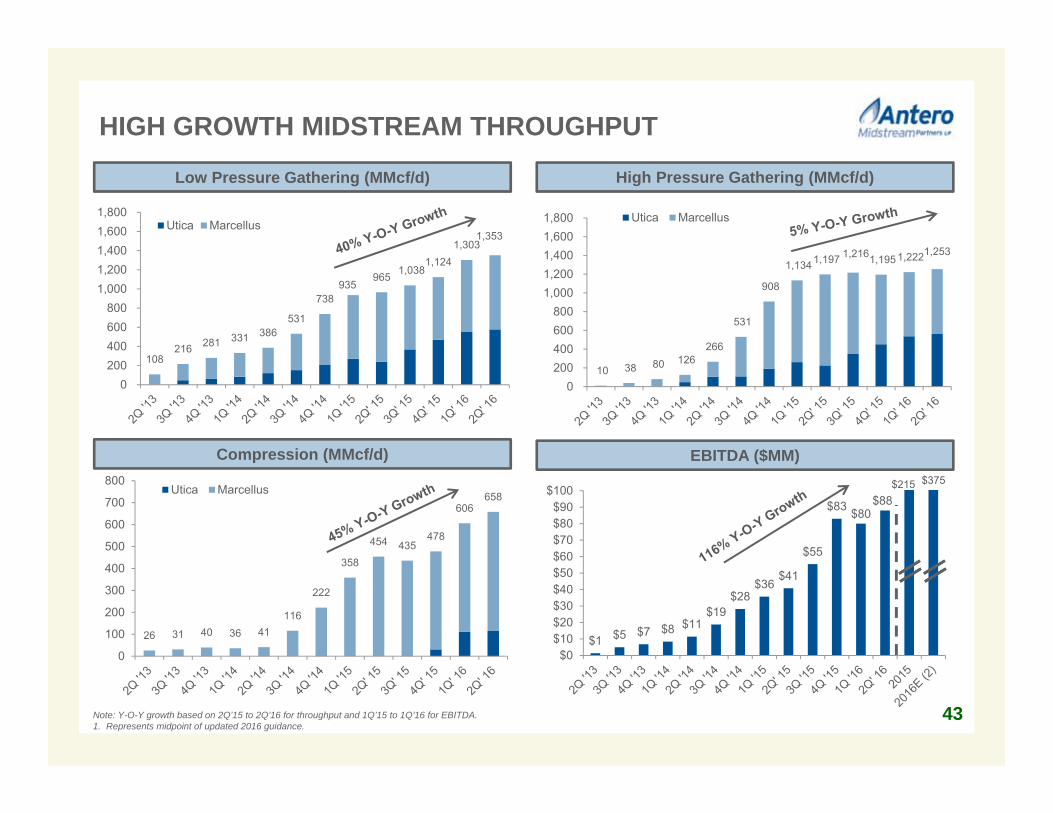
$1 $5 $7 $8 $11$19
$28$36
$41
$55
$83 $80$88
$0$10$20$30$40$50$60$70$80$90
$100
26 31 40 36 41 116
222
358
454 435478
606 658
0
100
200
300
400
500
600
700
800Utica Marcellus
10 38 80 126 266
531
908
1,134 1,197 1,216 1,195 1,222 1,253
0200400600800
1,0001,2001,4001,6001,800 Utica Marcellus
108 216 281 331 386
531
738 935
965 1,038 1,124
1,303 1,353
0200400600800
1,0001,2001,4001,6001,800
Utica Marcellus
Low Pressure Gathering (MMcf/d)
Compression (MMcf/d)
High Pressure Gathering (MMcf/d)
EBITDA ($MM)
43
$375
Note: Y-O-Y growth based on 2Q’15 to 2Q’16 for throughput and 1Q’15 to 1Q’16 for EBITDA. 1. Represents midpoint of updated 2016 guidance.
HIGH GROWTH MIDSTREAM THROUGHPUT
$215
0.0x0.5x1.0x1.5x2.0x2.5x3.0x3.5x4.0x4.5x
Peer 1 Peer 2 Peer 3 Peer 4 Peer 5 Peer 6 Peer 7
Tota
l Deb
t / L
TM A
djus
ted
EBIT
DA
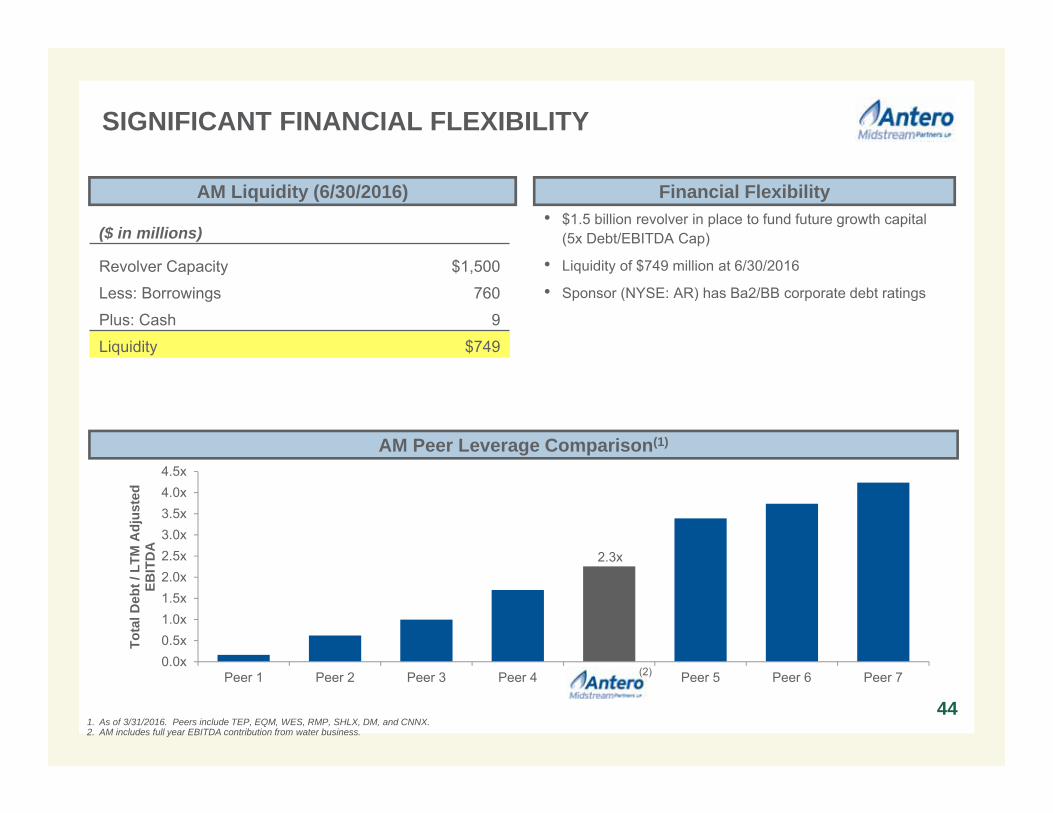
• $1.5 billion revolver in place to fund future growth capital (5x Debt/EBITDA Cap)
• Liquidity of $749 million at 6/30/2016
• Sponsor (NYSE: AR) has Ba2/BB corporate debt ratings
AM Liquidity (6/30/2016)
AM Peer Leverage Comparison(1)
($ in millions)
Revolver Capacity $1,500
Less: Borrowings 760
Plus: Cash 9
Liquidity $749
1. As of 3/31/2016. Peers include TEP, EQM, WES, RMP, SHLX, DM, and CNNX.2. AM includes full year EBITDA contribution from water business.
Financial Flexibility
44
(2)
SIGNIFICANT FINANCIAL FLEXIBILITY
2.3x
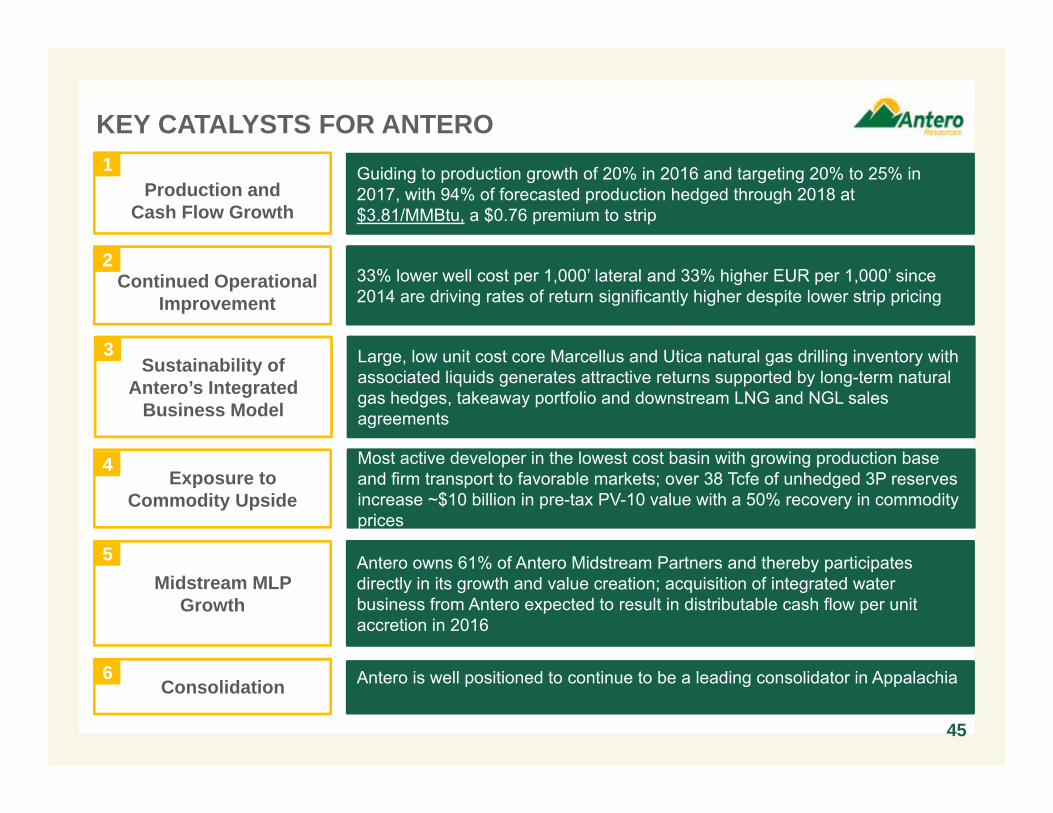
Continued OperationalImprovement
Production andCash Flow Growth
KEY CATALYSTS FOR ANTEROGuiding to production growth of 20% in 2016 and targeting 20% to 25% in 2017, with 94% of forecasted production hedged through 2018 at $3.81/MMBtu, a $0.76 premium to strip
Large, low unit cost core Marcellus and Utica natural gas drilling inventory with associated liquids generates attractive returns supported by long-term natural gas hedges, takeaway portfolio and downstream LNG and NGL sales agreements
33% lower well cost per 1,000’ lateral and 33% higher EUR per 1,000’ since 2014 are driving rates of return significantly higher despite lower strip pricing
Antero owns 61% of Antero Midstream Partners and thereby participates directly in its growth and value creation; acquisition of integrated water business from Antero expected to result in distributable cash flow per unit accretion in 2016
Midstream MLP Growth
Sustainability of Antero’s Integrated
Business Model
3
1
2
5
4Exposure to
Commodity Upside
Antero is well positioned to continue to be a leading consolidator in Appalachia6Consolidation
45
Most active developer in the lowest cost basin with growing production base and firm transport to favorable markets; over 38 Tcfe of unhedged 3P reserves increase ~$10 billion in pre-tax PV-10 value with a 50% recovery in commodity prices
46
APPENDIX
46
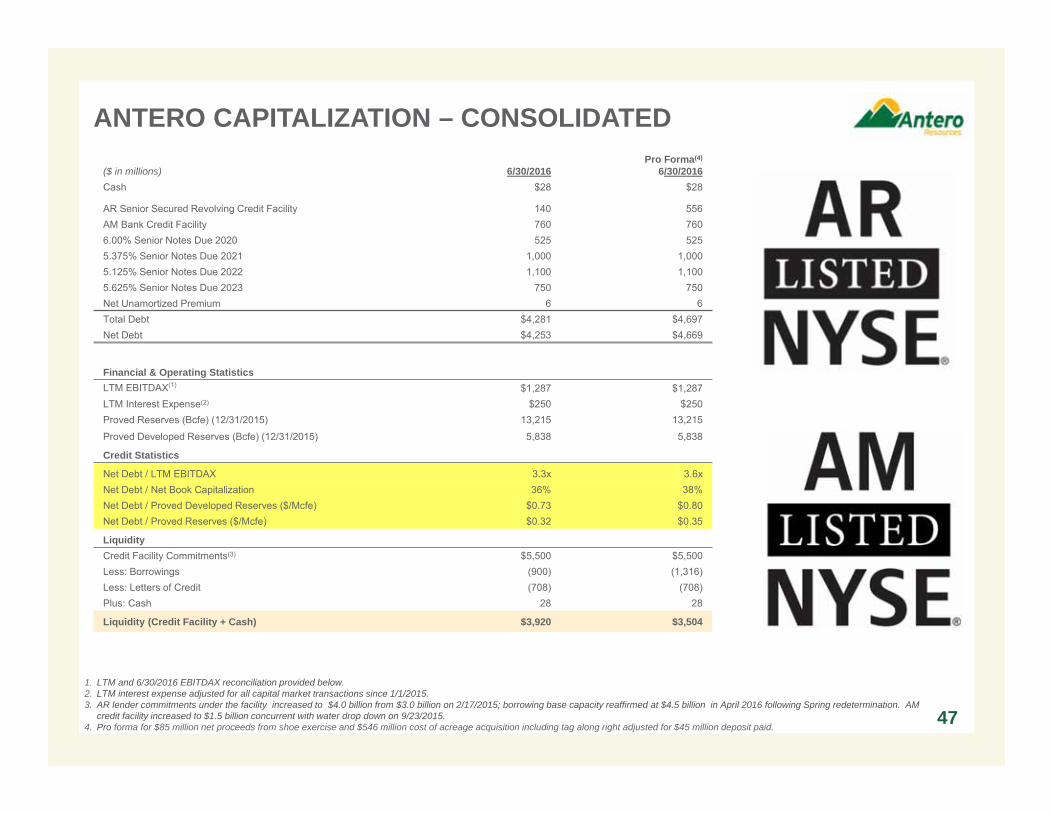
($ in millions) 6/30/2016 Pro Forma(4)
6/30/2016 Cash $28 $28
AR Senior Secured Revolving Credit Facility 140 556AM Bank Credit Facility 760 7606.00% Senior Notes Due 2020 525 5255.375% Senior Notes Due 2021 1,000 1,0005.125% Senior Notes Due 2022 1,100 1,1005.625% Senior Notes Due 2023 750 750Net Unamortized Premium 6 6Total Debt $4,281 $4,697Net Debt $4,253 $4,669
Financial & Operating StatisticsLTM EBITDAX(1) $1,287 $1,287LTM Interest Expense(2) $250 $250Proved Reserves (Bcfe) (12/31/2015) 13,215 13,215
Proved Developed Reserves (Bcfe) (12/31/2015) 5,838 5,838
Credit Statistics
Net Debt / LTM EBITDAX 3.3x 3.6xNet Debt / Net Book Capitalization 36% 38%Net Debt / Proved Developed Reserves ($/Mcfe) $0.73 $0.80Net Debt / Proved Reserves ($/Mcfe) $0.32 $0.35
LiquidityCredit Facility Commitments(3) $5,500 $5,500Less: Borrowings (900) (1,316)Less: Letters of Credit (708) (708)Plus: Cash 28 28
Liquidity (Credit Facility + Cash) $3,920 $3,504
ANTERO CAPITALIZATION – CONSOLIDATED
1. LTM and 6/30/2016 EBITDAX reconciliation provided below.2. LTM interest expense adjusted for all capital market transactions since 1/1/2015.3. AR lender commitments under the facility increased to $4.0 billion from $3.0 billion on 2/17/2015; borrowing base capacity reaffirmed at $4.5 billion in April 2016 following Spring redetermination. AM
credit facility increased to $1.5 billion concurrent with water drop down on 9/23/2015.4. Pro forma for $85 million net proceeds from shoe exercise and $546 million cost of acreage acquisition including tag along right adjusted for $45 million deposit paid.
47
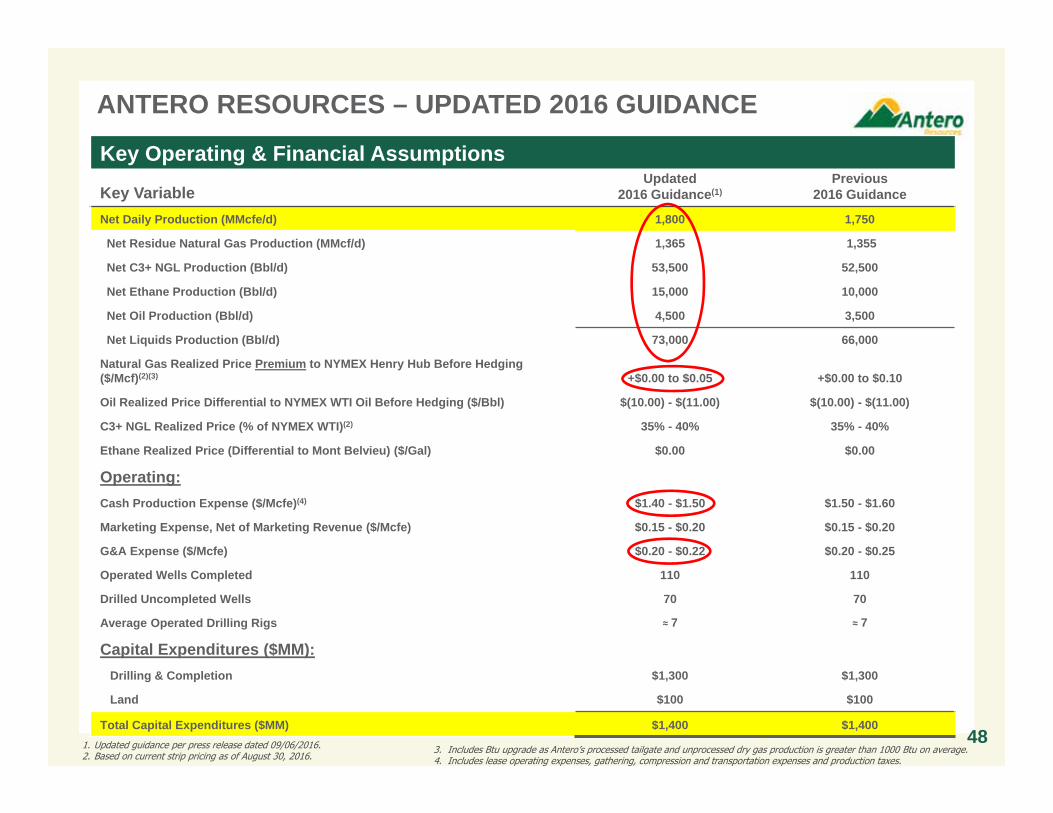
ANTERO RESOURCES – UPDATED 2016 GUIDANCE
Key VariableUpdated
2016 Guidance(1)Previous
2016 Guidance
Net Daily Production (MMcfe/d) 1,800 1,750
Net Residue Natural Gas Production (MMcf/d) 1,365 1,355
Net C3+ NGL Production (Bbl/d) 53,500 52,500
Net Ethane Production (Bbl/d) 15,000 10,000
Net Oil Production (Bbl/d) 4,500 3,500
Net Liquids Production (Bbl/d) 73,000 66,000
Natural Gas Realized Price Premium to NYMEX Henry Hub Before Hedging ($/Mcf)(2)(3) +$0.00 to $0.05 +$0.00 to $0.10
Oil Realized Price Differential to NYMEX WTI Oil Before Hedging ($/Bbl) $(10.00) - $(11.00) $(10.00) - $(11.00)
C3+ NGL Realized Price (% of NYMEX WTI)(2) 35% - 40% 35% - 40%
Ethane Realized Price (Differential to Mont Belvieu) ($/Gal) $0.00 $0.00
Operating:Cash Production Expense ($/Mcfe)(4) $1.40 - $1.50 $1.50 - $1.60
Marketing Expense, Net of Marketing Revenue ($/Mcfe) $0.15 - $0.20 $0.15 - $0.20
G&A Expense ($/Mcfe) $0.20 - $0.22 $0.20 - $0.25
Operated Wells Completed 110 110
Drilled Uncompleted Wells 70 70
Average Operated Drilling Rigs ≈ 7 ≈ 7
Capital Expenditures ($MM):Drilling & Completion $1,300 $1,300
Land $100 $100
Total Capital Expenditures ($MM) $1,400 $1,400
Key Operating & Financial Assumptions
3. Includes Btu upgrade as Antero’s processed tailgate and unprocessed dry gas production is greater than 1000 Btu on average. 4. Includes lease operating expenses, gathering, compression and transportation expenses and production taxes.
1. Updated guidance per press release dated 09/06/2016. 2. Based on current strip pricing as of August 30, 2016.
48
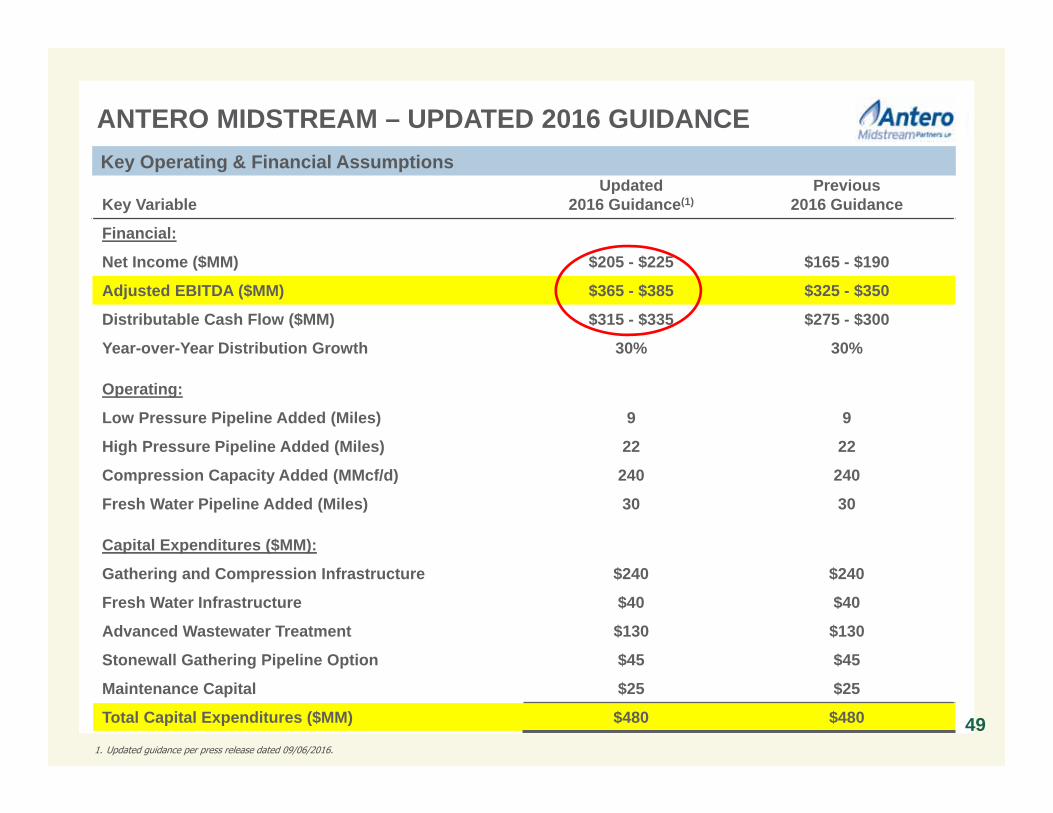
Key VariableUpdated
2016 Guidance(1)Previous
2016 Guidance
Financial:
Net Income ($MM) $205 - $225 $165 - $190
Adjusted EBITDA ($MM) $365 - $385 $325 - $350
Distributable Cash Flow ($MM) $315 - $335 $275 - $300
Year-over-Year Distribution Growth 30% 30%
Operating:
Low Pressure Pipeline Added (Miles) 9 9
High Pressure Pipeline Added (Miles) 22 22
Compression Capacity Added (MMcf/d) 240 240
Fresh Water Pipeline Added (Miles) 30 30
Capital Expenditures ($MM):
Gathering and Compression Infrastructure $240 $240
Fresh Water Infrastructure $40 $40
Advanced Wastewater Treatment $130 $130
Stonewall Gathering Pipeline Option $45 $45
Maintenance Capital $25 $25
Total Capital Expenditures ($MM) $480 $480
ANTERO MIDSTREAM – UPDATED 2016 GUIDANCEKey Operating & Financial Assumptions
1. Updated guidance per press release dated 09/06/2016.
49
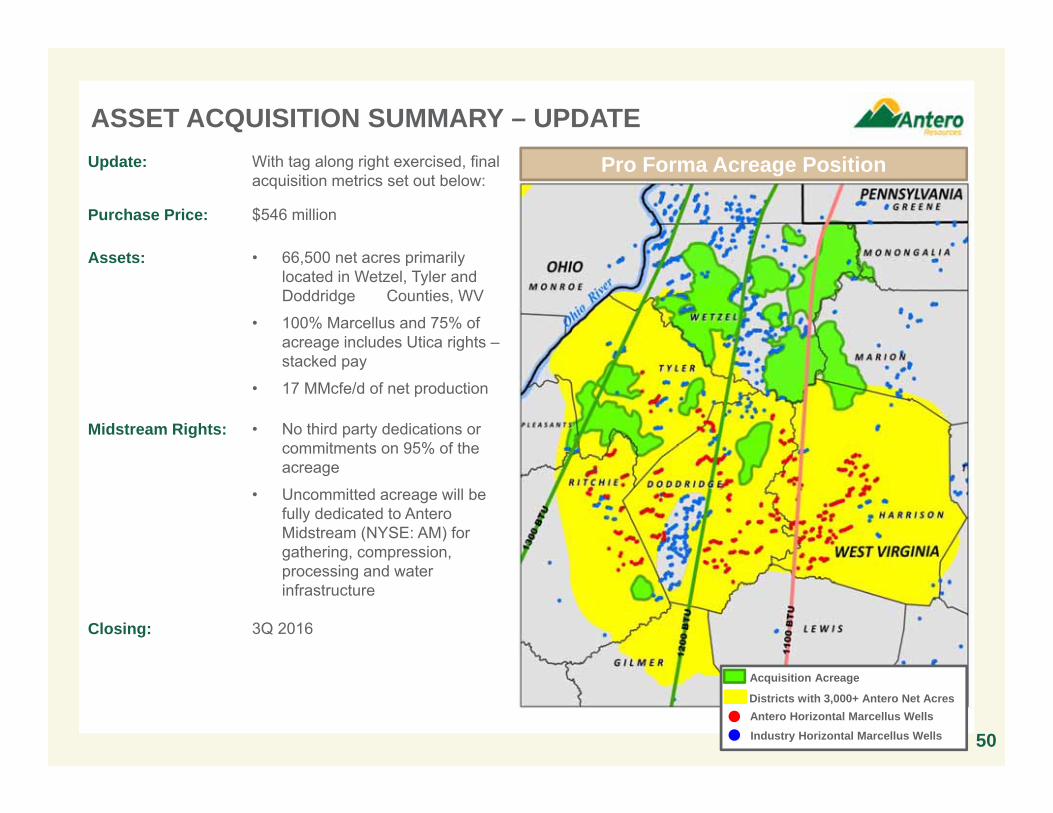
ASSET ACQUISITION SUMMARY – UPDATE
50
Pro Forma Acreage Position
Antero Horizontal Marcellus WellsIndustry Horizontal Marcellus Wells
Acquisition Acreage
Districts with 3,000+ Antero Net Acres
Update: With tag along right exercised, final acquisition metrics set out below:
Purchase Price: $546 million
Assets: • 66,500 net acres primarily located in Wetzel, Tyler and Doddridge Counties, WV
• 100% Marcellus and 75% of acreage includes Utica rights –stacked pay
• 17 MMcfe/d of net production
Midstream Rights: • No third party dedications or commitments on 95% of the acreage
• Uncommitted acreage will be fully dedicated to Antero Midstream (NYSE: AM) for gathering, compression, processing and water infrastructure
Closing: 3Q 2016
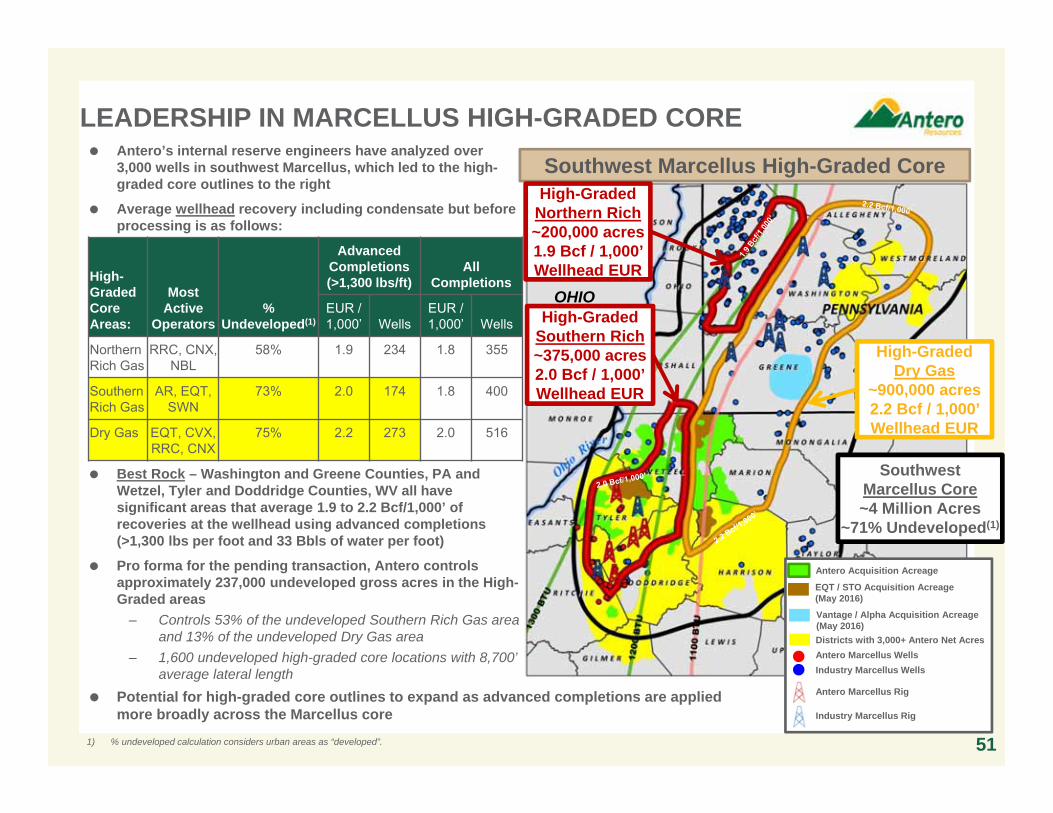
Antero’s internal reserve engineers have analyzed over 3,000 wells in southwest Marcellus, which led to the high-graded core outlines to the right
Average wellhead recovery including condensate but before processing is as follows:
Best Rock – Washington and Greene Counties, PA and Wetzel, Tyler and Doddridge Counties, WV all have significant areas that average 1.9 to 2.2 Bcf/1,000’ of recoveries at the wellhead using advanced completions (>1,300 lbs per foot and 33 Bbls of water per foot)
Pro forma for the pending transaction, Antero controls approximately 237,000 undeveloped gross acres in the High-Graded areas
– Controls 53% of the undeveloped Southern Rich Gas area and 13% of the undeveloped Dry Gas area
– 1,600 undeveloped high-graded core locations with 8,700’ average lateral length
Southwest Marcellus High-Graded Core
High-Graded Dry Gas
~900,000 acres2.2 Bcf / 1,000’ Wellhead EUR
Districts with 3,000+ Antero Net AcresAntero Marcellus WellsIndustry Marcellus Wells
Antero Acquisition Acreage
Antero Marcellus Rig
Industry Marcellus Rig
High-Graded Core Areas:
Most Active
Operators%
Undeveloped(1)
Advanced Completions (>1,300 lbs/ft)
All Completions
EUR / 1,000’ Wells
EUR / 1,000’ Wells
Northern Rich Gas
RRC, CNX, NBL
58% 1.9 234 1.8 355
Southern Rich Gas
AR, EQT, SWN
73% 2.0 174 1.8 400
Dry Gas EQT, CVX, RRC, CNX
75% 2.2 273 2.0 516
High-Graded Northern Rich ~200,000 acres1.9 Bcf / 1,000’ Wellhead EUR
OHIO
EQT / STO Acquisition Acreage (May 2016)
Vantage / Alpha Acquisition Acreage (May 2016)
High-GradedSouthern Rich ~375,000 acres2.0 Bcf / 1,000’Wellhead EUR
Southwest Marcellus Core~4 Million Acres
~71% Undeveloped(1)
1) % undeveloped calculation considers urban areas as “developed”.
OHIO
Potential for high-graded core outlines to expand as advanced completions are applied more broadly across the Marcellus core
LEADERSHIP IN MARCELLUS HIGH-GRADED CORE
51
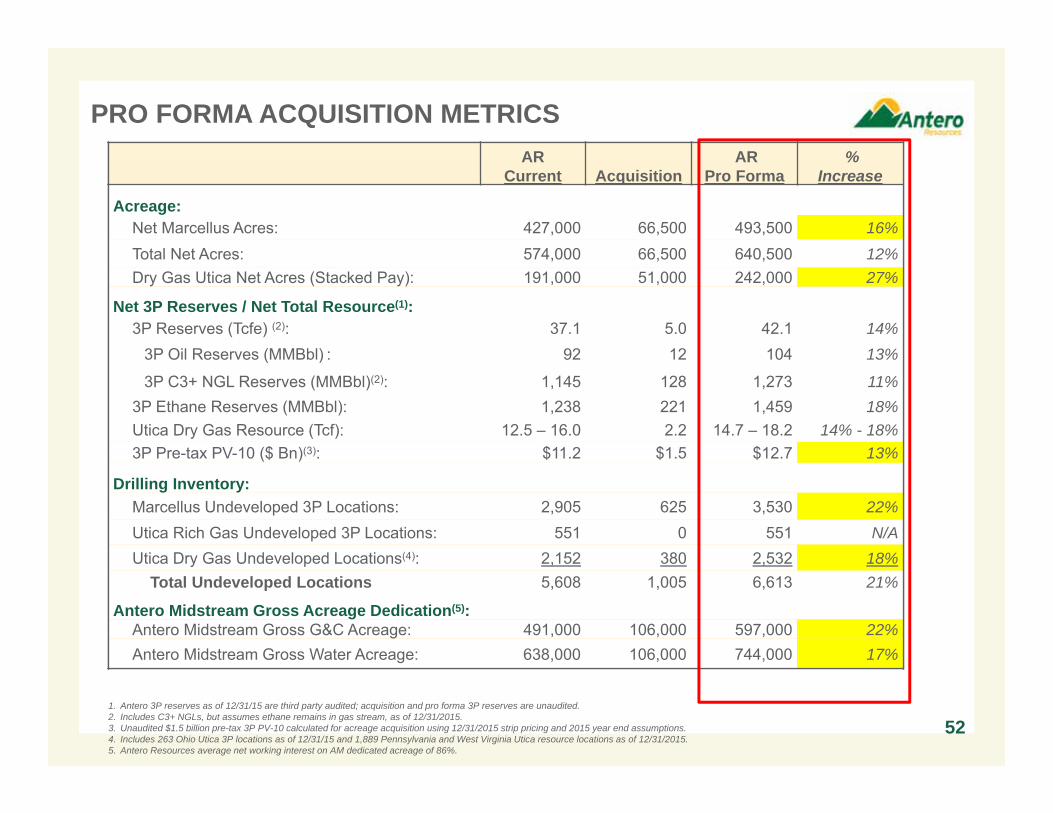
ARCurrent Acquisition
ARPro Forma
% Increase
Acreage:Net Marcellus Acres: 427,000 66,500 493,500 16%Total Net Acres: 574,000 66,500 640,500 12%Dry Gas Utica Net Acres (Stacked Pay): 191,000 51,000 242,000 27%
Net 3P Reserves / Net Total Resource(1):3P Reserves (Tcfe) (2): 37.1 5.0 42.1 14%
3P Oil Reserves (MMBbl) : 92 12 104 13%
3P C3+ NGL Reserves (MMBbl)(2): 1,145 128 1,273 11%3P Ethane Reserves (MMBbl): 1,238 221 1,459 18%Utica Dry Gas Resource (Tcf): 12.5 – 16.0 2.2 14.7 – 18.2 14% - 18%3P Pre-tax PV-10 ($ Bn)(3): $11.2 $1.5 $12.7 13%
Drilling Inventory:Marcellus Undeveloped 3P Locations: 2,905 625 3,530 22%Utica Rich Gas Undeveloped 3P Locations: 551 0 551 N/AUtica Dry Gas Undeveloped Locations(4): 2,152 380 2,532 18%
Total Undeveloped Locations 5,608 1,005 6,613 21%
Antero Midstream Gross Acreage Dedication(5):Antero Midstream Gross G&C Acreage: 491,000 106,000 597,000 22%Antero Midstream Gross Water Acreage: 638,000 106,000 744,000 17%
PRO FORMA ACQUISITION METRICS
521. Antero 3P reserves as of 12/31/15 are third party audited; acquisition and pro forma 3P reserves are unaudited. 2. Includes C3+ NGLs, but assumes ethane remains in gas stream, as of 12/31/2015. 3. Unaudited $1.5 billion pre-tax 3P PV-10 calculated for acreage acquisition using 12/31/2015 strip pricing and 2015 year end assumptions. 4. Includes 263 Ohio Utica 3P locations as of 12/31/15 and 1,889 Pennsylvania and West Virginia Utica resource locations as of 12/31/2015.5. Antero Resources average net working interest on AM dedicated acreage of 86%.
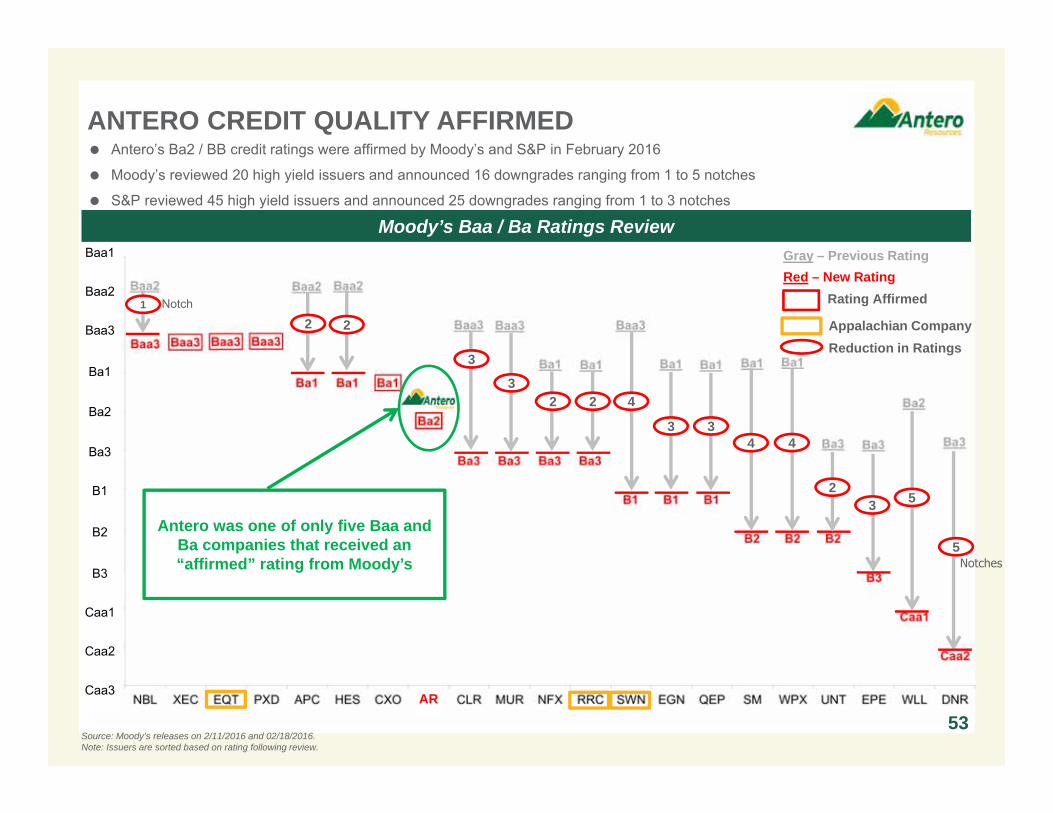
53
Moody’s Baa / Ba Ratings Review
Source: Moody’s releases on 2/11/2016 and 02/18/2016.Note: Issuers are sorted based on rating following review.
Antero’s Ba2 / BB credit ratings were affirmed by Moody’s and S&P in February 2016
Moody’s reviewed 20 high yield issuers and announced 16 downgrades ranging from 1 to 5 notches
S&P reviewed 45 high yield issuers and announced 25 downgrades ranging from 1 to 3 notches
Antero was one of only five Baa and Ba companies that received an “affirmed” rating from Moody’s
AR
Rating Affirmed
Baa1
Baa2
Baa3
Ba1
Ba2
Ba3
B1
B2
B3
Caa1
Caa2
Caa3
Gray – Previous RatingRed – New Rating
Appalachian Company1
2 2
5
532
4433
4223
3Reduction in Ratings
ANTERO CREDIT QUALITY AFFIRMED
Notch
Notches
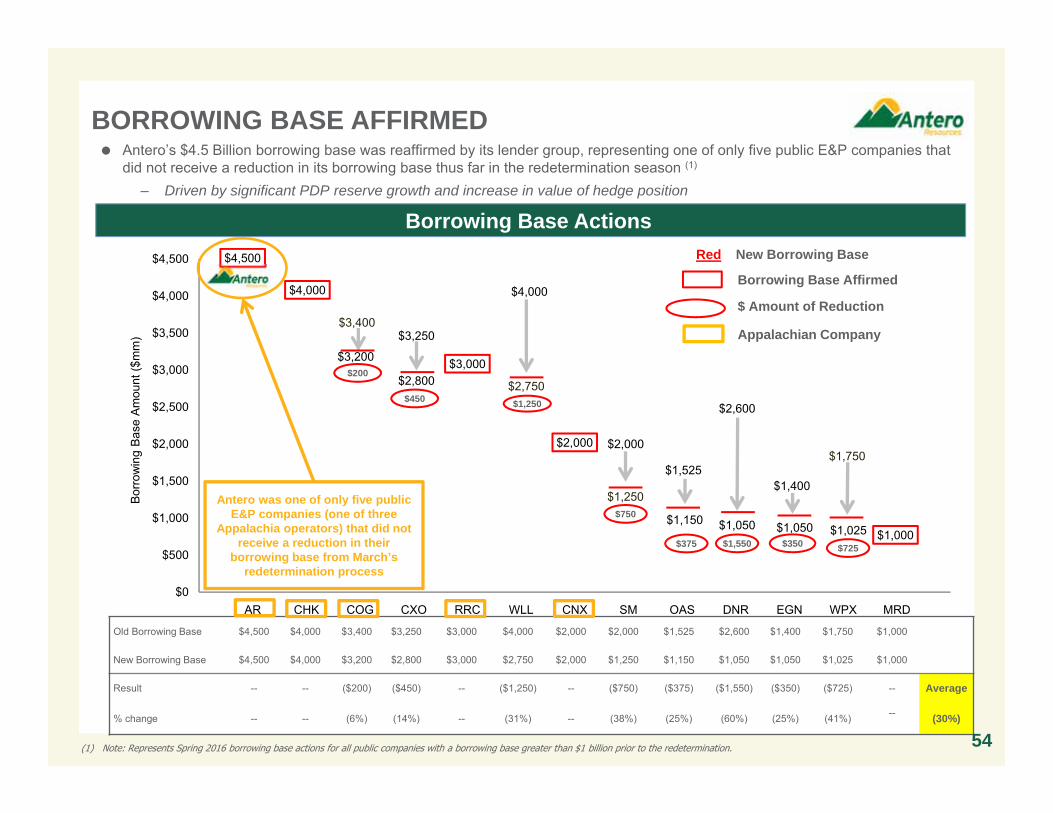
Old Borrowing Base $4,500 $4,000 $3,400 $3,250 $3,000 $4,000 $2,000 $2,000 $1,525 $2,600 $1,400 $1,750 $1,000
New Borrowing Base $4,500 $4,000 $3,200 $2,800 $3,000 $2,750 $2,000 $1,250 $1,150 $1,050 $1,050 $1,025 $1,000
Result -- -- ($200) ($450) -- ($1,250) -- ($750) ($375) ($1,550) ($350) ($725) -- Average
% change -- -- (6%) (14%) -- (31%) -- (38%) (25%) (60%) (25%) (41%) -- (30%)
Borrowing Base Actions
(1) Note: Represents Spring 2016 borrowing base actions for all public companies with a borrowing base greater than $1 billion prior to the redetermination.
Antero’s $4.5 Billion borrowing base was reaffirmed by its lender group, representing one of only five public E&P companies thatdid not receive a reduction in its borrowing base thus far in the redetermination season (1)
– Driven by significant PDP reserve growth and increase in value of hedge position
54
$2,800$3,000
$2,000
$1,150 $1,050 $1,050 $1,025
$4,000
$4,500
$4,000
$3,200
$3,250
$2,000
$1,525
$2,600
$1,400
$1,000
AR CHK COG CXO RRC WLL CNX SM OAS DNR EGN WPX MRD$0
$500
$1,000
$1,500
$2,000
$2,500
$3,000
$3,500
$4,000
$4,500
Bor
row
ing
Bas
e A
mou
nt ($
mm
)
$3,400
$1,250Antero was one of only five public E&P companies (one of three
Appalachia operators) that did not receive a reduction in their
borrowing base from March’s redetermination process
Red New Borrowing Base
Borrowing Base Affirmed
$450 $1,250
$350
$ Amount of Reduction
$725$1,550$375
$750
$200$2,750
$1,750
Appalachian Company
BORROWING BASE AFFIRMED
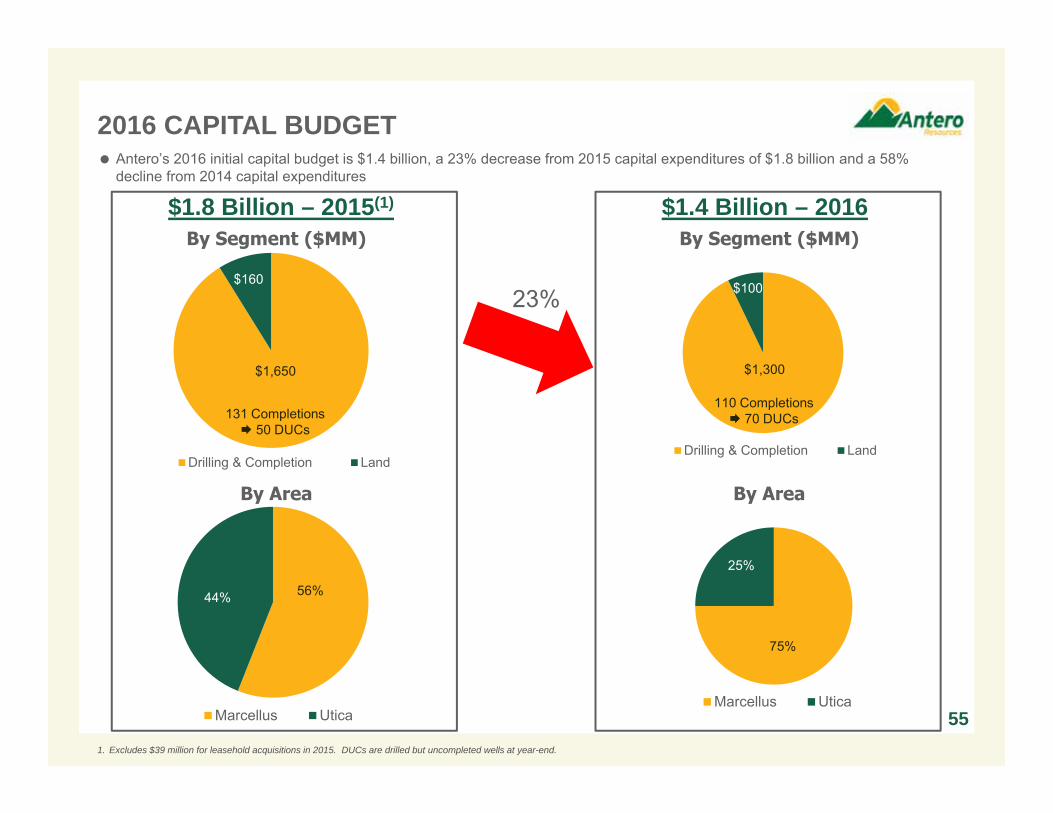
$1,300
$100
Drilling & Completion Land
2016 CAPITAL BUDGET
By Area
55
$1.8 Billion – 2015(1)
By Segment ($MM)
$1,650
$160
Drilling & Completion Land
56%44%
Marcellus Utica
By Area
$1.4 Billion – 2016By Segment ($MM)
Antero’s 2016 initial capital budget is $1.4 billion, a 23% decrease from 2015 capital expenditures of $1.8 billion and a 58%decline from 2014 capital expenditures
23%
131 Completions 50 DUCs
1. Excludes $39 million for leasehold acquisitions in 2015. DUCs are drilled but uncompleted wells at year-end.
110 Completions 70 DUCs
75%
25%
Marcellus Utica
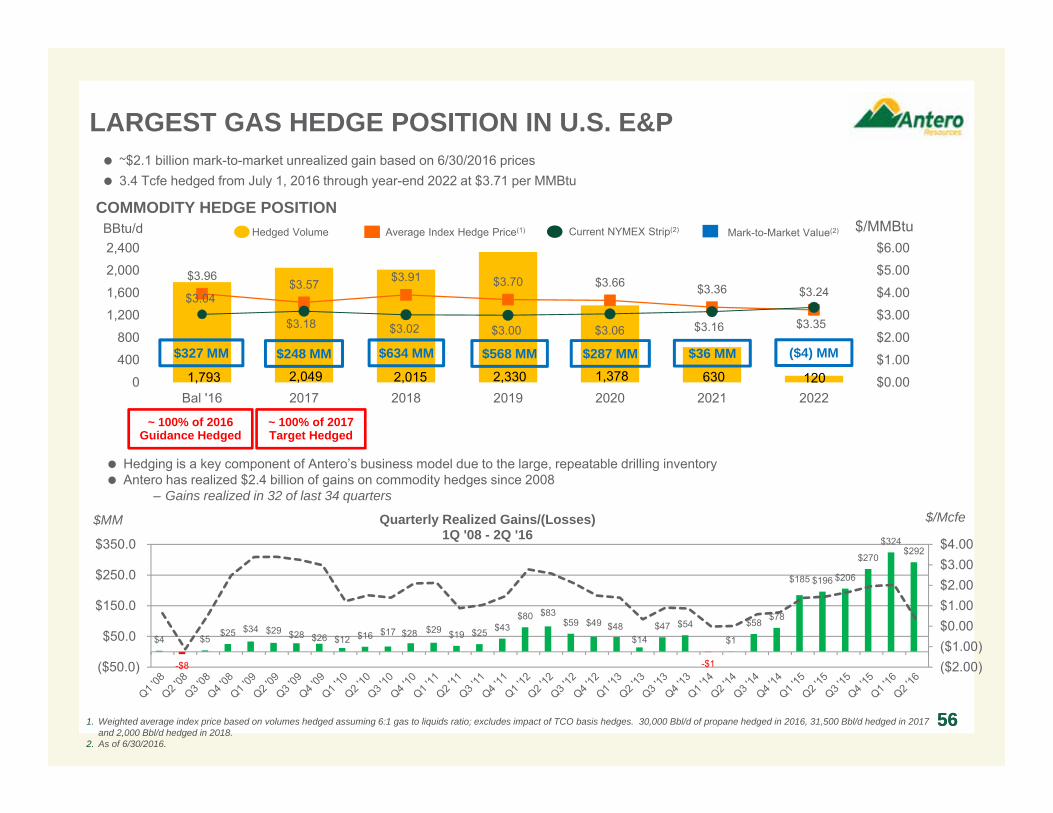
1,793 2,049 2,015 2,330 1,378 630 120
$3.96$3.57 $3.91 $3.70 $3.66 $3.36 $3.24$3.04
$3.18 $3.02 $3.00 $3.06 $3.16 $3.35
$0.00
$1.00
$2.00
$3.00
$4.00
$5.00
$6.00
0
400
800
1,200
1,600
2,000
2,400
Bal '16 2017 2018 2019 2020 2021 2022
BBtu/d $/MMBtu
$4
-$8
$5$25 $34 $29 $28 $26 $12 $16 $17 $28 $29 $19 $25 $43
$80 $83$59 $49 $48
$14$47 $54
-$1
$1
$58 $78
$185 $196 $206
$270
$324$292
($2.00)($1.00)$0.00$1.00$2.00$3.00$4.00
($50.0)
$50.0
$150.0
$250.0
$350.0
Quarterly Realized Gains/(Losses)1Q '08 - 2Q '16
56
Average Index Hedge Price(1)Hedged Volume Current NYMEX Strip(2)
COMMODITY HEDGE POSITION
~$2.1 billion mark-to-market unrealized gain based on 6/30/2016 prices 3.4 Tcfe hedged from July 1, 2016 through year-end 2022 at $3.71 per MMBtu
$327 MM $248 MM $634 MM $568 MM $287 MM $36 MM
Mark-to-Market Value(2)
LARGEST GAS HEDGE POSITION IN U.S. E&P
~ 100% of 2016 Guidance Hedged
561. Weighted average index price based on volumes hedged assuming 6:1 gas to liquids ratio; excludes impact of TCO basis hedges. 30,000 Bbl/d of propane hedged in 2016, 31,500 Bbl/d hedged in 2017 and 2,000 Bbl/d hedged in 2018.
2. As of 6/30/2016.
Hedging is a key component of Antero’s business model due to the large, repeatable drilling inventory Antero has realized $2.4 billion of gains on commodity hedges since 2008
– Gains realized in 32 of last 34 quarters
$MM $/Mcfe
($4) MM
~ 100% of 2017 Target Hedged
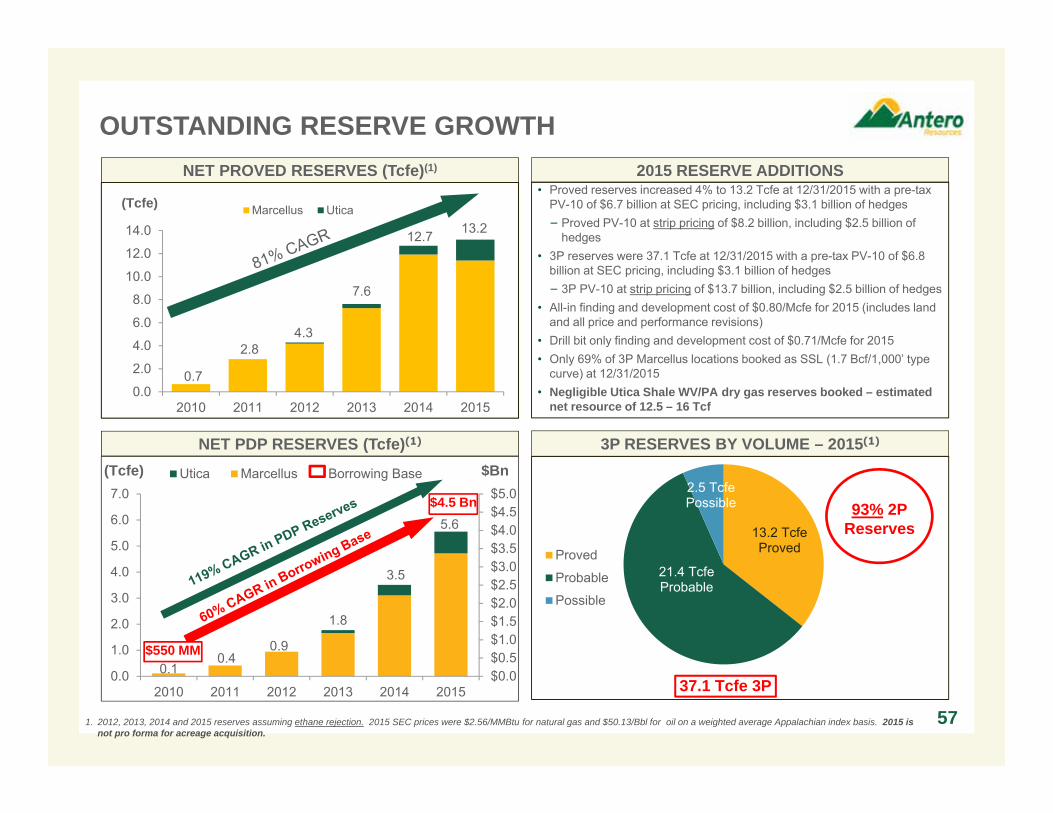
0.10.4
0.9
1.8
3.5
5.6
$0.0$0.5$1.0$1.5$2.0$2.5$3.0$3.5$4.0$4.5$5.0
0.0
1.0
2.0
3.0
4.0
5.0
6.0
7.0
2010 2011 2012 2013 2014 2015
Utica Marcellus Borrowing Base
$4.5 Bn
OUTSTANDING RESERVE GROWTH
1. 2012, 2013, 2014 and 2015 reserves assuming ethane rejection. 2015 SEC prices were $2.56/MMBtu for natural gas and $50.13/Bbl for oil on a weighted average Appalachian index basis. 2015 is not pro forma for acreage acquisition.
57
3P RESERVES BY VOLUME – 2015(1)NET PDP RESERVES (Tcfe)(1)
NET PROVED RESERVES (Tcfe)(1) 2015 RESERVE ADDITIONS• Proved reserves increased 4% to 13.2 Tcfe at 12/31/2015 with a pre-tax
PV-10 of $6.7 billion at SEC pricing, including $3.1 billion of hedges− Proved PV-10 at strip pricing of $8.2 billion, including $2.5 billion of
hedges• 3P reserves were 37.1 Tcfe at 12/31/2015 with a pre-tax PV-10 of $6.8
billion at SEC pricing, including $3.1 billion of hedges− 3P PV-10 at strip pricing of $13.7 billion, including $2.5 billion of hedges
• All-in finding and development cost of $0.80/Mcfe for 2015 (includes land and all price and performance revisions)
• Drill bit only finding and development cost of $0.71/Mcfe for 2015• Only 69% of 3P Marcellus locations booked as SSL (1.7 Bcf/1,000’ type
curve) at 12/31/2015• Negligible Utica Shale WV/PA dry gas reserves booked – estimated
net resource of 12.5 – 16 Tcf0.0
2.0
4.0
6.0
8.0
10.0
12.0
14.0
2010 2011 2012 2013 2014 2015
Marcellus Utica
0.7
2.84.3
7.6
12.7
(Tcfe)
13.2
13.2 TcfeProved
21.4 TcfeProbable
2.5 TcfePossible
Proved
Probable
Possible
37.1 Tcfe 3P
93% 2P Reserves
(Tcfe) $Bn
$550 MM
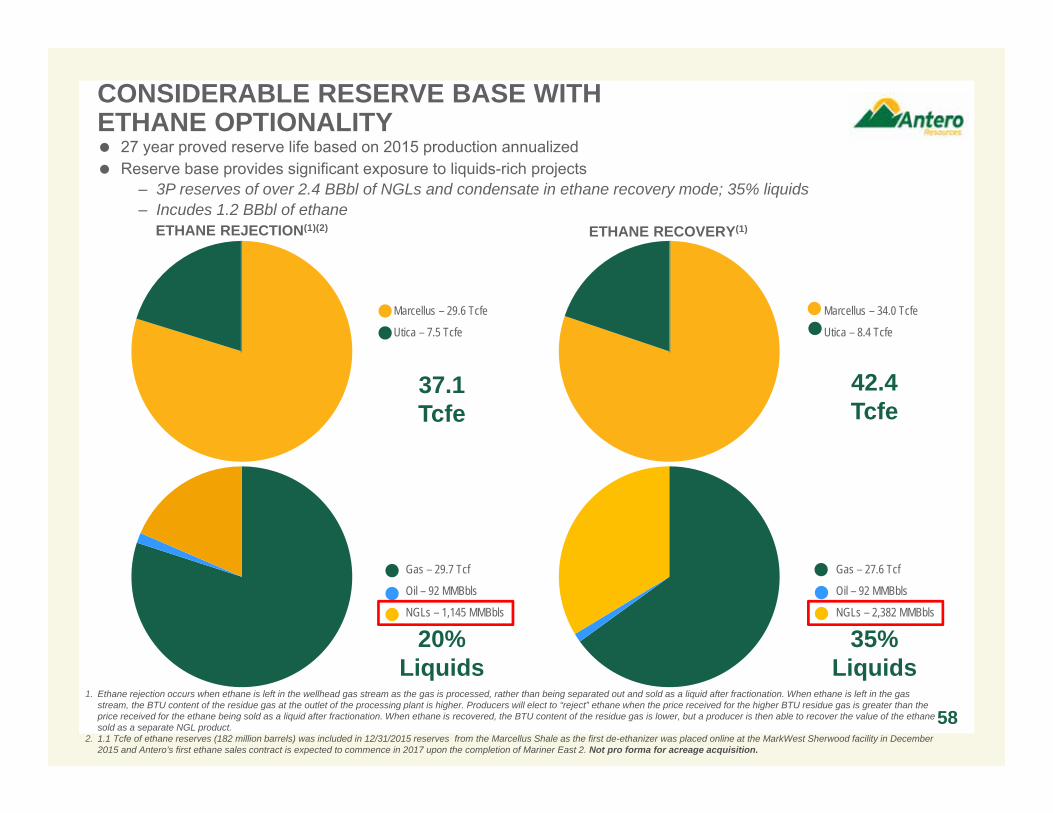
Gas – 27.6 Tcf
Oil – 92 MMBbls
NGLs – 2,382 MMBbls
Gas – 29.7 Tcf
Oil – 92 MMBbls
NGLs – 1,145 MMBbls
CONSIDERABLE RESERVE BASE WITH ETHANE OPTIONALITY 27 year proved reserve life based on 2015 production annualized Reserve base provides significant exposure to liquids-rich projects
– 3P reserves of over 2.4 BBbl of NGLs and condensate in ethane recovery mode; 35% liquids– Incudes 1.2 BBbl of ethane
1. Ethane rejection occurs when ethane is left in the wellhead gas stream as the gas is processed, rather than being separated out and sold as a liquid after fractionation. When ethane is left in the gas stream, the BTU content of the residue gas at the outlet of the processing plant is higher. Producers will elect to “reject” ethane when the price received for the higher BTU residue gas is greater than the price received for the ethane being sold as a liquid after fractionation. When ethane is recovered, the BTU content of the residue gas is lower, but a producer is then able to recover the value of the ethane sold as a separate NGL product.
2. 1.1 Tcfe of ethane reserves (182 million barrels) was included in 12/31/2015 reserves from the Marcellus Shale as the first de-ethanizer was placed online at the MarkWest Sherwood facility in December 2015 and Antero’s first ethane sales contract is expected to commence in 2017 upon the completion of Mariner East 2. Not pro forma for acreage acquisition.
ETHANE REJECTION(1)(2) ETHANE RECOVERY(1)
58
Marcellus – 29.6 Tcfe
Utica – 7.5 Tcfe
37.1Tcfe
Marcellus – 34.0 Tcfe
Utica – 8.4 Tcfe
42.4Tcfe
20%Liquids
35%Liquids
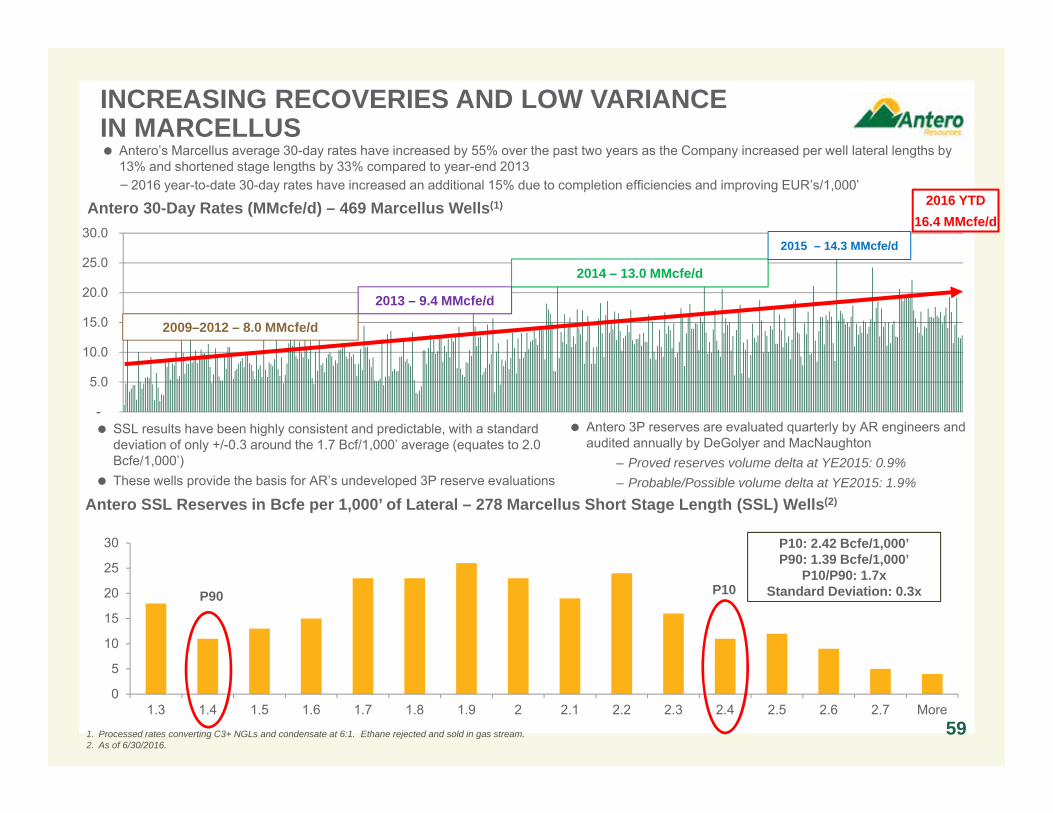
-
5.0
10.0
15.0
20.0
25.0
30.0
0
5
10
15
20
25
30
1.3 1.4 1.5 1.6 1.7 1.8 1.9 2 2.1 2.2 2.3 2.4 2.5 2.6 2.7 More
Antero’s Marcellus average 30-day rates have increased by 55% over the past two years as the Company increased per well lateral lengths by 13% and shortened stage lengths by 33% compared to year-end 2013− 2016 year-to-date 30-day rates have increased an additional 15% due to completion efficiencies and improving EUR’s/1,000’
INCREASING RECOVERIES AND LOW VARIANCEIN MARCELLUS
1. Processed rates converting C3+ NGLs and condensate at 6:1. Ethane rejected and sold in gas stream.2. As of 6/30/2016.
Antero 30-Day Rates (MMcfe/d) – 469 Marcellus Wells(1)
59
Antero SSL Reserves in Bcfe per 1,000’ of Lateral – 278 Marcellus Short Stage Length (SSL) Wells(2)
2014 – 13.0 MMcfe/d
2013 – 9.4 MMcfe/d
2009–2012 – 8.0 MMcfe/d
SSL results have been highly consistent and predictable, with a standard deviation of only +/-0.3 around the 1.7 Bcf/1,000’ average (equates to 2.0 Bcfe/1,000’)
These wells provide the basis for AR’s undeveloped 3P reserve evaluations
P10: 2.42 Bcfe/1,000’P90: 1.39 Bcfe/1,000’
P10/P90: 1.7xStandard Deviation: 0.3xP90 P10
2015 – 14.3 MMcfe/d
Antero 3P reserves are evaluated quarterly by AR engineers and audited annually by DeGolyer and MacNaughton
– Proved reserves volume delta at YE2015: 0.9%– Probable/Possible volume delta at YE2015: 1.9%
2016 YTD16.4 MMcfe/d
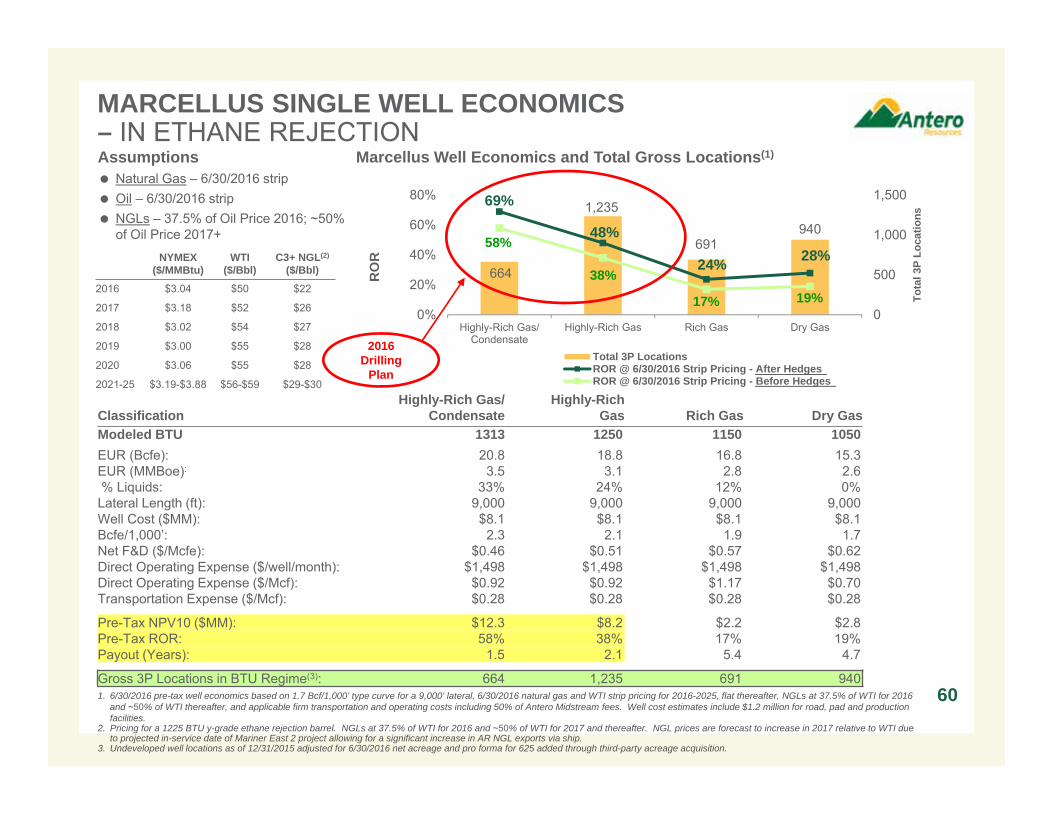
664
1,235
691940
69%
48%
24% 28%58%
38%
17% 19%0
500
1,000
1,500
0%
20%
40%
60%
80%
Highly-Rich Gas/Condensate
Highly-Rich Gas Rich Gas Dry Gas
Tota
l 3P
Loca
tions
RO
RTotal 3P LocationsROR @ 6/30/2016 Strip Pricing - After HedgesROR @ 6/30/2016 Strip Pricing - Before Hedges
MARCELLUS SINGLE WELL ECONOMICS – IN ETHANE REJECTION
60
DRY GAS LOCATIONS RICH GAS LOCATIONS
HIGHLY RICH GAS
LOCATIONS
Assumptions Natural Gas – 6/30/2016 strip Oil – 6/30/2016 strip NGLs – 37.5% of Oil Price 2016; ~50%
of Oil Price 2017+NYMEX
($/MMBtu)WTI
($/Bbl)C3+ NGL(2)
($/Bbl)
2016 $3.04 $50 $22
2017 $3.18 $52 $26
2018 $3.02 $54 $27
2019 $3.00 $55 $28
2020 $3.06 $55 $28
2021-25 $3.19-$3.88 $56-$59 $29-$30
Marcellus Well Economics and Total Gross Locations(1)
ClassificationHighly-Rich Gas/
CondensateHighly-Rich
Gas Rich Gas Dry GasModeled BTU 1313 1250 1150 1050EUR (Bcfe): 20.8 18.8 16.8 15.3EUR (MMBoe): 3.5 3.1 2.8 2.6% Liquids: 33% 24% 12% 0%Lateral Length (ft): 9,000 9,000 9,000 9,000Well Cost ($MM): $8.1 $8.1 $8.1 $8.1Bcfe/1,000’: 2.3 2.1 1.9 1.7Net F&D ($/Mcfe): $0.46 $0.51 $0.57 $0.62Direct Operating Expense ($/well/month): $1,498 $1,498 $1,498 $1,498Direct Operating Expense ($/Mcf): $0.92 $0.92 $1.17 $0.70Transportation Expense ($/Mcf): $0.28 $0.28 $0.28 $0.28
Pre-Tax NPV10 ($MM): $12.3 $8.2 $2.2 $2.8Pre-Tax ROR: 58% 38% 17% 19%Payout (Years): 1.5 2.1 5.4 4.7
Gross 3P Locations in BTU Regime(3): 664 1,235 691 9401. 6/30/2016 pre-tax well economics based on 1.7 Bcf/1,000’ type curve for a 9,000’ lateral, 6/30/2016 natural gas and WTI strip pricing for 2016-2025, flat thereafter, NGLs at 37.5% of WTI for 2016
and ~50% of WTI thereafter, and applicable firm transportation and operating costs including 50% of Antero Midstream fees. Well cost estimates include $1.2 million for road, pad and production facilities.
2. Pricing for a 1225 BTU y-grade ethane rejection barrel. NGLs at 37.5% of WTI for 2016 and ~50% of WTI for 2017 and thereafter. NGL prices are forecast to increase in 2017 relative to WTI due to projected in-service date of Mariner East 2 project allowing for a significant increase in AR NGL exports via ship.
3. Undeveloped well locations as of 12/31/2015 adjusted for 6/30/2016 net acreage and pro forma for 625 added through third-party acreage acquisition.
2016Drilling
Plan
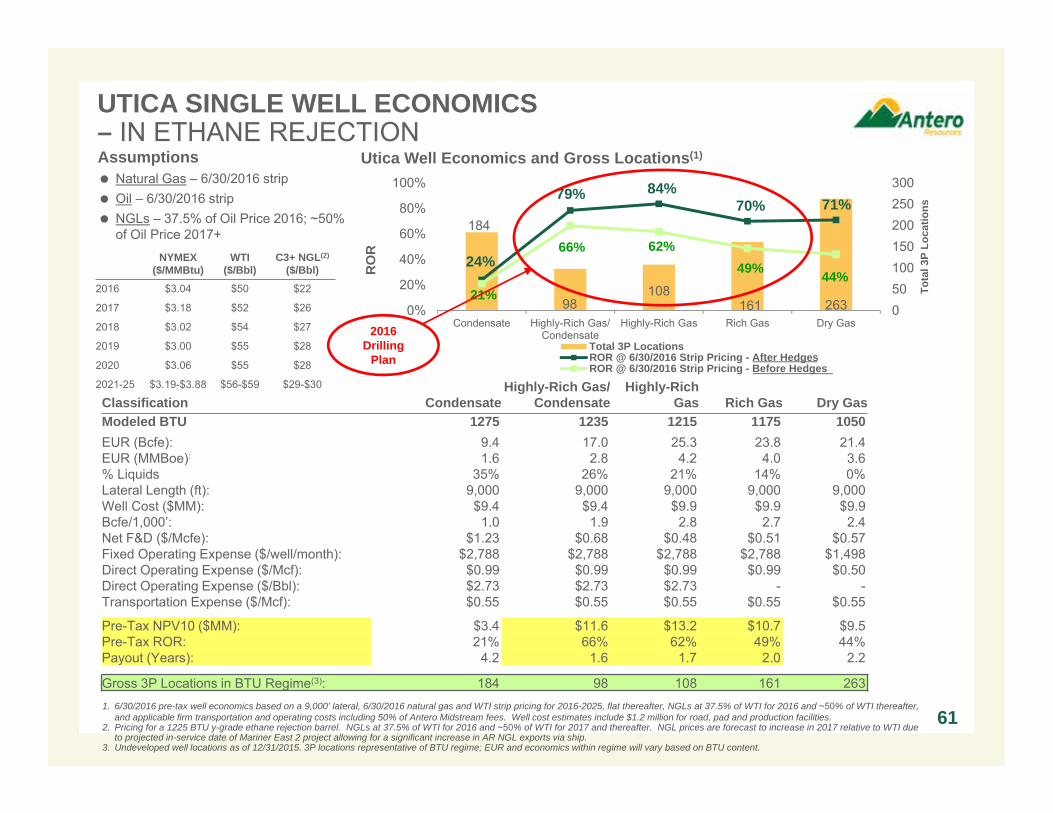
184
98108
161 263
24%
79% 84%70% 71%
21%
66% 62%49% 44%
050100150200250300
0%
20%
40%
60%
80%
100%
Condensate Highly-Rich Gas/Condensate
Highly-Rich Gas Rich Gas Dry Gas
Tota
l 3P
Loca
tions
RO
R
Total 3P LocationsROR @ 6/30/2016 Strip Pricing - After HedgesROR @ 6/30/2016 Strip Pricing - Before Hedges
UTICA SINGLE WELL ECONOMICS – IN ETHANE REJECTION
61
DRY GAS LOCATIONS RICH GAS LOCATIONS
HIGHLY RICH GAS
LOCATIONS
Utica Well Economics and Gross Locations(1)
Classification CondensateHighly-Rich Gas/
CondensateHighly-Rich
Gas Rich Gas Dry GasModeled BTU 1275 1235 1215 1175 1050EUR (Bcfe): 9.4 17.0 25.3 23.8 21.4EUR (MMBoe): 1.6 2.8 4.2 4.0 3.6% Liquids 35% 26% 21% 14% 0%Lateral Length (ft): 9,000 9,000 9,000 9,000 9,000Well Cost ($MM): $9.4 $9.4 $9.9 $9.9 $9.9Bcfe/1,000’: 1.0 1.9 2.8 2.7 2.4Net F&D ($/Mcfe): $1.23 $0.68 $0.48 $0.51 $0.57Fixed Operating Expense ($/well/month): $2,788 $2,788 $2,788 $2,788 $1,498Direct Operating Expense ($/Mcf): $0.99 $0.99 $0.99 $0.99 $0.50Direct Operating Expense ($/Bbl): $2.73 $2.73 $2.73 - -Transportation Expense ($/Mcf): $0.55 $0.55 $0.55 $0.55 $0.55
Pre-Tax NPV10 ($MM): $3.4 $11.6 $13.2 $10.7 $9.5Pre-Tax ROR: 21% 66% 62% 49% 44%Payout (Years): 4.2 1.6 1.7 2.0 2.2
Gross 3P Locations in BTU Regime(3): 184 98 108 161 2631. 6/30/2016 pre-tax well economics based on a 9,000’ lateral, 6/30/2016 natural gas and WTI strip pricing for 2016-2025, flat thereafter, NGLs at 37.5% of WTI for 2016 and ~50% of WTI thereafter,
and applicable firm transportation and operating costs including 50% of Antero Midstream fees. Well cost estimates include $1.2 million for road, pad and production facilities. 2. Pricing for a 1225 BTU y-grade ethane rejection barrel. NGLs at 37.5% of WTI for 2016 and ~50% of WTI for 2017 and thereafter. NGL prices are forecast to increase in 2017 relative to WTI due
to projected in-service date of Mariner East 2 project allowing for a significant increase in AR NGL exports via ship. 3. Undeveloped well locations as of 12/31/2015. 3P locations representative of BTU regime; EUR and economics within regime will vary based on BTU content.
2016Drilling
Plan
NYMEX($/MMBtu)
WTI($/Bbl)
C3+ NGL(2)
($/Bbl)
2016 $3.04 $50 $22
2017 $3.18 $52 $26
2018 $3.02 $54 $27
2019 $3.00 $55 $28
2020 $3.06 $55 $28
2021-25 $3.19-$3.88 $56-$59 $29-$30
Assumptions Natural Gas – 6/30/2016 strip Oil – 6/30/2016 strip NGLs – 37.5% of Oil Price 2016; ~50%
of Oil Price 2017+
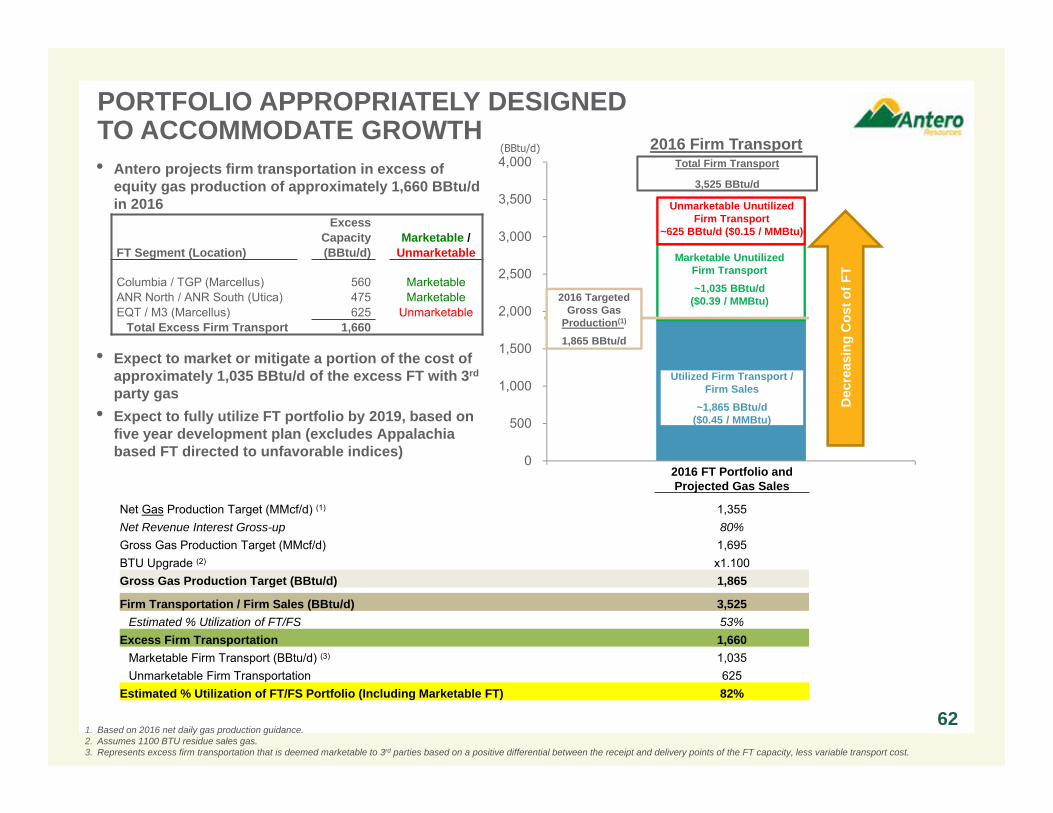
0
500
1,000
1,500
2,000
2,500
3,000
3,500
4,000
2016 FT Portfolio and Projected Gas Sales
Net Gas Production Target (MMcf/d) (1) 1,355Net Revenue Interest Gross-up 80%Gross Gas Production Target (MMcf/d) 1,695BTU Upgrade (2) x1.100 Gross Gas Production Target (BBtu/d) 1,865
Firm Transportation / Firm Sales (BBtu/d) 3,525Estimated % Utilization of FT/FS 53%
Excess Firm Transportation 1,660Marketable Firm Transport (BBtu/d) (3) 1,035Unmarketable Firm Transportation 625
Estimated % Utilization of FT/FS Portfolio (Including Marketable FT) 82%
621. Based on 2016 net daily gas production guidance.2. Assumes 1100 BTU residue sales gas.3. Represents excess firm transportation that is deemed marketable to 3rd parties based on a positive differential between the receipt and delivery points of the FT capacity, less variable transport cost.
• Antero projects firm transportation in excess of equity gas production of approximately 1,660 BBtu/d in 2016
• Expect to market or mitigate a portion of the cost of approximately 1,035 BBtu/d of the excess FT with 3rd
party gas• Expect to fully utilize FT portfolio by 2019, based on
five year development plan (excludes Appalachia based FT directed to unfavorable indices)
(BBtu/d)
2016 Targeted Gross Gas
Production(1)
1,865 BBtu/d
Unmarketable Unutilized Firm Transport
~625 BBtu/d ($0.15 / MMBtu)
Marketable Unutilized Firm Transport ~1,035 BBtu/d
($0.39 / MMBtu)
Utilized Firm Transport / Firm Sales
~1,865 BBtu/d($0.45 / MMBtu)
Total Firm Transport
3,525 BBtu/d
Excess Capacity Marketable /
FT Segment (Location) (BBtu/d) Unmarketable
Columbia / TGP (Marcellus) 560 MarketableANR North / ANR South (Utica) 475 MarketableEQT / M3 (Marcellus) 625 Unmarketable
Total Excess Firm Transport 1,660
2016 Firm Transport
Dec
reas
ing
Cos
t of F
T
PORTFOLIO APPROPRIATELY DESIGNEDTO ACCOMMODATE GROWTH
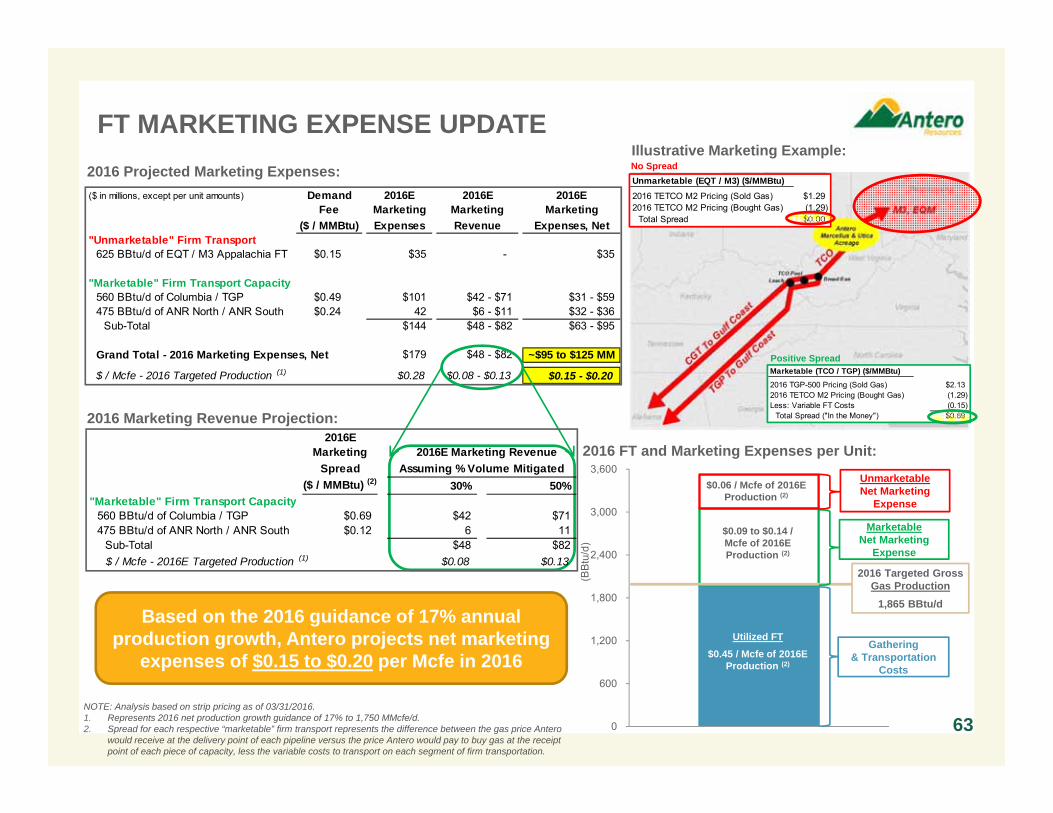
($ in millions, except per unit amounts) Demand 2016E 2016E 2016EFee Marketing Marketing Marketing
($ / MMBtu) Expenses Revenue Expenses, Net"Unmarketable" Firm Transport
625 BBtu/d of EQT / M3 Appalachia FT $0.15 $35 - $35
"Marketable" Firm Transport Capacity560 BBtu/d of Columbia / TGP $0.49 $101 $42 - $71 $31 - $59475 BBtu/d of ANR North / ANR South $0.24 42 $6 - $11 $32 - $36
Sub-Total $144 $48 - $82 $63 - $95
Grand Total - 2016 Marketing Expenses, Net $179 $48 - $82 ~$95 to $125 MM
$ / Mcfe - 2016 Targeted Production (1) $0.28 $0.08 - $0.13 $0.15 - $0.20
Unmarketable (EQT / M3) ($/MMBtu)2016 TETCO M2 Pricing (Sold Gas) $1.292016 TETCO M2 Pricing (Bought Gas) (1.29)
Total Spread $0.00
63NOTE: Analysis based on strip pricing as of 03/31/2016. 1. Represents 2016 net production growth guidance of 17% to 1,750 MMcfe/d.2. Spread for each respective “marketable” firm transport represents the difference between the gas price Antero
would receive at the delivery point of each pipeline versus the price Antero would pay to buy gas at the receipt point of each piece of capacity, less the variable costs to transport on each segment of firm transportation.
2016 Projected Marketing Expenses:
0
600
1,200
1,800
2,400
3,000
3,600
(BB
tu/d
)2016 Targeted Gross
Gas Production1,865 BBtu/d
$0.06 / Mcfe of 2016E Production (2)
$0.09 to $0.14 / Mcfe of 2016E Production (2)
Utilized FT$0.45 / Mcfe of 2016E
Production (2)
2016 FT and Marketing Expenses per Unit:
2016 Marketing Revenue Projection:
Based on the 2016 guidance of 17% annual production growth, Antero projects net marketing
expenses of $0.15 to $0.20 per Mcfe in 2016Gathering
& Transportation Costs
MarketableNet Marketing
Expense
UnmarketableNet Marketing
Expense
Illustrative Marketing Example:
Positive Spread
No Spread
FT MARKETING EXPENSE UPDATE
Marketable (TCO / TGP) ($/MMBtu)
2016 TGP-500 Pricing (Sold Gas) $2.132016 TETCO M2 Pricing (Bought Gas) (1.29)Less: Variable FT Costs (0.15)
Total Spread ("In the Money") $0.69
2016EMarketing 2016E Marketing Revenue
Spread Assuming % Volume Mitigated($ / MMBtu) (2) 30% 50%
"Marketable" Firm Transport Capacity560 BBtu/d of Columbia / TGP $0.69 $42 $71475 BBtu/d of ANR North / ANR South $0.12 6 11
Sub-Total $48 $82$ / Mcfe - 2016E Targeted Production (1) $0.08 $0.13
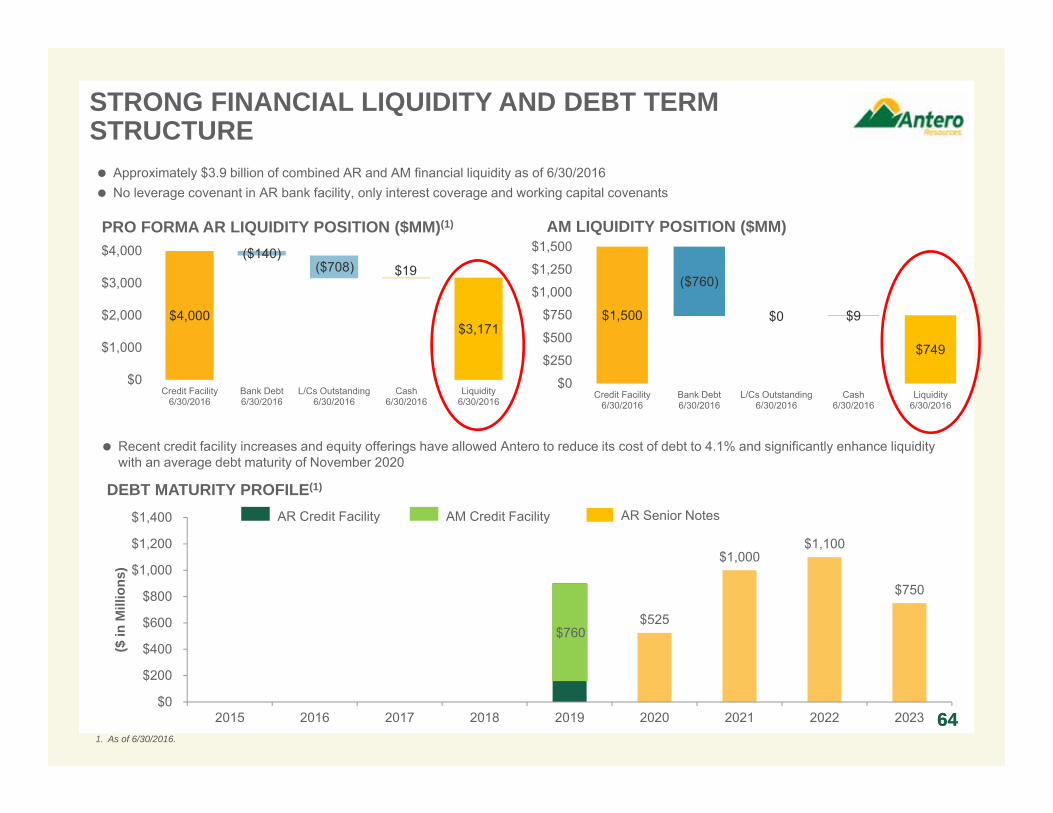
$525
$1,000 $1,100
$750
$0
$200
$400
$600
$800
$1,000
$1,200
$1,400
2015 2016 2017 2018 2019 2020 2021 2022 2023
($ in
Mill
ions
)
$1,500
$749
($760)
$0 $9
$0
$250
$500
$750
$1,000
$1,250
$1,500
Credit Facility6/30/2016
Bank Debt6/30/2016
L/Cs Outstanding6/30/2016
Cash6/30/2016
Liquidity 6/30/2016
64
STRONG FINANCIAL LIQUIDITY AND DEBT TERM STRUCTURE
64
$4,000$3,171
($140)($708) $19
$0
$1,000
$2,000
$3,000
$4,000
Credit Facility6/30/2016
Bank Debt6/30/2016
L/Cs Outstanding6/30/2016
Cash6/30/2016
Liquidity6/30/2016
PRO FORMA AR LIQUIDITY POSITION ($MM)(1) AM LIQUIDITY POSITION ($MM)
Approximately $3.9 billion of combined AR and AM financial liquidity as of 6/30/2016 No leverage covenant in AR bank facility, only interest coverage and working capital covenants
AR Credit Facility AR Senior Notes
DEBT MATURITY PROFILE(1)
Recent credit facility increases and equity offerings have allowed Antero to reduce its cost of debt to 4.1% and significantly enhance liquidity with an average debt maturity of November 2020
AM Credit Facility
$760
1. As of 6/30/2016.
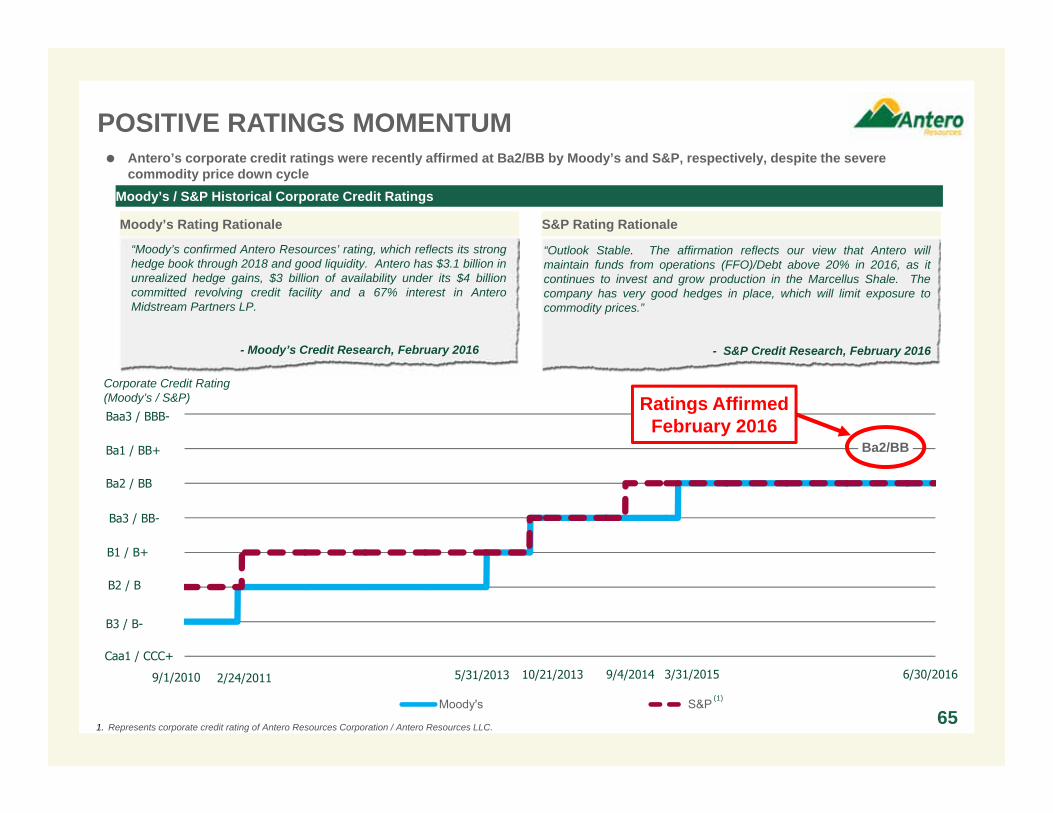
Moody's S&P
POSITIVE RATINGS MOMENTUM
Moody’s / S&P Historical Corporate Credit Ratings
“Outlook Stable. The affirmation reflects our view that Antero willmaintain funds from operations (FFO)/Debt above 20% in 2016, as itcontinues to invest and grow production in the Marcellus Shale. Thecompany has very good hedges in place, which will limit exposure tocommodity prices.”
- S&P Credit Research, February 2016
“Moody’s confirmed Antero Resources’ rating, which reflects its stronghedge book through 2018 and good liquidity. Antero has $3.1 billion inunrealized hedge gains, $3 billion of availability under its $4 billioncommitted revolving credit facility and a 67% interest in AnteroMidstream Partners LP.
- Moody’s Credit Research, February 2016
Corporate Credit Rating (Moody’s / S&P)
Ba3 / BB-
B1 / B+
B2 / B
B3 / B-
2/24/2011 10/21/2013 9/4/20145/31/2013
Ba2 / BB
Ba1 / BB+
Caa1 / CCC+
(1)
1. Represents corporate credit rating of Antero Resources Corporation / Antero Resources LLC.
Baa3 / BBB-
Moody’s Rating Rationale S&P Rating Rationale
65
3/31/2015
Ba2/BB
6/30/20169/1/2010
Ratings AffirmedFebruary 2016
Antero’s corporate credit ratings were recently affirmed at Ba2/BB by Moody’s and S&P, respectively, despite the severe commodity price down cycle
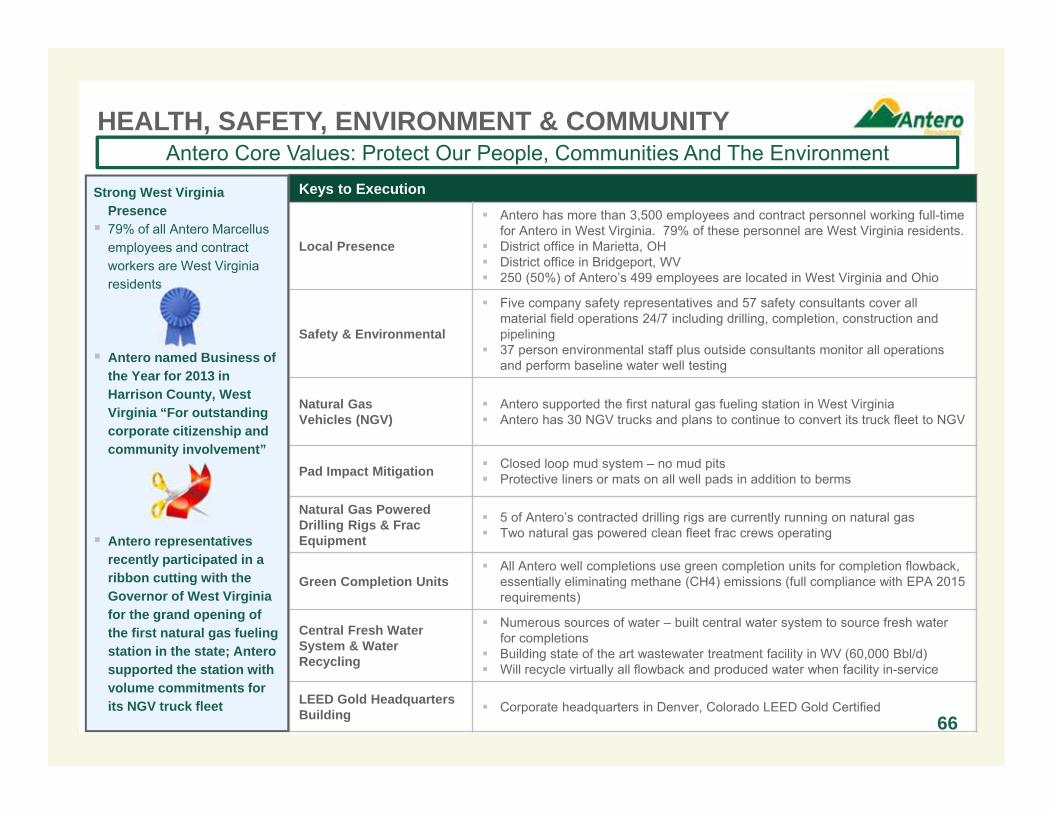
Keys to Execution
Local Presence
Antero has more than 3,500 employees and contract personnel working full-time for Antero in West Virginia. 79% of these personnel are West Virginia residents.
District office in Marietta, OH District office in Bridgeport, WV 250 (50%) of Antero’s 499 employees are located in West Virginia and Ohio
Safety & Environmental
Five company safety representatives and 57 safety consultants cover all material field operations 24/7 including drilling, completion, construction and pipelining
37 person environmental staff plus outside consultants monitor all operations and perform baseline water well testing
Natural Gas Vehicles (NGV)
Antero supported the first natural gas fueling station in West Virginia Antero has 30 NGV trucks and plans to continue to convert its truck fleet to NGV
Pad Impact Mitigation Closed loop mud system – no mud pits Protective liners or mats on all well pads in addition to berms
Natural Gas Powered Drilling Rigs & Frac Equipment
5 of Antero’s contracted drilling rigs are currently running on natural gas Two natural gas powered clean fleet frac crews operating
Green Completion Units All Antero well completions use green completion units for completion flowback,
essentially eliminating methane (CH4) emissions (full compliance with EPA 2015requirements)
Central Fresh Water System & Water Recycling
Numerous sources of water – built central water system to source fresh water for completions
Building state of the art wastewater treatment facility in WV (60,000 Bbl/d) Will recycle virtually all flowback and produced water when facility in-service
LEED Gold Headquarters Building Corporate headquarters in Denver, Colorado LEED Gold Certified
HEALTH, SAFETY, ENVIRONMENT & COMMUNITYAntero Core Values: Protect Our People, Communities And The Environment
Strong West Virginia Presence 79% of all Antero Marcellus
employees and contract workers are West Virginia residents
Antero named Business of the Year for 2013 in Harrison County, West Virginia “For outstanding corporate citizenship and community involvement”
Antero representatives recently participated in a ribbon cutting with the Governor of West Virginia for the grand opening of the first natural gas fueling station in the state; Antero supported the station with volume commitments for its NGV truck fleet
66
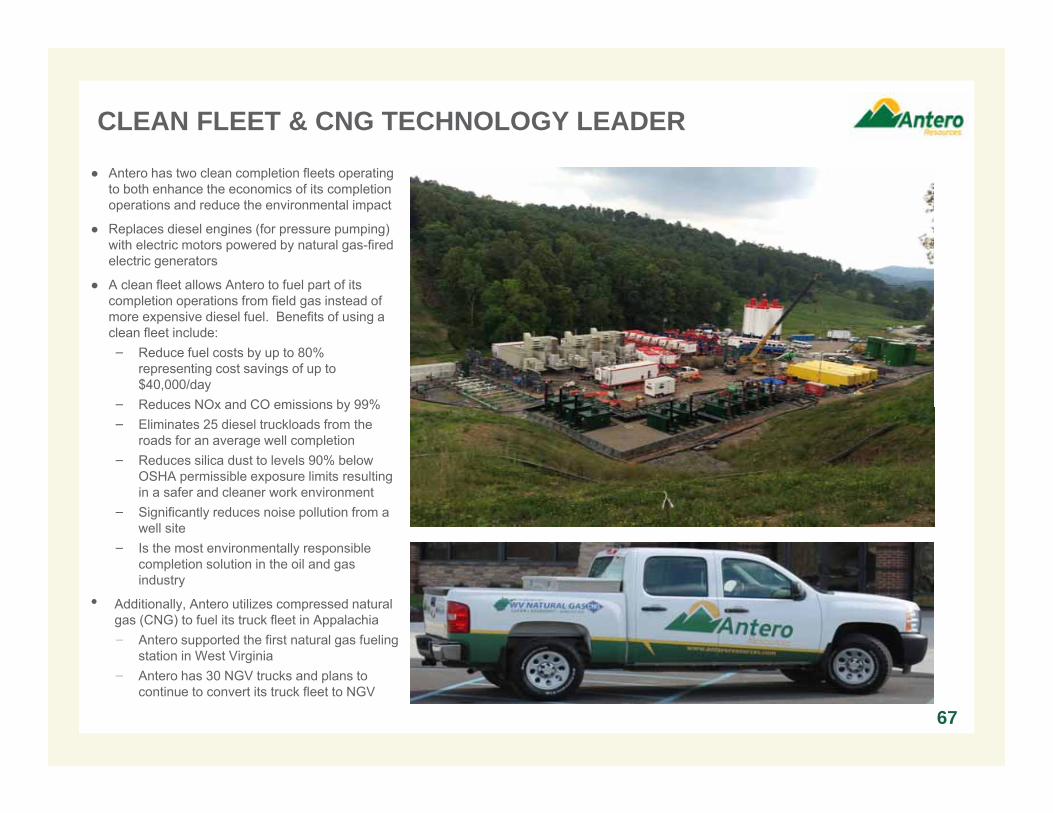
CLEAN FLEET & CNG TECHNOLOGY LEADER
● Antero has two clean completion fleets operating to both enhance the economics of its completion operations and reduce the environmental impact
● Replaces diesel engines (for pressure pumping) with electric motors powered by natural gas-fired electric generators
● A clean fleet allows Antero to fuel part of its completion operations from field gas instead of more expensive diesel fuel. Benefits of using a clean fleet include:− Reduce fuel costs by up to 80%
representing cost savings of up to $40,000/day
− Reduces NOx and CO emissions by 99%− Eliminates 25 diesel truckloads from the
roads for an average well completion− Reduces silica dust to levels 90% below
OSHA permissible exposure limits resulting in a safer and cleaner work environment
− Significantly reduces noise pollution from a well site
− Is the most environmentally responsible completion solution in the oil and gas industry
• Additionally, Antero utilizes compressed natural gas (CNG) to fuel its truck fleet in Appalachia− Antero supported the first natural gas fueling
station in West Virginia− Antero has 30 NGV trucks and plans to
continue to convert its truck fleet to NGV
67
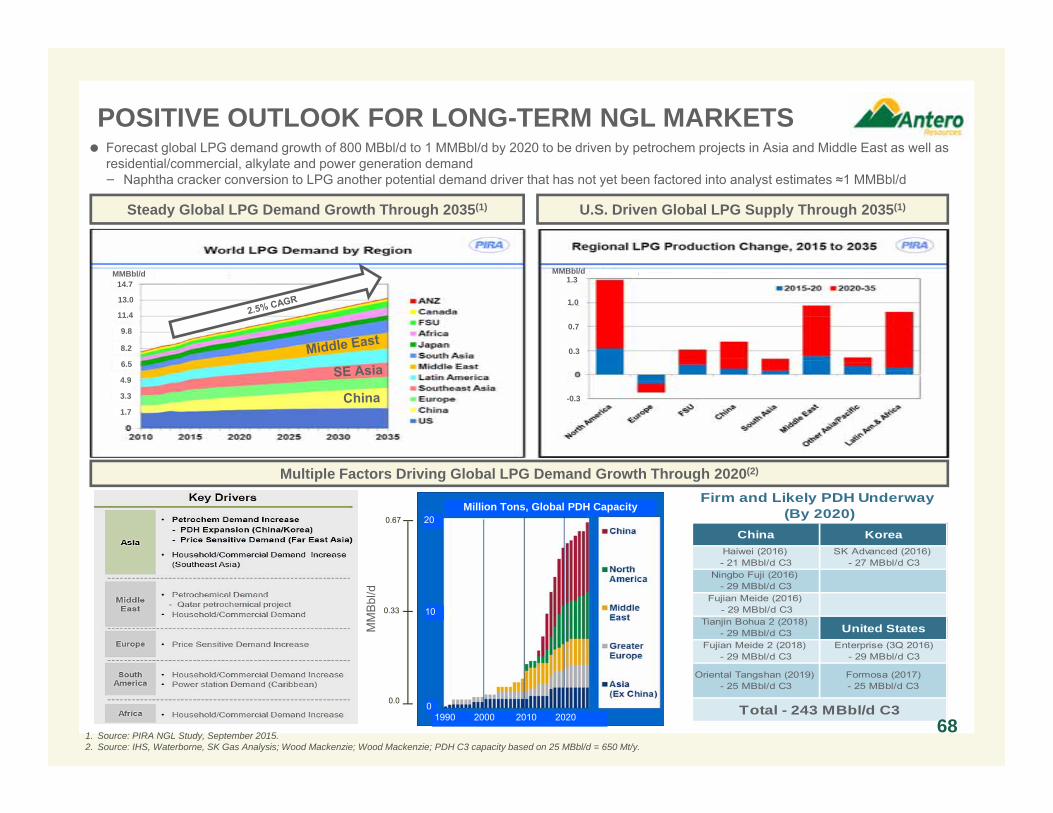
POSITIVE OUTLOOK FOR LONG-TERM NGL MARKETS
Steady Global LPG Demand Growth Through 2035(1)
1. Source: PIRA NGL Study, September 2015.2. Source: IHS, Waterborne, SK Gas Analysis; Wood Mackenzie; Wood Mackenzie; PDH C3 capacity based on 25 MBbl/d = 650 Mt/y.
Multiple Factors Driving Global LPG Demand Growth Through 2020(2)
MM
Bbl
/d
0.0
0.33
0.67
Forecast global LPG demand growth of 800 MBbl/d to 1 MMBbl/d by 2020 to be driven by petrochem projects in Asia and Middle East as well as residential/commercial, alkylate and power generation demand− Naphtha cracker conversion to LPG another potential demand driver that has not yet been factored into analyst estimates ≈1 MMBbl/d
China KoreaHaiwei (2016) - 21 MBbl/d C3
SK Advanced (2016) - 27 MBbl/d C3
Ningbo Fuji (2016) - 29 MBbl/d C3
Fujian Meide (2016) - 29 MBbl/d C3
Tianjin Bohua 2 (2018) - 29 MBbl/d C3 United States
Fujian Meide 2 (2018) - 29 MBbl/d C3
Enterprise (3Q 2016)- 29 MBbl/d C3
Oriental Tangshan (2019) - 25 MBbl/d C3
Formosa (2017)- 25 MBbl/d C3
Firm and Likely PDH Underway (By 2020)
Total - 243 MBbl/d C3
Million Tons, Global PDH Capacity
1990 2000 2010 2020
20
10
0
68
14.7
13.0
11.4
9.8
8.2
6.5
4.9
3.3
1.7
U.S. Driven Global LPG Supply Through 2035(1)
MMBbl/d MMBbl/d1.3
1.0
0.7
0.3
-0.3
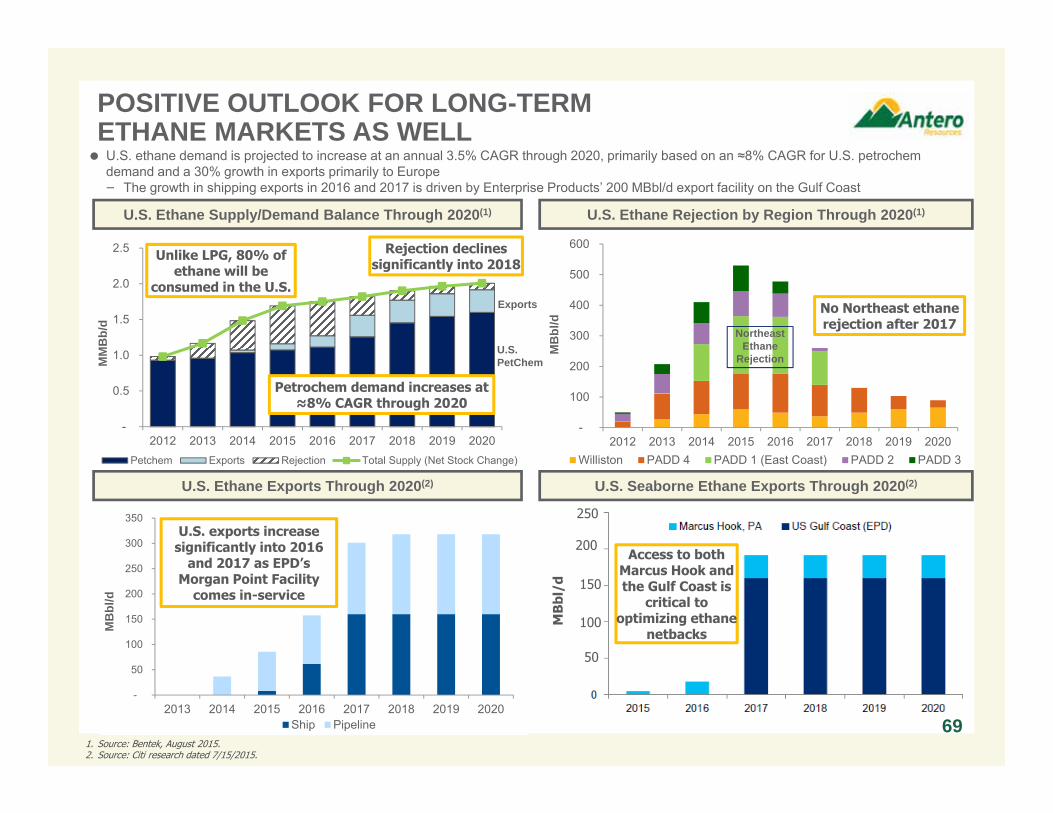
POSITIVE OUTLOOK FOR LONG-TERM ETHANE MARKETS AS WELL
U.S. Ethane Supply/Demand Balance Through 2020(1)
1. Source: Bentek, August 2015.2. Source: Citi research dated 7/15/2015.
U.S. Ethane Exports Through 2020(2)
U.S. ethane demand is projected to increase at an annual 3.5% CAGR through 2020, primarily based on an ≈8% CAGR for U.S. petrochemdemand and a 30% growth in exports primarily to Europe− The growth in shipping exports in 2016 and 2017 is driven by Enterprise Products’ 200 MBbl/d export facility on the Gulf Coast
-
0.5
1.0
1.5
2.0
2.5
2012 2013 2014 2015 2016 2017 2018 2019 2020
MM
Bb/
d
Petchem Exports Rejection Total Supply (Net Stock Change)
U.S. Seaborne Ethane Exports Through 2020(2)
-
50
100
150
200
250
300
350
2013 2014 2015 2016 2017 2018 2019 2020
MB
bl/d
Ship Pipeline
250
200
150
100
50
MB
bl/d
U.S. exports increase significantly into 2016
and 2017 as EPD’s Morgan Point Facility
comes in-service
U.S. Ethane Rejection by Region Through 2020(1)
Access to both Marcus Hook and the Gulf Coast is
critical to optimizing ethane
netbacks
Rejection declines significantly into 2018
Unlike LPG, 80% of ethane will be
consumed in the U.S.
Petrochem demand increases at ≈8% CAGR through 2020
-
100
200
300
400
500
600
2012 2013 2014 2015 2016 2017 2018 2019 2020
MB
bl/d
Williston PADD 4 PADD 1 (East Coast) PADD 2 PADD 3
No Northeast ethane rejection after 2017
69
Northeast Ethane
Rejection
Exports
U.S. PetChem
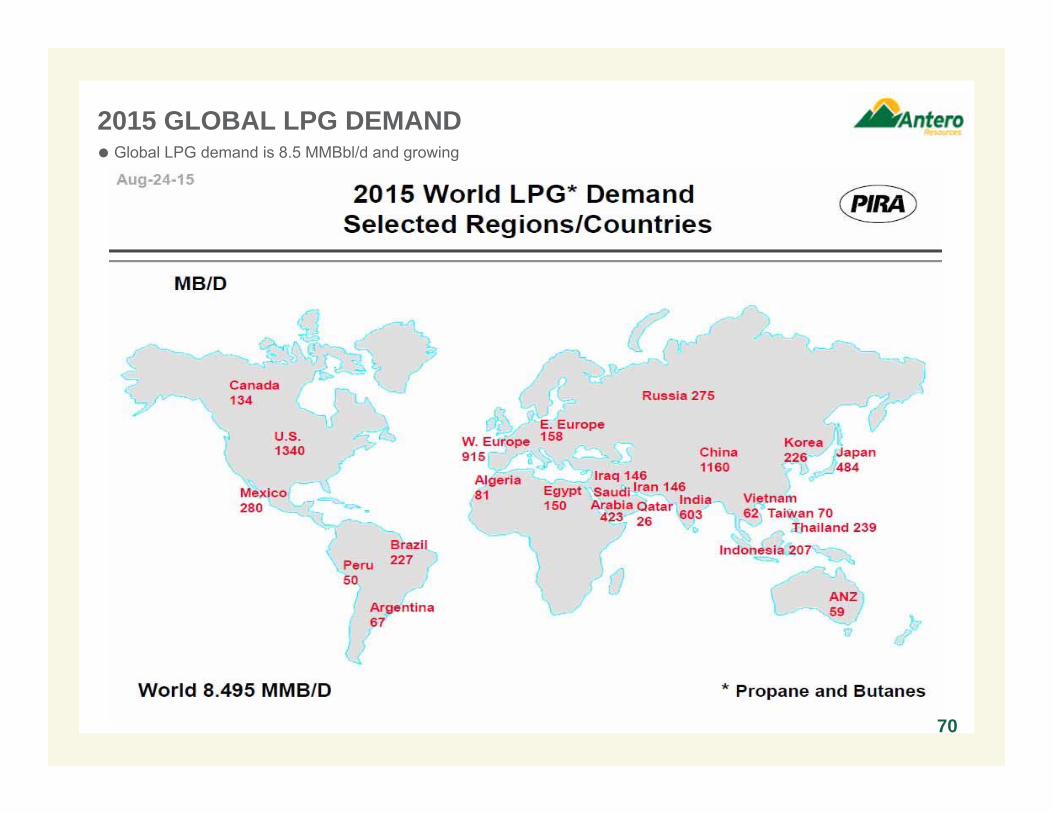
2015 GLOBAL LPG DEMANDGlobal LPG demand is 8.5 MMBbl/d and growing
70
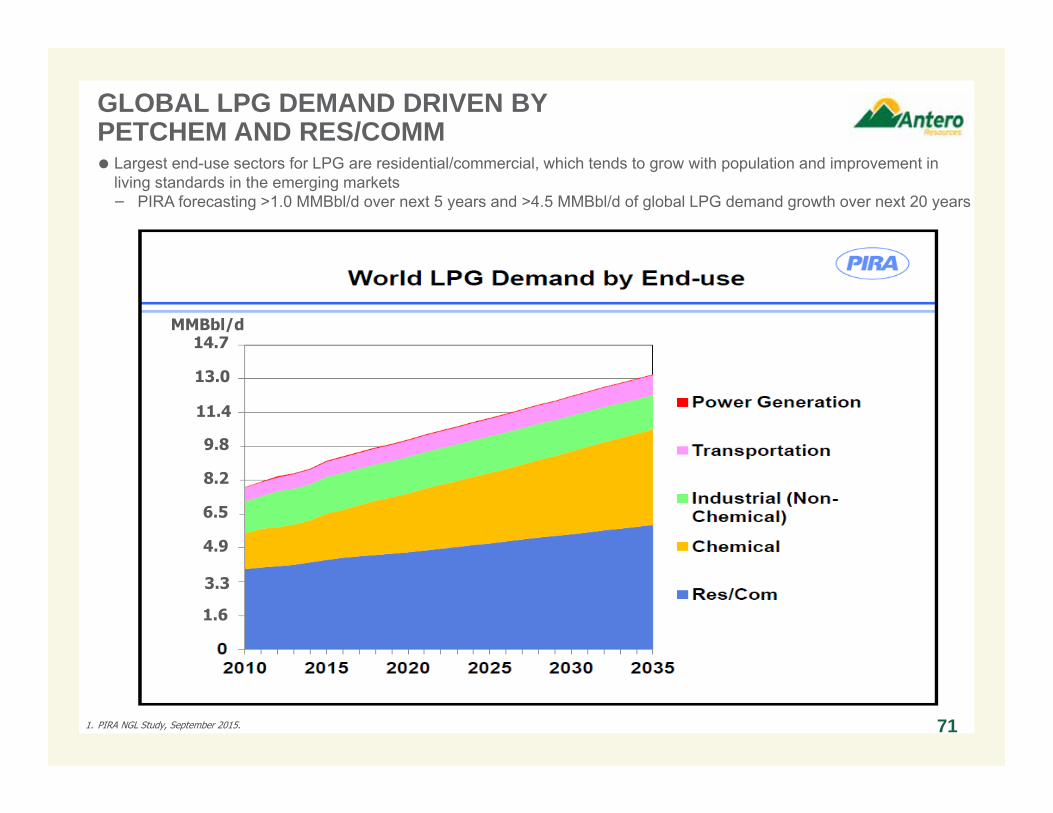
GLOBAL LPG DEMAND DRIVEN BYPETCHEM AND RES/COMMLargest end-use sectors for LPG are residential/commercial, which tends to grow with population and improvement in
living standards in the emerging markets− PIRA forecasting >1.0 MMBbl/d over next 5 years and >4.5 MMBbl/d of global LPG demand growth over next 20 years
711. PIRA NGL Study, September 2015.
MMBbl/d14.7
13.0
11.4
9.8
8.2
6.5
4.9
3.3
1.6
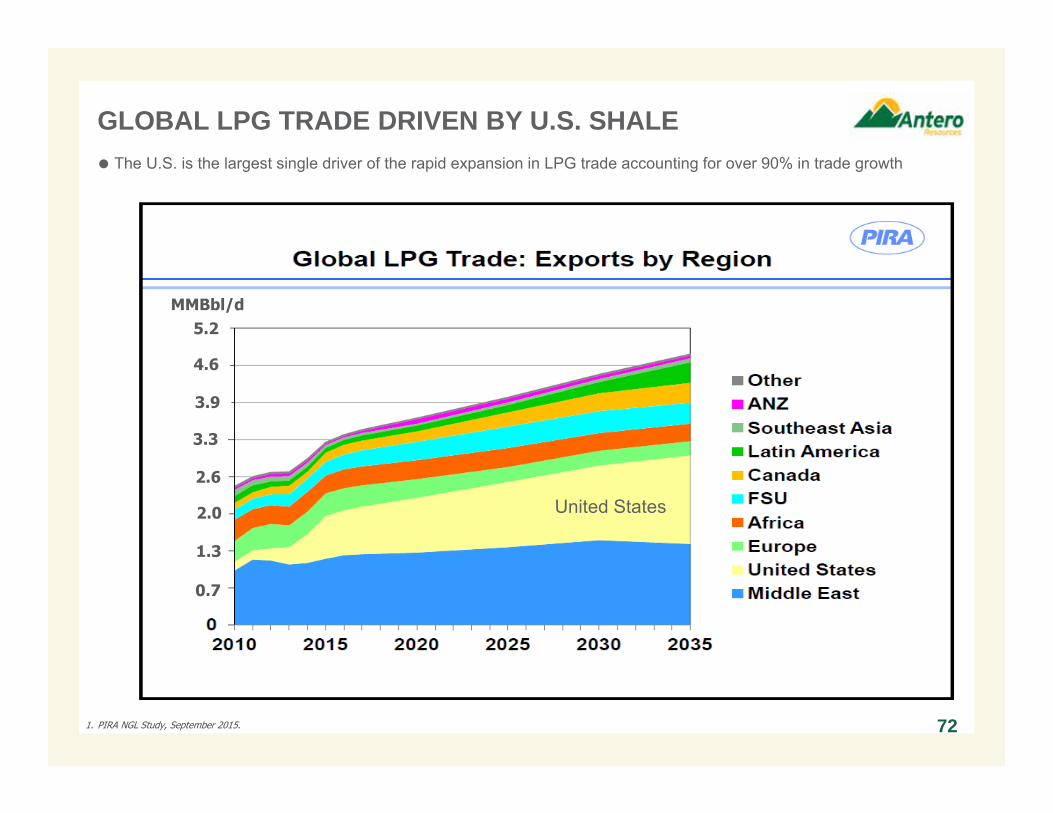
GLOBAL LPG TRADE DRIVEN BY U.S. SHALEThe U.S. is the largest single driver of the rapid expansion in LPG trade accounting for over 90% in trade growth
721. PIRA NGL Study, September 2015.
MMBbl/d5.2
4.6
3.9
3.3
2.6
2.0
1.3
0.7
United States
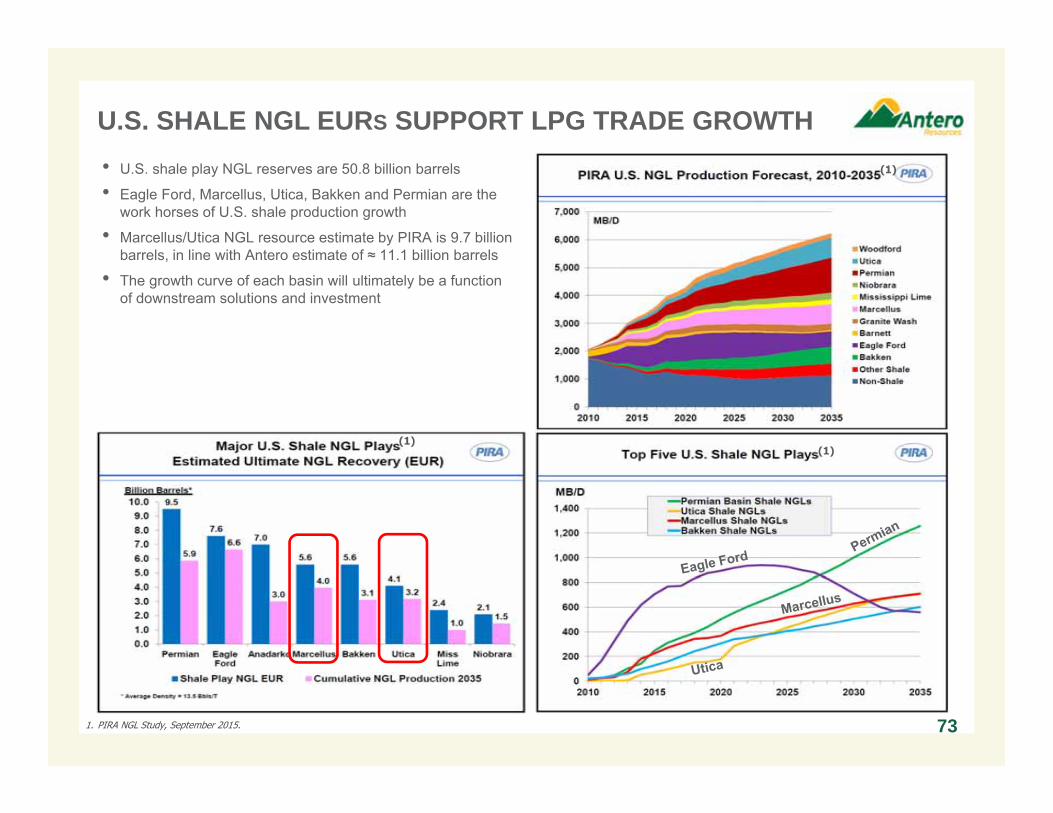
U.S. SHALE NGL EURS SUPPORT LPG TRADE GROWTH
731. PIRA NGL Study, September 2015.
• U.S. shale play NGL reserves are 50.8 billion barrels
• Eagle Ford, Marcellus, Utica, Bakken and Permian are the work horses of U.S. shale production growth
• Marcellus/Utica NGL resource estimate by PIRA is 9.7 billion barrels, in line with Antero estimate of ≈ 11.1 billion barrels
• The growth curve of each basin will ultimately be a function of downstream solutions and investment
(1)
(1)(1)
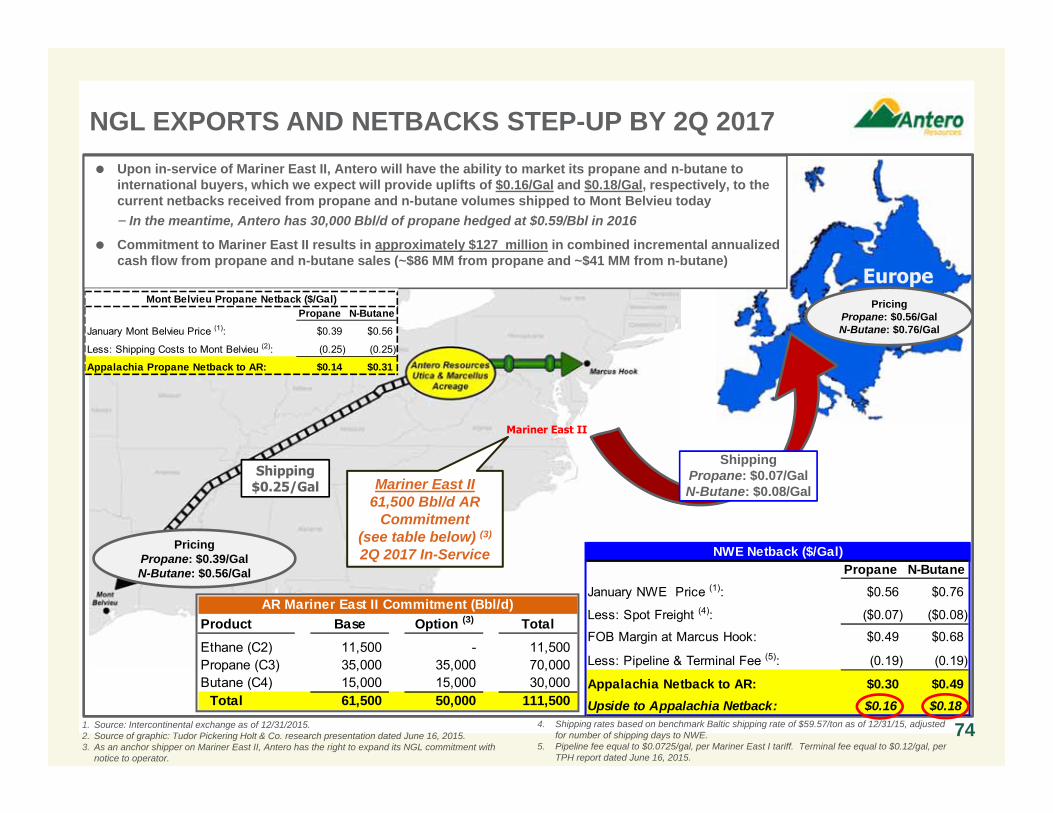
Europe
Mariner East II
Shipping $0.25/Gal
NGL EXPORTS AND NETBACKS STEP-UP BY 2Q 2017
1. Source: Intercontinental exchange as of 12/31/2015.2. Source of graphic: Tudor Pickering Holt & Co. research presentation dated June 16, 2015.3. As an anchor shipper on Mariner East II, Antero has the right to expand its NGL commitment with
notice to operator.
4. Shipping rates based on benchmark Baltic shipping rate of $59.57/ton as of 12/31/15, adjusted for number of shipping days to NWE.
5. Pipeline fee equal to $0.0725/gal, per Mariner East I tariff. Terminal fee equal to $0.12/gal, per TPH report dated June 16, 2015.
Upon in-service of Mariner East II, Antero will have the ability to market its propane and n-butane to international buyers, which we expect will provide uplifts of $0.16/Gal and $0.18/Gal, respectively, to the current netbacks received from propane and n-butane volumes shipped to Mont Belvieu today− In the meantime, Antero has 30,000 Bbl/d of propane hedged at $0.59/Bbl in 2016
Commitment to Mariner East II results in approximately $127 million in combined incremental annualized cash flow from propane and n-butane sales (~$86 MM from propane and ~$41 MM from n-butane)
PricingPropane: $0.39/GalN-Butane: $0.56/Gal
PricingPropane: $0.56/GalN-Butane: $0.76/Gal
Mariner East II61,500 Bbl/d AR
Commitment (see table below) (3)
2Q 2017 In-Service
ShippingPropane: $0.07/GalN-Butane: $0.08/Gal
AR Mariner East II Commitment (Bbl/d)Product Base Option (3) TotalEthane (C2) 11,500 - 11,500 Propane (C3) 35,000 35,000 70,000 Butane (C4) 15,000 15,000 30,000
Total 61,500 50,000 111,500
74
Mont Belvieu Propane Netback ($/Gal)Propane N-Butane
January Mont Belvieu Price (1): $0.39 $0.56
Less: Shipping Costs to Mont Belvieu (2): (0.25) (0.25)
Appalachia Propane Netback to AR: $0.14 $0.31
NWE Netback ($/Gal)Propane N-Butane
January NWE Price (1): $0.56 $0.76
Less: Spot Freight (4): ($0.07) ($0.08)
FOB Margin at Marcus Hook: $0.49 $0.68
Less: Pipeline & Terminal Fee (5): (0.19) (0.19)
Appalachia Netback to AR: $0.30 $0.49Upside to Appalachia Netback: $0.16 $0.18
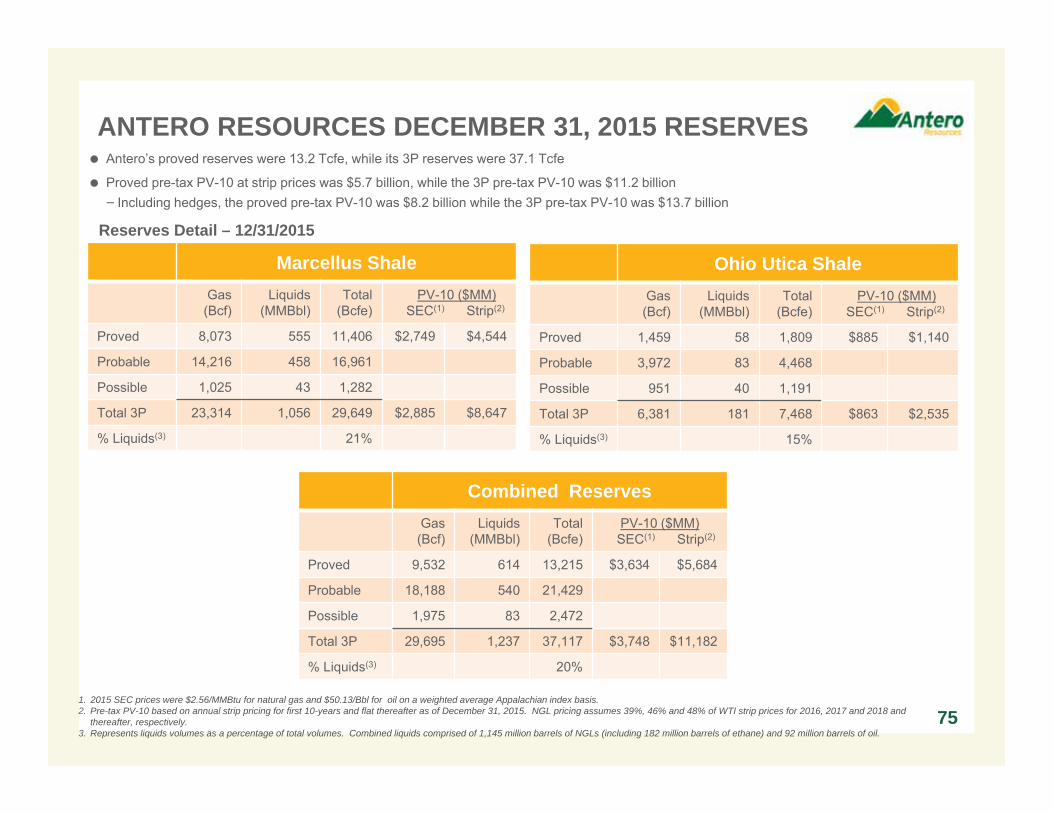
ANTERO RESOURCES DECEMBER 31, 2015 RESERVES
75
Reserves Detail – 12/31/2015
Marcellus ShaleGas(Bcf)
Liquids (MMBbl)
Total(Bcfe)
PV-10 ($MM)SEC(1) Strip(2)
Proved 8,073 555 11,406 $2,749 $4,544
Probable 14,216 458 16,961
Possible 1,025 43 1,282
Total 3P 23,314 1,056 29,649 $2,885 $8,647
% Liquids(3) 21%
Ohio Utica ShaleGas(Bcf)
Liquids (MMBbl)
Total(Bcfe)
PV-10 ($MM)SEC(1) Strip(2)
Proved 1,459 58 1,809 $885 $1,140
Probable 3,972 83 4,468
Possible 951 40 1,191
Total 3P 6,381 181 7,468 $863 $2,535
% Liquids(3) 15%
Combined ReservesGas(Bcf)
Liquids (MMBbl)
Total(Bcfe)
PV-10 ($MM)SEC(1) Strip(2)
Proved 9,532 614 13,215 $3,634 $5,684
Probable 18,188 540 21,429
Possible 1,975 83 2,472
Total 3P 29,695 1,237 37,117 $3,748 $11,182
% Liquids(3) 20%
Antero’s proved reserves were 13.2 Tcfe, while its 3P reserves were 37.1 Tcfe
Proved pre-tax PV-10 at strip prices was $5.7 billion, while the 3P pre-tax PV-10 was $11.2 billion− Including hedges, the proved pre-tax PV-10 was $8.2 billion while the 3P pre-tax PV-10 was $13.7 billion
1. 2015 SEC prices were $2.56/MMBtu for natural gas and $50.13/Bbl for oil on a weighted average Appalachian index basis. 2. Pre-tax PV-10 based on annual strip pricing for first 10-years and flat thereafter as of December 31, 2015. NGL pricing assumes 39%, 46% and 48% of WTI strip prices for 2016, 2017 and 2018 and
thereafter, respectively. 3. Represents liquids volumes as a percentage of total volumes. Combined liquids comprised of 1,145 million barrels of NGLs (including 182 million barrels of ethane) and 92 million barrels of oil.
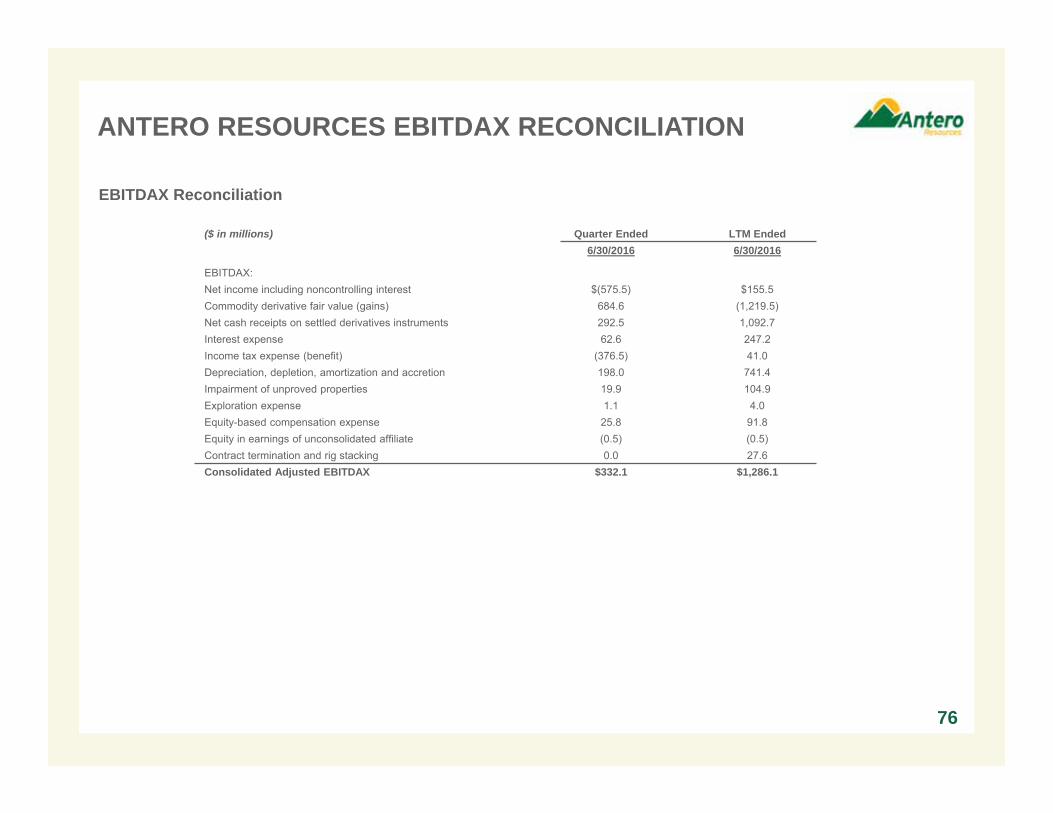
ANTERO RESOURCES EBITDAX RECONCILIATION
76
EBITDAX Reconciliation
($ in millions) Quarter Ended LTM Ended6/30/2016 6/30/2016
EBITDAX:Net income including noncontrolling interest $(575.5) $155.5Commodity derivative fair value (gains) 684.6 (1,219.5)Net cash receipts on settled derivatives instruments 292.5 1,092.7Interest expense 62.6 247.2Income tax expense (benefit) (376.5) 41.0Depreciation, depletion, amortization and accretion 198.0 741.4Impairment of unproved properties 19.9 104.9Exploration expense 1.1 4.0Equity-based compensation expense 25.8 91.8Equity in earnings of unconsolidated affiliate (0.5) (0.5)Contract termination and rig stacking 0.0 27.6Consolidated Adjusted EBITDAX $332.1 $1,286.1
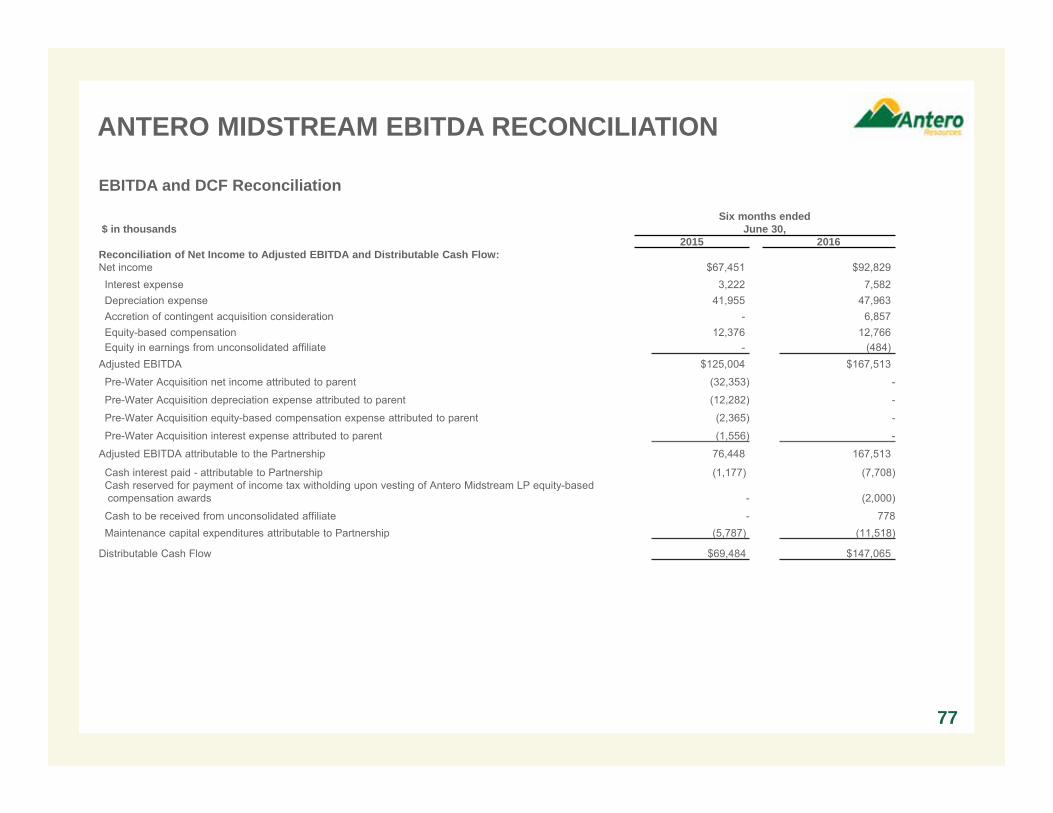
ANTERO MIDSTREAM EBITDA RECONCILIATION
77
EBITDA and DCF Reconciliation
$ in thousandsSix months ended
June 30,2015 2016
Reconciliation of Net Income to Adjusted EBITDA and Distributable Cash Flow: Net income $67,451 $92,829
Interest expense 3,222 7,582Depreciation expense 41,955 47,963Accretion of contingent acquisition consideration - 6,857Equity-based compensation 12,376 12,766Equity in earnings from unconsolidated affiliate - (484)
Adjusted EBITDA $125,004 $167,513
Pre-Water Acquisition net income attributed to parent (32,353) -
Pre-Water Acquisition depreciation expense attributed to parent (12,282) -
Pre-Water Acquisition equity-based compensation expense attributed to parent (2,365) -
Pre-Water Acquisition interest expense attributed to parent (1,556) -
Adjusted EBITDA attributable to the Partnership 76,448 167,513
Cash interest paid - attributable to Partnership (1,177) (7,708)Cash reserved for payment of income tax witholding upon vesting of Antero Midstream LP equity-basedcompensation awards - (2,000)
Cash to be received from unconsolidated affiliate - 778Maintenance capital expenditures attributable to Partnership (5,787) (11,518)
Distributable Cash Flow $69,484 $147,065
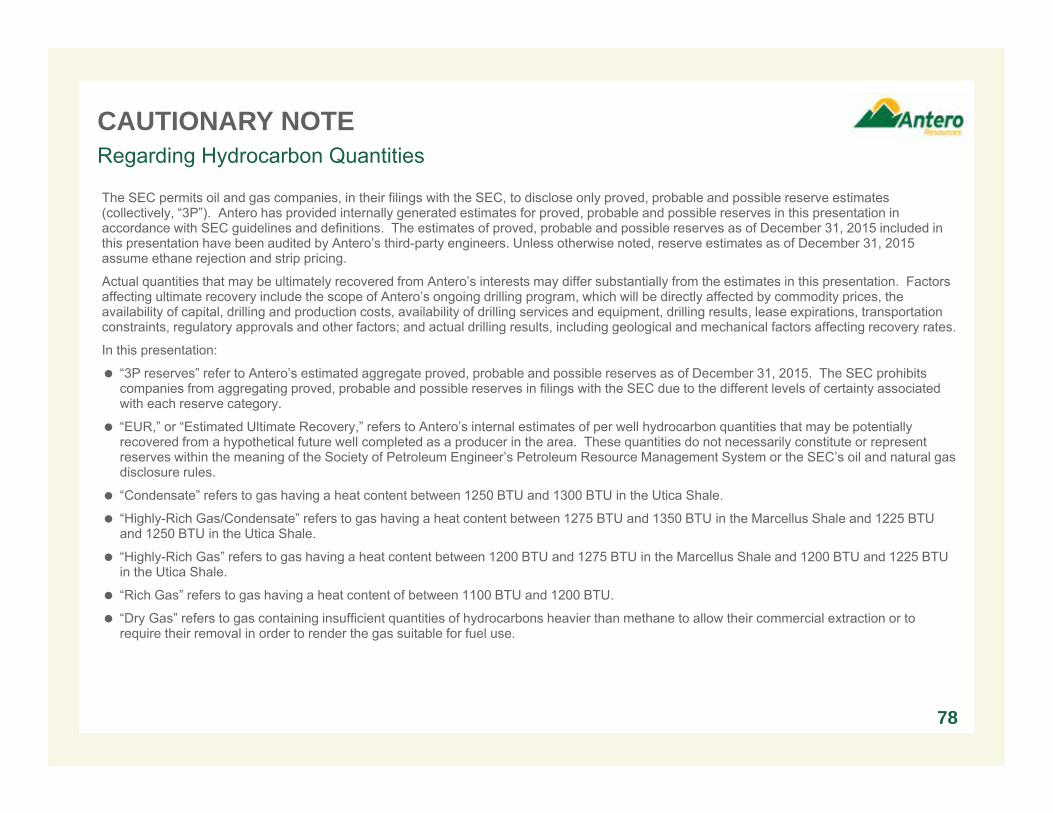
CAUTIONARY NOTE
The SEC permits oil and gas companies, in their filings with the SEC, to disclose only proved, probable and possible reserve estimates (collectively, “3P”). Antero has provided internally generated estimates for proved, probable and possible reserves in this presentation in accordance with SEC guidelines and definitions. The estimates of proved, probable and possible reserves as of December 31, 2015 included in this presentation have been audited by Antero’s third-party engineers. Unless otherwise noted, reserve estimates as of December 31, 2015 assume ethane rejection and strip pricing.
Actual quantities that may be ultimately recovered from Antero’s interests may differ substantially from the estimates in this presentation. Factors affecting ultimate recovery include the scope of Antero’s ongoing drilling program, which will be directly affected by commodity prices, the availability of capital, drilling and production costs, availability of drilling services and equipment, drilling results, lease expirations, transportation constraints, regulatory approvals and other factors; and actual drilling results, including geological and mechanical factors affecting recovery rates.
In this presentation:
“3P reserves” refer to Antero’s estimated aggregate proved, probable and possible reserves as of December 31, 2015. The SEC prohibits companies from aggregating proved, probable and possible reserves in filings with the SEC due to the different levels of certainty associated with each reserve category.
“EUR,” or “Estimated Ultimate Recovery,” refers to Antero’s internal estimates of per well hydrocarbon quantities that may be potentially recovered from a hypothetical future well completed as a producer in the area. These quantities do not necessarily constitute or represent reserves within the meaning of the Society of Petroleum Engineer’s Petroleum Resource Management System or the SEC’s oil and natural gas disclosure rules.
“Condensate” refers to gas having a heat content between 1250 BTU and 1300 BTU in the Utica Shale.
“Highly-Rich Gas/Condensate” refers to gas having a heat content between 1275 BTU and 1350 BTU in the Marcellus Shale and 1225 BTU and 1250 BTU in the Utica Shale.
“Highly-Rich Gas” refers to gas having a heat content between 1200 BTU and 1275 BTU in the Marcellus Shale and 1200 BTU and 1225 BTU in the Utica Shale.
“Rich Gas” refers to gas having a heat content of between 1100 BTU and 1200 BTU.
“Dry Gas” refers to gas containing insufficient quantities of hydrocarbons heavier than methane to allow their commercial extraction or to require their removal in order to render the gas suitable for fuel use.
Regarding Hydrocarbon Quantities
78