Company Profile Lauterbach Debug Support for RISC-V · Company ProfileLauterbach Debug Support for...
21
Lauterbach GmbH Company Profile Lauterbach Debug Support for RISC-V Bob Kupyn – Lauterbach USA Markus Goehrle - Lauterbach GmbH
Transcript of Company Profile Lauterbach Debug Support for RISC-V · Company ProfileLauterbach Debug Support for...

Lauterbach GmbH@2016
Company ProfileLauterbach Debug
Support for RISC-V
Bob Kupyn – Lauterbach USA
Markus Goehrle - Lauterbach GmbH

2016
2 / 40
COMPANY PROFILE
Leading Manufacturer of Microprocessor Development Tools
Founded in 1979 by Lothar Lauterbach
Headquarters in Hoehenkirchen, Germany (nearby Munich)
Branch offices in China (3), France, Italy, Japan, Tunisia, UK and USA (2)
Approximately 120 employees worldwide
International well-established company

2016
3 / 40
COMPANY PROFILE
Our StrengthsTechnical know-how at highest level
HW and SW debug tools is all we do.
All design, development and manufacture in Munich
Complete tool range for test and quality assurance of embedded designs
Chip/board bring-up
Driver/Bios Debug and Development
OS Debug and Development
Application Debug and Development
Widest range of supported microprocessors in the market
Including SOC with dissimilar architectures
Very early support for new processor architectures
Protection of investments through modular system concept
Long-standing relationships with customers and tool partners
2016
4 / 40
COMPANY PROFILE
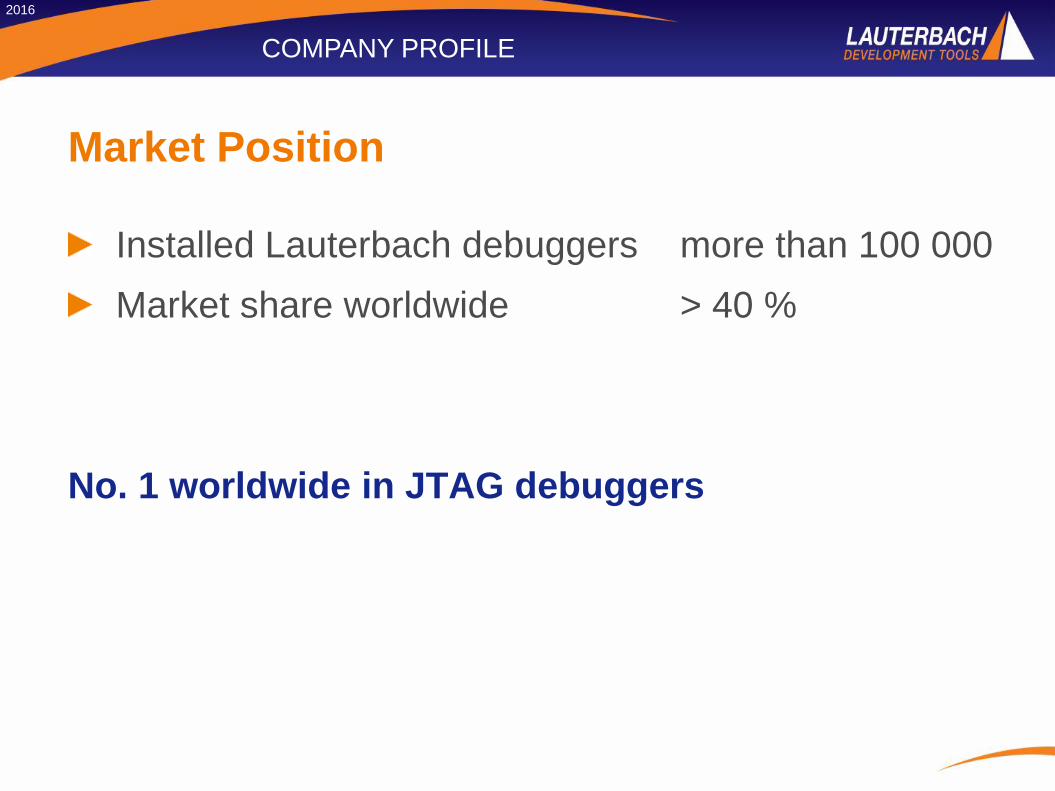
Market Position
Installed Lauterbach debuggers more than 100 000
Market share worldwide > 40 %
No. 1 worldwide in JTAG debuggers

2016
5 / 40
COMPANY PROFILE
PowerDebug USB 3
USB 3.0 interface to all hosts
Supports for all microprocessor architectures
Universal debug module, connect to target via architecture-dependent debug cables
PODBUS interface to Logic Analyzer modules
Standard In-Circuit Debugger
2016
6 / 40
COMPANY PROFILE
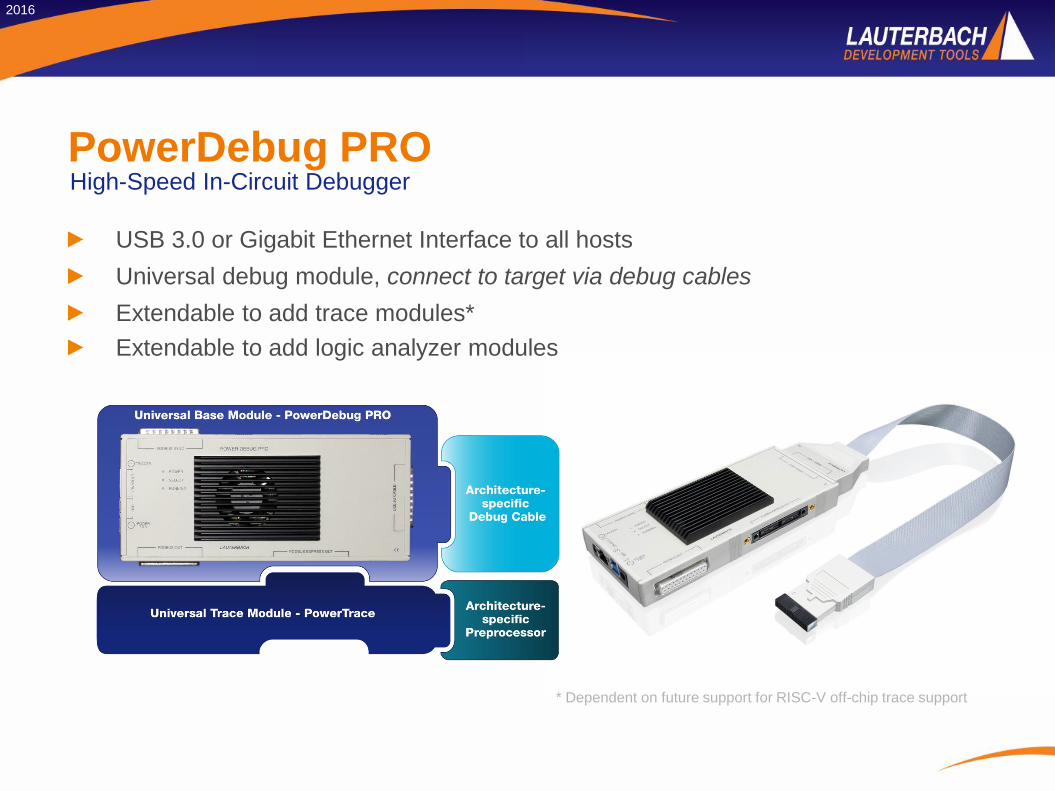
PowerDebug PRO
USB 3.0 or Gigabit Ethernet Interface to all hosts
Universal debug module, connect to target via debug cables
Extendable to add trace modules*
Extendable to add logic analyzer modules
High-Speed In-Circuit Debugger
* Dependent on future support for RISC-V off-chip trace support

2016
7 / 40
COMPANY PROFILE
ARCHITECTURE SPECIFIC DEBUG CABLE
LA-2717 JTAG Debugger for RISC-V

2016
8 / 40
COMPANY PROFILE
ARCHITECTURE SPECIFIC DEBUG CABLE
LA-2717 JTAG Debugger for RISC-V
LA-3863 ARM 20 to RISC-V 10

2016
9 / 40
COMPANY PROFILE
ARCHITECTURE SPECIFIC DEBUG CABLE
LA-2717 JTAG Debugger for RISC-V
LA-3863 ARM 20 to RISC-V 10
Add ARM

2016
10 / 40
COMPANY PROFILE
ARCHITECTURE SPECIFIC DEBUG CABLE
LA-2717 JTAG Debugger for RISC-V
LA-3863 ARM 20 to RISC-V 10
Add ARM Add ARC

2016
11 / 40
COMPANY PROFILE
ARCHITECTURE SPECIFIC DEBUG CABLE
LA-2717 JTAG Debugger for RISC-V
LA-3863 ARM 20 to RISC-V 10
Add ARM Add ARC
Add QDSP

2016
12 / 40
COMPANY PROFILE
ARCHITECTURE SPECIFIC DEBUG CABLE
LA-2717 JTAG Debugger for RISC-V
LA-3863 ARM 20 to RISC-V 10
Add ARM Add ARC
Add QDSP And others…..

2016
13 / 40
COMPANY PROFILE
ARCHITECTURE SPECIFIC DEBUG CABLE
LA-2717A JTAG Debug Addition for RISC-V

2016
14 / 40
COMPANY PROFILE
ARCHITECTURE SPECIFIC DEBUG CABLELA-2717A JTAG Debug Addition for RISC-V
Add RISC-V to ARM, etc. debug cables

2016
15 / 40
COMPANY PROFILE
Tool Chain
TRACE32 is one part of a complete tool chain that the developers use for their embedded design.
TRACE32 PowerView provides an open interface for easy integration with:
Host platforms
Model-based designs
Compilers
Target OSs
Simulators, virtual prototypes and target servers
2016
16 / 40
COMPANY PROFILE
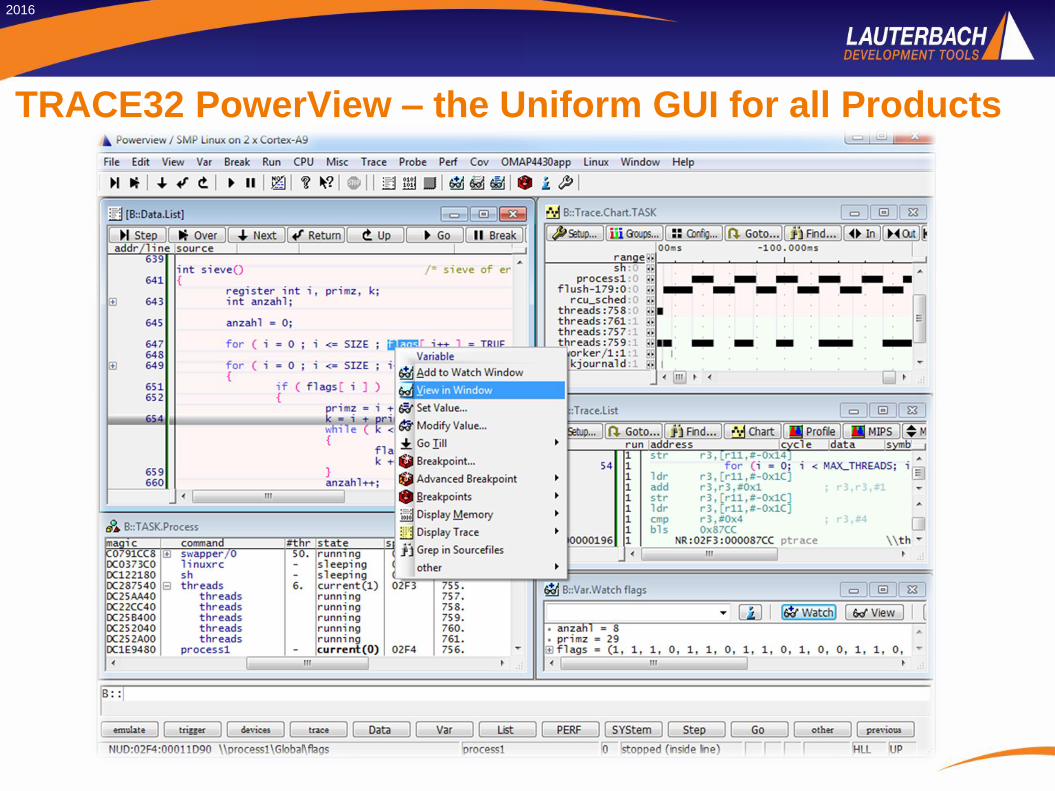
TRACE32 PowerView – the Uniform GUI for all Products

2016
17 / 40
COMPANY PROFILE
• Startup: Debug from reset vector or attach to target without altering its state
• Load program (e.g. ELF file) into target memory and extract debug information
• View program code in disassembled format or in high level language
• View call stack and local variables
• Assembler stepping, high level stepping
• Software breakpoints
• Common environment for HW debug or Instruction set simulator debug
• View and edit GPRs, program counter, floating point registers, CPU registers etc.
• View and edit memory (via CPU access or via system bus)
• Display current CPU state (running, stopped by SW breakpoint, stopped by HW breakpoint)
• Flash Programming
• Multicore debugging in SMP/AMP scenarios
TRACE32 Debugger

2016
18 / 40
COMPANY PROFILE
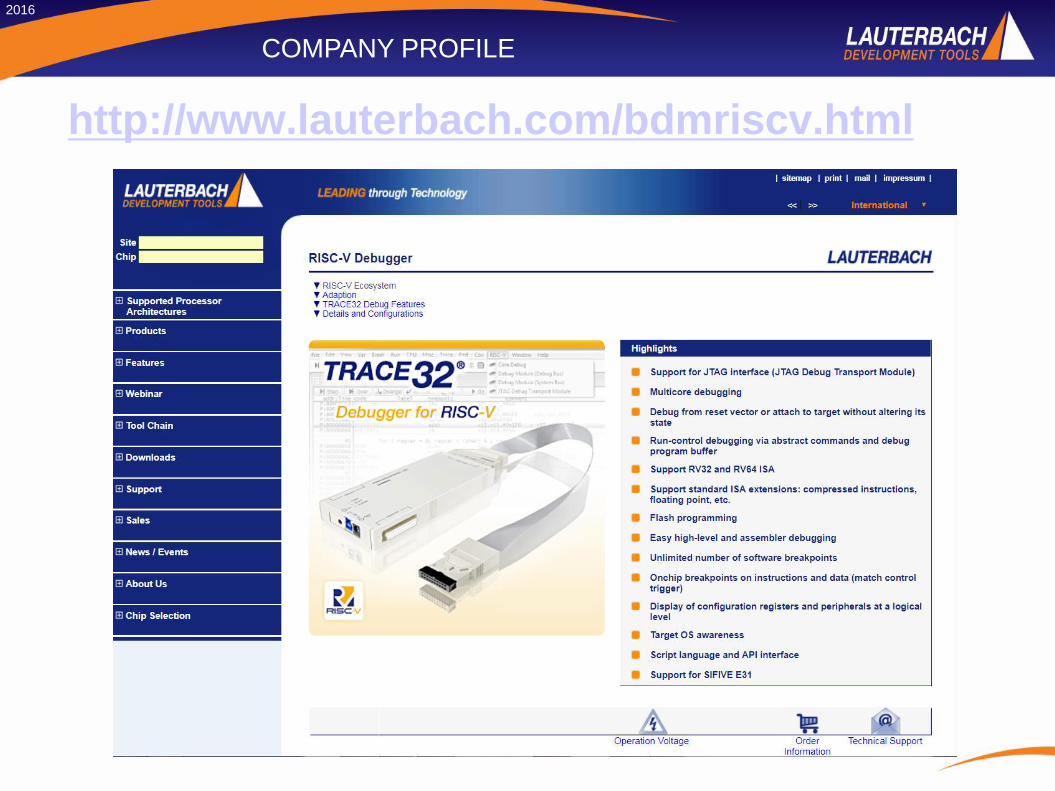
• Run-control debugging via abstract commands and debug program buffer
• Support RV32 and RV64 ISA
• Hardware instructions and data breakpoints (match control trigger)
• Support standard JTAG interface (JTAG Debug Transport Module)
• Support standard ISA extensions: compressed instructions, floating point, …
• Roadmap includes:
• Trace
• Linux / Target OS awareness
TRACE32 for RISC-V
2016
19 / 40
COMPANY PROFILE
http://www.lauterbach.com/bdmriscv.html

2016
20 / 40
COMPANY PROFILE
Current RISC-V Release and Roadmap
Supported Target Architectures and Boards:
Support RV32 and RV64 ISA
Board support for initial release: SiFive Coreplex E31 (RV32) and E51 (RV64)
Roadmap:
Multicore debugging
Trace (as suitable solutions come available)
Additional target boards
Additional Debug Transport Modules

QUESTIONS?Lauterbach GmbH@2016
Thank you!