Company Presentation - Vivendi · law, GVT can utilize IPTV technology also for broadcasting...
27
Company Presentation April 2012 Amos Genish Chief Executive Officer
Transcript of Company Presentation - Vivendi · law, GVT can utilize IPTV technology also for broadcasting...

Company PresentationApril 2012
Amos GenishChief Executive Officer

GVT Strategic Plan 3rd draft.ppt
Presenter
Amos GenishCEO
Founder and CEO since 1999
Over 22 years of experience as a Senior Executive in the technology
and telecommunications sectors
1

GVT develops a unique model rolling out the most modern network in Brazil with the best Triple Play offer (Fixed Voice, Broadband and Pay TV), innovation, and highest quality maintaining its competitive advantage
2
Attractive and innovative offers with best cost /
benefit ratio
Offers with innovative bundles at very competitive prices
GVT recognized by customers as most innovative operator with the best cost/benefit offer
Broadband speeds up to 100Mbps, highest in the market
Only operator offering TV based on IPTV technology (allowing interactive services)
Most modern network and IT platform in Brazil
Advanced, latest generation, network and last mile architecture, own local loop network with FTTC (fiber tothe curb)
One of the largest backbones in the country
Scalable & standardized processes for growth and
new areas efficient roll-out
Fully scalable sales & technical processes for roll-out in new cities
Cost-efficient geographic growth
GVT will launch around 65 new cities in the next five years (currently present in 119 cities)
Selective and variable capital expenditures due to favorable licenses terms
Build network only targeting high-usage/high margin customer in most profitable areas throughoutBrazil
Powerful geo-marketing strategy and
Favorable license terms
GVT is recognized as having the highest quality of service, with the highest customer engagementSuperior Customer Care
Territorial and network expansion - enter ~65 new cities in the next 5 years
Broadband leadership – continue to deliver higher speeds than the market with the best cost/benefit ratio
Expand into new segments: PayTV and Data Centers
Three initiatives will drive the company for the future
Sustainable competitive advantages in a favorable macroeconomic and competitive environment
Growth Drivers
Proven track record and continuously accelerated quality growth
Revenue CAGR of 41% and EBITDA CAGR of 46% over 2009-2011, highest EBITDA Margin in Brazil amongTelco operators
2012 Guidance: Revenue growth in the mid 30’s, EBITDA Margin around 40%, Total CapEx R$ 2.3billion orEUR ~1 billion (of which R$500 million to Pay TV), Telecom FCF to Breakeven
2014 outlook: Revenue ~ R$ 7 billion or EUR ~3.0 Billion* (CAGR of ~31% 2011-2014)
2016 outlook: Revenue ~ R$ 10 billion or EUR 4.2 Billion* (CAGR of ~18% 2014-2016)
Fastest growing telecommunication service provider in Brazil in terms
of Revenue and EBITDA
* Based on exchange rate of EUR 1 = BRL 2.38

1- Internet Segment revenue (VoIP based services + Internet Dial-up service) is included in the Retail revenue* Includes ISP and VONO
Retail1Corporate
21%
41%
NET REVENUES
R$ millions
PayTV
EBITDA
EBITDA Margin
503 656 1,009 1,393 40%
38.1% 38.6% 41.8% 41.5%
27.4
6.8
34.4
43.1
37.2
44.6
39.0
21.4
43.1
CAGR
Financial results
3
36%
CapEx R$ million 762 698 1,317 1,843
NET REVENUE
EBITDA
498 601 1,029 1,446
47%190 240 431 601
CAPEX 287 255 562 795
43%
EURO millions

* Includes ISP and VONO
Operational results
4
Lines in service
RetailCorporatePayTV
RetailCorporatePayTV
Net New Adds
CAGR
CAGR

Brazilian economy is expected to continue to grow due to internal and external factors, resulting in an improvement of income distribution and spurring growth of Corporate segment
5
16% 12% 9%
24%18%
13%
49%55%
59%
7% 10% 11%3% 6%
8%
2008 2011 2017
A Class (> R$ 12,440)
B Class (R$ 6,220-R$ 12,440)
C Class (R$ 2,448-R$ 6,220)
D Classe (R$ 1,244-R$ 2,488)
E Class (< R$ 1,244)
Sources GVT calculation, based on IBGE and FGV data
ABC classes expected to gain 13 million people over 2011 – 2017
Corporate will grow 13% by 2017
Businesses (M)Population by socio-economic class (M)
Social Class andFamily monthly income
204195190
3.8(75%)3.4
(75%)3.1
(75%)
4,14,4
5,0
2008 20172011
+13%
CAGR = 2%
ABC Classes113 137 158
Country population

Regulatory and Competitive environment
6
Reduction of MTR
Upside to GVT Margin but not strongenough reduction to trigger materialmigration of traffic from fix-to-mobile,at least until 2015 (MTR 2012: EUR0.159, MTR 2014: EUR 0.131)
Bill and Keep
Planned to be introduced in 2012 andwill enable GVT to introduce unlimitedlocal packages, which will maintainvoice ARPU
SeAC Law (TV Law)
A new law passed in 2012 that willenable Telcos to operate TV via cablesand not only via satellite. Due to thislaw, GVT can utilize IPTV technologyalso for broadcasting services
1 Regulation
No Major movements yet by the incumbents toupgrade their networks to fiber connectivity,allowing GVT to maintain its competitiveadvantage on Broadband and IPTV at least inthe short and mid-run
Some price pressure in all segments ascompetitive environment is more intense
TIM fiber plans to launch residential broadbandservice in the cities of Sao Paulo and Rio deJaneiro, which should introduce a new player inthose markets
2 Competition

Market and Competitive environment – Intense and growing competitive environment
7Source: operators data, Teleco, Morgan Stanley for full year 2011(1) NET does not show split of revenues for fixed broadband and Pay-TV : all NET revenues are included here in the “Pay-TV section” , Fixed BB revenues shown here are only for Embratel (2) 2010 data, 2011 not yet issued by Oi
(2011 data)America
Movil (Slim)Group
Telefonica Group
PortugalTelecom
TIM SkyNumber of lines 2011
(M)
Number of lines 2017
(M)
2011-2017 CAGR
Group EBITDA margin (%) 26.2% 36.3% 31.4% 27.1% 28.0%
Fixed
VoiceRevenues: R$
7.75B(CAGR 10-11:
3.2%)
Revenues: R$8.1B
(CAGR 10-11: -9%)
Revenues: R$ 25B (CAGR 10-
11: -11.8%)
42.9 47.7 1.8%
BroadbandRevenues: R$
3.3B(1)
(CAGR 10-11: 2.6%)
Revenues: R$ 3.4B
(CAGR 10-11: 10.8%)
Revenues: R$9.3B(2)
(CAGR 09-10: 0.6%)
16.5 28.0 9.2%
Mobile
Voice Revenues: R$ 12.4B
(CAGR 10-11: 5.4%)
Revenues: R$ 18.6B
(CAGR 10-11: 12.6%)
Revenues: R$ 10.4B (CAGR 10-11: 15%)
Revenues: R$ 17B
(CAGR 10-11: 18%)
242 329 5,3%
Broadband 7.8 20.4 17.4%
Pay TV Revenues: R$ 7.9B(1)
(CAGR 10-11: 17.5%)
Revenues: R$0.65B
(CAGR 10-11: 57.4%)
Revenues: R$ 0.38B (CAGR 10-11: 57.9%)
Revenues: R$5.7B
(CAGR 10-11: 46.7%)
12.7 22.3 9.8%
Competitors Market data

Strategy and drivers
8
Broadband: increase
leadership
Pay-TV: gain market share
quickly
• Best cost/ performance ratio
• Best experience through VAS and content
• Boost penetration in existing customer base and have high take-out of new customers
• Expand Data Center & Managed Services business
Voice: maintain
ARPU
• New technologies• New portfolio
based on VoIP/SIP platform
• Move to unlimited packages
Reference of customer care
Make organization more efficient
Accelerate coverage
• Lead the market in customer engagement with the lowest churn rates
• Continue adapting organization to fast growth and make it more efficient
• Accelerate network expansion and population coverage• Be in most mid-sized and large Brazilian cities
Take the lead on innovation and enter
new segments
• Introduce constantly new products and features for voice, broadband, data and TV leveraging GVT’s unique platform
GVT aims to become the 1st alternative player in Telecom and Pay-TV through continuous network expansion, product innovation and excellence in customer relationship
Dri
vers
of
Gro
wth
an
d M
argi
n
Strategy by Segments
Data Centers: Corporate portfolio to be enhanced by expansion of Data
Centers

Accelerate Coverage - Accelerate network expansion and population coverage, be in most mid-sized and large Brazilian cities
9
AM
RRAP
PA MA
PI
CE
BA
MG
RJ
SEAL
PEPB
ACRO
MT
TO
GO
MS
PR
RS
SP
11
2
8
1
1
3
2
30
13
24
6
4
3
RN
2
DF
ES
SC
3
5
10
Region I(Oi)
Region II(Oi)
Region III(Telefonica)
Region IV: Nationwide long
distance (Embratel)
Sources: IBGE, INSEE, Office for National Statistics, CIA Factbook
GVT is currently present in 119 cities~185 cities in 2017
Number of cities with GVT Presence
Market in covered cities (M) (households + businesses)
Homes passed (M)
CAGR = +14,4%
17 19
28
2011 2012 2017
Market covered by GVT’s network where GVT has presence
42%46%
57%
2011 2012 2017
7 916
2011 2012 2017

Accelerate Coverage – GVT is increasing its market share nationally
10
GVT is gaining Market Share in all segments and all cities. However, GVT still has opportunities to further expand geographically and gain higher market share nationwide
# of cities in operation
Voice market share in homes passed area
Voice Market Share (Nationwide) 3% 4% 5% 7%
Broadband Market Share (Nationwide) 5% 6% 8% 10%
2008 2009 2010 2011
12%
17%
2017
Pay TV Market Share (Nationwide) NA NA NA 0,3% 8%
75 81 95 119 ~185
23.7% 23.3% 22.2% 23.1% 25.9%

Accelerate Coverage – Continue to expand backbone and access network
11
Growth
Backbone extension evolution
Route Kilometers
Accesses of last mile built-out per year
* Not considering accesses launched in the last 6 months** Estimated figures
CapEx Efficiency*
Network Utilization
Despite GVT’s network being young, GVT has reached
network utilization at the same level of incumbents

GVT’s most up-to-date core network architecture enabling the Company to lead on product innovation and performance
Take the lead on innovation – Most advanced network in Brazil
12
Core with full IP convergence based on IMS (IP Multimedia Subsystem) and SIP Protocol, supporting MultimediaServices and voice over IP with highest quality services
Incumbents have mostly core based on circuit switched technology where voice and data network are separated
Last Mile architecture: GVT last mile architecture is based on FTTC (Fiber to the cabinet) delivering up to 100 Mbpsper client, while incumbents last mile is mostly based on long copper, with limited broadband capacity
Fiber metro ring – Maximum 5 SC(Currently 10 Gbps Evolving to 100 Gbps)
Short copper last mile – mostly VDSL2 technologyAverage 400 m – up to 70 Mbps per subscriber
Fiber last mile (FTTH) – up to 100 Mbps per subscriber
Switch(Core: IP and IMS based)
Street cabinet (SC)With up to 1600 customers
(Voice + Broadband)
GVT’s Fiber-oriented Last Mile Architecture enables ultra high broadband speeds
Growing focus in the next 5 years
Fiber OpticsCopper

TV
Take the lead on innovation - From a dumb pipe to a smart pipe
13
Content
VAS
GVT‘s Pipe
Voice
Broadband
IPTV
Personalized Music
Video Games
Home Gateway (connected home)
Internet Security
Online Backup
Home Monitoring (2012)
Home Surveillance (2012)

New services
One number 1
HD VoicePortable phone
everywhere
RCS(Rich Communication Suite) 2
Take the lead on innovation - GVT unique full IP Convergence (IMS, SIP) will allow to launch new innovative voice products
Call log on the TV screen Future: calls on TV screen
Home automation: Remote Cameras Remote power on/off
Mediaphone Video call / conference Internet access HD Voice
1 One unique number shared in the Fixed, Mobile and IP Phones2 Innovative technology platform integrating services (Voice,
Media, Entertainment)
14

Take the lead on innovation – Broadband leadership
15
• GVT’s network topology and technology, combining optical fiber rings with a short copper last mile, enable GVT to provide ultra high speeds up to 100Mbps with premium quality and affordable prices
• The expansion of GVT’s own backbone allows GVT to offer ultra high speeds at attractive prices and in a profitable way
• Broadband penetration – 92% of retail customers (4Q11)• Explosive demand for high speed internet – demand on video over the internet working in GVT’s favor
Superior quality broadband with attractive prices
35Mbps at R$ 89.90 (€ 38)
Low broadband speeds in Brazil are the market standard1
…while GVT is significantly ahead of the market (4Q11 base)…
…and continues to increase its advantage vs. the overall market (4Q12 expected sales)
Client average speed CAGR
Broadband prices in R$ (3P)
Lower than10Mbps Equal or higher
than 15 Mbps
10Mbps
Average National Broadband Speed 1.9 Mbps
2009 2010 2011 2012
15Mbps 99.90 79.90 79.90 79.90
35Mbps 199.90 199.90 99.90 89.90
Price per Mega (R$)
6.99 6.99 5.33 2.54
…increasing customer base average speed over time with higher ARPU and lower costs
GVT’s average broadband speed of customer base2
79% 84% 88% 92%
2009 2010 2011 2012
Broadbandpenetration (%)
+57%
5.18.4
10.819.7
Client average Speed (Mbps)
X
1 2 3
4 5
9%
57%25%
9%
Equal or higher than 35 Mbps
Between 15 and 35 Mbps
10 Mbps
Lower than 10 Mbps
37%
38%
25%
1. Source: Akamai2. Does not include SME
15

Take the lead on innovation – GVT’s Pay TV is the 1st in the market based on IPTV technology
16
GVT launched commercially its TV offer in January 2012
Pay TV completes GVT’s triple-play offer, bringing to the market an innovative and differentiated product with competitive pricing, following GVT’s strong positioning in Telecom
First company in Brazil to use an HD Hybrid Model (Satellite + IPTV)
HIGH DEFINITION Video on Demand / Catch-up TV
Interactive Applications (Personalized Music, Twitter, Weather etc.)
To be launched in 2012: S-VoD, Multiroom PVR, Facebook, Youtube and PIP, among others …
More than 140 channels, 30 in HD
3,000 hours of On Demand
Interactive Music
Image rich and HD graphical interface
CONNECTIVITY
BEST CONTENT OFFER
MODERN AND USER-FRIENDLY
Available to 100% of clients, from the first package
~400k clients are expected to subscribe to GVT TV before December 2012 with R$ 90 (€ 38) TV ARPU (~110K customers in March 2012)
By Dec 2012 GVT TV penetration on GVT’s Broadband base is expected to be 20%
40% of GVT TV sales are made to new customers (bundles with Pay TV, broadband and voice)
UNIQUE VALUE
PROPOSITION

Take the lead on innovation – Fast growing market share of new net adds in TV segment
17
GVT is already the leader of TV net adds in some States
.
Share of GVT TV Net New Adds - Total segment nationwide
2% 3%5%
8% 10%
oct/11 nov/11 dec/11 jan/12 feb/12
Share of GVT TV Net New Adds – only in states where GVT operates *
3% 5%8%
11% 14%
oct/11 nov/11 dec/11 jan/12 feb/12
Paraná
44.4%
Espírito Santo
37.6%
Distrito Federal
35.9%
Ceará
35.2%
* Except in the State of São Paulo
Sources: ANATEL and GVT
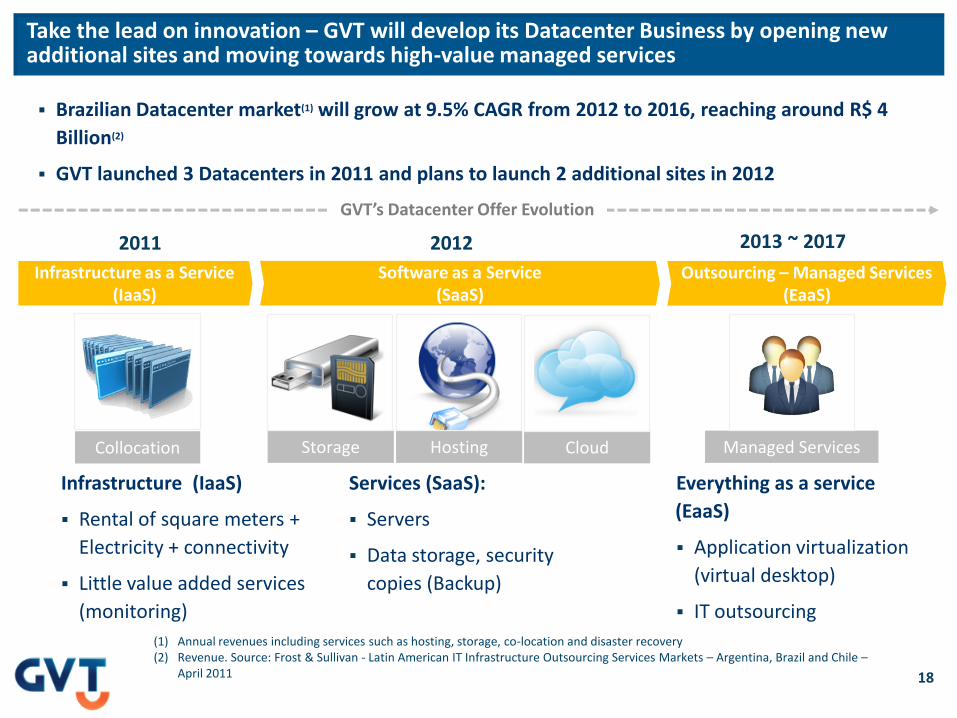
Take the lead on innovation – GVT will develop its Datacenter Business by opening new additional sites and moving towards high-value managed services
18
2011 2012 2013 ~ 2017
Services (SaaS):
Servers
Data storage, security
copies (Backup)
Everything as a service
(EaaS)
Application virtualization
(virtual desktop)
IT outsourcing
Infrastructure as a Service(IaaS)
Software as a Service(SaaS)
Outsourcing – Managed Services(EaaS)
Collocation Storage HostingHosting Cloud Managed Services
Infrastructure (IaaS)
Rental of square meters +
Electricity + connectivity
Little value added services
(monitoring)
Brazilian Datacenter market(1) will grow at 9.5% CAGR from 2012 to 2016, reaching around R$ 4
Billion(2)
GVT launched 3 Datacenters in 2011 and plans to launch 2 additional sites in 2012
(1) Annual revenues including services such as hosting, storage, co-location and disaster recovery(2) Revenue. Source: Frost & Sullivan - Latin American IT Infrastructure Outsourcing Services Markets – Argentina, Brazil and Chile –
April 2011
GVT’s Datacenter Offer Evolution

Reference of customer care – GVT will actively reduce its churn rate by increasing the gap vis-à-vis competition and the engagement of its customer base
19
1,4% 1,2%
20112010
Reduction of churn rate (residential and SME)High engagement and
recommendation rate help reduce
churn levels
GVT focuses on increasing quality
Better quality generates higher engagement and recommendation
rate
EngagementGVT’s Recommendation
rate
2011
26%
25%
22%
28%
2010
29%
25%
20%
26%
Engaged
Totally engaged
Actively Disengaged
Disengaged
20112010
49%47%
Does it always bring innovation vs. the market?
Is broadband cost lower than similar speeds from other operators?
Does it present low level of technical problems?
Product gap (%) Cost benefit gap (%) Quality gap (%)
16%21%
39%27%
17%17%
39%
21% 23%25%
51%
22%
Sources : Gallup Consulting, survey conducted between Sep/2010 and Set/2011
45% 45% 29%
44%53% 34%21%
28%15%26% 30%
25% 17%20%
28% 24%12%
LoyaltyRecommendation
25%
Continuity
47%
Satisfaction
Telefonica
Net
Oi
GVT
Top 10% World

Make the organization more efficient – GVT will continue to invest in innovation to further enhance its value proposition, while undertaking efficiency improvement programs
20
Key initiatives to improve EBITDA Margin
Innovations to increase ARPU
• IPTV - bringing to the market innovative and differentiated triple play bundles (higher margin per user than dual play)
• Ultra-fast broadband speeds – delivering ultra speeds at affordable prices, helping GVT maintain the gap vis-à-vis competition, increasing ARPU via migration to higher speeds
• Multimedia and IP revolution in the voice portfolio – revenue from value added services and differentiated products
• Data Center Business – enhancing GVT’s value proposition in the Corporate Segment, enabling higher share of wallet per customer
39%42% 42%
20%
25%
30%
35%
40%
45%
2009 2010 2011
GVT has the highest EBITDA margin among Brazilian Telcos
GVT
Telefonica BrazilOi
TIMAmerica Movil Brazil
Operational Efficiency aiming to reduce OpEx and CapEx
• End-to-end improvement of order-to-invoice process – will enable GVT to improve its operations while delivering a more OpEx-efficient organization, including for the 1st time field workforce management
• Strategic Sourcing – allowing GVT to better plan its CapEx acquisitions achieving better cost/benefit ratio on CapEx
• Call Center self-caring evolution – will enable GVT to increase the penetration of customer self-service, which will decrease the need of personnel, while maintaining the best customer service in the market
• GVT 2011 Telecom EBITDA margin of 43% (42% in 2010)
• GVT Telecom Business shows improved EBITDA margin due to gains of scale
• Pay TV business negative impact in 2011 due to pre-operational OpEx
GVT’s EBITDA margin of Telecom continues to improve
Source: Companies’ Financial ReportsAmerica Movil Brazil Group represents Claro, NET and Embratel together

2012, Mid Term and Long Term outlook for GVT
21
• Revenue growth in the mid 30’s
• EBITDA Margin around 40%
• Total CapEx R$ 2.3billion (of which R$500 million to Pay TV)
• FCF* Telecom: Breakeven
Financial2012 guidance
(Telecom + PayTV)
Financial 2014 & 2016 outlook
(Telecom + PayTV)
• Revenue: ~ R$ 7 billion in 2014 (CAGR 2011-2014: 31%), ~ R$ 10 billion in 2016 (CAGR 2014-2016: 18%)
• EBITDA Margin: slightly above 40% (2014 and 2016)
• Average CapEx per Year: ~ R$ 2 – 2.5 billion** (mostly growth related for Telecom and TV)
• PayTV EBITDA to become positive in 2013
*EBITDA (-) CapEx
* EBITDA - CapEx** Based on exchange rate of USD 1 = BRL 1.80

GVT develops a unique model rolling out the most modern network in Brazil with the best Triple Play offer (Fixed Voice, Broadband and Pay TV), innovation, and highest quality maintaining its competitive advantage
22
Attractive and innovative offers with best cost /
benefit ratio
Offers with innovative bundles at very competitive prices
GVT recognized by customers as most innovative operator with the best cost/benefit offer
Broadband speeds up to 100Mbps, highest in the market
Only operator offering TV based on IPTV technology (allowing interactive services)
Most modern network and IT platform in Brazil
Advanced, latest generation, network and last mile architecture, own local loop network with FTTC (fiber tothe curb)
One of the largest backbones in the country
Scalable & standardized processes for growth and
new areas efficient roll-out
Fully scalable sales & technical processes for roll-out in new cities
Cost-efficient geographic growth
GVT will launch around 65 new cities in the next five years (currently present in 119 cities)
Selective and variable capital expenditures due to favorable licenses terms
Build network only targeting high-usage/high margin customer in most profitable areas throughoutBrazil
Powerful geo-marketing strategy and
Favorable license terms
GVT is recognized as having the highest quality of service, with the highest customer engagementSuperior Customer Care
Territorial and network expansion - enter ~65 new cities in the next 5 years
Broadband leadership – continue to deliver higher speeds than the market with the best cost/benefit ratio
Expand into new segments: PayTV and Data Centers
Three initiatives will drive the company for the future
Sustainable competitive advantages in a favorable macroeconomic and competitive environment
Growth Drivers
Proven track record and continuously accelerated quality growth
Revenue CAGR of 41% and EBITDA CAGR of 46% over 2009-2011, highest EBITDA Margin in Brazil amongTelco operators
2012 Guidance: Revenue growth in the mid 30’s, EBITDA Margin around 40%, Total CapEx R$ 2.3billion orEUR ~1 billion (of which R$500 million to Pay TV), Telecom FCF to Breakeven
2014 outlook: Revenue ~ R$ 7 billion or EUR ~3.0 Billion* (CAGR of ~31% 2011-2014)
2016 outlook: Revenue ~ R$ 10 billion or EUR 4.2 Billion* (CAGR of ~18% 2014-2016)
Fastest growing telecommunication service provider in Brazil in terms
of Revenue and EBITDA
* Based on exchange rate of EUR 1 = BRL 2.38

23
Appendix

Vivendi’s support encourages GVT to accelerates growth
Revenues: €1,446m, +41% (+39% at constant currency)
Growth fueled by coverage expansion and excellent value
proposition
Broadband service revenues up 58% and Voice revenues
up 34% (+56% and +33% at constant currency, respectively)
2,094k* net adds in lines in services (LIS), +48% yoy
GVT ultra-fast broadband edge maintained: average
broadband speed of 10.8Mbps** above average Brazilian
speed of 1.9Mbps***, 64% of Q4 sales with 15Mbps or higher
or higher
Nationwide broadband market share of 9%**, 568K broadband
net additions
EBITDA: €601m, +39%
Telecom EBITDA margin of 42.7%, up 0.8pt
Better product mix, including the widespread penetration of
bundle with data and higher speeds
Continued cost optimization
Initial OpEx for pay TV
EBITA: €396m, +43%
Growth of depreciation due to network rollout
* Without Pay-TV
** As of December 31, 2011
*** Sources: Akamai Institute, Info Exame, IBRC
Expansion in 22 new cities in 2011, now 119 cities are
covered by GVT**
GVT recognized as the best broadband service in Brazil
and the best fixed telephony customer service***
Successful “soft” launch of pay TV offer in Q4 2011,
“media” launch in January 2012 (32k subscribers as of
end 2011, ~80k already as of end February 2012)
Successful partnership with Universal Music, and
launch of partnership with Activision Blizzard
HIG
HL
IGH
TS
In euro millions - IFRS 2011 2010 Change Constant
Currency
Revenues 1,446 1,029 + 40.5% + 39.0%
Telecoms 1,444 1,029 + 40.3% + 38.8%
Pay-TV 2 -
EBITDA 601 431 + 39.4% + 37.9%
EBITDA Margin 41.6% 41.9% - 0.3 pt
Telecoms 616 431 + 42.9% + 41.5%
Pay-TV (15) -
EBITA 396 277 + 43.0% + 41.4%
24

Important legal disclaimer
This presentation contains forward-looking statements with respect to Vivendi’sfinancial condition, results of operations, business, strategy, plans and outlook ofVivendi, including projections regarding the payment of dividends as well as theimpact of certain transactions. Although Vivendi believes that such forward-lookingstatements are based on reasonable assumptions, such statements are notguarantees of future performance. Actual results may differ materially from theforward-looking statements as a result of a number of risks and uncertainties, manyof which are outside Vivendi’s control, including but not limited to the risks related toantitrust and other regulatory approvals in connection with certain transactions aswell as the risks described in the documents of the group that Vivendi filed with theAutorité des Marchés Financiers (French securities regulator) and which are alsoavailable in English on Vivendi's website (www.vivendi.com). Investors and securityholders may obtain a free copy of documents filed by Vivendi with the Autorité desMarchés Financiers at www.amf-france.org, or directly from Vivendi. These forward-looking statements are made as of the date of this presentation and Vivendidisclaims any intention or obligation to provide, update or revise any forward-lookingstatements, whether as a result of new information, future events or otherwise.
25

Vivendi Investor Relations Team
26