
COMPANY PRESENTATION SEPTEMBER 2018 · company presentation – september 2018 1. 1h’18 financial...
200
COMPANY PRESENTATION – SEPTEMBER 2018
Transcript of COMPANY PRESENTATION SEPTEMBER 2018 · company presentation – september 2018 1. 1h’18 financial...

COMPANY PRESENTATION – SEPTEMBER 2018

COMPANY PRESENTATION – SEPTEMBER 2018
COMPANY PRESENTATION – SEPTEMBER 2018
DISCLAIMER (1/2)
▬ In General. This document (the “Presentation”) has been prepared by Pirelli & C. S.p.A. (“Pirelli” or the “Company” and, together with its subsidiary the “Group”) and is being
f urnished f or inf ormation purposes only in order to generally present the Group and its business. This presentation does not purport to be completed or exhaustiv e.
▬ No distribution of this Presentation. This Presentation is being f urnished to y ou solely f or y our inf ormation and may not be reproduced, in whole or in part, or redistributed to
any other indiv idual or legal entity .
▬ Forward-looking statement. “Forward-looking statements” (which expression shall include opinions, predictions or expectations about any f uture ev ent) that may be contained
in the Presentation are based on a v ariety of estimates and assumptions by the Group, including, among others, estimates of f uture operating results, the v alue of assets and
market conditions. These estimates and assumptions are inherently uncertain and are subject to numerous business, industry , m arket, regulatory , geo-political, competitiv e and
f inancial risks that are outside of the Group’s control. There can be no assurance that the assumptions made in connection wi th the f orward-looking statements will prov e
accurate, and actual results may dif f er materially . The inclusion of the f orward-looking statements herein should not be regarded as an indication that the Group considers the
f orward-looking statements to be a reliable prediction of f uture ev ents and the f orward-looking statements should not be relied upon as such. Neither the Group nor any of its
representativ es has made or makes any representation to any person regarding the f orward-looking statements and none of them intends to update or otherwise rev ise the
f orward-looking statements to ref lect circumstances existing af ter the date when made or to ref lect the occurrence of f uture ev ents, ev en in the ev ent that any or all of the
assumptions underly ing the f orward-looking statements are later shown to be in error.
▬ No update. The inf ormation and opinions in this Presentation is prov ided to y ou as of the dates indicated and the Group does not undertake to update the inf ormation contained
in this Presentation and/or any opinions expressed relating thereto af ter its presentation, ev en in the ev ent that the inf orm ation becomes materially inaccurate, except as
otherwise required by applicable laws.
▬ No offer to purchase or sell securities. The inf ormation, statements and opinions contained in this Presentation are f or inf ormation purposes only and do not constitu te a
public of f er under any applicable legislation or an of f er to sell or solicitation of an of f er to purchase or subscribe f or securities or f inancial instruments or any adv ice or
recommendation with respect to such securities or other f inancial instruments. None of the securities ref erred to herein hav e been, or will be, registered under the U.S.
Securities Act of 1933, as amended, or the securities laws of any state or other jurisdiction of the United States or in Aust ralia, Canada or Japan or any other jurisdiction where
such an of f er or solicitation would be unlawf ul (the “Other Countries”), and there will be no public of f er of any such securi ties in the United States. This Presentation does not
constitute or f orm a part of any of fer or solicitation to purchase or subscribe f or securities in the United States or the Ot her Countries.
▬ Financial information. Some f inancial inf ormation contained in this Presentation deriv es f rom carv e-out f inancial statements prepared in the context of the IPO and listing of
the Company ’s shares on Mercato Telematico Azionario organised and managed by Borsa Italiana S.p.A.. Theref ore, such inf ormation may not be f ully comparable with past
and f uture perf ormance of the Group. Due to rounding, numbers presented throughout this Presentation may not add up precisely to the totals prov ided and percentages may
not precisely ref lect the absolute f igures.
Neither the Company nor any member of the Group nor any of its or their respectiv e representativ es, directors, employ ees or agents accept any liability whatsoev er in
connection with this Presentation or any of its contents or in relation to any loss arising f rom its use or f rom any reliance placed upon it.
Francesco Tanzi, the manager in charge of preparing the corporate accounting documents, declares that, pursuant to art. 154-bis, paragraph 2, of the Legislativ e Decree no. 58
of February 24, 1998, the accounting inf ormation contained herein correspond to document results, books and accounting records.
3

COMPANY PRESENTATION – SEPTEMBER 2018
DISCLAIMER (2/2)
Non-IFRS and Other Performance Measures
This Presentation contains certain items as part of the f inancial disclosure which are not def ined under IFRS. Accordingly , these items do not hav e standardized meanings and may
not be directly comparable to similarly -titled items adopted by other entities.
Pirelli management has identif ied a number of “Alternativ e Perf ormance Indicators” (“APIs”). These APIs (i) are deriv ed f rom historical results of Pirelli & C. S.p.A. and are not
intended to be indicativ e of f uture perf ormance, (ii) are non-IFRS f inancial measures and, although deriv ed f rom the Financial Statements, are unaudited and (iii) are not an
alternativ e to f inancial measures prepared in accordance with IFRS.
The APIs presented herein are [EBIT, EBIT margin, EBITDA, EBITDA margin, net income and net income margin].
In addition, this Presentation includes certain measures that hav e been adjusted by us to present operating and f inancial perf ormance net of any non-recurring ev ents and non-core
ev ents. The adjusted indicators are EBITDA adjusted, EBITDA adjusted without start up costs, EBIT, EBIT adjusted, EBIT adjusted without start up costs, net income adjusted.
In order to f acilitate the understanding of our f inancial position and f inancial perf ormance, this Presentation contains other perf ormance measures, such as Fixed Assets related to
continuing operations, Prov isions, Operating Working Capital related to continuing operations, Net Working Capital related to continuing operations, Net Financial (liquidity ) / debt
Position.
These measures are not indicativ e of our historical operating results, nor are they meant to be predictiv e of f uture results.
These measures are used by our management to monitor the underly ing perf ormance of our business and operations. Similarly entitled non-IFRS financial measures reported by
other companies may not be calculated in an identical manner, consequently our measures may not be consistent with similar measures used by other companies. Theref ore,
inv estors should not place undue reliance on this data.
4

COMPANY PRESENTATION – SEPTEMBER 2018
1. 1H’18 FINANCIAL RESULTS
2. FY 2017 FINANCIAL RESULTS
3. STRATEGY AND PLAN 2017-2020
3a. PIRELLI AT A GLANCE
3b. KEY INVESTMENT HIGHLIGHTS
3c. MARKET AND COMPETITION
3d. HIGH VALUE STRATEGY: LEVERS AND REGIONAL DEPLOYMENT
3e. HIGH VALUE STRATEGY: START-UPS
3f. TRANSFORMATION PROGRAMS
3g. STANDARD PROGRAMS
3h. TARGETS 2020
4. GOVERNANCE
5. SUSTAINABILITY
6. APPENDIX
AGENDA
5

COMPANY PRESENTATION – SEPTEMBER 2018
KEY MESSAGES_
>
>
> FY’18 OUTLOOK
▬ Our Value drivers (Price/Mix and HV volume growth) are keeping the pace in line with our guidance
▬ Top line organic growth expected to be at 7% due to the accelerating reduction on Standard
▬ Profitability and Cash Flow confirmed and supported by higher price/mix contribution and lower cost impact.
1H’18 RESULTS: PIRELLI’S HIGH VALUE BUSINESS MODEL PROVES VERY RESILIENT IN VOLATILE ENVIRONMENT
▬ High Value Market (HVM) growing faster than expected
▬ Pirelli gaining Market Share in HVM, thanks to very effective homologation pull -through
▬ Pirelli best-in-class in Price/Mix improvement, leading to solid EBIT margin expansion
INTENSIFYING AND ACCELERATING HIGH VALUE PROGRAMS
▬ Major High Value tyre homologation programs launched in China, Japan and Korea with local OEMs
▬ Focused product development innovation in Specialties
▬ Adjusting local High Value Capacity to future regional demand opportunities (e.g. strong High Value growth in
Europe and in China) as well as to increasing tariff dynamics
▬ New integrated organization speeding up digital transformation programs
6
COMPANY PRESENTATION – SEPTEMBER 2018
1a. 1H’18 RESULTS HIGHLIGHTS & FY’18 OUTLOOK
1b. 1H’18 RESULTS IN DETAIL
1c. APPENDIX
1. 1H’18 FINANCIAL RESULTS
AGENDA_
7

COMPANY PRESENTATION – SEPTEMBER 2018
REVENUES EBIT ADJ.1 w/o start-up costs2
NET INCOME before discontinued operations NET FINANCIAL POSITION
1H 2018 RESULTS HIGHLIGHTS_
2,685
58.2%
-2.0%
High Value
Standard
1H 2018
2,630
64.0%
1H 2017
+7.8%
+698
1H 2018
3,917
FY 2017
3,219
16.5% 18.0% Margin
1. Before amortization of PPA, non-recurring items, restructuring costs and other adjustments; 2. Aeolus Car, Velo, Cyber & digital transformation
182
68
2.7x
1H 2018 1H 2017
473443
+6.8%
1H 2018 1H 2017
∆ YoY organic
+12.7%
+5.5%
-4.5%
2.5% 6.9% on Sales
€ million
8

COMPANY PRESENTATION – SEPTEMBER 2018
2,074
+2.6%
1H’18 1H’17
2,021
1,130 1,155
42% 44%
1H 2018 PERFORMANCE BY HIGH VALUE REGIONS_
1H’18 1H’17
19% 19%
14% 16%
SALES
High-teens
Mid-teens
Tw enties
adj. margin1
EBIT
+2.3%
-2.9%
+10.6%
YoY % Δ
▬ Strengthening of High
Value with a strong growth
in O.E. driv en by a wide
homologation portf olio
▬ Continued proactiv e
reduction of Standard in
the less prof itable
segments, in f av our of
higher rims
▬ Increasing High Value
sales, mainly in
Replacement, driv en by
the appealing product
portf olio and f urther retail
penetration
▬ Prof itability trend still
impacted by FX, but
improv ing v s. 1Q
▬ High Value: strong O.E.
perf ormance, driv en by
new homologations and
sound Repl. backed by
pull-through ef f ect
▬ Standard: lower O.E.
sales on less prof itable
rims; mix improv ement
with lower Aeolus brand
sales
KEY HIGHLIGHTS
% on tot. H.V. rev.
92% 93%
+8.7%
EUROPE
NAFTA
APAC
HIGH VALUE REGIONS SALES
Weight on Group revenues
High Value Standard2
€ million
502 487
390 431
+4.1%
org.
growth
+7.5%
+15.2%
+11.2%
+7.4%
+25.7%
-9.4%
+8.0%
-11.3%
1. Before amortization of PPA, non-recurring items, restructuring costs and other adjustments; 2. Standard & others (including Controlled Distribution & Other)
9
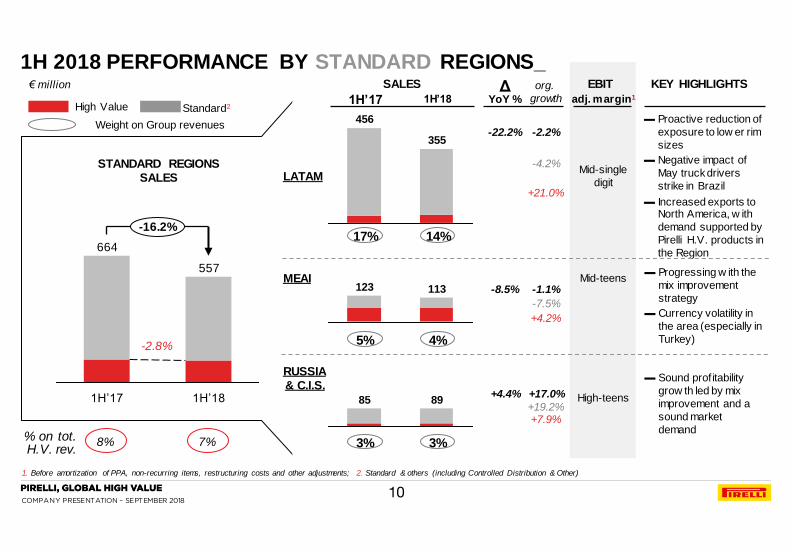
COMPANY PRESENTATION – SEPTEMBER 2018
355
456
113 123
89 85
-16.2%
1H’18
557
1H’17
664 17% 14%
1H 2018 PERFORMANCE BY STANDARD REGIONS_
1H’18 1H’17
5% 4%
3% 3%
SALES
Mid-teens
Mid-single
digit
High-teens
adj. margin1
EBIT
-22.2%
-8.5%
+4.4%
YoY % Δ
▬ Proactive reduction of
exposure to low er rim
sizes
▬ Negative impact of
May truck drivers
strike in Brazil
▬ Increased exports to North America, w ith
demand supported by
Pirelli H.V. products in
the Region
▬ Progressing w ith the
mix improvement
strategy
▬ Currency volatility in
the area (especially in
Turkey)
▬ Sound profitability
grow th led by mix
improvement and a
sound market
demand
KEY HIGHLIGHTS
8% 7%
-2.8%
LATAM
MEAI
RUSSIA & C.I.S.
STANDARD REGIONS SALES
-2.2%
org.
growth
-1.1%
+17.0%
+21.0%
+4.2%
+7.9%
-4.2%
-7.5%
+19.2%
1. Before amortization of PPA, non-recurring items, restructuring costs and other adjustments; 2. Standard & others (including Controlled Distribution & Other)
% on tot. H.V. rev.
Weight on Group revenues
High Value Standard2
€ million
10

COMPANY PRESENTATION – SEPTEMBER 2018
OUR 3 PILLARS STRATEGY IS IN PROGRESS_
PILLAR 1:
HIGH VALUE
I
PILLAR 2:
TRANSFORMATION
PROGRAMS
II
PILLAR 3:
STANDARD
CAPACITY
REDUCTION
III
▬ More than 200 High Value homologations, enriching our portfolio that now accounts 2,350 homologations, o/w 88% High Value
▬ +1.5 million High Value capacity (Europe, NAFTA and LatAm) reaching 58% of total capacity
▬ With Europe representing 46% of total High Value sales volume but 60% of global High Value production, started new program to create higher local HV in China
▬ Increasing last mile demand coverage: 55% of our sales in 1H made through Car Dealer, Pirelli Retail, and Tier 1 clients (51% in FY 2017)
▬ Integrated Forecasting: Increasing adoption of Big Data tools for medium term Demand & Supply Planning
▬ Smart Manufacturing and Flexible Factory: development of digital apps to monitor and improve processes and lead-time
▬ Prestige: successful prototyping of new geo-localized sales force tool
▬ Supply Chain: increase service level starting from Prestige and key clients
Acceleration in Standard reduction: -2 million tyres Standard capacity (-6% vs. 2017 year end)
▬ ~60% of the reduction in LatAm, the remaining 40% in Europe and MEAI
▬ ~30% of the reduction is actually a conversion into High Value capacity
1H 2018 achievements
11
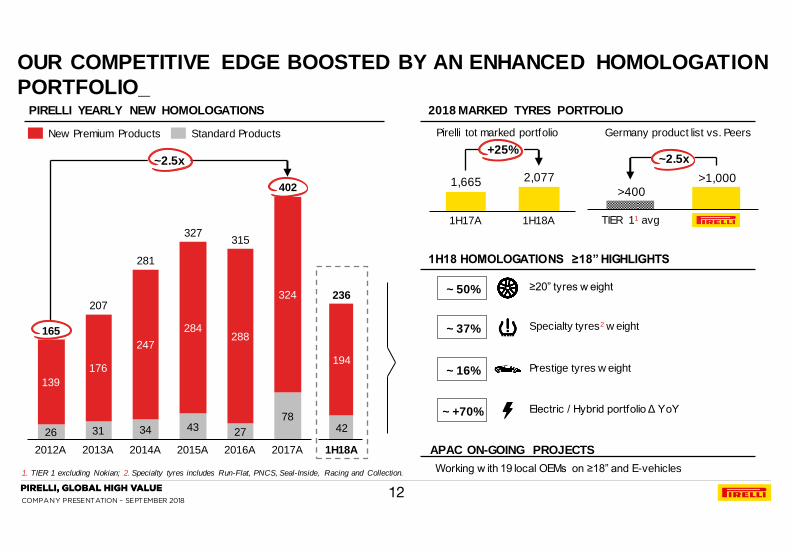
COMPANY PRESENTATION – SEPTEMBER 2018
1. TIER 1 excluding Nokian; 2. Specialty tyres includes Run-Flat, PNCS, Seal-Inside, Racing and Collection.
PIRELLI YEARLY NEW HOMOLOGATIONS
26 31 34 43 27
78
139
176
247
284 288
324
2014A
327
2016A 2012A 2013A 2015A
315
2017A
165
207
281
402
~2.5x
New Premium Products Standard Products
42
194
1H18A
236
TIER 11 avg
>1,000 >400
~2.5x
~ 37% Specialty tyres2 w eight
Prestige tyres w eight ~ 16%
1,665 2,077
1H17A 1H18A
+25%
2018 MARKED TYRES PORTFOLIO
Pirelli tot marked portfolio Germany product list vs. Peers
APAC ON-GOING PROJECTS
~ 50% ≥20” tyres w eight
Electric / Hybrid portfolio Δ YoY ~ +70%
Working w ith 19 local OEMs on ≥18” and E-vehicles
1H18 HOMOLOGATIONS ≥18” HIGHLIGHTS
OUR COMPETITIVE EDGE BOOSTED BY AN ENHANCED HOMOLOGATION
PORTFOLIO_
12

COMPANY PRESENTATION – SEPTEMBER 2018
+10% 241
≥+10%
EU, APac,
NAFTA
2018E
94%
Other
regions
2017A
217
94%
2016A
196
95%
million tyres
O.E. + REPLACEMENT ≥18” TYRE MARKET
≥18” OUTGROWING THE STANDARD SEGMENT 10x
Source: Company elaborations based on third party data relative to car market and on data provided by local associations of tyre producers; 2016 A market figures restated
≥+10% +10%
~5x ≤17” growth (+1.9%) ~10x ≤17” growth (almost flat)
APAC
NAFTA
EUROPE
▬ Strong growth (mid-teens), supported by robust Premium and Prestige car park increase
▬ High-single digit growth, mainly driven by solid Replacement demand, O.E. recovering from 2017, growing at a mid-
single digit rate
▬ Almost double-digit growth, driven by Replacement; high–teen growth confirmed in the O.E. channel
Standard segment: market lagging mainly due to South America and MEAI
13
COMPANY PRESENTATION – SEPTEMBER 2018
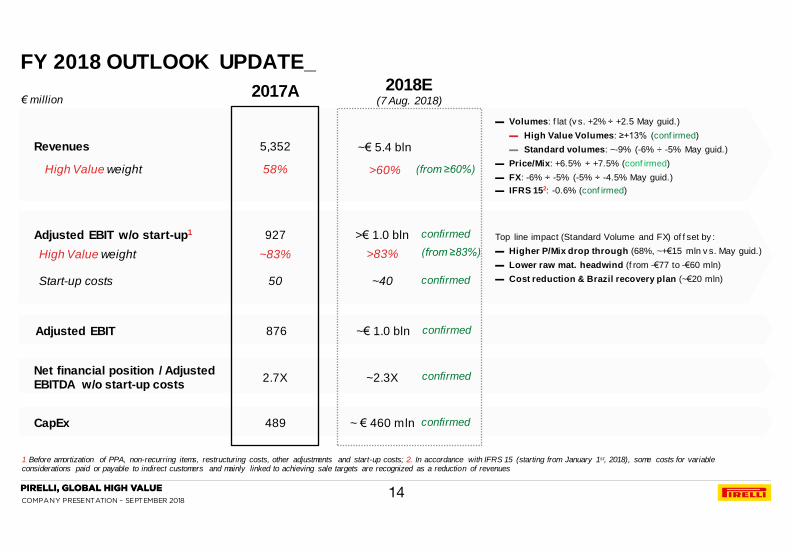
FY 2018 OUTLOOK UPDATE_
1 Before amortization of PPA, non-recurring items, restructuring costs, other adjustments and start-up costs; 2. In accordance with IFRS 15 (starting from January 1st, 2018), some costs for variable considerations paid or payable to indirect customers and mainly linked to achieving sale targets are recognized as a reduction of revenues
Revenues
High Value weight
Adjusted EBIT w/o start-up1
CapEx
Adjusted EBIT
High Value weight
Start-up costs
€ million
Top line impact (Standard Volume and FX) of f set by :
▬ Higher P/Mix drop through (68%, ~+€15 mln v s. May guid.)
▬ Lower raw mat. headwind (f rom -€77 to -€60 mln)
▬ Cost reduction & Brazil recovery plan (~€20 mln)
▬ Volumes: f lat (v s. +2% ÷ +2.5 May guid.)
▬ High Value Volumes: ≥+13% (conf irmed)
▬ Standard volumes: ~-9% (-6% ÷ -5% May guid.)
▬ Price/Mix: +6.5% ÷ +7.5% (conf irmed)
▬ FX: -6% ÷ -5% (-5% ÷ -4.5% May guid.)
▬ IFRS 152: -0.6% (conf irmed)
14
2017A
5,352
58%
927
876
~83%
50
>€ 1.0 bln
~€ 1.0 bln
~ € 460 mln
>83%
~40
~€ 5.4 bln
>60%
2018E (7 Aug. 2018)
confirmed
(from ≥83%)
confirmed
confirmed
(from ≥60%)
489 confirmed
Net financial position / Adjusted EBITDA w/o start-up costs 2.7X ~2.3X confirmed

COMPANY PRESENTATION – SEPTEMBER 2018
AGENDA_
1a. 1H’18 RESULTS HIGHLIGHTS & FY’18 OUTLOOK
1b. 1H’18 RESULTS IN DETAIL
1c. APPENDIX
1. 1H’18 FINANCIAL RESULTS
15

COMPANY PRESENTATION – SEPTEMBER 2018
179
Net Sales
1H’17
2,685
(16) (32)
Volume Price/Mix
(186)
FX IFRS 15 impact1 Net Sales
1H’18
2,630
-1.5%
1H 2018 NET SALES BRIDGE_
1. In accordance with IFRS 15 (from January 1st, 2018), some costs for variable considerations paid or payable to indirect customers and mainly linked to achieving sales targets are recognized as a reduction of revenues
+7.2% -7.3% -0.6% 1st Quarter -2.2%
-1.2 %
+6.7%
-6.9% -0.6%
-2.0%
+5.7%
+5.5%
o/w
organic
o/w
organic -0.9%
+6.2% 2nd Quarter -6.6% -0.6% -1.9% +5.3%
▬ High Value +13.1%
(o/w Car ≥18”+18.3%)
▬ Standard -11.3%
+13.4%
-12.1%
+12.8%
-10.6%
▬ o/w Car ≥18”+18.0%
▬ o/w Car ≥18”+18.6%
Group
Group
H.V.
Std.
H.V.
Std.
€ million
16

COMPANY PRESENTATION – SEPTEMBER 2018
112.8
(12.5)
(37.3)
Other
input costs
D&A /
Other2
(11.5) (23.3)
(16.9)
FX 2018
3.6
Raw Mat.
19.0
2017
416.2
Volume Price/mix Eff iciencies
450.1
Start-up
costs1
1H / 2Q 2018 OPERATING PERFORMANCE_
1. Aeolus Car, Velo, Cyber & digital transformation; 2. Other costs related to high value development
€ million internal levers ∑ +86 external levers ∑ -52
1H
Volume 2017
(4.5)
0.1
211.2
Start-up
costs
(15.9) 2.3
Raw Mat.
(11.9) (9.7)
FX 2018
231.8
Efficiencies Other
input costs
10.0
Price/mix
50.1
D&A / Other
internal levers ∑ +40 external levers ∑ -19
2Q
EBIT adj.
w /o start-up
EBIT adj.
443.0 473.3
16.5% 18.0% margin
EBIT adj.
15.7%
17.6%
margin
EBIT adj.
w /o start-up 223.5 243.9
16.6% 18.5% margin
15.5% 17.1%
margin
17
COMPANY PRESENTATION – SEPTEMBER 2018
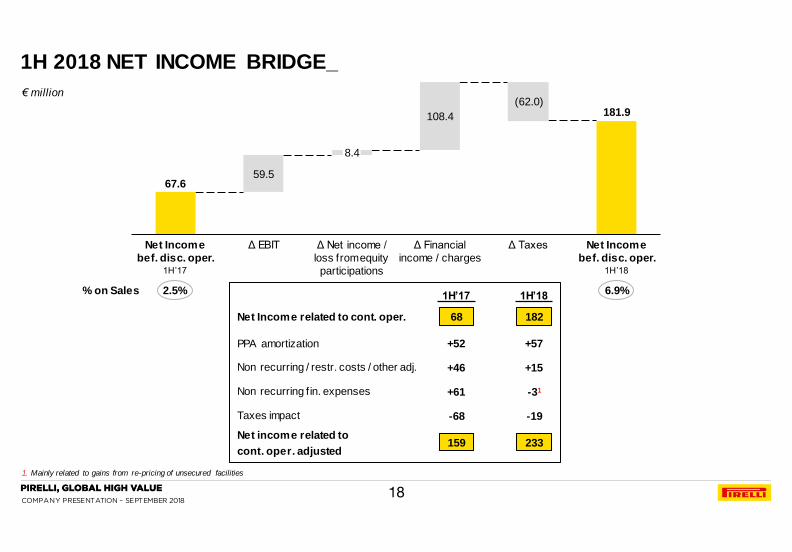
1H 2018 NET INCOME BRIDGE_
67.6
181.9
59.5
108.4
Net Income
bef. disc. oper. 1H’17
Δ EBIT
(62.0)
8.4
Δ Net income /
loss from equity
participations
Δ Financial
income / charges
Δ Taxes Net Income
bef. disc. oper. 1H’18
1. Mainly related to gains from re-pricing of unsecured facilities
Non recurring / restr. costs / other adj. +46 +15
Net income related to
cont. oper. adjusted 233 159
PPA amortization +52 +57
Non recurring f in. expenses +61 -31
182 68 Net Income related to cont. oper.
1H’17 1H’18 2.5% % on Sales 6.9%
Taxes impact -19 -68
€ million
18
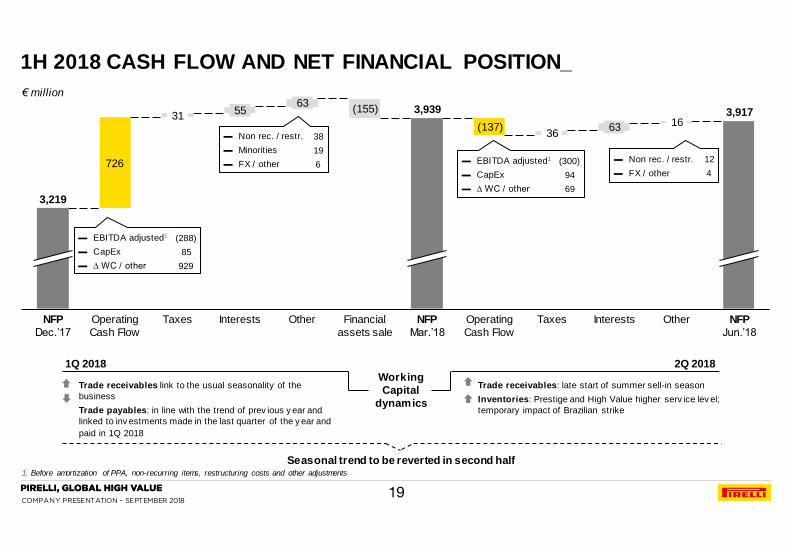
COMPANY PRESENTATION – SEPTEMBER 2018
726
Other
63
Financial
assets sale
NFP
Dec.’17
Operating
Cash Flow
Interests Other NFP
Jun.’18
(137)
NFP
Mar.’18
16
(155) 55
Taxes
36
3,219
3,939
Interests Operating
Cash Flow
Taxes
31 63
3,917
1H 2018 CASH FLOW AND NET FINANCIAL POSITION_
1. Before amortization of PPA, non-recurring items, restructuring costs and other adjustments
▬ EBITDA adjusted1
▬ CapEx
▬ ∆ WC / other
(288)
85
929
▬ Non rec. / restr.
▬ Minorities
▬ FX / other
38
19
6 ▬ EBITDA adjusted1
▬ CapEx
▬ ∆ WC / other
(300)
94
69
▬ Non rec. / restr.
▬ FX / other
12
4
Trade receivables: late start of summer sell-in season
Inventories: Prestige and High Value higher serv ice lev el;
temporary impact of Brazilian strike
Trade receivables link to the usual seasonality of the
business
Trade payables: in line with the trend of prev ious y ear and
linked to inv estments made in the last quarter of the y ear and
paid in 1Q 2018
Working
Capital
dynamics
Seasonal trend to be reverted in second half
1Q 2018 2Q 2018
€ million
19
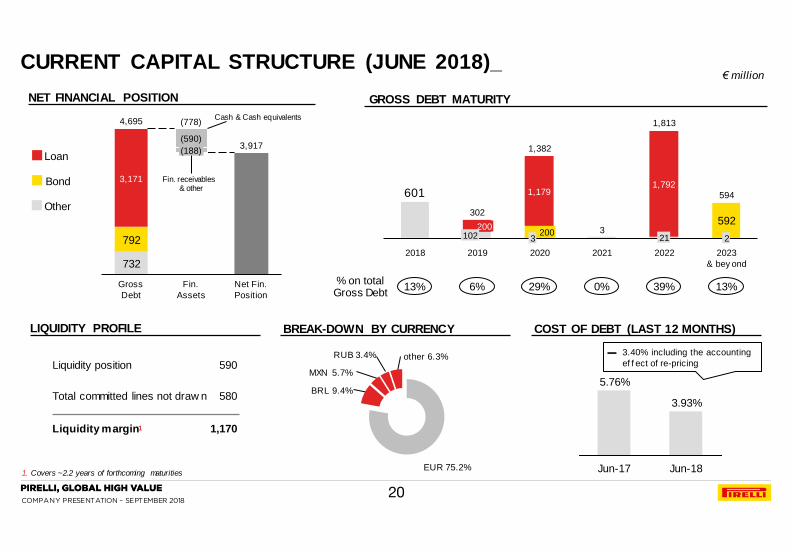
COMPANY PRESENTATION – SEPTEMBER 2018
3.93%
Jun-17
5.76%
Jun-18
NET FINANCIAL POSITION GROSS DEBT MATURITY
601 1,792
592
1,179
2018
3
200 102
2019 2020
200
2021
21
2022
2
2023
& bey ond
302
1,382
3
1,813
594
CURRENT CAPITAL STRUCTURE (JUNE 2018)_
1. Covers ~2.2 years of forthcoming maturities
732
3,917
792
3,171
(188)
Gross
Debt
(590)
Net Fin.
Position
Fin.
Assets
4,695
LIQUIDITY PROFILE
Liquidity position
Total committed lines not draw n
Liquidity margin1
590
580
1,170
Loan
Bond
Other
€ million
% on total Gross Debt
Cash & Cash equivalents
Fin. receivables & other
13% 29% 0% 39% 13%
COST OF DEBT (LAST 12 MONTHS) BREAK-DOWN BY CURRENCY
EUR 75.2%
MXN 5.7%
other 6.3%
BRL 9.4%
RUB 3.4%
6%
(778)
▬ 3.40% including the accounting
ef f ect of re-pricing
20

COMPANY PRESENTATION – SEPTEMBER 2018
1a. 1H’18 RESULTS HIGHLIGHTS & FY’18 OUTLOOK
1b. 1H’18 RESULTS IN DETAIL
1c. APPENDIX
1. 1H’18 FINANCIAL RESULTS
AGENDA_
21

COMPANY PRESENTATION – SEPTEMBER 2018
1H / 2Q 2018 RESULTS HIGHLIGHTS_
1. Excl. FX / perimeter; 2. Before non-recurring items, restructuring costs, other adjustments and start-up costs; 3. Before amortization of PPA, non-recurring items , restructuring costs, other adjustments
2Q’17 2Q’18 Δ YoY 1H’17 1H’18 Δ YoY
Revenues 1,346.0 1,320.0 -1.9% 2,685.3 2,630.3 -2.0%
Organic Growth1 +5.3% +5.5%
High Value Revenues 786.9 849.9 +8.0% 1,562.3 1,683.7 +7.8%
Organic Growth1 +11.8% +12.7%
% on total Revenues 58.5% 64.4% +5.9 pp 58.2% 64.0% +5.8 pp
EBITDA adjusted w/o start-up costs2 285.1 310.3 +8.8% 566.8 608.3 +7.3%
M argin 21.2% 23.5% +2.3 pp 21.1% 23.1% +2.0 pp
EBITDA adjusted3 276.0 299.8 +8.6% 546.4 587.9 +7.6%
Margin 20.5% 22.7% +2.2 pp 20.3% 22.4% +2.1 pp
EBIT adjusted w/o start-up costs2 223.5 243.9 +9.1% 443.0 473.3 +6.8%
M argin 16.6% 18.5% +1.9 pp 16.5% 18.0% +1.5 pp
EBIT adjusted3 211.2 231.7 +9.7% 416.2 450.1 +8.1%
Margin 15.7% 17.6% +1.9 pp 15.5% 17.1% +1.6 pp
EBIT 149.5 193.7 +29.6% 318.2 377.7 +18.7%
Margin 11.1% 14.7% +3.6 pp 11.8% 14.4% +2.6 pp
Results from Equity Investments (9.8) (5.3) (12.9) (4.5)
Financial Income / (Charges) (149.4) (62.8) (226.4) (118.0)
EBT (9.7) 125.6 78.9 255.2
Tax Rate n.m. 28.7% 14.3% 28.7%
Net Income before disc. operations 18.1 89.5 67.6 181.9
Net Income adjusted before disc.
operations 83.3 119.3 159.0 232.6
2Q Highlights
Sound organic growth on the back of :
▬ Strong High Value v olumes (+13.4%), with
market share increase in Car ≥18”, and
strong demand f or Specialties
▬ Reduction of the exposure to Standard
(v olumes -12.1%), in a context of market
slowdown, especially in LatAm af ter the
Truckers’ strike
▬ Solid price/mix (+6.2%)
▬ Negativ e FX (-6.6%) in a context of
v olatile emerging markets currencies
▬ EBIT adj. improv ement due to internal
lev ers
▬ EBIT margin adj. w/o start-up at 18.5%
(+1.9pp YoY)
▬ Lower f inancial charges thanks to a lower
cost of debt
▬ Tax rate in line with FY’18 targets
€ million
22

COMPANY PRESENTATION – SEPTEMBER 2018
30/06/20171 31/12/2017 30/06/2018
Fixed assets related to continuing operations 9,132 9,121 8,881
Inventories 937 941 983
Trade receivables 968 653 864
Trade payables (1,140) (1,674) (1,052)
Operating net working capital related to continuing operations 766 (80) 796
Other receivables / payables 190 (42) 113
Net Working Capital related to continuing operations 956 (123) 909
Net invested capital held for sale n.a. 61 39
Total net invested capital 10,087 9,059 9,829
Equity 4,057 4,177 4,323
Provisions 1,853 1,664 1,589
Net Financial Position 4,177 3,219 3,917
Total financing and shareholders’ equity 10,087 9,059 9,829
Attributable net equity 4,000 4,117 4,243
€ million
1H PIRELLI BALANCE SHEET_
1. Carve-out figures
23
COMPANY PRESENTATION – SEPTEMBER 2018
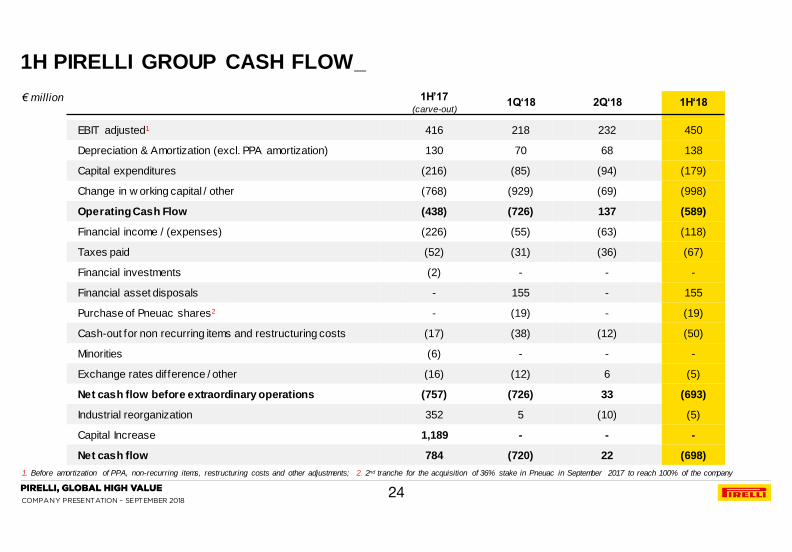
1H PIRELLI GROUP CASH FLOW_
1. Before amortization of PPA, non-recurring items, restructuring costs and other adjustments; 2. 2nd tranche for the acquisition of 36% stake in Pneuac in September 2017 to reach 100% of the company
1H’17 (carve-out)
1Q‘18 2Q‘18 1H‘18
EBIT adjusted1 416 218 232 450
Depreciation & Amortization (excl. PPA amortization) 130 70 68 138
Capital expenditures (216) (85) (94) (179)
Change in w orking capital / other (768) (929) (69) (998)
Operating Cash Flow (438) (726) 137 (589)
Financial income / (expenses) (226) (55) (63) (118)
Taxes paid (52) (31) (36) (67)
Financial investments (2) - - -
Financial asset disposals - 155 - 155
Purchase of Pneuac shares2 - (19) - (19)
Cash-out for non recurring items and restructuring costs (17) (38) (12) (50)
Minorities (6) - - -
Exchange rates difference / other (16) (12) 6 (5)
Net cash flow before extraordinary operations (757) (726) 33 (693)
Industrial reorganization 352 5 (10) (5)
Capital Increase 1,189 - - -
Net cash flow 784 (720) 22 (698)
€ million
24

COMPANY PRESENTATION – SEPTEMBER 2018
2018E RAW MATERIAL GUIDANCE_
breakdown 1H 2018 A based on
purch. costs
Natural Rubber 14%
Synthetic Rubber 27%
Carbon Black 10%
Steel Reinf. 10%
Textiles 16%
Chemicals 23%
raw mat. 34% on Sales
Raw Mat. subtotal
FX impact ~-46
TOT. IMPACT ~-60
2018E
EBIT impact
€ million
May guidance
-€77 mln
AVERAGE COST OF GOODS SOLD OF COMMODITIES
Natural Rubber TSR20
($ / tonne)
Brent Oil
($ / barrel)
Butadiene EU
(€ / tonne)
2017 A
~1,700
51
~1,100
2018 E Aug. guidance
~1,400
67
~950
∆ YoY
-12%
+35%
-6%
~-14
~+24
~-74
~+36
AVERAGE QUOTATION OF COMMODITIES
2017 A
1,651
54.9
1,112
2018 E Aug. guidance
~1,450
~74
~1,050
May 2018 guidance
Nat. Rubber ~ 1,650
Brent Oil ~75
Butadiene ~1,200
25

COMPANY PRESENTATION – SEPTEMBER 2018
2018E FOREX GUIDANCE_
breakdown 1H 2018 A based on
currency
USD 17%
EUR 38%
other 14%
RUB 3%
GBP 6%
BRL 10%
CNY 12%
2017 A 2018 E Aug. guidance
∆ YoY 2018E May guidance
3,42
6,34
1,215
MAIN AVERAGE EXCHANGE RATES
EUR / USD 1.130 1.188 -5%
USD / BRL 3.193 3.643 -12%
EUR / GBP 0.876 0.883 0%
EUR / RUB 65.850 72.412 -9%
USD / CNY 6.752 6.494 +4%
74.440
0.880
/
/
/
/
/
TOT. IMPACT ON SALES -5.0 / -6.0 % -4.5% / -
5.0%
∆ YoY
vs. EUR
-17%
-1%
-5%
-9%
0%
€ million
26

COMPANY PRESENTATION – SEPTEMBER 2018
KEY CAR MARKET TRENDS: EUROPE_
Source: Pirelli tyre market estimates based on main data provider for the Region; historical market data may be subject to restatement
O.E.
Replacement
Total (O.E.+Repl.)
O.E.
Total (O.E.+Repl.)
2Q’17 3Q’17 4Q’17 1Q’18 2Q'18
Replacement
Market trend ∆% YoY FY’17 1H’18
To
tal
Ca
r m
ark
et
Ne
w P
rem
ium
& S
tan
da
rd 10 12
8 10 14 10
4
(1)
3
(5)(2)
2
(2)(9)
10
20
3 11 13 12
2
(1)
5
(6)
1 2
(1)(4) 10
16
5 11
14 11
3
(1)
5
(6)
0 2
(1)(5)
2 5
(1)
1 5
1
(6) 6
(5)
2 3
0(3)
0
1 6
(4)
1 4
(4)0
≤17"
≥18”
27

COMPANY PRESENTATION – SEPTEMBER 2018
KEY CAR MARKET TRENDS: NAFTA_
Source: Pirelli tyre market estimates based on main data provider for the Region; historical market data may be subject to restatement
O.E.
Replacement
Total (O.E.+Repl.)
O.E.
Total (O.E.+Repl.)
2Q’17 3Q’17 4Q’17 1Q’18 2Q'18
Replacement
Market trend ∆% YoY FY’17 1H’18
To
tal
Ca
r m
ark
et
Ne
w P
rem
ium
& S
tan
da
rd 5 6 4
(1)(8)
(1)(8)(7)(9)(7)(9)(12)
(5)
0
11 12 10 11 14
9 8
(3)(5)(3)(3)(4)(4)
0
9 10 8 6 9 3 4
(4)(1)
(6)(4)(4)(6)(4)
(3)(2)(3)(4)(6)(10)
(3)
3
(2)
1
(2)(2)
0 0
2
(2)(1)(1)(4)(2)
0
≥18”
≤17"
28
COMPANY PRESENTATION – SEPTEMBER 2018
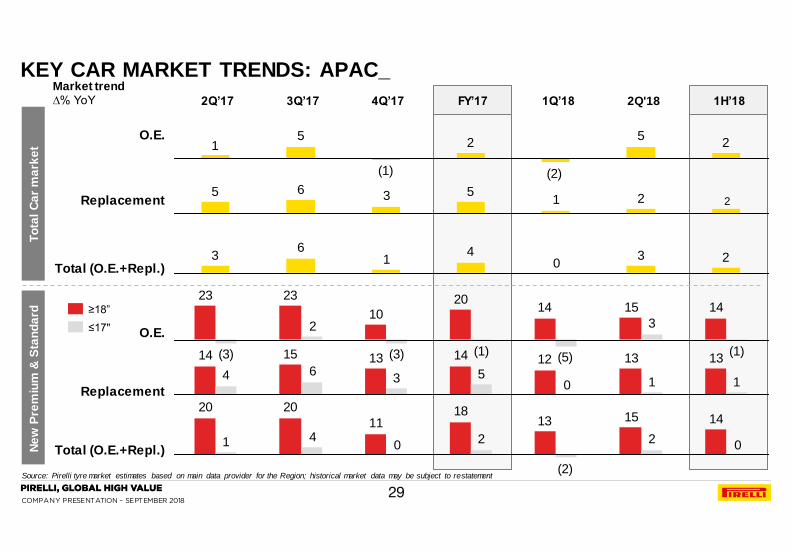
KEY CAR MARKET TRENDS: APAC_
Source: Pirelli tyre market estimates based on main data provider for the Region; historical market data may be subject to restatement
O.E.
Replacement
Total (O.E.+Repl.)
O.E.
Total (O.E.+Repl.)
2Q’17 3Q’17 4Q’17 1Q’18 2Q'18
Replacement
Market trend ∆% YoY FY’17 1H’18
To
tal
Ca
r m
ark
et
Ne
w P
rem
ium
& S
tan
da
rd
14 15 14 20
10
23 23
(1)
3
(5)(1)(3)
2
(3) 13 13 12 14 13 15 14
1 1 5 3
6 4 0
14 15 13 18
11
20 20
2
(2)
2 4 1 0 0
2 5
(2)
2
(1)
5 1
2 1 5 3 6 5
2
2 3 4 1
6 3
0
≤17"
≥18”
29
COMPANY PRESENTATION – SEPTEMBER 2018
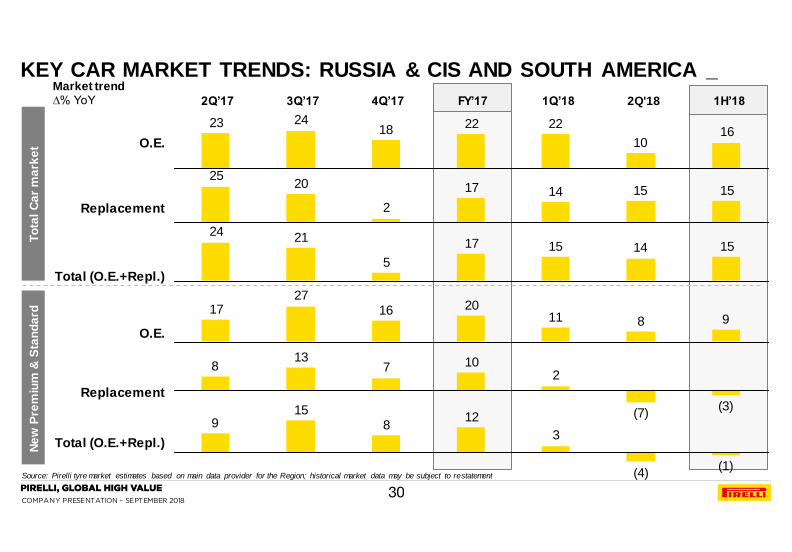
KEY CAR MARKET TRENDS: RUSSIA & CIS AND SOUTH AMERICA _
Source: Pirelli tyre market estimates based on main data provider for the Region; historical market data may be subject to restatement
O.E.
Replacement
Total (O.E.+Repl.)
O.E.
Total (O.E.+Repl.)
2Q’17 3Q’17 4Q’17 1Q’18 2Q'18
Replacement
Market trend ∆% YoY FY’17 1H’18
To
tal
Ca
r m
ark
et
Ne
w P
rem
ium
& S
tan
da
rd
9 8 11 20 16
27 17
(3)(7)
2 10 7
13 8
(1)(4)
3
12 8
15 9
16 10
22 22 18 24 23
15 15 14 17
2
20 25
15 14 15 17
5
21 24
30

COMPANY PRESENTATION – SEPTEMBER 2018
RAW MATERIAL COSTS TREND AND MIX_ MAIN RAW MATERIALS PRICE TREND
20
40
60
80
100
120
140
0.50
1.00
1.50
2.00
2.50
3.00
3.50
4.00
4.50
5.00
5.50
3Q 4Q 1Q 2Q 3Q 4Q 1Q 2Q 3Q 4Q 1Q 2Q 3Q 4Q 1Q 2Q 3Q 4Q 1Q 2Q 3Q 4Q 1Q 2Q 3Q 4Q 1Q 2Q
$ / kg $ / barrel Natural Rubber: Sicom
Brent: www.oilnergy .com
Yearly Average Natural Rubber (in $ / kg) Brent Oil (in $ / barrel)
Sy nth. Rubber
27% (-2ppYoY)
Textiles
16% (0pp YoY)
Steel Reinf .
10% (0pp YoY)
Natural Rubber
14% (-3pp YoY)
34% Raw mat. costs
on sales
Carbon Black
10% (+2ppYoY)
Chemicals
23% (+3pp YoY)
1H 2018 MIX (BASED ON PURCHASING COST)
53.6
1.37 1.38
45.0 1.65
54.8
2011 2012 2013 2014 2015 2016 2017 2018
31

COMPANY PRESENTATION – SEPTEMBER 2018
PIRELLI MANUFACTURING FOOTPRINT AS OF SEPTEMBER 7TH 2018
Low-cost countries U.S.
▬ Rome – Car
Brazil
▬ Campinas –
Car
▬ Feira de
Santana – Car
▬ Grav atai –
Moto
Argentina
▬ Merlo – Car
Mexico
▬ Silao – Car
U.K.
▬ Burton – Car
▬ Carlisle – Car
Indonesia
▬ Subang –
Moto (JV)
China
▬ Yanzhou –
Car / Moto
▬ Jiaozuo – Car
Russia
▬ Kirov – Car
▬ Voronezh –
Car
Turkey
▬ Izmit – Car
Italy
▬ Bollate – Car
▬ Settimo – Car
Germany
▬ Breuberg –
Car / Moto
Romania
▬ Slatina – Car
32

COMPANY PRESENTATION – SEPTEMBER 2018
AGENDA 1. 1H’18 FINANCIAL RESULTS
3c. MARKET AND COMPETITION
3d. HIGH VALUE STRATEGY: LEVERS AND REGIONAL DEPLOYMENT
3e. HIGH VALUE STRATEGY: START-UPS
3f. TRANSFORMATION PROGRAMS
3g. STANDARD PROGRAMS
3h. TARGETS 2020
2. FY 2017 FINANCIAL RESULTS
3. STRATEGY AND PLAN 2017-2020
4. GOVERNANCE
3a. PIRELLI AT A GLANCE
3b. KEY INVESTMENT HIGHLIGHTS
5. SUSTAINABILITY
6. APPENDIX
33

COMPANY PRESENTATION – SEPTEMBER 2018
KEY MESSAGES
>
>
>
2017 RESULTS: SOUND HIGH VALUE STRATEGY DELIVERY
▬ Strengthened foothold in High Value (~58% on revenues, ~83% on adjusted EBIT before start-up costs)
▬ Top Price/Mix improvement in the industry: +6.9% in FY, +7.8% in 4Q
▬ Solid profitability increase driven by internal levers : EBIT margin reaching 17.3% in FY, 18.7% in 4Q
2018 EXPECTED PERFORMANCE: KEEPING THE PACE OF THE INDUSTRIAL PLAN
▬ High Value volumes: ≥+13% in 18’’ and above
▬ Solid Price/Mix improvement driven by new products
▬ Efficiencies ~1% of sales
INDUSTRY FUTURE TRENDS: OUR STEPS AHEAD
▬ Electric car: partnership with Global Car Makers and most innovative Chinese brands
▬ Connected / autonomous: Cyber O.E. Products and solutions adoption currently under evaluation by some car makers; Connesso: market test finalized
▬ New mobility: expanding the Velo range, entering the Electric bicycle segment
34
COMPANY PRESENTATION – SEPTEMBER 2018
2a. PLAN DELIVERY IN 2017 AND 2018 OUTLOOK
2b. SUSTAINABILITY PLAN UPDATE
2c. REVIEW OF 2017 RESULTS
2d. APPENDIX
2. FINANCIAL RESULTS FY 2017
AGENDA_
35
COMPANY PRESENTATION – SEPTEMBER 2018
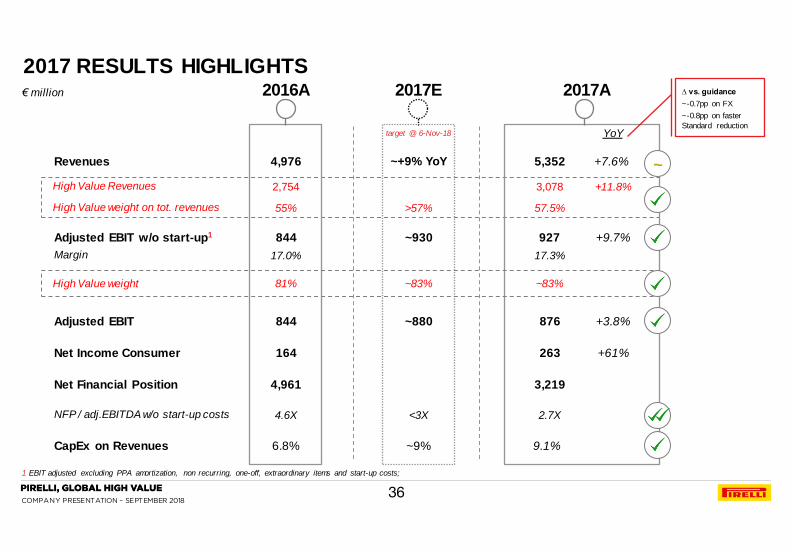
2017 RESULTS HIGHLIGHTS
1 EBIT adjusted excluding PPA amortization, non recurring, one-off, extraordinary items and start-up costs;
Revenues
High Value Revenues
Adjusted EBIT w/o start-up1
NFP / adj.EBITDA w/o start-up costs
CapEx on Revenues
Adjusted EBIT
High Value weight
2016A
4,976
55%
844
4.6X
844
6.8%
81%
2017A
+7.6%
57.5%
927
2.7X
876
9.1%
~83%
2017E
~+9% YoY
>57%
~930
<3X
~880
~9%
~83%
target @ 6-Nov-18
5,352
3,219 4,961 Net Financial Position
∆ vs. guidance
~-0.7pp on FX
~-0.8pp on faster
Standard reduction
Net Income Consumer 164 263
High Value weight on tot. revenues
2,754 3,078 +11.8%
YoY
+9.7%
+61%
17.0% 17.3%
+3.8%
Margin
~
€ million
36

COMPANY PRESENTATION – SEPTEMBER 2018
FY ’16
3,740
+7.7%
FY ’17
4,028
713 806
984 935
2,093 2,238
42% 42%
2017 PERFORMANCE BY
HIGH VALUE REGION_
1 before amortization of PPA, non-recurring items and restructuring costs
FY17A FY16A
19% 18%
14% 15%
SALES
Tw enties
Mid-teens
Tw enties
adj. margin1
EBIT
+6.9%
+5.3%
+13.1%
YoY %
+11.6%
+5.9%
+18.3%
Δ
▬ Consolidated leadership
on High Value
▬ Standard exposure decreasing
▬ Sound performance,
despite O.E. market
slow down
▬ High Value sales +8%
net of FX w ith products
introduction (All-Season)
and further retail
penetration
▬ Strong High Value
performance, driven by
Prestige and Premium
pull-through (especially
on Run-Flat)
▬ Expansion into new
channels (i.e. Car
Dealer, online)
KEY HIGHLIGHTS
% on tot. H.V. rev.
93% 92%
+11.2%
EUROPE
NAFTA
APAC
HIGH VALUE REGIONS SALES
+7.5%
Org.
growth
+7.4%
+14.3%
€ million
Weight on Group revenues
High Value Standard
37
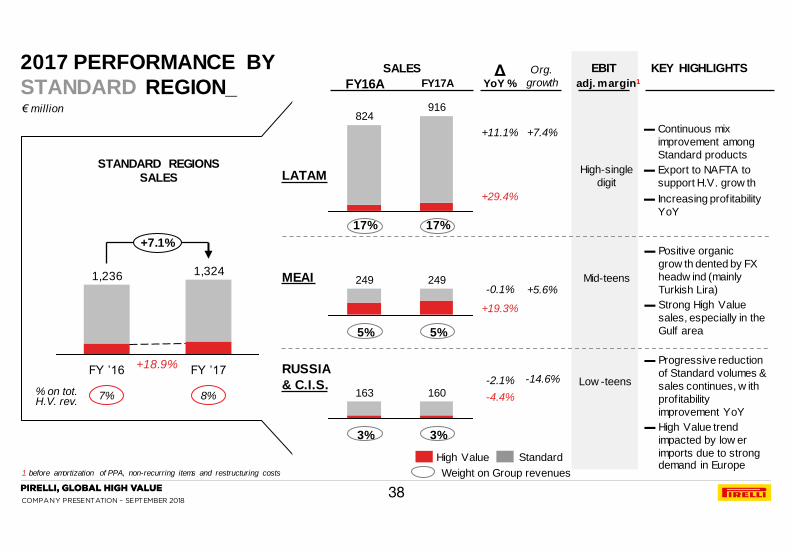
COMPANY PRESENTATION – SEPTEMBER 2018
916 824
249 249
160 163
+7.1%
FY ’17
1,324
FY ’16
1,236
17% 17%
2017 PERFORMANCE BY
STANDARD REGION_
1 before amortization of PPA, non-recurring items and restructuring costs
FY17A FY16A
5% 5%
3% 3%
SALES
Mid-teens
High-single
digit
Low -teens
adj. margin1
EBIT
+11.1%
-0.1%
-2.1%
YoY %
+29.4%
+19.3%
-4.4%
Δ
▬ Continuous mix
improvement among
Standard products
▬ Export to NAFTA to
support H.V. grow th
▬ Increasing profitability
YoY
▬ Positive organic
grow th dented by FX
headw ind (mainly
Turkish Lira)
▬ Strong High Value
sales, especially in the
Gulf area
▬ Progressive reduction
of Standard volumes &
sales continues, w ith
profitability
improvement YoY
▬ High Value trend
impacted by low er
imports due to strong demand in Europe
KEY HIGHLIGHTS
+18.9%
LATAM
MEAI
RUSSIA
& C.I.S.
STANDARD REGIONS SALES
€ million
+7.4%
Org.
growth
+5.6%
-14.6% % on tot. H.V. rev.
7% 8%
Weight on Group revenues
High Value Standard
38
COMPANY PRESENTATION – SEPTEMBER 2018
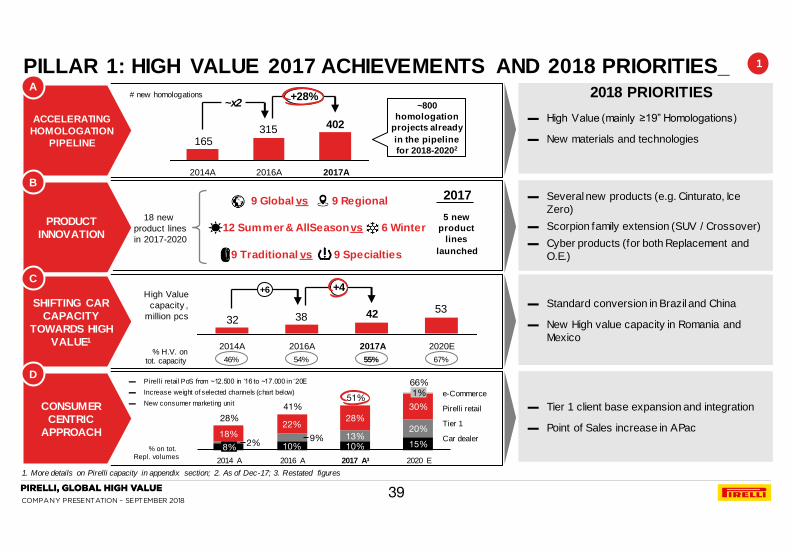
PILLAR 1: HIGH VALUE 2017 ACHIEVEMENTS AND 2018 PRIORITIES_
1. More details on Pirelli capacity in appendix section; 2. As of Dec-17; 3. Restated figures
ACCELERATING
HOMOLOGATION
PIPELINE
A
PRODUCT
INNOVATION
B
SHIFTING CAR
CAPACITY
TOWARDS HIGH
VALUE1
C
CONSUMER
CENTRIC
APPROACH
D ▬ Pirelli retail PoS from ~12.500 in ‘16 to ~17.000 in ‘20E
▬ Increase weight of selected channels (chart below)
▬ New consumer marketing unit
315165
402
2014A 2017A 2016A
~x2 +28%
9 Global vs 9 Regional
9 Traditional vs 9 Specialties
12 Summer & AllSeason vs 6 Winter
# new homologations
High Value
capacity ,
million pcs
10% 10% 15% 2% 9% 13%
20% 18%
22% 28%
30%
28%
2017 A3 2016 A 2020 E 2014 A
8%
e-Commerce 1%
Pirelli retail
Tier 1
Car dealer
41% 51%
66%
▬ High Value (mainly ≥19” Homologations)
▬ New materials and technologies
▬ Several new products (e.g. Cinturato, Ice
Zero)
▬ Scorpion family extension (SUV / Crossover)
▬ Cyber products (for both Replacement and
O.E.)
▬ Standard conversion in Brazil and China
▬ New High value capacity in Romania and
Mexico
▬ Tier 1 client base expansion and integration
▬ Point of Sales increase in APac
18 new
product lines
in 2017-2020
1
% on tot. Repl. volumes
533832
42
2020E 2014A 2016A 2017A
+6 +4
46% 54% 67% % H.V. on
tot. capacity 55%
2017
5 new
product
lines
launched
~800
homologation
projects already
in the pipeline
for 2018-20202
2018 PRIORITIES
39
COMPANY PRESENTATION – SEPTEMBER 2018
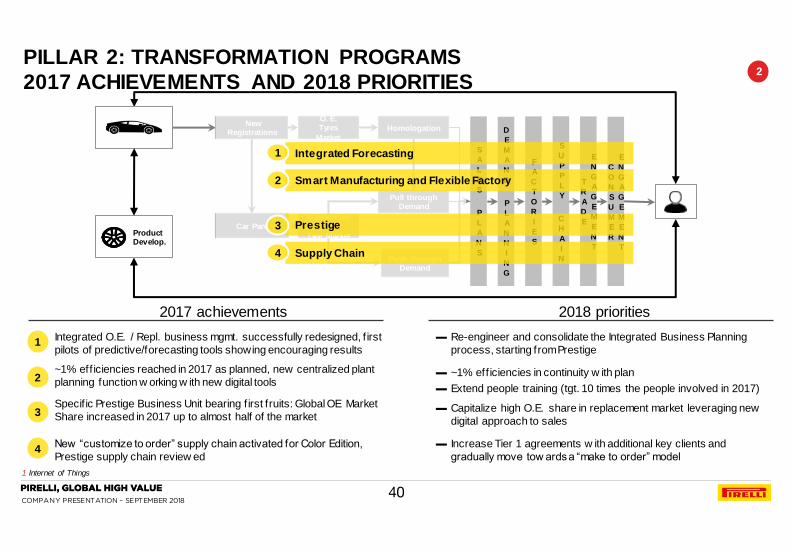
PILLAR 2: TRANSFORMATION PROGRAMS
2017 ACHIEVEMENTS AND 2018 PRIORITIES
1 Internet of Things
O. E. Tyres
Market
Replacement
Tyre Market
Push through Demand
New Registrations
Car Parc
Pull through Demand
Homologation
Product Develop.
S
A
L
E
S
P
L
A
N
S
D
E
M
A
N
D
P
L
A
N
N
I
N
G
F
A
C
T
O
R
I
E
S
S
U
P
P
L
Y
C
H
A
I
N
T
R
A
D
E
E
N
G
A
G
E
M
E
N
T
C
O
N
S
U
M
E
R
E
N
G
A
G
E
M
E
N
T
Smart Manufacturing and Flexible Factory
Prestige
Supply Chain
Integrated Forecasting 1
2
3
4
~1% eff iciencies reached in 2017 as planned, new centralized plant
planning function w orking w ith new digital tools
Specif ic Prestige Business Unit bearing f irst fruits: Global OE Market
Share increased in 2017 up to almost half of the market
New “customize to order” supply chain activated for Color Edition,
Prestige supply chain review ed
Integrated O.E. / Repl. business mgmt. successfully redesigned, f irst
pilots of predictive/forecasting tools showing encouraging results 1
2
3
4
2
2017 achievements 2018 priorities
▬ ~1% efficiencies in continuity w ith plan
▬ Extend people training (tgt. 10 times the people involved in 2017)
▬ Capitalize high O.E. share in replacement market leveraging new
digital approach to sales
▬ Increase Tier 1 agreements w ith additional key clients and
gradually move tow ards a “make to order” model
▬ Re-engineer and consolidate the Integrated Business Planning
process, starting from Prestige
40
COMPANY PRESENTATION – SEPTEMBER 2018
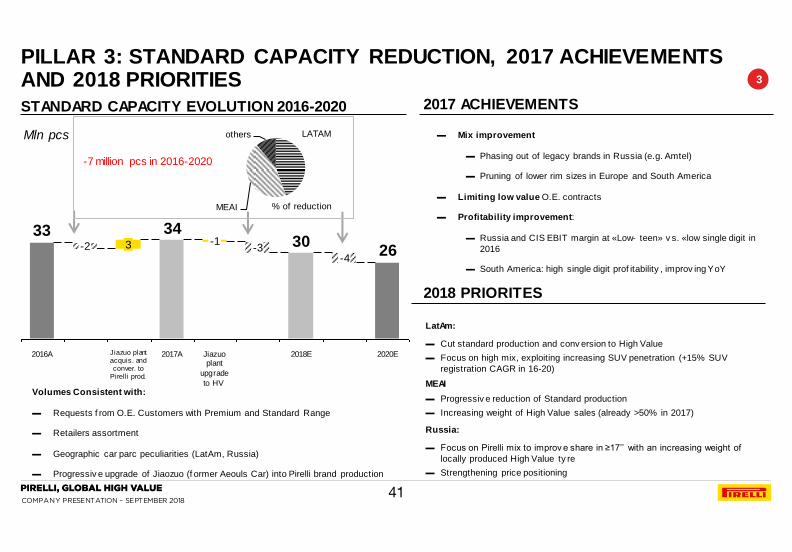
PILLAR 3: STANDARD CAPACITY REDUCTION, 2017 ACHIEVEMENTS AND 2018 PRIORITIES
Volumes Consistent with:
▬ Requests f rom O.E. Customers with Premium and Standard Range
▬ Retailers assortment
▬ Geographic car parc peculiarities (LatAm, Russia)
▬ Progressiv e upgrade of Jiaozuo (f ormer Aeouls Car) into Pirelli brand production
Mln pcs
2630
3433
2020E
-4
2017A Jiazuo plant acquis. and conver. to
Pirelli prod.
3 -2
2016A Jiazuo plant
upgrade
to HV
-1
2018E
-3
STANDARD CAPACITY EVOLUTION 2016-2020 2017 ACHIEVEMENTS
3
2018 PRIORITES
▬ Mix improvement
▬ Phasing out of legacy brands in Russia (e.g. Amtel)
▬ Pruning of lower rim sizes in Europe and South America
▬ Limiting low value O.E. contracts
▬ Profitability improvement:
▬ Russia and CIS EBIT margin at «Low- teen» v s. «low single digit in
2016
▬ South America: high single digit prof itability , improv ing YoY
% of reduction
LatAm:
▬ Cut standard production and conv ersion to High Value
▬ Focus on high mix, exploiting increasing SUV penetration (+15% SUV
registration CAGR in 16-20)
MEAI
▬ Progressiv e reduction of Standard production
▬ Increasing weight of High Value sales (already >50% in 2017)
Russia:
▬ Focus on Pirelli mix to improv e share in ≥17’’ with an increasing weight of
locally produced High Value ty re
▬ Strengthening price positioning
LATAM
MEAI
others
-7 million pcs in 2016-2020
41
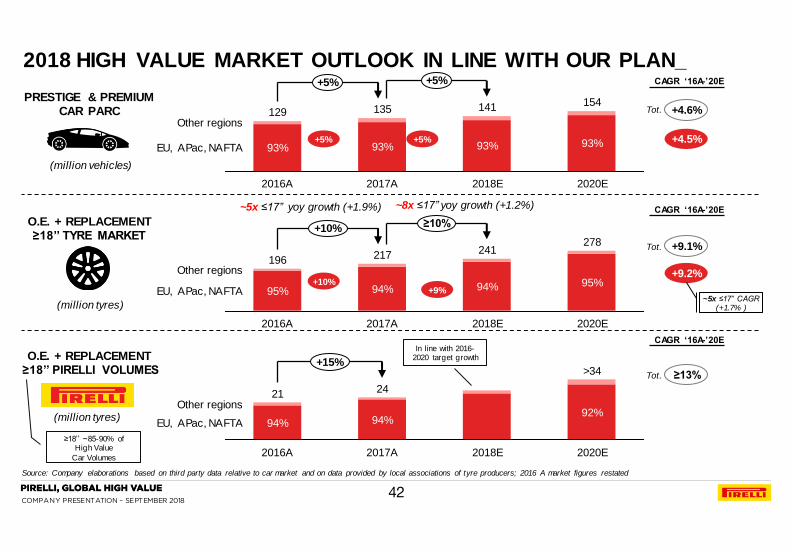
COMPANY PRESENTATION – SEPTEMBER 2018
+15%
EU, APac, NAFTA
Other regions
2020E
>34
92%
2018E 2017A
24
94%
2016A
21
94%
≥10% +10%
EU, APac, NAFTA
Other regions
2020E
278
95%
2018E
241
94%
2017A
217
94%
2016A
196
95%
(million vehicles)
(million tyres)
CAGR ‘16A-’20E
+4.6%
+4.5%
+9.1%
+9.2%
PRESTIGE & PREMIUM CAR PARC
O.E. + REPLACEMENT ≥18’’ TYRE MARKET
O.E. + REPLACEMENT ≥18’’ PIRELLI VOLUMES
≥13%
2018 HIGH VALUE MARKET OUTLOOK IN LINE WITH OUR PLAN_
Source: Company elaborations based on third party data relative to car market and on data provided by local associations of tyre producers; 2016 A market figures restated
+5% +5%
EU, APac, NAFTA
Other regions
2020E
154
93%
2018E
141
93%
2017A
135
93%
2016A
129
93%
Tot.
(million tyres)
CAGR ‘16A-’20E
CAGR ‘16A-’20E
≥18’’ ~85-90% of High Value
Car Volumes
+5%
+9%
+5%
Tot.
Tot.
+10%
~5x ≤17” CAGR (+1.7% )
In line with 2016-2020 target growth
~5x ≤17” yoy growth (+1.9%) ~8x ≤17” yoy growth (+1.2%)
42

COMPANY PRESENTATION – SEPTEMBER 2018
FY 2018 OUTLOOK_
1 EBIT adjusted excluding PPA amortization, non recurring, one-off, extraordinary items and start-up costs; 2 EBIT adjusted excluding PPA amortization, non recurring, one-off and extraordinary items; 3 EBITDA adjusted excluding non recurring, one-off, extraordinary items and start-up costs; 4 As of February 26th 2018
Revenues
High Value weight
Adjusted EBIT w/o start-up1
Net financial position / Adjusted EBITDA w/o start-up costs3
CapEx on Revenues
Adjusted EBIT2
High Value weight
Start-up costs
€ million
43
2017A 2018E4
5,352 ≥+6% YoY
~+10% Net of FX
58% ~60%
927 >€ 1,0 bln
2.7X ~2.3X
876 ~€1,0 bln
~8% 9.1%
~83% ≥83%
50 ~40
▬ ~50% High Value capacity increase
(Europe, NAFTA, APac and LatAm)
▬ ~25% mix & quality
▬ ~25% maintenance & other

COMPANY PRESENTATION – SEPTEMBER 2018
2a. PLAN DELIVERY IN 2017 AND 2018 OUTLOOK
2b. SUSTAINABILITY PLAN UPDATE
2c. REVIEW OF 2017 RESULTS
2d. APPENDIX
2. FINANCIAL RESULTS FY 2017
AGENDA_
44
COMPANY PRESENTATION – SEPTEMBER 2018
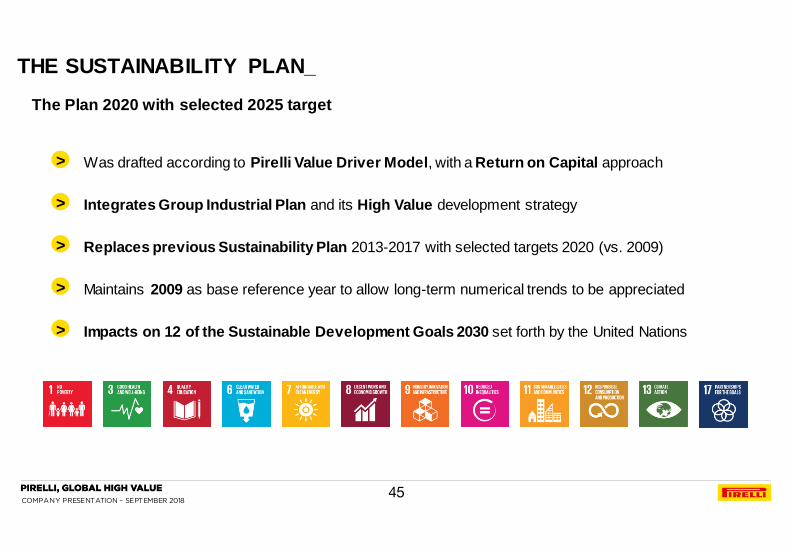
THE SUSTAINABILITY PLAN_
The Plan 2020 with selected 2025 target
Was drafted according to Pirelli Value Driver Model, with a Return on Capital approach >
Integrates Group Industrial Plan and its High Value development strategy >
Replaces previous Sustainability Plan 2013-2017 with selected targets 2020 (vs. 2009) >
Maintains 2009 as base reference year to allow long-term numerical trends to be appreciated >
Impacts on 12 of the Sustainable Development Goals 2030 set forth by the United Nations >
45
COMPANY PRESENTATION – SEPTEMBER 2018
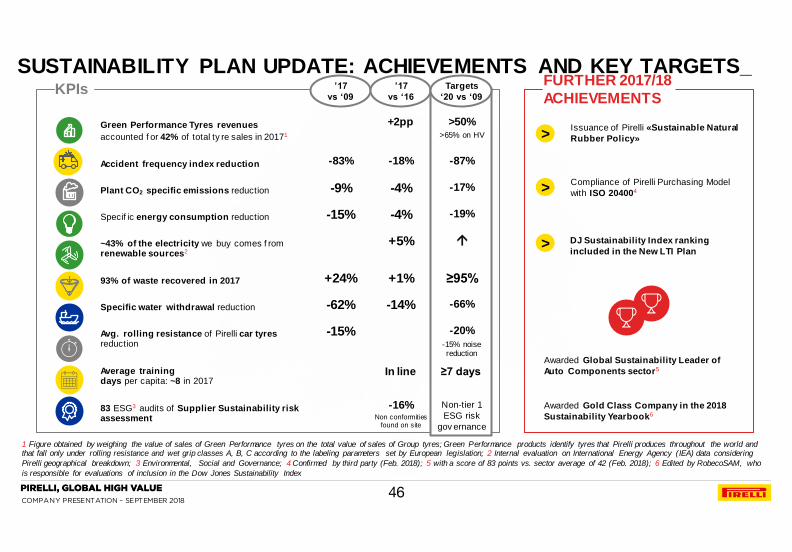
Awarded Global Sustainability Leader of
Auto Components sector5
Awarded Gold Class Company in the 2018
Sustainability Yearbook6
> Issuance of Pirelli «Sustainable Natural
Rubber Policy»
> Compliance of Pirelli Purchasing Model
with ISO 204004
> DJ Sustainability Index ranking
included in the New LTI Plan
SUSTAINABILITY PLAN UPDATE: ACHIEVEMENTS AND KEY TARGETS_
1 Figure obtained by weighing the value of sales of Green Performance tyres on the total value of sales of Group tyres; Green Performance products identify tyres that Pirelli produces throughout the world and that fall only under rolling resistance and wet grip classes A, B, C according to the labeling parameters set by European legislation; 2 Internal evaluation on International Energy Agency (IEA) data considering
Pirelli geographical breakdown; 3 Environmental, Social and Governance; 4 Confirmed by third party (Feb. 2018); 5 with a score of 83 points vs. sector average of 42 (Feb. 2018); 6 Edited by RobecoSAM, who
is responsible for evaluations of inclusion in the Dow Jones Sustainability Index
Accident frequency index reduction
83 ESG3 audits of Supplier Sustainability risk assessment
Average training days per capita: ~8 in 2017
Green Performance Tyres revenues
accounted f or 42% of total ty re sales in 20171
Specific water withdrawal reduction
93% of waste recovered in 2017
Specif ic energy consumption reduction
Avg. rolling resistance of Pirelli car tyres reduction
~43% of the electricity we buy comes f rom renewable sources2
Plant CO2 specific emissions reduction
’17
vs ‘09
-83%
+24%
-62%
-15%
-15%
-9%
’17
vs ‘16
-18%
-16% Non conformities
found on site
+2pp
+1%
-14%
+5%
-4%
-4%
In line
-87%
Targets
‘20 vs ‘09
>50% >65% on HV
-66%
-19%
-20%
-15% noise reduction
≥95%
Non-tier 1
ESG risk
gov ernance
-17%
≥7 days
KPIs FURTHER 2017/18
ACHIEVEMENTS
46
COMPANY PRESENTATION – SEPTEMBER 2018
1a. PLAN DELIVERY IN 2017 AND 2018 OUTLOOK
1b. SUSTAINABILITY PLAN UPDATE
1c. REVIEW OF 2017 RESULTS
1d. APPENDIX
1. FINANCIAL RESULTS FY 2017
AGENDA_
47

COMPANY PRESENTATION – SEPTEMBER 2018
338
5,352
Net Sales FY ’17 Volume Perimeter1
22 (34)
FX Price/Mix
50
Net Sales FY
’16 restated
4,976
+1.0%
FY 2017 NET SALES BRIDGE_
1 Aeolus Car / Velo
+7.3% -3.1% +0.6%
-0.3% +6.5% +1.2% +0.6%
+2.9% +5.5% +4.0% +1.0%
3rd Quarter
2nd Quarter
1st Quarter
+5.8%
+8.0%
+13.4%
+1.0 %
+6.9 %
-0.7%
+0.4% +7.6 %
+12.2%
+9.6%
+17.1%
+12.5%
+8.3%
+6.2%
+8.4%
+7.9%
o/w
organic € million
o/w
organic
+0.5% +7.8% +11.5%
4th Quarter -4.5% -0.3% +3.5% +8.3%
High Value
Standard
-5.3%
-5.3%
-4.2%
-5.8%
-5.8%
48
COMPANY PRESENTATION – SEPTEMBER 2018
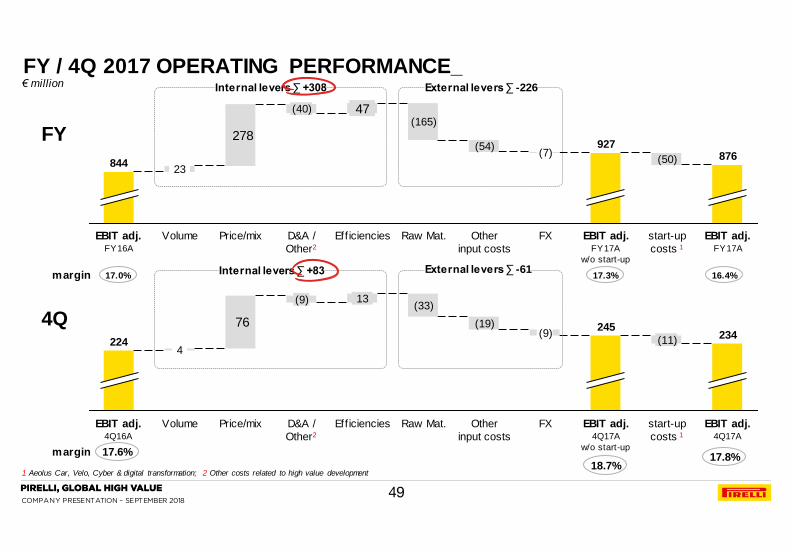
17.0% 17.3% 16.4% margin
17.6%
18.7% 17.8% margin
Internal levers ∑ +308 External levers ∑ -226
FY
4Q
FY / 4Q 2017 OPERATING PERFORMANCE_
1 Aeolus Car, Velo, Cyber & digital transformation; 2 Other costs related to high value development
278
EBIT adj. FY17A
w/o start-up
EBIT adj. FY17A
876
start-up
costs 1
(50)
927
FX
(7)
Other
input costs
(54)
Raw Mat.
(165)
Efficiencies
47
D&A /
Other2
(40)
Price/mix Volume
23
EBIT adj. FY16A
844
€ million
76
EBIT adj. 4Q17A
234
start-up
costs 1
(11)
EBIT adj. 4Q17A
w/o start-up
245
FX
(9)
Other
input costs
(19)
Raw Mat.
(33)
Eff iciencies
13
D&A /
Other2
(9)
Price/mix Volume
4
EBIT adj. 4Q16A
224
Internal levers ∑ +83 External levers ∑ -61
49

COMPANY PRESENTATION – SEPTEMBER 2018
164
263
65
34
Net Income
Consumer FY16A
Δ Financial
income / charges
Δ Taxes
(13)
Δ EBIT Δ Net income /
loss from equity
participations
13
Net Income
Consumer FY17A
FY 2017 NET INCOME BRIDGE_
1 U.S. private placement early redemption fees; 2 Wash down fee BBC financing
Non recurring / restr. costs + 53 + 93
Deferred tax assets recognition - 81
Net income adjusted 387 297
Tax impact on adjustment - 51 - 60
PPA amortization + 105 + 110
Non recurring f in. expenses + 251 + 612
263 164 Net Income
FY ’16 FY ’17
€ million
3.3% % on Sales 4.9%
50
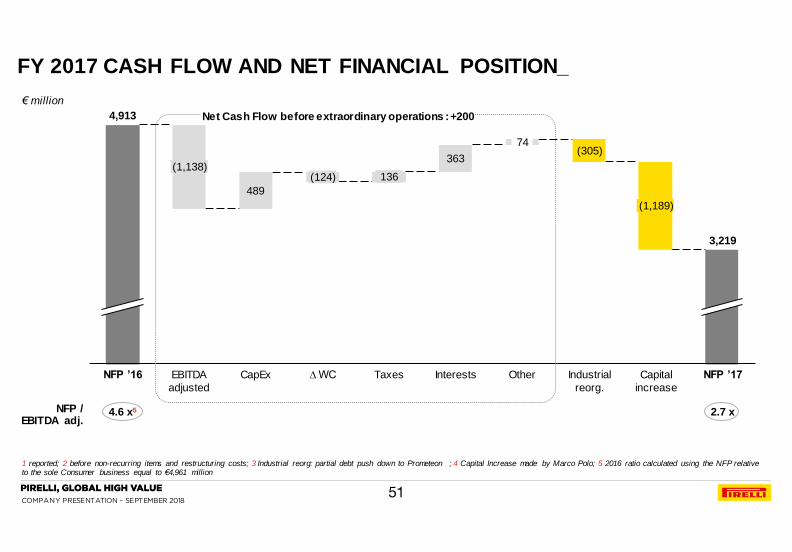
COMPANY PRESENTATION – SEPTEMBER 2018
489
363
Interests NFP ’16 Taxes
(1,138)
EBITDA
adjusted
CapEx
(305)
Industrial
reorg.
(1,189)
Capital
increase
136
∆ WC NFP ’17
(124)
4,913
3,219
Other
74
FY 2017 CASH FLOW AND NET FINANCIAL POSITION_
1 reported; 2 before non-recurring items and restructuring costs; 3 Industrial reorg: partial debt push down to Prometeon ; 4 Capital Increase made by Marco Polo; 5 2016 ratio calculated using the NFP relative to the sole Consumer business equal to €4,961 million
Net Cash Flow before extraordinary operations : +200
€ million
4.6 x5 2.7 x NFP / EBITDA adj.
51
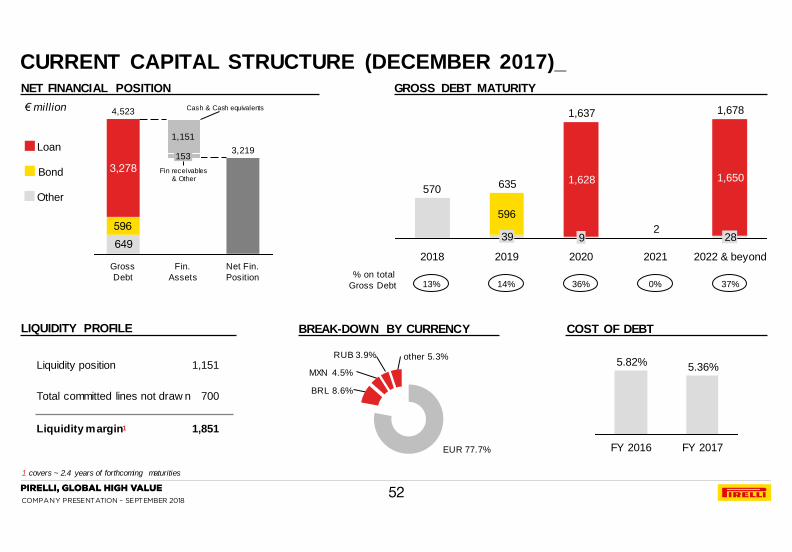
COMPANY PRESENTATION – SEPTEMBER 2018
FY 2017
5.36%
FY 2016
5.82%
NET FINANCIAL POSITION GROSS DEBT MATURITY
2
570
596
1,637
9
1,628
2019
635
28
1,650
2022 & beyond
1,678
2021 2020
39
2018
CURRENT CAPITAL STRUCTURE (DECEMBER 2017)_
1 covers ~ 2.4 years of forthcoming maturities
649
596
Net Fin.
Position
3,219
Fin.
Assets
153
1,151
Gross
Debt
4,523
3,278
LIQUIDITY PROFILE
Liquidity position
Total committed lines not draw n
Liquidity margin1
1,151
700
1,851
Loan
Bond
Other
BREAK-DOWN BY CURRENCY
EUR 77.7%
MXN 4.5%
other 5.3%
BRL 8.6%
RUB 3.9%
€ million
% on total
Gross Debt
Cash & Cash equivalents
Fin receivables & Other
13% 14% 36% 0% 37%
COST OF DEBT
52
COMPANY PRESENTATION – SEPTEMBER 2018
1a. PLAN DELIVERY IN 2017 AND 2018 OUTLOOK
1b. SUSTAINABILITY PLAN UPDATE
1c. REVIEW OF 2017 RESULTS
1d. APPENDIX
1. FINANCIAL RESULTS FY 2017
AGENDA_
53

COMPANY PRESENTATION – SEPTEMBER 2018
FY / 4Q 2017 RESULTS HIGHLIGHTS_
1 Excl. FX / perimeter; 2 Aeolus Car, Velo, Cyber & digital transformation; 3 before amortization of PPA, non-recurring items & restructuring costs;
Revenues 4,976.4 5,352.3 +7.6% 1,269.9 1,313.8 +3.5%
Organic Growth1 +7.9% +8.3%
High Value Revenues 2,753.8 3,078.1 +11.8% 677.2 734.2 +8.4%
Organic Growth1 +13.4% +12.7%
% on total Revenues 55.3% 57.5% +3 p.p. 53.3% 55.9% +3 p.p.
EBITDA adjusted w/o start-up
costs2 1,082.3 1,175.1 +8.6% 280.9 309.4 +10.1%
M argin 21.7% 22.0% +0.3 p.p 22.1% 23.6% +1.5 p.p
EBITDA adjusted3 1,082.3 1,137.7 +5.1% 280.9 301.4 +7.3%
Margin 21.7% 21.3% -0.4 p.p. 22.1% 22.9% +0.8 p.p.
EBIT adjusted w/o start-up costs2 844.3 926.6 +9.7% 223.6 245.4 +9.7%
M argin 17.0% 17.3% +0.3 p.p. 17.6% 18.7% +1.1 p.p.
EBIT adjusted3 844.3 876.4 +3.8% 223.6 234.2 +4.7%
Margin 17.0% 16.4% -0.6 p.p. 17.6% 17.8% -0.2 p.p.
EBIT 686.5 673.6 172.8 132.5
Margin 13.8% 12.6% 13.6% 10.1%
Results from Equity Investments (20.0) (6.9) 32.7 11.7
Financial Income / (Charges) (427.3) (362.6) (75.7) (72.7)
EBT 239.2 304.1 129.8 71.5
Tax Rate 31.4% 13.4% n.m. 9.9%
Net Income (Consumer) 164.0 263.3 128.2 64.4
Net Income adjusted (Consumer) 296.6 386.8 164.0 129.3
4Q Highlights
Strong organic growth on the back of :
▬ Strengthening High Value
▬ Top Industry price/mix (+7.8%)
▬ Volumes +0.5%, with +11.5% on High
Value and -5.8% on Standard, giv en the
accelerated exit f rom low prof itable
products
▬ EBIT adj. improv ement, with internal
lev ers which more than compensated f or
rising raw mat. costs, inf lation and other
costs related to business dev elopment
▬ EBIT margin adj. w/o start-up at 18.7%
(+1.1pp YoY)
▬ Lower f inancial charges related to
reduced cost of debt
▬ Tax rate positiv ely impacted by
detection of def erred tax assets and
other temporary dif f erences (e.g. ACE)
€ million FY ’16 restated Δ YoY FY ‘17
4Q ’16 restated 4Q ‘17 Δ YoY
54
COMPANY PRESENTATION – SEPTEMBER 2018
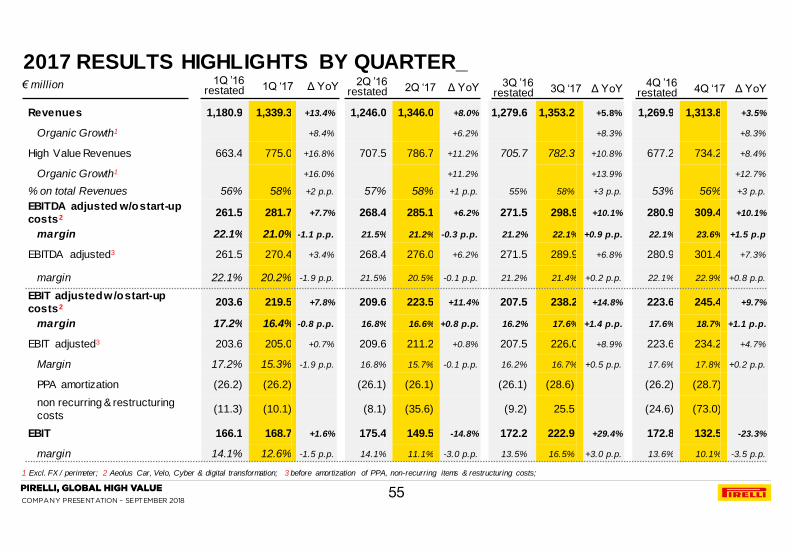
2017 RESULTS HIGHLIGHTS BY QUARTER_
1 Excl. FX / perimeter; 2 Aeolus Car, Velo, Cyber & digital transformation; 3 before amortization of PPA, non-recurring items & restructuring costs;
Revenues 1,180.9 1,339.3 +13.4% 1,246.0 1,346.0 +8.0% 1,279.6 1,353.2 +5.8% 1,269.9 1,313.8 +3.5%
Organic Growth1 +8.4% +6.2% +8.3% +8.3%
High Value Revenues 663.4 775.0 +16.8% 707.5 786.7 +11.2% 705.7 782.3 +10.8% 677.2 734.2 +8.4%
Organic Growth1 +16.0% +11.2% +13.9% +12.7%
% on total Revenues 56% 58% +2 p.p. 57% 58% +1 p.p. 55% 58% +3 p.p. 53% 56% +3 p.p.
EBITDA adjusted w/o start-up
costs2 261.5 281.7 +7.7% 268.4 285.1 +6.2% 271.5 298.9 +10.1% 280.9 309.4 +10.1%
margin 22.1% 21.0% -1.1 p.p. 21.5% 21.2% -0.3 p.p. 21.2% 22.1% +0.9 p.p. 22.1% 23.6% +1.5 p.p
EBITDA adjusted3 261.5 270.4 +3.4% 268.4 276.0 +6.2% 271.5 289.9 +6.8% 280.9 301.4 +7.3%
margin 22.1% 20.2% -1.9 p.p. 21.5% 20.5% -0.1 p.p. 21.2% 21.4% +0.2 p.p. 22.1% 22.9% +0.8 p.p.
EBIT adjusted w/o start-up
costs2 203.6 219.5 +7.8% 209.6 223.5 +11.4% 207.5 238.2 +14.8% 223.6 245.4 +9.7%
margin 17.2% 16.4% -0.8 p.p. 16.8% 16.6% +0.8 p.p. 16.2% 17.6% +1.4 p.p. 17.6% 18.7% +1.1 p.p.
EBIT adjusted3 203.6 205.0 +0.7% 209.6 211.2 +0.8% 207.5 226.0 +8.9% 223.6 234.2 +4.7%
Margin 17.2% 15.3% -1.9 p.p. 16.8% 15.7% -0.1 p.p. 16.2% 16.7% +0.5 p.p. 17.6% 17.8% +0.2 p.p.
PPA amortization (26.2) (26.2) (26.1) (26.1) (26.1) (28.6) (26.2) (28.7)
non recurring & restructuring
costs (11.3) (10.1) (8.1) (35.6) (9.2) 25.5 (24.6) (73.0)
EBIT 166.1 168.7 +1.6% 175.4 149.5 -14.8% 172.2 222.9 +29.4% 172.8 132.5 -23.3%
margin 14.1% 12.6% -1.5 p.p. 14.1% 11.1% -3.0 p.p. 13.5% 16.5% +3.0 p.p. 13.6% 10.1% -3.5 p.p.
€ million 4Q ’16 restated 4Q ‘17 Δ YoY
3Q ’16 restated 3Q ‘17 Δ YoY
2Q ’16 restated 2Q ‘17 Δ YoY
1Q ’16 restated 1Q ‘17 Δ YoY
55
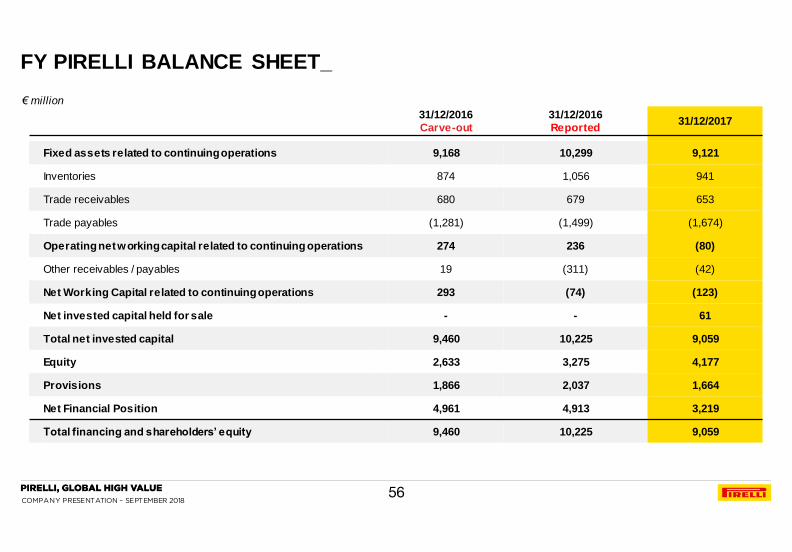
COMPANY PRESENTATION – SEPTEMBER 2018
31/12/2016
Carve-out
31/12/2016
Reported 31/12/2017
Fixed assets related to continuing operations 9,168 10,299 9,121
Inventories 874 1,056 941
Trade receivables 680 679 653
Trade payables (1,281) (1,499) (1,674)
Operating net working capital related to continuing operations 274 236 (80)
Other receivables / payables 19 (311) (42)
Net Working Capital related to continuing operations 293 (74) (123)
Net invested capital held for sale - - 61
Total net invested capital 9,460 10,225 9,059
Equity 2,633 3,275 4,177
Provisions 1,866 2,037 1,664
Net Financial Position 4,961 4,913 3,219
Total financing and shareholders’ equity 9,460 10,225 9,059
€ million
FY PIRELLI BALANCE SHEET_
56

COMPANY PRESENTATION – SEPTEMBER 2018
FY ‘16 restated FY ‘17
EBIT adjusted1 844 876
Depreciation & Amortization (excl. PPA amortization) 238 261
Capital expenditures (342) (489)
Change in working capital / other 32 124
Operating Cash Flow 772 772
Financial income / (expenses) (427) (363)
Taxes paid (104) (136)
Financial inv estments (7) (3)
Financial asset disposals 109 26
Asset disposals 91 -
Div idends paid to minorities - (13)
Cash-out f or non recurring items and restructuring costs (49) (64)
Bidco f inancial costs af ter merger / other ref inancing adjust. already incl. in f in. Charges 23 -
Minorities - (6)
Financial expenses already included in acquisition debt 122 -
Partial purchase f rom Dasa of Pneuac shares - (15)
Exchange rates dif f erence/other (193) 1
Net cash flow before extraordinary operations 336 200
Industrial reorganization 47 305
Capital increase - 1,189
Impact on NFP Aeolus Car (74) -
Cinda cash-in f rom 38% of P.I. sale 266 -
Bidco NFP v ariation 1.1 – 31.05.2016 (134) -
Bidco f inancial costs af ter merger/other ref inancing adjustments (23) -
Net cash flow 418 1,694
FY PIRELLI GROUP CASH FLOW_
1 before amortization of PPA, non recurring items and restructuring costs
€ million
57
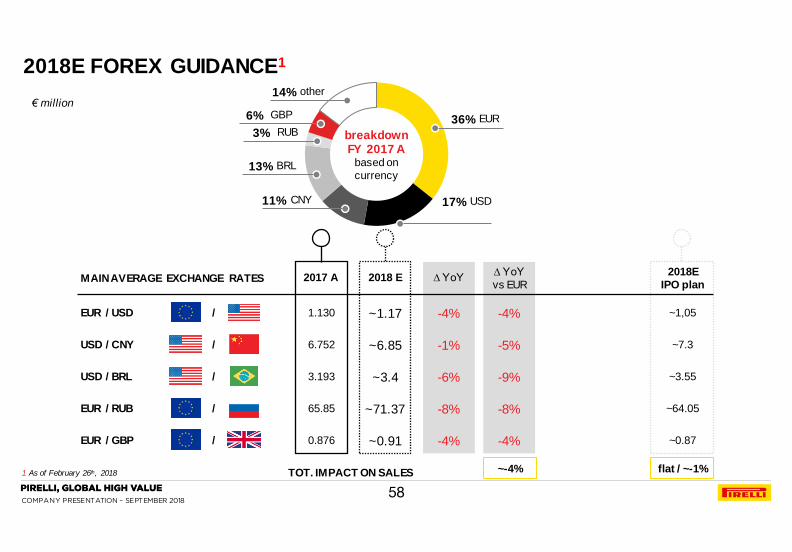
COMPANY PRESENTATION – SEPTEMBER 2018
2018E FOREX GUIDANCE1
1 As of February 26th, 2018
breakdown FY 2017 A
based on
currency
USD 17%
EUR 36%
other 14%
RUB 3%
GBP 6%
BRL 13%
CNY 11%
2017 A 2018 E ∆ YoY 2018E
IPO plan
~3.55
~7.3
~1,05
MAIN AVERAGE EXCHANGE RATES
EUR / USD 1.130 ~1.17 -4%
USD / BRL 3.193 ~3.4 -6%
EUR / GBP 0.876 ~0.91 -4%
EUR / RUB 65.85 ~71.37 -8%
USD / CNY 6.752 ~6.85 -1%
~64.05
~0.87
/
/
/
/
/
TOT. IMPACT ON SALES ~-4% flat / ~-1%
∆ YoY
vs EUR
-9%
-5%
-4%
-8%
-4%
€ million
58

COMPANY PRESENTATION – SEPTEMBER 2018
2018E RAW MATERIAL GUIDANCE1
1 As of February 26th, 2018
breakdown FY 2017 A
based on
purch. costs
Natural Rubber 15%
Synthetic Rubber 29%
Carbon Black 9%
Steel Reinf. 10%
Textiles 16%
Chemicals 21%
AVERAGE QUOTATION
OF COMMODITIES
Natural Rubber TSR20 ($ / tonne)
Brent Oil ($ / barrel)
Butadiene EU (€ / tonne)
2017 A
1,651
54.9
1,112
2018 E
~1.800
~68
~1,200
∆ YoY
+8%
+23%
+7%
Raw mat. 35% on Sales
Raw Mat. subtotal ~-55
FX impact ~-40
TOT. IMPACT ~-95
2018E
EBIT impact
~+15
~-80
~+10
€ million
2018E
IPO plan
~1,800
~61
~2,200
~78% of production in
low-cost countries
59

COMPANY PRESENTATION – SEPTEMBER 2018
2017A
14.7%
1,611 1,575
13.8%
2016A
1,530
12.8%
2020E
1,719
16.2%
2018E
(million vehicles)
(million tyres)
+7.8%
+4.5%
+3.3%
+9.1%
+1.9%
CAGR 16A-20E
CAR PARC
TYRE
MARKET
Total
Prestige
Premium
Synergic
Total
≥18”
≤17”
~4x
2020E
1,372
11.0%
0.3%
2018E
1,286
10.7%
0.2%
2017A
1,244
10.6%
0.2%
2016A
1,200
10.5%
0.2%
CAGR 16A-20E
Standard
New Premium
+8.3%
+4.6%
+3.5%
+10.5%
+1.9%
ATTRACTIVE TYRE MARKET: ≥18” OUTGROWING STANDARD ~4x
SUSTAINED BY PREMIUM & PRESTIGE CAR PARC EXPANSION_
Source: Company elaborations based on third party data relative to car market and on data provided by local associations of tyre producers
+3.0%
+3.4%
+7.7%
+4.5%
+3.3%
+8.9%
+1.2%
+2.3% +3.0%
+3.6%
+3.4%
60
COMPANY PRESENTATION – SEPTEMBER 2018
1. 1H’18 FINANCIAL RESULTS AGENDA
3c. MARKET AND COMPETITION
3d. HIGH VALUE STRATEGY: LEVERS AND REGIONAL DEPLOYMENT
3e. HIGH VALUE STRATEGY: START-UPS
3f. TRANSFORMATION PROGRAMS
3g. STANDARD PROGRAMS
3h. TARGETS 2020
2. FY 2017 FINANCIAL RESULTS
3. STRATEGY AND PLAN 2017-2020
4. GOVERNANCE
3a. PIRELLI AT A GLANCE
3b. KEY INVESTMENT HIGHLIGHTS
5. SUSTAINABILITY
6. APPENDIX
61

COMPANY PRESENTATION – SEPTEMBER 2018
LATAM
17%
Europe
42%
NAFTA
18%
APAC
15%
Russia
3%
MEAI
5%
Revenues
€5,352 Mln
58%
42%
Standard
High Value2
Car
93% of revenues3
Moto 7% of
revenues
140+ years of heritage ~50%
Market Share Prestige Car Manufacturers
REVENUE BY
CHANNEL
Adj. EBIT1
w/o start-up costs
€927 Mln (Margin 17.3%)
REVENUE BY
REGION
PRODUCTION
CAPACITY
18 plants
in 12 countries4
83%
17%
Standard
High Value2
74%
26%
Original
Equipment
Replacement
22%
78%
Low Cost
Countries
Mature
Countries
14,600 PoS
In 160+ countries
Long standing partnership w ith
and exclusive supplier
75%
GLOBAL PREMIUM TYRE LEADER WITH UNIQUE FOCUS ON CONSUMER SEGMENT
#1
PIRELLI AT A GLANCE (2017A)_
1. Excluding non recurring, one-off and extraordinary items; 2. Include prestige, new premium (≥18”), specialties and super specialties; 3. Percentage based on 2017 Consumer revenues net of Moto only; 4. Following the disposal of the Venezuela plant in September 2018 . Source: FY 2017 financial statements consumer business only, Pirelli estimates on third party data
62

COMPANY PRESENTATION – SEPTEMBER 2018
23% Industrial1 100% Consumer 77% Consumer1
68% 32% 81% 19%
Standard High Value2 Standard High Value
Revenues 45% 55%
Standard High Value2
Adj. EBIT3
Revenues4 55% 45%
Standard High Value
Adj. EBIT3,4
17% Adj. EBIT3 Margin 15% Adj. EBIT3
Margin
Enhanced Financial Profile with a
Significantly Improved Profitability
2016A 2014A
PIRELLI EVOLUTION: FROM PIRELLI GROUP TO PIRELLI CONSUMER IN
LESS THAN TWO YEARS_
1Pirelli Group product view figures as at 31st December 2014; 2High Value contribution calculated on Pirelli Consumer carve-out figures as at 31st December 2014; 3Before amortization of PPA, non recurring items and restructuring costs; 4Pirelli Consumer carve-out figures as at 31st December 2016
63

COMPANY PRESENTATION – SEPTEMBER 2018
The Only Tyre Company Focused On Serving Consumers Only
FROM FOCUS ON PREMIUM… …TO A NARROWER FOCUS ON “HIGH VALUE”
NEW FOCUS ON «HIGH VALUE»_
1Weight on total consumer business carve-out revenues as at 31st December 2016; 2Including motorsport and Specialties ≤17”; 3Radial, Custom Touring, Off Road and Sport Touring X-ply with speed index ≥H
64
COMPANY PRESENTATION – SEPTEMBER 2018
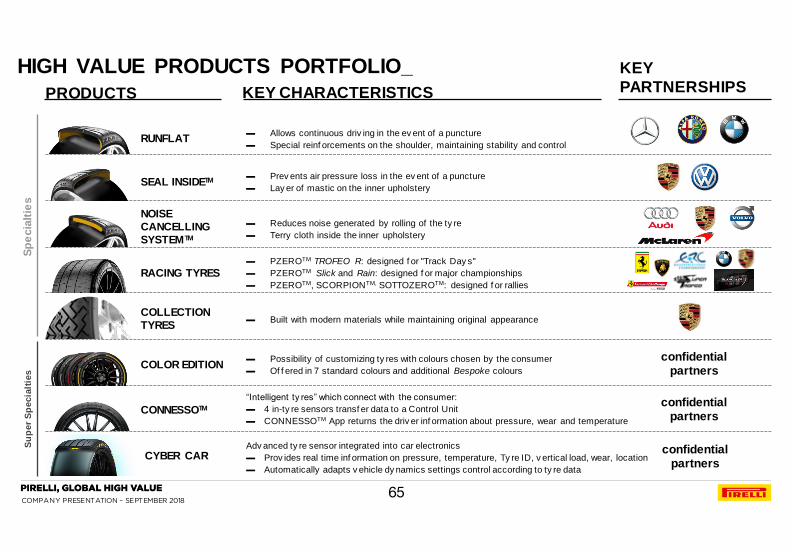
RUNFLAT ▬ Allows continuous driv ing in the ev ent of a puncture
▬ Special reinf orcements on the shoulder, maintaining stability and control
SEAL INSIDETM ▬ Prev ents air pressure loss in the ev ent of a puncture
▬ Lay er of mastic on the inner upholstery
NOISE
CANCELLING
SYSTEMTM
▬ Reduces noise generated by rolling of the ty re
▬ Terry cloth inside the inner upholstery
RACING TYRES ▬ PZEROTM TROFEO R: designed f or "Track Day s"
▬ PZEROTM Slick and Rain: designed f or major championships
▬ PZEROTM, SCORPIONTM, SOTTOZEROTM: designed f or rallies
COLLECTION
TYRES ▬ Built with modern materials while maintaining original appearance
COLOR EDITION ▬ Possibility of customizing ty res with colours chosen by the consumer
▬ Of f ered in 7 standard colours and additional Bespoke colours
CONNESSOTM
“Intelligent ty res” which connect with the consumer:
▬ 4 in-ty re sensors transf er data to a Control Unit
▬ CONNESSOTM App returns the driv er inf ormation about pressure, wear and temperature
confidential partners
confidential partners
Sp
ecia
ltie
s
Su
per
Sp
ecia
ltie
s
KEY
PARTNERSHIPS KEY CHARACTERISTICS PRODUCTS
HIGH VALUE PRODUCTS PORTFOLIO_
CYBER CAR confidential partners
Adv anced ty re sensor integrated into car electronics
▬ Prov ides real time inf ormation on pressure, temperature, Ty re ID, v ertical load, wear, location
▬ Automatically adapts v ehicle dy namics settings control according to ty re data
65

COMPANY PRESENTATION – SEPTEMBER 2018 66

COMPANY PRESENTATION – SEPTEMBER 2018
1. 1H’18 FINANCIAL RESULTS
2. FY 2017 FINANCIAL RESULTS
AGENDA
3c. MARKET AND COMPETITION
3d. HIGH VALUE STRATEGY: LEVERS AND REGIONAL DEPLOYMENT
3e. HIGH VALUE STRATEGY: START-UPS
3f. TRANSFORMATION PROGRAMS
3g. STANDARD PROGRAMS
3h. TARGETS 2020
3. STRATEGY AND PLAN 2017-2020
4. GOVERNANCE
3a. PIRELLI AT A GLANCE
3b. KEY INVESTMENT HIGHLIGHTS
5. SUSTAINABILITY
6. APPENDIX
67

COMPANY PRESENTATION – SEPTEMBER 2018
Strategic Position in a Profitable and Resilient Sector with Growth Potential
Leadership Position in High Value Markets
Iconic Brand with Focus on Consumer Engagement Beyond Tyres
Solid Business Relationship with Prestige and Premium Car Makers
Pioneering Technological Innovation
Growing High Value Footprint
Experienced Management Team
Strong Financial Profile
1
2
3
4
5
6
7
8
KEY INVESTMENT HIGHLIGHTS_
68

COMPANY PRESENTATION – SEPTEMBER 2018
69
GLOBAL REPLACEMENT TYRE MARKET
The Global Tyre Market Has Proved Resilience to Past Economic Cycles
+2.8%
+15.0%
+3.6%
CAGR
09A-16A
Mln pieces
+2.5%
+3.5%
CAGR
16A-20E
-0.3%
+2.9%
-0.2%
CAGR
07A-09A
+11.5%
1
37 37 39
48
54
59
69
78 91
104
117 130
145
161
867 795
2009A 2012A 2014A
939
892
2013A
799
2007A 2008A
794
2010A
899
2011A
869
924
2015A
955
2016A
989
2017A
985
961
1.216
1.059
832
952
1.002
836
1.106
1.056
2020E
914
2019E
1.114
834 1.026
1.031
928
2018E
1.171 >=18"
<=17"
’17 vs ’16
YoY
+3.5%
+12.5%
+4.4%
~5x
STRATEGIC POSITION IN A PROFITABLE AND RESILIENT SECTOR
WITH GROWTH POTENTIAL_
Source: Company elaborations based on third party data relative to car market and on data provided by local associations of tyre producers. Based on IPO data, FY 2018E updated with 1H 2018 results.
69
COMPANY PRESENTATION – SEPTEMBER 2018
(Mln vehicles)
+8.3%
+8.5%
CAGR
14A–16A
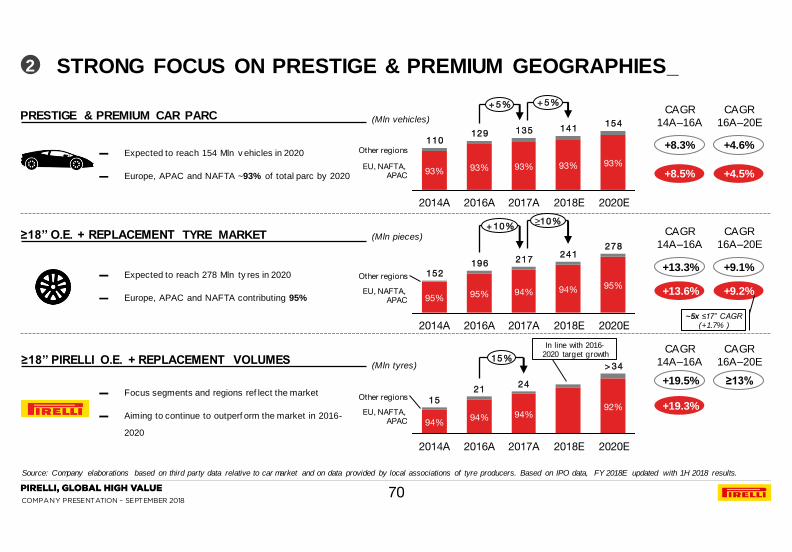
▬ Focus segments and regions ref lect the market
▬ Aiming to continue to outperf orm the market in 2016-
2020
+13.3%
+13.6%
▬ Expected to reach 154 Mln v ehicles in 2020
▬ Europe, APAC and NAFTA ~93% of total parc by 2020
▬ Expected to reach 278 Mln ty res in 2020
▬ Europe, APAC and NAFTA contributing 95%
+19.5%
+19.3%
CAGR
16A–20E
CAGR
14A–16A
CAGR
16A–20E
CAGR
14A–16A
+4.6%
+4.5%
+9.1%
+9.2%
PRESTIGE & PREMIUM CAR PARC
≥18’’ O.E. + REPLACEMENT TYRE MARKET
≥18’’ PIRELLI O.E. + REPLACEMENT VOLUMES
≥13%
CAGR
16A–20E
2 STRONG FOCUS ON PRESTIGE & PREMIUM GEOGRAPHIES_
Source: Company elaborations based on third party data relative to car market and on data provided by local associations of tyre producers. Based on IPO data, FY 2018E updated with 1H 2018 results.
2020E
+ 5% + 5%
EU, NAFTA, APAC
Other regions
2018E
93%
141 154
135
2017A
93% 93%
2016A
129
93%
2014A
110
93%
≥10%
241
94%
2018E
94% 95%
2017A
217
Other regions
2020E
278
+ 10%
EU, NAFTA, APAC
2016A
152
95%
196
95%
2014A
94% 94%
2016A
21
92%
2017A
24
Other regions
2020E
> 34 15%
EU, NAFTA, APAC
2014A
15
94%
2018E
(Mln pieces)
(Mln tyres)
~5x ≤17” CAGR (+1.7% )
In line with 2016-2020 target growth
70
COMPANY PRESENTATION – SEPTEMBER 2018
PRESTIGE
RADIAL TYRES FOR MOTO2
PREMIUM TYRES3 FOR MOTO2
NEW PREMIUM1
REPLACEMENT
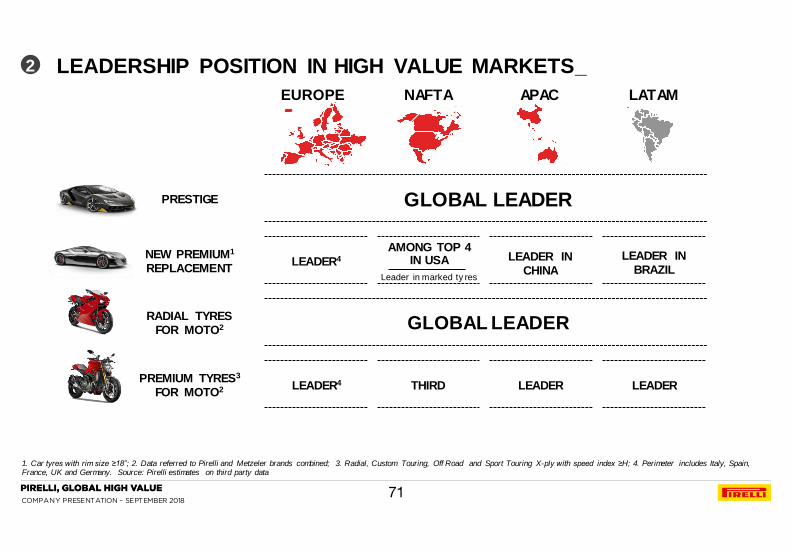
GLOBAL LEADER
GLOBAL LEADER
LEADER4 LEADER LEADER THIRD
LEADER4
AMONG TOP 4 IN USA
Leader in marked ty res
LEADER IN CHINA
1 3
LEADER IN BRAZIL
EUROPE NAFTA APAC LATAM
2 LEADERSHIP POSITION IN HIGH VALUE MARKETS_
1. Car tyres with rim size ≥18”; 2. Data referred to Pirelli and Metzeler brands combined; 3. Radial, Custom Touring, Off Road and Sport Touring X-ply with speed index ≥H; 4. Perimeter includes Italy, Spain, France, UK and Germany. Source: Pirelli estimates on third party data
71
COMPANY PRESENTATION – SEPTEMBER 2018
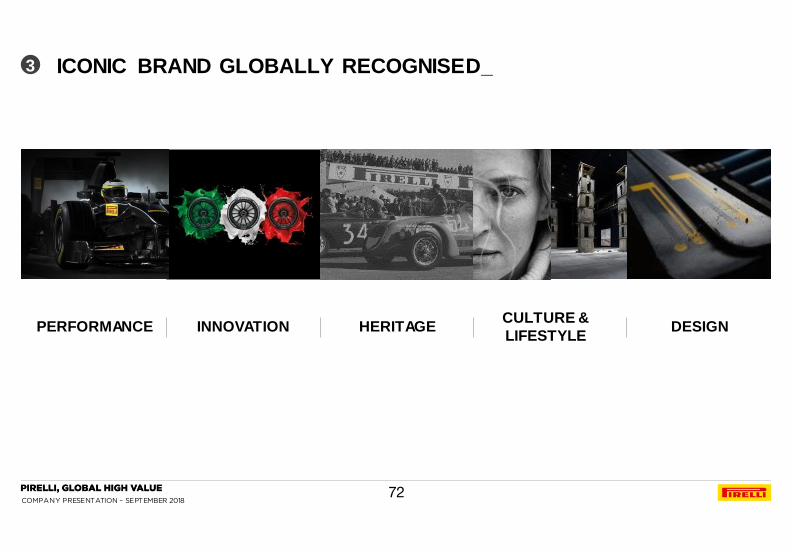
PERFORMANCE INNOVATION HERITAGE CULTURE &
LIFESTYLE DESIGN
3 ICONIC BRAND GLOBALLY RECOGNISED_
72

COMPANY PRESENTATION – SEPTEMBER 2018
3 ICONIC BRAND GLOBALLY RECOGNISED1_
1. 1H 2018 figures
~
73

COMPANY PRESENTATION – SEPTEMBER 2018
1. TIER 1 excluding Nokian; 2. Specialty tyres includes Run-Flat, PNCS, Seal-Inside, Racing and Collection.
PIRELLI YEARLY NEW HOMOLOGATIONS
26 31 34 43 27
78
139
176
247
284 288
324
2012A 2017A 2013A 2015A 2014A
281
2016A
165
207
327 315
402
~2.5x
New Premium Products Standard Products
42
194
1H18A
236
TIER 11 avg
>400 >1,000
~2.5x
~ 37% Specialty tyres2 w eight
Prestige tyres w eight ~ 16%
1,665 2,077
1H17A 1H18A
+25%
2018 MARKED TYRES PORTFOLIO
Pirelli tot marked portfolio Germany product list vs. Peers
APAC ON-GOING PROJECTS
~ 50% ≥20” tyres w eight
Electric / Hybrid portfolio Δ YoY ~ +70%
Working w ith 19 local OEMs on ≥18” and E-vehicles
1H18 HOMOLOGATIONS ≥18” HIGHLIGHTS
4 SOLID BUSINESS RELATIONSHIP WITH PRESTIGE AND PREMIUM
CAR MAKERS_
74

COMPANY PRESENTATION – SEPTEMBER 2018
PIRELLI LEADER IN O.E. MARKET TYRES…_
1. TIER 1 excluding Nokian. Source: German Product list June 2018
75
2018 MARKED TYRES PORTFOLIO1
>1,000
>240
>850
>390
>570
>260 >210
>800
>520
>380 >450
>320
4
≤17” ≥18”
~+48% ~+115% ~+220% ~+250% ~+290% Gap vs. Pirelli in
≥18” Marked tyres
2018 June Germany product list vs. Peers

COMPANY PRESENTATION – SEPTEMBER 2018
…CONSTANTLY INCREASING ITS PORTFOLIO AND PULL-THROUGH
RATE_
1. The propensity of consumers to keep the same product as provided in the original equipment when replacing a tyre.
76
4
PIRELLI MARKED TYRES PORTFOLIO YEARLY TREND ≥18”
2019 2018 2016 2017 2020
>600 >700
>850
>1,000
>1,200
~75% ~80% Pull Through
(Fitting Pirelli)1 +5 p.p.
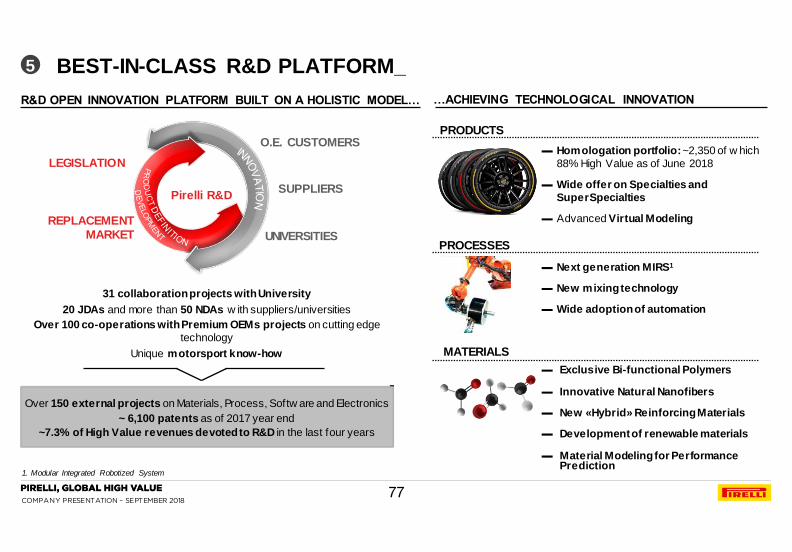
COMPANY PRESENTATION – SEPTEMBER 2018
31 collaboration projects with University
20 JDAs and more than 50 NDAs w ith suppliers/universities
Over 100 co-operations with Premium OEMs projects on cutting edge
technology
Unique motorsport know-how
Over 150 external projects on Materials, Process, Softw are and Electronics
~ 6,100 patents as of 2017 year end
~7.3% of High Value revenues devoted to R&D in the last four years
R&D OPEN INNOVATION PLATFORM BUILT ON A HOLISTIC MODEL…
REPLACEMENT MARKET
O.E. CUSTOMERS
SUPPLIERS
UNIVERSITIES
LEGISLATION
Pirelli R&D
PRODUCTS
▬ Homologation portfolio: ~2,350 of w hich
88% High Value as of June 2018
▬ Wide offer on Specialties and
SuperSpecialties
▬ Advanced Virtual Modeling
▬ Next generation MIRS1
▬ New mixing technology
▬ Wide adoption of automation
PROCESSES
MATERIALS
…ACHIEVING TECHNOLOGICAL INNOVATION
5 BEST-IN-CLASS R&D PLATFORM_
1. Modular Integrated Robotized System
▬ Exclusive Bi-functional Polymers
▬ Innovative Natural Nanofibers
▬ New «Hybrid» Reinforcing Materials
▬ Development of renewable materials
▬ Material Modeling for Performance Prediction
77
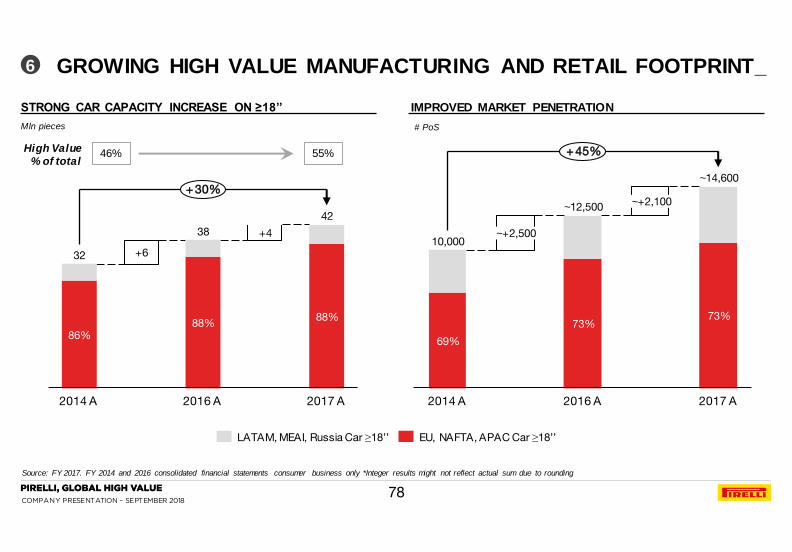
COMPANY PRESENTATION – SEPTEMBER 2018
2014 A
86%
+4
+6
2017 A
88%
2016 A
88%
32
38
42
+ 30%
IMPROVED MARKET PENETRATION STRONG CAR CAPACITY INCREASE ON ≥18’’
Mln pieces # PoS
46% 55% High Value
% of total
6
LATAM, MEAI, Russia Car ≥18’’ EU, NAFTA, APAC Car ≥18’’
69%
~+2,100
2016 A 2014 A
73%
~+2,500
73%
2017 A
10,000
~12,500
~14,600
+ 45%
GROWING HIGH VALUE MANUFACTURING AND RETAIL FOOTPRINT_
Source: FY 2017. FY 2014 and 2016 consolidated financial statements consumer business only *Integer results might not reflect actual sum due to rounding
78

COMPANY PRESENTATION – SEPTEMBER 2018
CEO has been managing Pirelli
for the last
EXPERIENCED MANAGEMENT TEAM_
Source: Pirelli Internal data as of March 2018
Global and local
“talents”
Research &
Development
Senior Management
Team average
tenure in Pirelli
International Management
Team
26 years >680 >1,800 people 18 years 29
nationalities
7
79
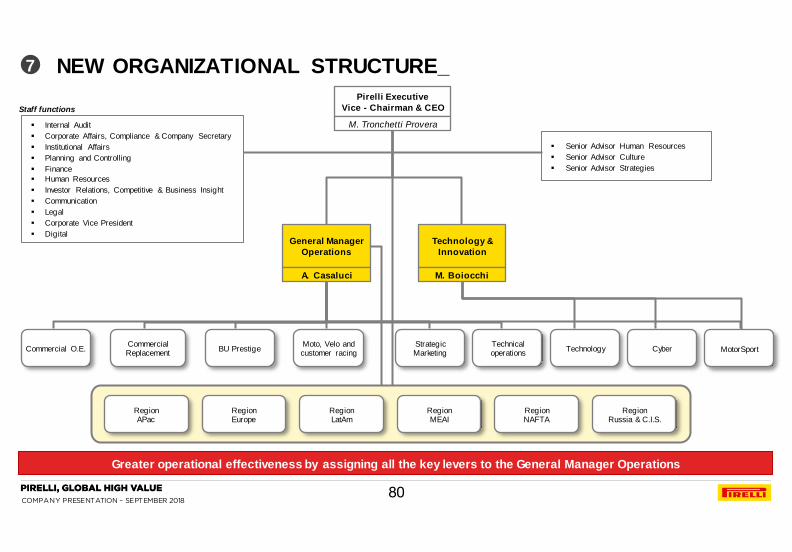
COMPANY PRESENTATION – SEPTEMBER 2018
Commercial Replacement
Technology &
Innovation
Pirelli Executive
Vice - Chairman & CEO
M. Tronchetti Provera
Technical operations
Cyber Moto, Velo and customer racing
Strategic Marketing
BU Prestige Technology Commercial O.E.
Senior Advisor Human Resources
Senior Advisor Culture
Senior Advisor Strategies
General Manager
Operations
Greater operational effectiveness by assigning all the key levers to the General Manager Operations
Internal Audit
Corporate Affairs, Compliance & Company Secretary
Institutional Affairs
Planning and Controlling
Finance
Human Resources
Investor Relations, Competitive & Business Insight
Communication
Legal
Corporate Vice President
Digital
Staff functions
Region APac
Region Europe
Region LatAm
Region MEAI
Region NAFTA
Region Russia & C.I.S.
A. Casaluci M. Boiocchi
MotorSport
NEW ORGANIZATIONAL STRUCTURE_
80
7

COMPANY PRESENTATION – SEPTEMBER 2018
TIER 1 2017A ADJ. EBIT MARGIN AND 2014A-2017A ADJ. EBIT GROWTH
8
Pirelli High Value
Adjusted EBIT 1 margin 2017A (%)
Ad
just
ed
EB
IT 1
CA
GR
2014-2
017A
(%
) 20
15
10
5
0
-5
25 20 15 10 5 0
STRONG FINANCIAL PROFILE
Source: company annual reports; Note: for Pirelli Consumer carve out data was used; **Adjusted excluding PPA amortization, non recurring, one-off and extraordinary items
81
COMPANY PRESENTATION – SEPTEMBER 2018 82
COMPANY PRESENTATION – SEPTEMBER 2018
1. 1H’18 FINANCIAL RESULTS
2. FY 2017 FINANCIAL RESULTS
AGENDA
3. STRATEGY AND PLAN 2017-2020
3a. PIRELLI AT A GLANCE
3b. KEY INVESTMENT HIGHLIGHTS
3c. MARKET AND COMPETITION
3d. HIGH VALUE STRATEGY: LEVERS AND REGIONAL DEPLOYMENT
3e. HIGH VALUE STRATEGY: START-UPS
3f. TRANSFORMATION PROGRAMS
3g. STANDARD PROGRAMS
3h. TARGETS 2020
4. GOVERNANCE
5. SUSTAINABILITY
6. APPENDIX
83

COMPANY PRESENTATION – SEPTEMBER 2018
(Mln pieces)
REPL. TYRE MARKET
Premium Growth To Continue Outpacing Non-Premium Growth Both In O.E. And Replacement
(Mln pieces)
O.E. TYRE MARKET
16.2% +15.4%
+6.2%
+0.9%
+11.5%
+5.5%
+2.0%
+3.5% +2.8%
CAGR 16A-20E
CAGR 14A-16A
Total
≥18”
17”
16.2%
16.2% +11.1%
+8.6%
-0.9%
+6.4%
+4.4%
0.0%
+2.3% +3.1%
CAGR 16A-20E
CAGR 14A-16A
Total
≥18”
17”
≤16”
16.2%
≤16”
23.4%
22.4%
502
2020E
+2.3% +2.3%
2018E
480
22.4%
23.2%
2017A
469
21.7%
21.4%
2016A
459
20.6%
20.0%
2014A
432
18.6%
17.2% +9.1%
+7.5%
-1.8%
7.8%
12.5%
1,002
2014A
13.4%
1,059
2016A
10.6%
13.3%
1,106
2017A
11.7%
13.6%
1,114
2018E
+4.4% +0.8% 1,216
14.4%
2020E
9.8%
13.2%
+12.5%
+7.5%
-1.8%
TYRE MARKET SHIFTING TOWARDS HIGHER RIMS_
Source: Company elaborations based on third party data relative to car market and on data provided by local associations of tyre producers. 2014A, 2016A and 2020E data based on IPO plan, 2018 updated with 1H 2018.
+10.7%
+5.4%
-2.2%
+10.7%
+2.3%
-0.3%
84
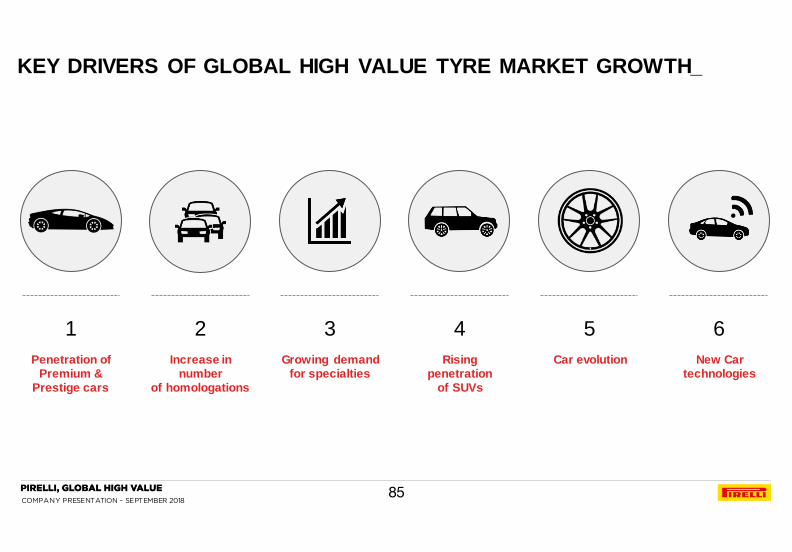
COMPANY PRESENTATION – SEPTEMBER 2018
Increase in number
of homologations
2
Rising penetration
of SUVs
4
Growing demand for specialties
3
Car evolution
5
New Car technologies
6
Penetration of Premium &
Prestige cars
1
KEY DRIVERS OF GLOBAL HIGH VALUE TYRE MARKET GROWTH_
85
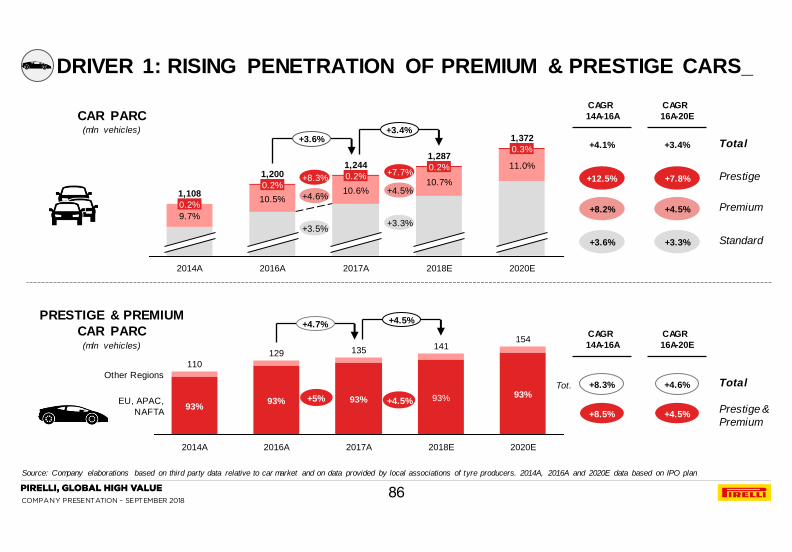
COMPANY PRESENTATION – SEPTEMBER 2018
2020E
+3.6%
10.6%
1,244
2017A
11.0%
1,372
0.2%
0.2%
1,108
9.7%
2014A
10.5%
2016A
1,200 10.7%
+3.4%
1,287
0.2%
0.3%
2018E
0.2%
93%
2017A
154
Other Regions
2020E
+4.7%
EU, APAC,
NAFTA
110
93%
2014A
129
93%
2016A
135
93%
2018E
141
93%
+4.5%
Total
Prestige
Premium
Standard
+12.5%
+8.2%
+3.6%
+7.8%
+4.5%
+3.3%
CAGR
14A-16A
CAGR
16A-20E
+3.4% +4.1%
+8.3%
+4.6%
+3.5%
PRESTIGE & PREMIUM
CAR PARC
Tot.
+5%
(mln vehicles)
CAR PARC
+8.3%
+8.5%
+4.6%
+4.5%
CAGR
14A-16A
CAGR
16A-20E
Total
Prestige &
Premium
(mln vehicles)
DRIVER 1: RISING PENETRATION OF PREMIUM & PRESTIGE CARS_
Source: Company elaborations based on third party data relative to car market and on data provided by local associations of tyre producers. 2014A, 2016A and 2020E data based on IPO plan
+7.7%
+4.5%
+3.3%
+4.5%
86
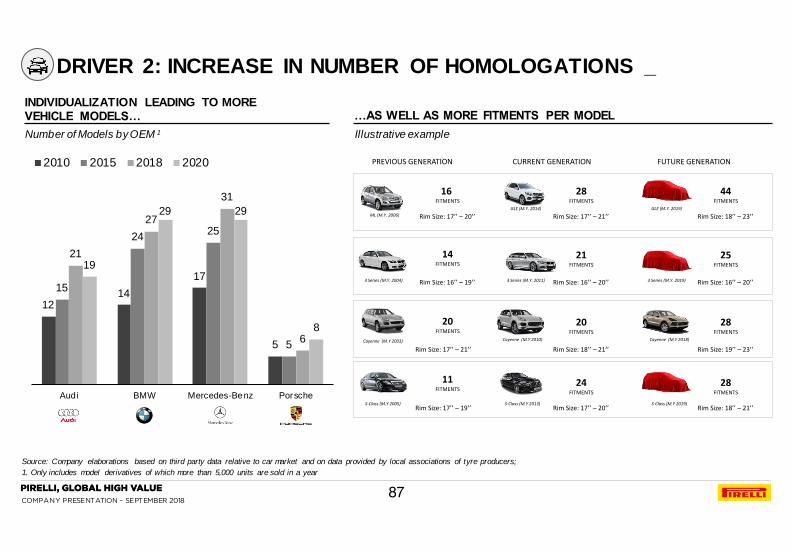
COMPANY PRESENTATION – SEPTEMBER 2018
Number of Models by OEM 1
INDIVIDUALIZATION LEADING TO MORE VEHICLE MODELS… …AS WELL AS MORE FITMENTS PER MODEL
DRIVER 2: INCREASE IN NUMBER OF HOMOLOGATIONS _
Source: Company elaborations based on third party data relative to car market and on data provided by local associations of tyre producers;
1. Only includes model derivatives of which more than 5,000 units are sold in a year
12 14
17
5
15
24 25
5
21
27
31
6
19
29 29
8
Audi BMW Mercedes-Benz Porsche
2010 2015 2018 2020
Illustrative example
87
Rim Size: 17’’ – 21’’
PREVIOUS GENERATION CURRENT GENERATION FUTURE GENERATION
Cayenne (M.Y 2010) Cayenne (M.Y 2018)Cayenne (M.Y 2003)
GLE (M.Y. 2014) GLE (M.Y. 2019)
ML (M.Y. 2006)
Rim Size: 18’’ – 21’’ Rim Size: 19’’ – 23’’
Rim Size: 17’’ – 20’’ Rim Size: 17’’ – 21’’ Rim Size: 18’’ – 23’’
3 Series (M.Y. 2011) 3 Series (M.Y. 2019)3 Series (M.Y. 2004) Rim Size: 16’’ – 19’’ Rim Size: 16’’ – 20’’ Rim Size: 16’’ – 20’’
Rim Size: 17’’ – 19’’S-Class (M.Y 2013) S-Class (M.Y 2019)S-Class (M.Y 2005)
Rim Size: 17’’ – 20’’ Rim Size: 18’’ – 21’’
16 FITMENTS
28FITMENTS
44FITMENTS
14FITMENTS
21FITMENTS
25FITMENTS
20FITMENTS
20FITMENTS
28FITMENTS
11FITMENTS
24FITMENTS
28FITMENTS
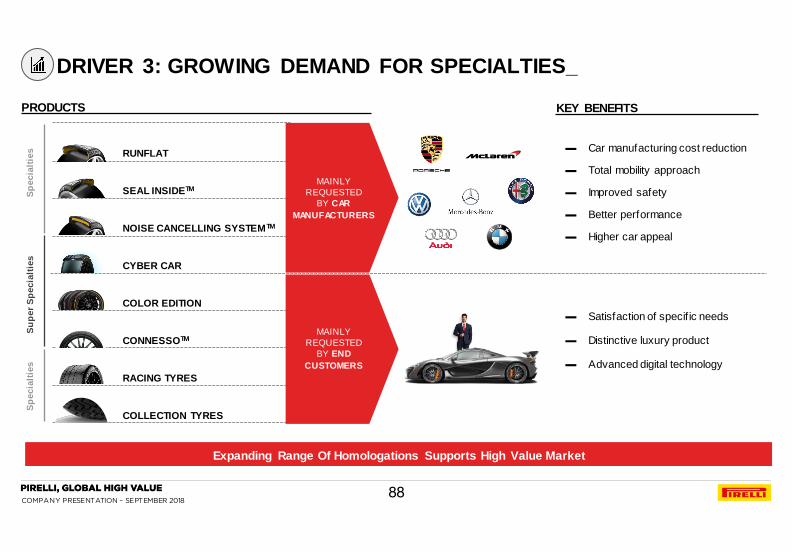
COMPANY PRESENTATION – SEPTEMBER 2018
Expanding Range Of Homologations Supports High Value Market
KEY BENEFITS
NOISE CANCELLING SYSTEMTM
Sp
ecia
ltie
s
Su
per
Sp
ecia
ltie
s
RUNFLAT
SEAL INSIDETM
RACING TYRES
COLLECTION TYRES
COLOR EDITION
CONNESSOTM
MAINLY
REQUESTED
BY CAR
MANUFACTURERS
▬ Car manufacturing cost reduction
▬ Total mobility approach
▬ Higher car appeal
▬ Satisfaction of specif ic needs
▬ Distinctive luxury product
▬ Advanced digital technology
PRODUCTS
MAINLY
REQUESTED
BY END
CUSTOMERS
DRIVER 3: GROWING DEMAND FOR SPECIALTIES_
88
CYBER CAR
Sp
ecia
ltie
s
▬ Improved safety
▬ Better performance

COMPANY PRESENTATION – SEPTEMBER 2018
5 8
10
25 28
30 33
10% 12%
14%
30% 33%
35% 38%
0%
10%
20%
30%
40%
0
10
20
30
40
2000A 2005A 2010A 2016A 2017A 2018E 2020E
SUV Sold Penetration
SUV sales (Mln vehicles and weight on total sales), Worldwide
RISING SUV PENETRATION1
M5
E-28 1985-
1987
M5
E-34 1988-
1995
M5
E-39 1998-
2003
M5
E-60 2006-
2011
M5
F-10 2011-
2017
M5
F-90 2018 >
HP 286 315 400 507 560 n.a.
Front
Fitment
225/60
VR 15
235/45
ZR 17
245/40
ZR 18
255/40
ZR 19
265/35
ZR 20
275/35
ZR 20
Rear
fitment
225/60
VR 15
255/40
ZR 17
275/35
ZR 18
285/35
ZR 19
295/30
ZR 20
285/35
ZR 20
BMW M5 SERIES
DRIVER 4 & 5: RISING SUV PENETRATION AND CAR DEVELOPMENT
TOWARDS HIGHER RIMS_
Source: Company elaborations based on third party data relative to car market and on data provided by local associations of tyre producers. 1. June 2018 figures
89

COMPANY PRESENTATION – SEPTEMBER 2018
2020E 2025E
Ultra Low Rolling Resistance
Electric
Autonomous1
Connected
Shared
3% 8% Share of
parc
Share of registrations 12% 21%
30% 52% Share of
parc
Share of registrations 71% 99%
Share of miles driv en 3% 5%
1% 8% Share of
parc
Share of registrations 3% 30%
Homologation of «Green» tyres
(A-label RR), specif ically
designed for electric cars
Integrated real-time analysis of
tyres and car performance, for
the safest autonomous drive
Cloud based solutions for
f leets, enabling TCO reduction
and higher uptime of vehicles
Monitoring of tyres’ conditions,
including w ear and load, via
smartphone or car electronics
PRESTIGE & PREMIUM CAR EVOLVES IN FOUR MAIN DIRECTIONS PIRELLI IS RESPONDING WITH SPECIFIC SOLUTIONS
DRIVER 6: NEW CAR TECHNOLOGIES_
1Figures refers to autonomous driving levels 3, 4, 5
Note. “Connected” refers to cars with mobile data connection (e.g. 2G, 3G, LTE), which might be provided by either embedded car systems or car hardware paired with external devices (e.g. smartphone)
All data refers to Prestige & Premium cars
Source: company analysis on consulting and investment banks research reports
90

COMPANY PRESENTATION – SEPTEMBER 2018
2020E 2025E
3% 8% Share of
parc
Share of registrations 12% 21%
30% 52% Share of
parc
Share of registrations 71% 99%
Share of miles driv en 3% 5%
1% 8% Share of
parc
Share of registrations 3% 30%
Electric
Autonomous1
Connected
Shared
CONNECTED CAR CONSUMERS HAVE ALL TYPES OF INFORMATION AVAILABLE, APART FROM THEIR TYRES…
…AND THEY ARE VERY INTERESTED IN CONNECTED TYRES
Pirelli consumer survey
38% 38% Total Very interested Somewhat interested
76%
▬ The new technological frontier of the
intelligent tyre for the replacement and
O.E. market
▬ Tyre parameters sent to an app or to car
electronics ▬ Several services will be available
PIRELLI SPECIFIC SOLUTIONS
PRESTIGE & PREMIUM CAR EVOLVES IN FOUR MAIN DIRECTIONS
DRIVER 6: CONNECTED PRESTIGE & PREMIUM CAR_
Note. “Connected” refers to cars with mobile data connection (e.g. 2G, 3G, LTE), which might be provided by either embedded car systems or car hardware paired with external devices (e.g. smartphone)
All data refers to Prestige & Premium cars
Source: company analysis on consulting and investment banks research reports
91
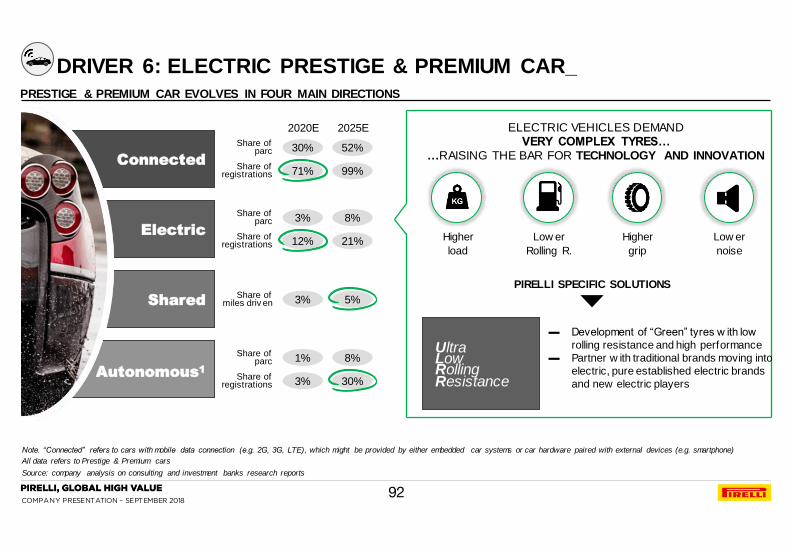
COMPANY PRESENTATION – SEPTEMBER 2018
2020E 2025E
3% 8% Share of
parc
Share of registrations 12% 21%
30% 52% Share of
parc
Share of registrations 71% 99%
Share of miles driv en 3% 5%
1% 8% Share of
parc
Share of registrations 3% 30%
Electric
Autonomous1
Connected
Shared
ELECTRIC VEHICLES DEMAND VERY COMPLEX TYRES…
…RAISING THE BAR FOR TECHNOLOGY AND INNOVATION
Higher
load
Low er
Rolling R.
Higher
grip
Low er
noise
Ultra Low Rolling Resistance
▬ Development of “Green” tyres w ith low
rolling resistance and high performance
▬ Partner w ith traditional brands moving into
electric, pure established electric brands
and new electric players
PIRELLI SPECIFIC SOLUTIONS
PRESTIGE & PREMIUM CAR EVOLVES IN FOUR MAIN DIRECTIONS
DRIVER 6: ELECTRIC PRESTIGE & PREMIUM CAR_
Note. “Connected” refers to cars with mobile data connection (e.g. 2G, 3G, LTE), which might be provided by either embedded car systems or car hardware paired with external devices (e.g. smartphone)
All data refers to Prestige & Premium cars
Source: company analysis on consulting and investment banks research reports
12%
92

COMPANY PRESENTATION – SEPTEMBER 2018
2020E 2025E
3% 8% Share of
parc
Share of registrations 12% 21%
30% 52% Share of
parc
Share of registrations 71% 99%
Share of miles driv en 3% 5%
1% 8% Share of
parc
Share of registrations 3% 30%
More Tyres needed
(with f aster replacement)
Higher Car Usage
(more Miles Driv en)
Lower cost per mile
(Higher car
Accessibility )
24/7 availability
▬ Platform designed for f leets w ith Web
Portal and apps supported by Pirelli
cloud
▬ Leverage on intelligent tyre information
▬ Solution designed to support Total Cost of Ow nership reduction
MORE PREMIUM & PRESTIGE CAR MAKERS ENTERING SHARED MOBILITY SPACE
PIRELLI SPECIFIC SOLUTIONS
PRESTIGE & PREMIUM CAR EVOLVES IN FOUR MAIN DIRECTIONS
Electric
Autonomous1
Connected
Shared
DRIVER 6: SHARED PRESTIGE & PREMIUM CAR_
Note. “Connected” refers to cars with mobile data connection (e.g. 2G, 3G, LTE), which might be provided by either embedded car systems or car hardware paired with external devices (e.g. smartphone)
All data refers to Prestige & Premium cars
Source: company analysis on consulting and investment banks research reports
93
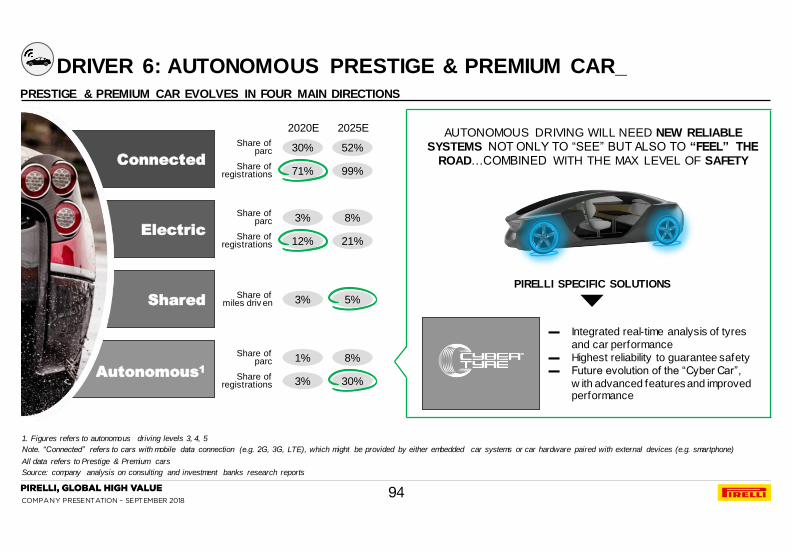
COMPANY PRESENTATION – SEPTEMBER 2018
2020E 2025E
3% 8% Share of
parc
Share of registrations 12% 21%
30% 52% Share of
parc
Share of registrations 71% 99%
Share of miles driv en 3% 5%
1% 8% Share of
parc
Share of registrations 3% 30%
PIRELLI SPECIFIC SOLUTIONS
▬ Integrated real-time analysis of tyres
and car performance
▬ Highest reliability to guarantee safety
▬ Future evolution of the “Cyber Car”,
w ith advanced features and improved performance
AUTONOMOUS DRIVING WILL NEED NEW RELIABLE SYSTEMS NOT ONLY TO “SEE” BUT ALSO TO “FEEL” THE
ROAD…COMBINED WITH THE MAX LEVEL OF SAFETY
Electric
Autonomous1
Connected
Shared
PRESTIGE & PREMIUM CAR EVOLVES IN FOUR MAIN DIRECTIONS
DRIVER 6: AUTONOMOUS PRESTIGE & PREMIUM CAR_
1. Figures refers to autonomous driving levels 3, 4, 5
Note. “Connected” refers to cars with mobile data connection (e.g. 2G, 3G, LTE), which might be provided by either embedded car systems or car hardware paired with external devices (e.g. smartphone)
All data refers to Prestige & Premium cars
Source: company analysis on consulting and investment banks research reports
94
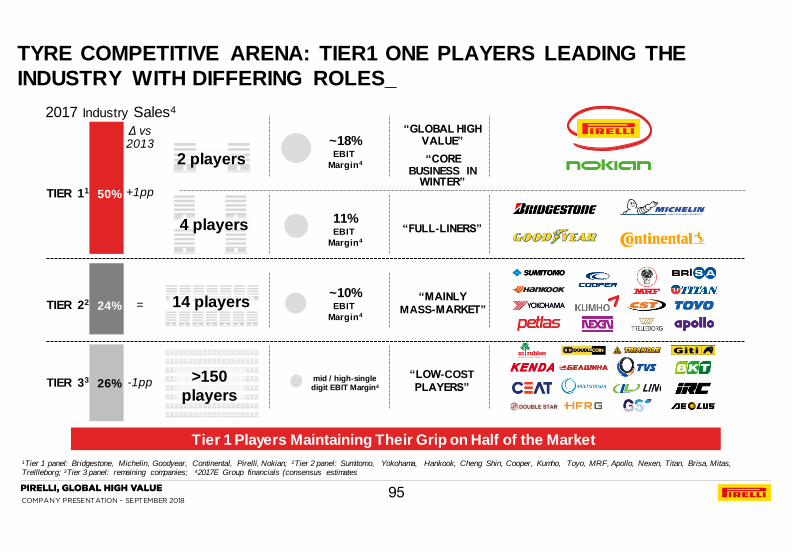
COMPANY PRESENTATION – SEPTEMBER 2018
TYRE COMPETITIVE ARENA: TIER1 ONE PLAYERS LEADING THE
INDUSTRY WITH DIFFERING ROLES_
1Tier 1 panel: Bridgestone, Michelin, Goodyear, Continental, Pirelli, Nokian; 2Tier 2 panel: Sumitomo, Yokohama, Hankook, Cheng Shin, Cooper, Kumho, Toyo, MRF, Apollo, Nexen, Titan, Brisa, Mitas, Trellleborg; 3Tier 3 panel: remaining companies; 42017E Group financials (consensus estimates
Tier 1 Players Maintaining Their Grip on Half of the Market
TIER 11
TIER 22
2017 Industry Sales4
TIER 33
“FULL-LINERS”
“GLOBAL HIGH VALUE”
>150
players
4 players
2 players
50%
24%
26%
Δ vs 2013
+1pp
=
-1pp
“MAINLY
MASS-MARKET”
“LOW-COST
PLAYERS” mid / high-single digit EBIT Margin4
~10%
EBIT
Margin4
11%
EBIT
Margin4
~18%
EBIT
Margin4 “CORE BUSINESS IN
WINTER”
14 players
95

COMPANY PRESENTATION – SEPTEMBER 2018
Pirelli Totally Focused on Consumer Business, High Value Products and Final Consumer
Leader on Prestige, on ≥18” in Europe and China
Europe NAFTA APAC LATAM RoW
Consumer
Focus1
Distribution
cov erage1
Product
portf olio3:
High v alue
≥18”
# of Marked Ty re
Homologations3
R&D
Expenditure1
(on Sales)
Key
Brands2
Business
Model1
(replacement)
Brand
Focus
Geographical
Sales
Concentration4
Global
manuf acturing
f ootprint5
100%
57%
~80%6
74%
75%6
71%
▬ Strong brand: ▬ Performance
▬ Motorsport
▬ Italian flair
▬ More mass market oriented
▬ German technology
▬ Visibility beyond tyres
▬ Motor sport
▬ More mass market oriented
2.9%
2.6%
4.1%
o/w HV 6.5%
~1,210
o/w ~410 SUV
~820
o/w ~240 SUV
~1,040
o/w ~400 SUV
~520
o/w ≥18” ~390
~800
o/w / ≥18” ~570
~1,020
o/w ≥18” ~850
~14,600
PoS 42%
18% 15%
17% 8%
38%
37%
25%
57% 26%
11% 6%
High Cost
Low Cost
Low Cost
High Cost
High Cost
Low Cost
TIER 1 COMPARISON: PIRELLI PLAYING A VERY DIFFERENT GAME VS.
EUROPEAN “FULL-LINERS”_
1. Source: 2017 data from peers financial results presentation, Tires for Continental (data from factbook 2017); 2. Source: 2017 factbook for Continental, company presentation for Michelin; 3. Source: Germany wholesaler / dealer product list (May 2018); 4. Group data for Michelin, Tires for Continental; 5. Source: Pirelli elaboration on company official data: 2017 registration document for Michelin (data refers to Group
total capacity), 2017 factbook for Continental (data refers to Passenger capacity only); 6. Source: broker’s estimates; 7. 2016 data
…
…
96
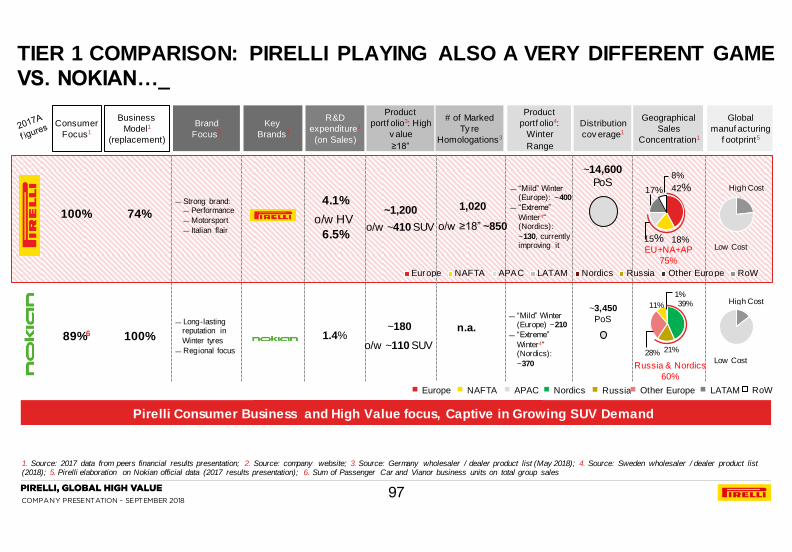
COMPANY PRESENTATION – SEPTEMBER 2018
▬ “Mild” Winter (Europe): ~400
▬ “Extreme”
Winter4“ (Nordics):
~130, currently improving it
▬ “Mild” Winter (Europe) ~210
▬ “Extreme”
Winter4“ (Nordics):
~370
Consumer
Focus1
R&D
expenditure1
(on Sales)
Business
Model1
(replacement)
Brand
Focus2
Key
Brands2
Geographical
Sales
Concentration1
Global
manuf acturing
f ootprint5
Distribution
cov erage1
Product
portf olio3: High
v alue
≥18”
# of Marked
Ty re
Homologations3
Product
portf olio4:
Winter
Range
100%
89%6 100%
74% ▬ Strong brand:
▬ Performance
▬ Motorsport
▬ Italian flair
▬ Long-lasting reputation in
Winter tyres
▬ Regional focus
1.4%
4.1%
o/w HV
6.5%
~1,200
o/w ~410 SUV
~180
o/w ~110 SUV
1,020
o/w ≥18” ~850
n.a.
~14,600
PoS
~3,450
PoS
21% 28%
11%
1% 39% High Cost
Low Cost
EU+NA+AP
75%
Russia & Nordics
60%
High Cost
Low Cost 18% 15%
17%
8%
42%
Pirelli Consumer Business and High Value focus, Captive in Growing SUV Demand
Europe NAFTA APAC LATAM RoW Nordics Russia Other Europe
Europe NAFTA APAC LATAM Nordics Russia Other Europe RoW
TIER 1 COMPARISON: PIRELLI PLAYING ALSO A VERY DIFFERENT GAME
VS. NOKIAN…_
1. Source: 2017 data from peers financial results presentation; 2. Source: company website; 3. Source: Germany wholesaler / dealer product list (May 2018); 4. Source: Sweden wholesaler / dealer product list (2018); 5. Pirelli elaboration on Nokian official data (2017 results presentation); 6. Sum of Passenger Car and Vianor business units on total group sales
97
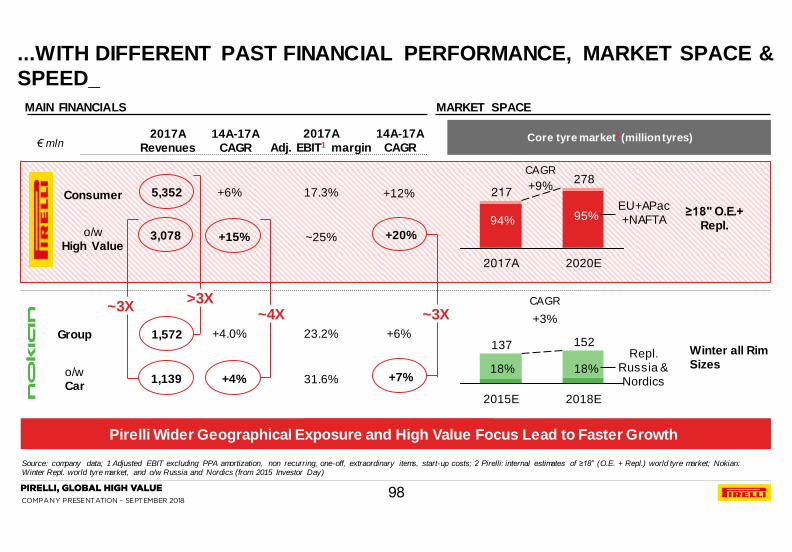
COMPANY PRESENTATION – SEPTEMBER 2018
MAIN FINANCIALS
2017A Revenues
2017A Adj. EBIT1 margin
5,352 +6% 17.3% +12% Consumer
3,078 +15% ~25% +20% o/w High Value
Group 1,572 +4.0% 23.2% +6%
o/w Car 1,139 +4% 31.6% +7%
MARKET SPACE
Core tyre market2 (million tyres)
>3X ~3X
2020E
278 217
2017A
EU+APac +NAFTA
≥18" O.E.+ Repl.
137 152
2015E 2018E
Winter all Rim Sizes
Repl. Russia & Nordics
+3%
+9%
18% 18%
94% 95%
CAGR
CAGR
€ mln 14A-17A
CAGR
14A-17A CAGR
~4X ~3X
Pirelli Wider Geographical Exposure and High Value Focus Lead to Faster Growth
...WITH DIFFERENT PAST FINANCIAL PERFORMANCE, MARKET SPACE &
SPEED_
Source: company data; 1 Adjusted EBIT excluding PPA amortization, non recurring, one-off, extraordinary items, start-up costs; 2 Pirelli: internal estimates of ≥18” (O.E. + Repl.) world tyre market; Nokian: Winter Repl. world tyre market, and o/w Russia and Nordics (from 2015 Investor Day)
98
COMPANY PRESENTATION – SEPTEMBER 2018
AGENDA 1. 1H’18 FINANCIAL RESULTS
2. FY 2017 FINANCIAL RESULTS
3c. MARKET AND COMPETITION
3d. HIGH VALUE STRATEGY: LEVERS AND REGIONAL DEPLOYMENT
3e. HIGH VALUE STRATEGY: START-UPS
3f. TRANSFORMATION PROGRAMS
3g. STANDARD PROGRAMS
3h. TARGETS 2020
3. STRATEGY AND PLAN 2017-2020
4. GOVERNANCE
3a. PIRELLI AT A GLANCE
3b. KEY INVESTMENT HIGHLIGHTS
5. SUSTAINABILITY
6. APPENDIX
99

COMPANY PRESENTATION – SEPTEMBER 2018
HIGH
VALUE
RUSSIA & CIS EUROPE NAFTA APAC MEAI LATAM EBIT Adj. Margin Revenues 2020E
STANDARD
EBIT Adj.
Margin
20E 16A
20E 16A
20E 16A 20E 16A 20E 16A 20E 16A 20E 16A 20E 16A
High
teens Twenties Twenties
Mid single
digit
Mid
teens
Break
ev en
Mid
teens
High single
digit
Mid
twenties
~ ~ ~
20E 16A
“VALUE MAP” GUIDING OUR PRIORITIES_
100

COMPANY PRESENTATION – SEPTEMBER 2018
CAPEX 17E-20E Avg. ~7% on yearly
sales
Europe APAC NAFTA LatAm MEAI Russia
High Value 82%
Standard 3%
Common* 15%
100%
Conversion of existing capacity towards High Value to support
NAFTA growth
2x inv estment if we include the acquisition of Aeolus Car plant
(4Mln pcs) in 2016
Maintenance**: 25% on total Capex
2017E-2020E STRATEGIC RESOURCE ALLOCATION,
FOCUSED ON HIGH VALUE_
* Digital, Logistics, Commercial, etc.; ** Baseload HSE and loss prevention, R&D, IT, Logistics and other
101

COMPANY PRESENTATION – SEPTEMBER 2018
▬ Romania / Mexico further
expansions
▬ Brazil upgrade to High Value
▬ Upgrading and reshaping of
China ex Aeolus
Increase/conversion High Value capacity
Technology upgrade to High Value, Specialties, moulds and quality
Plant and business maintenance
Capex on revenues
€ Mln
% of revenues
2014A 2013A 2012A 2011A 2021E 2020E 2019E 2018E 2017A 2016A 2015A
Simultaneous capacity
increase initiatives:
▬ Kick off new Mexico plant
▬ Settimo Torinese new «Polo»
▬ China Car phase 3 ▬ Romania further expansion
Mexico additional building and
capacity (ready to satisfy future
NAFTA demand)
CAPEX / REVENUES OVER TIME_
Source: Pirelli consumer figures 2011-2013, carve-out 2014-2016
102

COMPANY PRESENTATION – SEPTEMBER 2018
YEARLY TREND - ITEMS KEY BENEFITS OF HOMOLOGATIONS
165
207
281
315
2013A 2015A 2016A
327
2014A 2012A
176 139
247 284
288
26 31 34 43 27
2017A 2018E 2019E 2020E
Standard Products New Premium Products
Projects in homologation phase
▬ Strengthen competitiveness in Replacement thanks to “pull through effect”
▬ Provide visibility in advance on future Car Manufacturers demand
▬ Support product innovation and co-development of cutting edge technology
Homologation Portfolio Almost Doubled in the Last 5 Years
~850 O.E. PROJECTS
ALREADY IN THE
PIPELINE FOR
2018-2020
~2.5X
324
78
402
KEY STRATEGIC LEVER #1: ACCELERATING HOMOLOGATION PIPELINE_
Source: company data
103

COMPANY PRESENTATION – SEPTEMBER 2018
IN 2017-2020 TIMEFRAME:
Winter
6
Global
9
Specialties
9
18
Summer &
All Season
12
Regional
9
Traditional
9
SALES AREA SEASONALITY TECHNOLOGIES
new product lines
of which: vs 14 in past period
~+20%
Different sizes YoY
KEY STRATEGIC LEVER #2: NEW PRODUCT INNOVATION_
104

COMPANY PRESENTATION – SEPTEMBER 2018
SALES
PLANS
…To the point that >60% of our Replacement High Value Volumes (and >50% our O.E. High Value Volumes) in our Three Year Plan to 2020 are already linked to our current (30th June) Homologation Portfolio
DEMAND
PLANNING
FACTORIES
SUPPLY
CHAIN
TRADE
ENGAGEMENT
CONSUMER
ENGAGEM
ENT
Product
Develop.
O. E.
Tyres Market
Replacement
Tyre Market
Push through
Demand
New
Registrations
Car Parc fitting
≥18’’ tyres
Pull through
Demand
Homologation
44 60
BRANDS
104 M 161 M
TYRES
+36% vs. 2016
+54% vs. 2016
LEGEND: 2016A 2020E FIGURES
Replacement High Value Plan volumes linked
to Homologation portfolio as of June ’17 [%]
Avg >60%
2020 2019 2018
Avg >50%
2020 2019 2018
O.E. High Value plan volumes linked to
homologation portfolio as of June ’17 [%]
LEVERS #1 AND #2 WILL HELP US CAPTURE A HIGHLY PREDICTABLE
AND COPIOUS TYRE DEMAND FOR ≥18’’…_
105

COMPANY PRESENTATION – SEPTEMBER 2018
33 26
38 (54%)
-7
+3
+11 -2 +2
53 (67%)
71
79
Standard to New Premium
New Premium conversion to
≥21’’
Standard reduction
New Premium grow th
2016A 2020E
High Value Car (≥18” & Specialties)
Other Car (≤17” Marked, Homologated,
technological and regional lines)
Capacity ≥18’’
CAR CAPACITY PRODUCTION SPLIT
2016A 2020E
~ 90% > 90%
Mln pcs Capacity ≤17’’
AVERAGE SATURATION
PRODUCTION SPLIT
High Value Car (≥18” & Specialties)
Other Car (≤17” Marked, Homologated,
technological and regional lines)
76 mln pcs in 2017
Of which 55% High
Value (42 mln pcs)
STRATEGIC LEVER #3: SHIFTING CAR CAPACITY TO HIGH VALUE_
Note: rounding might occur
106
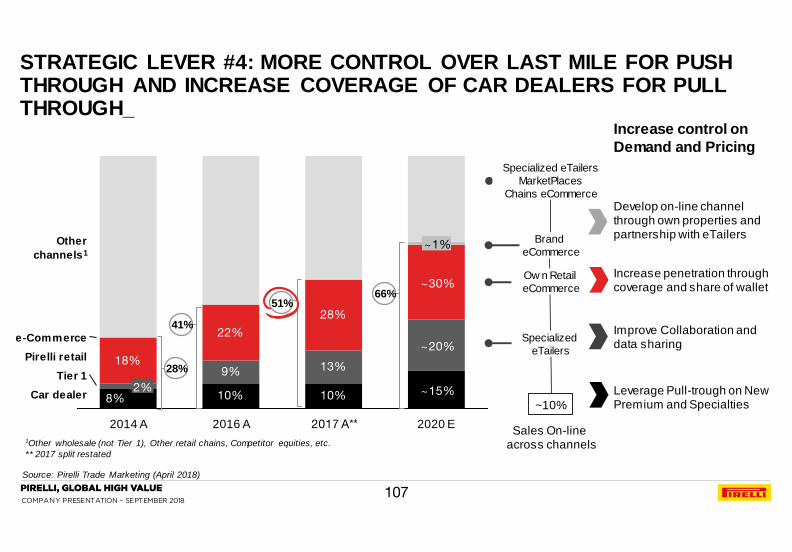
COMPANY PRESENTATION – SEPTEMBER 2018
10% 10%
9% 13%18%
22%
28%
8%~15% Car dealer
Tier 1
~20%
2016 A 2014 A
~1%
2017 A**
e-Commerce
2020 E
~30%
Other
channels1
Pirelli retail
2%
1Other wholesale (not Tier 1), Other retail chains, Competitor equities, etc.
** 2017 split restated
Increase control on
Demand and Pricing
Increase penetration through coverage and share of wallet
Improve Collaboration and data sharing
Leverage Pull-trough on New Premium and Specialties
Develop on-line channel through own properties and partnership with eTailers
Sales On-line across channels
66%
41%
Brand
eCommerce
~10%
Specialized eTailers
MarketPlaces
Chains eCommerce
Specialized
eTailers
Ow n Retail
eCommerce
28%
STRATEGIC LEVER #4: MORE CONTROL OVER LAST MILE FOR PUSH THROUGH AND INCREASE COVERAGE OF CAR DEALERS FOR PULL THROUGH_
51%
Source: Pirelli Trade Marketing (April 2018)
107
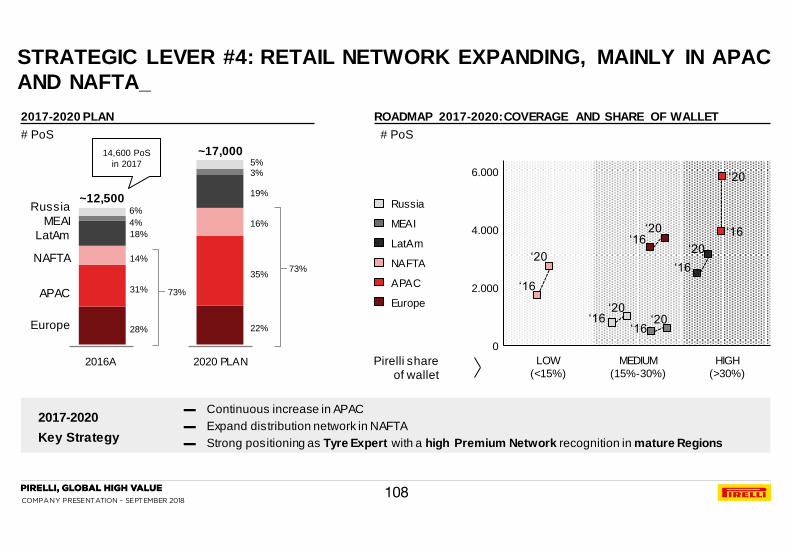
COMPANY PRESENTATION – SEPTEMBER 2018
ROADMAP 2017-2020: COVERAGE AND SHARE OF WALLET
LOW
(<15%)
MEDIUM
(15%-30%)
HIGH
(>30%) Pirelli share
of wallet
Europe
Russia
APAC
MEAI
LatAm
NAFTA
6.000
4.000
2.000
0
# PoS
‘16
‘20
‘16 ‘20
‘16 ‘20
‘16
‘20
‘16
‘20
‘16 ‘20
2017-2020 PLAN
2017-2020
Key Strategy
▬ Continuous increase in APAC
▬ Expand distribution network in NAFTA
▬ Strong positioning as Tyre Expert with a high Premium Network recognition in mature Regions
2020 PLAN
~17,000
28%
18%
31%
4%
6%
14%
3% 5%
2016A
~12,500
APAC
Europe
LatAm
MEAI
Russia
NAFTA
22%
19%
35%
16%
73%
73%
# PoS
STRATEGIC LEVER #4: RETAIL NETWORK EXPANDING, MAINLY IN APAC
AND NAFTA_
14,600 PoS
in 2017
108
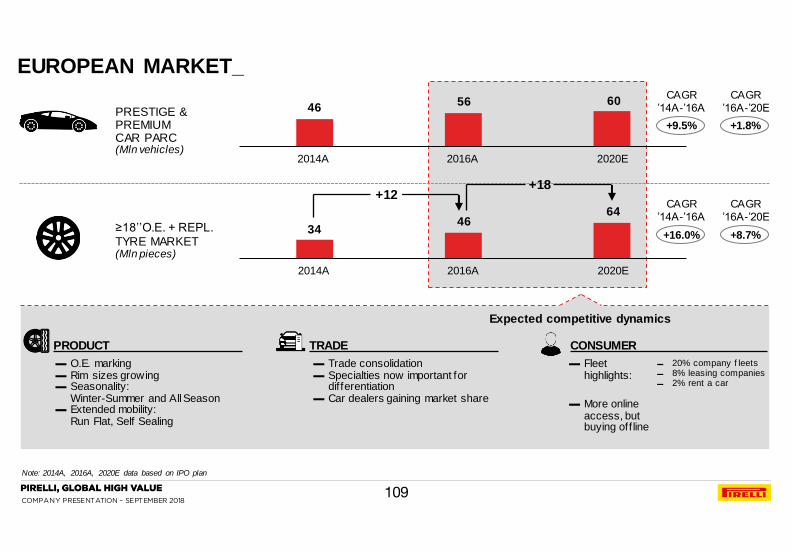
COMPANY PRESENTATION – SEPTEMBER 2018
▬ O.E. marking ▬ Rim sizes growing ▬ Seasonality:
Winter-Summer and All Season ▬ Extended mobility:
Run Flat, Self Sealing
▬ Trade consolidation ▬ Specialties now important for
differentiation ▬ Car dealers gaining market share
▬ Fleet highlights:
▬ 20% company f leets ▬ 8% leasing companies ▬ 2% rent a car
Expected competitive dynamics
PRODUCT TRADE CONSUMER
PRESTIGE & PREMIUM CAR PARC (Mln vehicles)
≥18’’O.E. + REPL. TYRE MARKET (Mln pieces)
+9.5%
46 56 60
2020E 2016A 2014A
+1.8%
+16.0% +8.7%
▬ More online access, but buying off line
34 46
64
+12 +18
2020E 2016A 2014A
CAGR
’14A-’16A
CAGR
’16A-’20E
CAGR
’14A-’16A
CAGR
’16A-’20E
EUROPEAN MARKET_
Note: 2014A, 2016A, 2020E data based on IPO plan
109

COMPANY PRESENTATION – SEPTEMBER 2018
PIRELLI EUROPE TODAY
▬ Prestige Market Leader
▬ Partner of Premium Car Makers, #1 in marked tyre homologations
▬ Cutting edge products
▬ ~3,900 PoS1
▬ Market Share replacement ≥18’’: close to 20%
Pirelli Revenues
€ billion
≥6.5% 6.2%
2020E 2017A
2.2
2016A
2.1
2014A
1.9
EUROPE STRATEGY
CAGR
14A-16A
OEM relationships
▬ Reinforce Prestige leadership
▬ Maintain position in Premium segment
▬ Expand collaborations in relevant EV projects
Product lines
▬ Grow Specialties, Super Specialties and new Premium
Distribution
▬ PoS expansion focused on Franchising
▬ Strengthen High Value price positioning
▬ Deploy Tier 1 integration to improve mix and business predictability
Consumer engagement
▬ Target New Premium and Prestige consumers w ith PZero World Shops
▬ Enhance consumer engagement and retention via:
▬ Digital and CRM
▬ Events sponsorships and new contents
▬ Connesso and PZero Velo to attract new segments
CAGR
16A-20E
High Value
Standard
EUROPE PLAN_
1. 2017 data; Note: 2014A, 2016A, 2020E data based on IPO plan
+7%
+12%
YoY
Organic growth
+7.5%
110
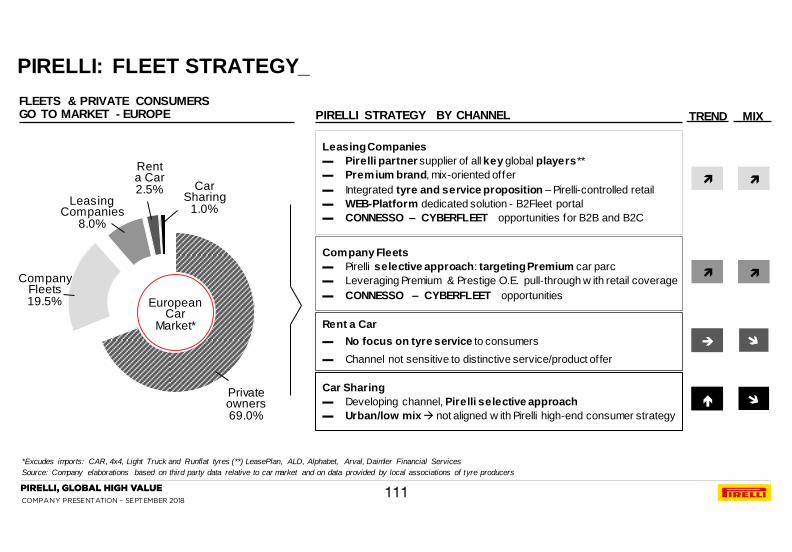
COMPANY PRESENTATION – SEPTEMBER 2018
PIRELLI STRATEGY BY CHANNEL
FLEETS & PRIVATE CONSUMERS GO TO MARKET - EUROPE
Company Fleets
▬ Pirelli selective approach: targeting Premium car parc
▬ Leveraging Premium & Prestige O.E. pull-through w ith retail coverage
▬ CONNESSO – CYBERFLEET opportunities
Rent a Car
▬ No focus on tyre service to consumers
▬ Channel not sensitive to distinctive service/product offer
Car Sharing
▬ Developing channel, Pirelli selective approach
▬ Urban/low mix not aligned w ith Pirelli high-end consumer strategy
Leasing Companies
▬ Pirelli partner supplier of all key global players**
▬ Premium brand, mix-oriented offer
▬ Integrated tyre and service proposition – Pirelli-controlled retail
▬ WEB-Platform dedicated solution - B2Fleet portal
▬ CONNESSO – CYBERFLEET opportunities for B2B and B2C
TREND
MIX
Leasing Companies
8.0%
Private owners 69.0%
Car Sharing
1.0%
Rent a Car 2.5%
Company Fleets 19.5% European
Car Market*
PIRELLI: FLEET STRATEGY_
*Excudes imports: CAR, 4x4, Light Truck and Runflat tyres (**) LeasePlan, ALD, Alphabet, Arval, Daimler Financial Services
Source: Company elaborations based on third party data relative to car market and on data provided by local associations of tyre producers
111

COMPANY PRESENTATION – SEPTEMBER 2018
▬ Largest 18’’+ market (55% of w orldwide volumes), continuously grow ing
▬ For the great majority “all season” market
▬ Investment in capacity
▬ Import from China dow n vs 2014 due to duties
▬ Independent Tyre Dealers strongest distribution channel
▬ Car Dealers gaining Market Share, w hile mass merchandiser decline
▬ Market highly concentrated within Top Player
▬ Service demanding, mainly checking online – buying off line
▬ Brands starting selling on-line
▬ Higher digital marketing investments targeting millennials
Expected competitive dynamics
TRADE CONSUMER
PRESTIGE & PREMIUM CAR PARC (Mln vehicles)
≥18’’O.E. + REPL. TYRE MARKET (Mln pieces)
+3.3%
35 38 43
2020E 2016A 2014A
+3.1%
+10.6% +8.3% 78 95
131
+36 +17
2020E 2016A 2014A
CAGR
’14A-’16A
CAGR
’16A-’20E
CAGR
’14A-’16A
CAGR
’16A-’20E
PRODUCT
NAFTA MARKET_
* Crossover Utility Vehicle; Note: 2014A, 2016A, 2020E data based on IPO plan
112

COMPANY PRESENTATION – SEPTEMBER 2018
▬ Prestige & European Premium Market Leader
▬ O.E. selective approach
▬ Solid and profitable Local for local industrial footprint entirely focused on high-value production
▬ «All-season» product portfolio well perceived by the market
▬ Distribution focused on Premium customers and car dealers
▬ Retail affiliation targeted at Premium locations
PIRELLI NAFTA TODAY NAFTA STRATEGY
OEM relationships
▬ O.E. grow th with key partners in HV segment and new EV players
Product lines
▬ New product lines introduction completing All Season and SUV-CUV* and
all season
▬ Grow Specialties, Super Specialties (Connesso) and new Premium
M anufacturing
▬ Grow ing capacity in Mexico
▬ LATAM plants conversions to HV
Distribution
▬ Widen distribution to Premium retailers in Premium areas
▬ Expand cooperation w ith Tier1 Customers
▬ Car Dealer business expansion
▬ Winter regional grow th
▬ Strengthen High Value price positioning
Consumer engagement
▬ Consumer Engagement and Retention, w ith:
▬ Digital and CRM leveraging on strong Brand advocacy
▬ Strong Partnership w ith eTailers
▬ Connesso and PZero Velo to attract new segments
Pirelli Revenues
€ Bln
≥13%
17.4%
2020E 2017A
1.0
2016A
0.9
2014A
0.7
High Value
Standard
CAGR
14A-16A
CAGR
16A-20E
NAFTA PLAN_
* Sport Utility Vehicle and Crossover Utility Vehicle (**) Run Flat, Seal Inside, Pirelli Noise Cancelling System; Note: 2014A, 2016A, 2020E data based on IPO plan
+5%
+6%
YoY
Organic growth
+7.4%
113
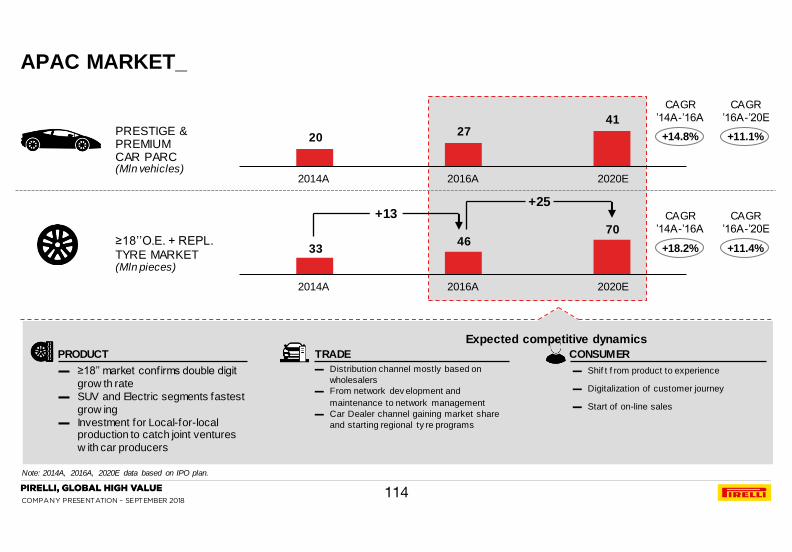
COMPANY PRESENTATION – SEPTEMBER 2018
PRODUCT TRADE CONSUMER
Expected competitive dynamics
▬ ≥18’’ market confirms double digit
grow th rate
▬ SUV and Electric segments fastest
grow ing
▬ Investment for Local-for-local production to catch joint ventures
w ith car producers
▬ Distribution channel mostly based on
wholesalers
▬ From network dev elopment and
maintenance to network management
▬ Car Dealer channel gaining market share
and starting regional ty re programs
▬ Shif t f rom product to experience
▬ Digitalization of customer journey
▬ Start of on-line sales
PRESTIGE & PREMIUM CAR PARC (Mln vehicles)
≥18’’O.E. + REPL. TYRE MARKET (Mln pieces)
+14.8% 20 27
41
2020E 2016A 2014A
+11.1%
+18.2% +11.4% 33 46
70
+25 +13
2020E 2016A 2014A
CAGR
’14A-’16A
CAGR
’16A-’20E
CAGR
’14A-’16A
CAGR
’16A-’20E
APAC MARKET_
Note: 2014A, 2016A, 2020E data based on IPO plan.
114

COMPANY PRESENTATION – SEPTEMBER 2018
PIRELLI APAC TODAY APAC STRATEGY
▬ Very successful overall growth story
▬ Solid partner of Premium Car Makers
▬ Significant Network Expansion Strategy, supported
by geo-marketing
▬ #2 in Top of Mind in China
OEM relationships
▬ Consolidate leadership w ith Premium car makers
▬ Diversif ication of OEMs client base
Product lines
▬ Undisputed leader in Run Flat through O.E. pull-through
▬ Fast grow ing in other specialties (colored, PNCS)
▬ Grow Prestige sales in China
M anufacturing
▬ Increase fast and cost-eff icient capacity to catch growth opportunities
Distribution
▬ Enhance trade engagement enlarging netw ork and increasing quality
netw ork
▬ Transfer China retail development best practice to South East Asia
Consumer engagement
▬ Focus communication to new Premium and Prestige consumers
≥14.5%
17.2%
2020E 2017A
0.8
2016A
0.7
2014A
0.5
High Value
Standard
CAGR
14A-16A
CAGR
16A-20E
Pirelli Revenues
€ billion
APAC PLAN_
Note: 2014A, 2016A, 2020E data based on IPO plan
+13%
+18%
YoY
Organic growth
+14.3%
115

COMPANY PRESENTATION – SEPTEMBER 2018
RUSSIA
& CIS
MEAI
LATAM
NEW PREMIUM TYRE
REPLACEMENT MARKET
2016
Mln Tyre
2.5
3.7
1.4
2020
Mln Tyre
3.3
5.1
1.8
PIRELLI PRESTIGE
MARKET SHARE
high single digit
2017
twenties
mid teens
PRESTIGE & PREMIUM
CAR PARK
2016
Mln vehicles
3.4
4.3
1.1
2016
% of Total
6.1%
4.5%
1.5%
2020
Mln vehicles
3.8
5.7
1.4
2020
% of Total
6.6%
4.8%
1.8%
PIRELLI ≥18''
MARKET SHARE
2017
GLOBAL
LEADER
PIRELLI WELL POSITIONED IN EMERGING HIGH VALUE MARKETS_
116
COMPANY PRESENTATION – SEPTEMBER 2018
2. FY 2017 FINANCIAL RESULTS
AGENDA
3c. MARKET AND COMPETITION
3d. HIGH VALUE STRATEGY: LEVERS AND REGIONAL DEPLOYMENT
3e. HIGH VALUE STRATEGY: START-UPS
3f. TRANSFORMATION PROGRAMS
3g. STANDARD PROGRAMS
3h. TARGETS 2020
3. STRATEGY AND PLAN 2017-2020
4. GOVERNANCE
3a. PIRELLI AT A GLANCE
3b. KEY INVESTMENT HIGHLIGHTS
5. SUSTAINABILITY
6. APPENDIX
1. 1H’18 FINANCIAL RESULTS
117

COMPANY PRESENTATION – SEPTEMBER 2018
Apps and services
Full library of applications from third parties
Alternative business models
Autonomous vehicle sharing, new service offerings, etc.
Data analytics
Connected cloud processing, data feeds for manufacturers
$ b illion, global market size
SERVICES MARKET GROWS FAST IN MULTIPLE SEGMENTS
2015A 2025E 2020E
% of total car market
~5% ~7% ~11%
+13%
~6x vs rest
of car market
CAR SERVICES MARKET
Pirelli is Positioning Itself in Order to Be the First Tyre Player Offering a Consumer App & Services
2020E-2025E SCENARIO: CAR SERVICES MARKET_
Source: Management elaboration based on several consulting and investment banks research reports
118
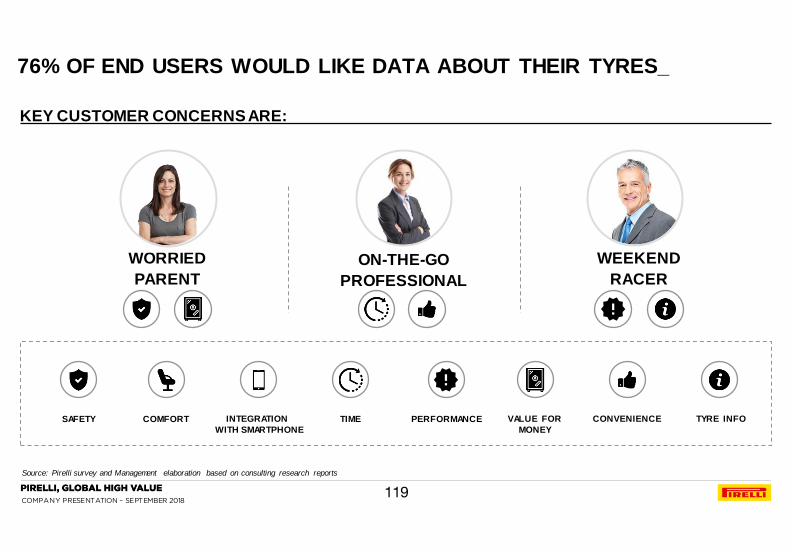
COMPANY PRESENTATION – SEPTEMBER 2018
KEY CUSTOMER CONCERNS ARE:
COMFORT TIME PERFORMANCE VALUE FOR
MONEY
CONVENIENCE SAFETY INTEGRATION
WITH SMARTPHONE
ON-THE-GO
PROFESSIONAL
WEEKEND
RACER
WORRIED
PARENT
TYRE INFO
76% OF END USERS WOULD LIKE DATA ABOUT THEIR TYRES_
Source: Pirelli survey and Management elaboration based on consulting research reports
119

COMPANY PRESENTATION – SEPTEMBER 2018
APPLICATION SOLUTIONS WHAT THEY DO
App notification to the driver on tyre performance and safety data (e.g. tyre w ear, pressure, temperature), service enabler
Replaces TPMS and provides additional information to in-vehicle electronics (maintenance needs, performance and safety) directly displayed on car dashboard and car maker app
As Cyber Car but 100% real-time and adding advanced features e.g. grip, acqua planing, forces) . Fully integrated in the vehicle control system
Engineering platform to reduce car development time and cost of car-tyre development and integration
Platform dedicated to f leets to reduce Total Cost of Mobility and breakdown downtime
CYBER TECHNOLOGY
SOLUTIONS
FLEET
APPLICATIONS*
CAR
APPLICATIONS
O.E. SOLUTION
AFTERMARKET SOLUTION
CONNESSO
CYBERFLEET
CYBERCAR
CYBERTYRE
CYBERTYRE Development kit
CYBER TECHNOLOGY LAUNCHING 5 NEW PLATFORMS_
*Passenger cars, commercial vehicles; **Total Cost of Ownership
120

COMPANY PRESENTATION – SEPTEMBER 2018
PIRELLI CONNESSOTM: HOW IT WORKS_
FEATURES AND BENEFITS
TYRE PRESSURE
− Keep the pressure of tyres at the optimal level to improve
the efficiency and performance of your car.
TYRE TEMPERATURE
− Check sensorised tyre temperature anytime and
everywhere.
TYRE WEAR
− Monitor tyre tread depth and increase safety and
performance.
FILL MODE
− View real-time pressure readings on tyre fill with easy
check recommended levels.
PIRELLI CONCIERGE
− To find the perfect solution for all of the tyre related service
needs, including: balancing, rotation, alignment, tyre
change, appointment booking, as well as car pick-up and
drop off.
CONNESSO CLUB
− To access exclusive contents and keep updated on the
latest Pirelli news and events.
121
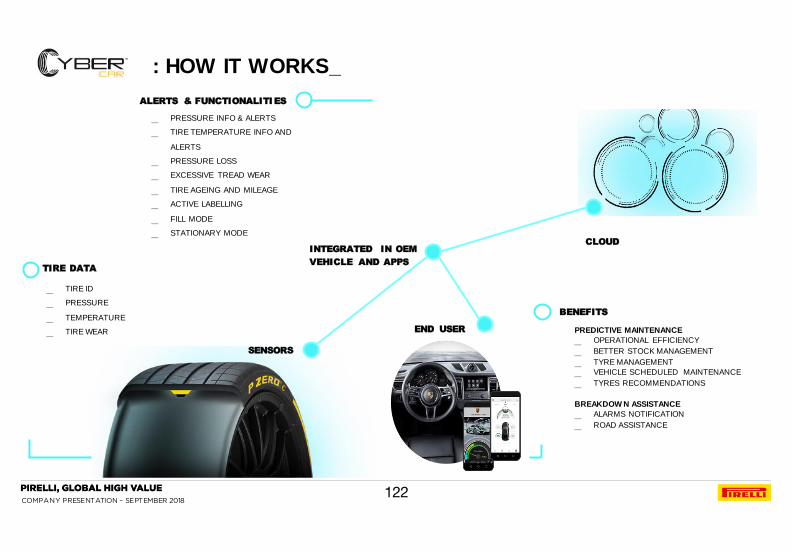
COMPANY PRESENTATION – SEPTEMBER 2018
ALERTS & FUNCTIONALITI ES
TIRE DATA
BENEFITS
CLOUD
END USER
SENSORS
INTEGRATED IN OEM
VEHICLE AND APPS
_ TIRE ID
_ PRESSURE
_ TEMPERATURE
_ TIRE WEAR
_ PRESSURE INFO & ALERTS
_ TIRE TEMPERATURE INFO AND
ALERTS
_ PRESSURE LOSS
_ EXCESSIVE TREAD WEAR
_ TIRE AGEING AND MILEAGE
_ ACTIVE LABELLING
_ FILL MODE
_ STATIONARY MODE
: HOW IT WORKS_
PREDICTIVE MAINTENANCE
_ OPERATIONAL EFFICIENCY
_ BETTER STOCK MANAGEMENT
_ TYRE MANAGEMENT
_ VEHICLE SCHEDULED MAINTENANCE
_ TYRES RECOMMENDATIONS
BREAKDOW N ASSISTANCE
_ ALARMS NOTIFICATION
_ ROAD ASSISTANCE
122

COMPANY PRESENTATION – SEPTEMBER 2018
What is going to happen? What will it look like? Single lane capacity1
Car Car restrictions will become standard and cars will be used for the first / last mile
Bike Citizens will demand broader access to urban areas for leisure and cultural activities
Bus Local authorities will optimize space use by shifting users towards public transport
Pirelli Intends to Expand its Offer to Hybrid and Electric Car Tyres, Connectivity Solutions2, and Bike Tyres
NEW MOBILITY PARADIGMS (INTEGRATED, ACTIVE, AFFORDABLE) WILL LEAD LOCAL AUTHORITIES TO CURB PRIVATE CAR USAGE
2020-2025 SCENARIO: URBANIZATION_
1Number of users per hour on a 3.5m road lane. In picture, from top to bottom: Stockholm, New York, Buenos Aires
2E.g., CyberFleets; Source: World Business Council for Sustainable Development
123

COMPANY PRESENTATION – SEPTEMBER 2018
NEW GENERATIONS BECOME AN IMPORTANT LONG-TERM TARGET
Baby boomers (1945-1964)
▬ “Climb corporate ladder”
▬ Buy now , pay later
Generation X (1965-1979)
▬ “Rely on yourself”
▬ Cautious and conservative
Generation Z (1995-?)
▬ “Stay connected”
▬ Grow n up during 2008 crisis
Millennials/Gen. Y (1980-1994)
▬ “Appreciate work life balance”
▬ Earn to spend
World population 20 to 70 years old (Bln) 2020E 2025E 2015A
1.2
1.7
1.4
0.7
1.7
0.6
1.4
1.0
1.8
1.4
1.2
Pirelli is already engaging millennials through appealing storytelling on social media
2020-2025 SCENARIO: GENERATIONAL TURNOVER_
Source: UN WPP 2015, Web research
124
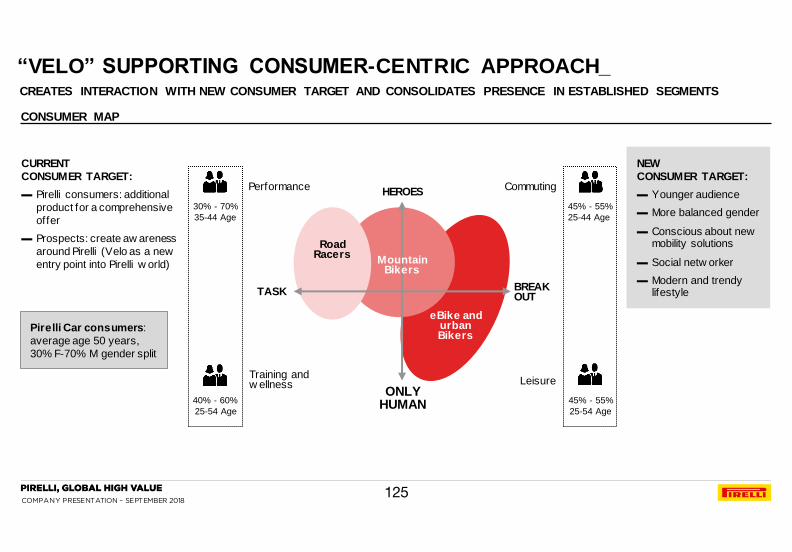
COMPANY PRESENTATION – SEPTEMBER 2018
Pirelli Car consumers:
average age 50 years,
30% F-70% M gender split
CONSUMER MAP
NEW
CONSUMER TARGET:
▬ Younger audience
▬ More balanced gender
▬ Conscious about new mobility solutions
▬ Social netw orker
▬ Modern and trendy lifestyle
HEROES
ONLY HUMAN
TASK BREAK OUT
Performance
Leisure
Commuting
Training and w ellness
Road Racers
Mountain Bikers
eBike and urban Bikers
30% - 70%
35-44 Age
40% - 60%
25-54 Age
45% - 55%
25-54 Age
45% - 55%
25-44 Age
CURRENT
CONSUMER TARGET:
▬ Pirelli consumers: additional
product for a comprehensive
offer
▬ Prospects: create aw areness
around Pirelli (Velo as a new
entry point into Pirelli w orld)
CREATES INTERACTION WITH NEW CONSUMER TARGET AND CONSOLIDATES PRESENCE IN ESTABLISHED SEGMENTS
“VELO” SUPPORTING CONSUMER-CENTRIC APPROACH_
125
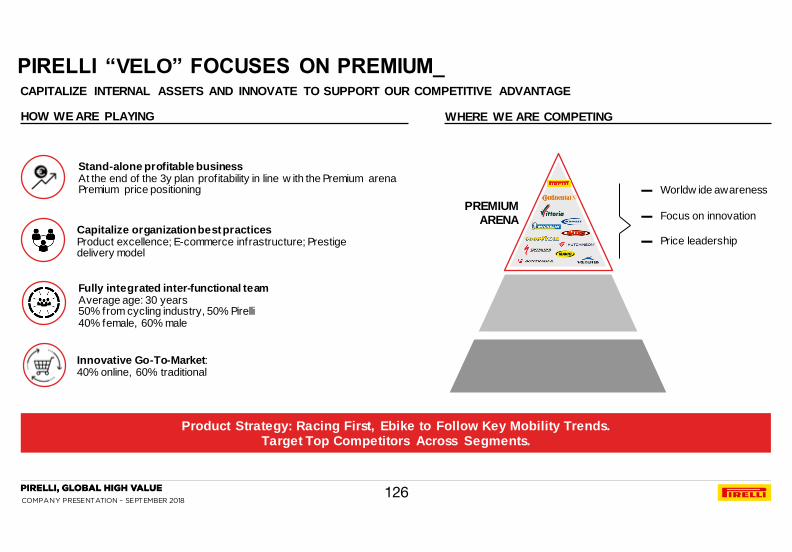
COMPANY PRESENTATION – SEPTEMBER 2018
CAPITALIZE INTERNAL ASSETS AND INNOVATE TO SUPPORT OUR COMPETITIVE ADVANTAGE
HOW WE ARE PLAYING
Stand-alone profitable business At the end of the 3y plan profitability in line w ith the Premium arena Premium price positioning
Capitalize organization best practices Product excellence; E-commerce infrastructure; Prestige delivery model
Fully integrated inter-functional team Average age: 30 years 50% from cycling industry, 50% Pirelli 40% female, 60% male
Innovative Go-To-Market: 40% online, 60% traditional
WHERE WE ARE COMPETING
Product Strategy: Racing First, Ebike to Follow Key Mobility Trends. Target Top Competitors Across Segments.
PREMIUM ARENA
▬ Worldw ide awareness
▬ Focus on innovation
▬ Price leadership
PIRELLI “VELO” FOCUSES ON PREMIUM_
126

COMPANY PRESENTATION – SEPTEMBER 2018
RollingResistance
wet grip
mileage
punctureresistance
weight
comfort
P ZERO VELO TT P ZERO VELO 4S
P ZERO VELO
KEY CHARACTERISTICS
P ZERO VELO: OUR ROAD OFFER IS NOW COMPLETE_
LIGHTWEIGHT
PERFORMANCE PURE
PERFORMANCE
A LL WEATHER
PERFORMANCE
PURE
PROTECTION
T U BE LES S RE ADY
CINTURATO VELO
127
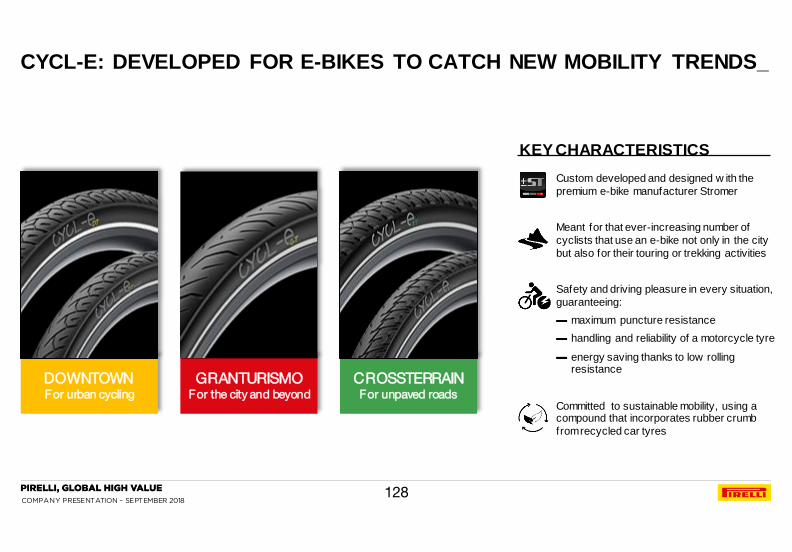
COMPANY PRESENTATION – SEPTEMBER 2018
CYCL-E: DEVELOPED FOR E-BIKES TO CATCH NEW MOBILITY TRENDS_
DOWNTOWN For urban cycling
GRANTURISMO For the city and beyond
CROSSTERRAIN For unpaved roads
KEY CHARACTERISTICS
Custom developed and designed w ith the
premium e-bike manufacturer Stromer
Meant for that ever-increasing number of
cyclists that use an e-bike not only in the city
but also for their touring or trekking activities
Safety and driving pleasure in every situation,
guaranteeing:
▬ maximum puncture resistance
▬ handling and reliability of a motorcycle tyre
▬ energy saving thanks to low rolling resistance
Committed to sustainable mobility, using a compound that incorporates rubber crumb
from recycled car tyres
128
COMPANY PRESENTATION – SEPTEMBER 2018
1. 1H’18 FINANCIAL RESULTS
2. FY 2017 FINANCIAL RESULTS
AGENDA
3c. MARKET AND COMPETITION
3d. HIGH VALUE STRATEGY: LEVERS AND REGIONAL DEPLOYMENT
3e. HIGH VALUE STRATEGY: START-UPS
3f. TRANSFORMATION PROGRAMS
3g. STANDARD PROGRAMS
3h. TARGETS 2020
3. STRATEGY AND PLAN 2017-2020
4. GOVERNANCE
3a. PIRELLI AT A GLANCE
3b. KEY INVESTMENT HIGHLIGHTS
5. SUSTAINABILITY
6. APPENDIX
129

COMPANY PRESENTATION – SEPTEMBER 2018
Product
Develop.
O. E.
Tyres Market
Replacement
Tyre Market
Push through
Demand
New
Registrations
Car Parc
Pull through
Demand
Homologation
Product
Develop.
S
A
L
E
S
P
L
A
N
S
D
E
M
A
N
D
P
L
A
N
N
I
N
G
F
A
C
T
O
R
I
E
S
S
U
P
P
L
Y
C
H
A
I
N
T
R
A
D
E
E
N
G
A
G
E
M
E
N
T
C
O
N
S
U
M
E
R
E
N
G
A
G
E
M
E
N
T
2. Smart Manufacturing and Flexible Factory
3. Prestige
4. Supply Chain
1. Integrated Forecasting
4 KEY DIGITALLY ENABLED TRANSFORMATION PROGRAMS,
SUPPORTING HORIZONTAL PROCESSES_
130
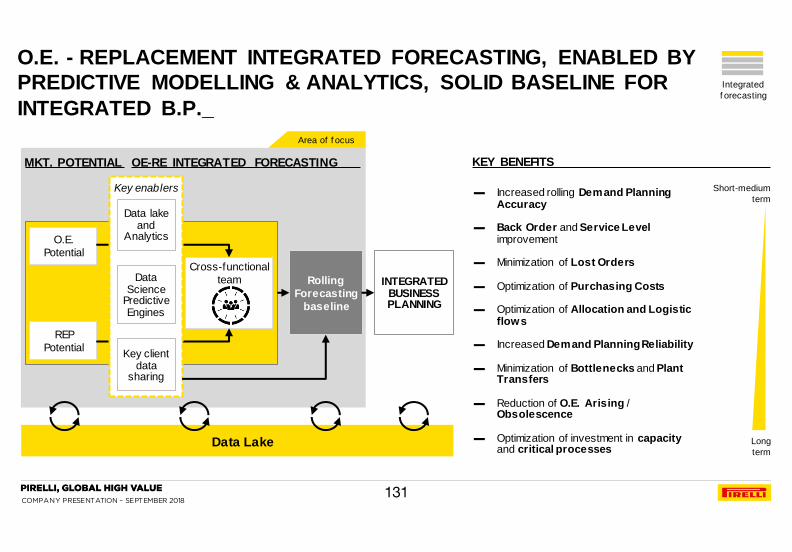
COMPANY PRESENTATION – SEPTEMBER 2018
MKT. POTENTIAL OE-RE INTEGRATED FORECASTING
Cross-functional
team
O.E.
Potential
REP
Potential
Data Lake
INTEGRATED BUSINESS PLANNING
▬ Increased rolling Demand Planning Accuracy
▬ Back Order and Service Level improvement
▬ Minimization of Lost Orders
▬ Optimization of Purchasing Costs
▬ Optimization of Allocation and Logistic flows
▬ Increased Demand Planning Reliability
▬ Minimization of Bottlenecks and Plant Transfers
▬ Reduction of O.E. Arising / Obsolescence
▬ Optimization of investment in capacity and critical processes
KEY BENEFITS
Rolling
Forecasting
baseline
Area of f ocus
Long
term
Short-medium
term
Data Science
Predictive Engines
Data lake and
Analytics
Key enablers
Key client data
sharing
Integrated
f orecasting
O.E. - REPLACEMENT INTEGRATED FORECASTING, ENABLED BY
PREDICTIVE MODELLING & ANALYTICS, SOLID BASELINE FOR
INTEGRATED B.P._
131

COMPANY PRESENTATION – SEPTEMBER 2018
FLEXIBLE FACTORY SMART
MANUFACTURING
DESIGN
TO COST
NEW PREMIUM
CAPACITY
FLEXIBILITY COMPLEXITY
MANAGEMENT PRODUCTIVITY NEW PREMIUM MIX
STRATEGIC
VISION
PROGRAMS
BENEFITS
Focus of following slides
MARKET
PRODUCT COMPLEXITY
RF NCS SI Colored Connesso
PLANT MISSION DIGITAL TRANSFORMATION
Smart manuf .
& f lex. f actory
DIGITAL TRANSFORMATION IN MANUFACTURING RESPONDING
TO MARKET EVOLUTION_
132

COMPANY PRESENTATION – SEPTEMBER 2018
MA
RK
ET
Smart manuf .
& f lex. f actory
Variety Lot size
PIR
EL
LI
MA
NU
FA
CT
UR
ING
FLEXIBLE FACTORY SMART MANUFACTURING
Pit Stop
Shopfloor Organization
Planning
Frictionless flow
Asset
For zero cost set-up
Semi-f inishing Building Curing Finishing Mixing
DATA SCIENCE AND ANALYTICS
DATA LAKE
CUSTOMER
MANUFACTURING DIGITAL TRANSFORMATION:
DELIVERING BETTER SERVICE WHILE MANAGING COMPLEXITY_
133

COMPANY PRESENTATION – SEPTEMBER 2018
Replacement
Services (Marketing, Digital
Marketing, Motorsport Activation)
Supply Chain Original
Equipment
HeadQuarter
Regions
…AND LEVERAGING ON DIGITAL AND BEST PRACTICES
Digital marketing Retail Analytics on
car parc Predictive forecast
“OVERLAY UNIT” COVERING THE WHOLE VALUE CHAIN, INTERFACING WITH KEY FUNCTIONS AND REGIONS…
Cyber Tyre
APAC
NAFTA EUROPE
CAGR 16A-20E Market Volumes
CAGR 16A-20E Pirelli Volumes
pcs
2020E 2016A
10%
PRESTIGE (O.E. + REPLACEMENT)
+6%
Prestige
PRESTIGE CORE TEAM LEVERAGING ON FUNCTIONAL
PROJECTS & LOCAL SKILLS TO REACH TARGETS_
134

COMPANY PRESENTATION – SEPTEMBER 2018
Moto and Velo
businesses w ill leverage
the best practices of Car
Supply Chain
MAIN FOCUS KPI
IMPACTS ON
Improve customer retention through B2C
▬ Customize to order ▬ # end-users activations
Improve on-shelf daily availability
▬ Mix coverage ▬ FCST predictivity
Improve CAR makers forecast through predictive forecasting tools
▬ On time delivery
▬ FCST predictivity
Improve demand predictability
▬ % on sales 18’’ and up
▬ Fill rate
improve unpredictable demand forecasting through predictive forecasting tools
▬ Cost to serve
▬ Improve FCST accuracy E
D
C
B
A Specialties
Prestige
O.E.
Tier 1
Repl.
Ne
w p
red
icti
ve
fore
ca
stin
g t
oo
l
Supply Chain
FIVE SUPPLY CHAINS SUPPORTING SPECIFIC
BUSINESS AREAS_
135

COMPANY PRESENTATION – SEPTEMBER 2018 136

COMPANY PRESENTATION – SEPTEMBER 2018
1. 1H’18 FINANCIAL RESULTS
2. FY 2017 FINANCIAL RESULTS
AGENDA
3c. MARKET AND COMPETITION
3d. HIGH VALUE STRATEGY: LEVERS AND REGIONAL DEPLOYMENT
3e. HIGH VALUE STRATEGY: START-UPS
3f. TRANSFORMATION PROGRAMS
3g. STANDARD PROGRAMS
3h. TARGETS 2020
3. STRATEGY AND PLAN 2017-2020
4. GOVERNANCE
3a. PIRELLI AT A GLANCE
3b. KEY INVESTMENT HIGHLIGHTS
5. SUSTAINABILITY
6. APPENDIX
137
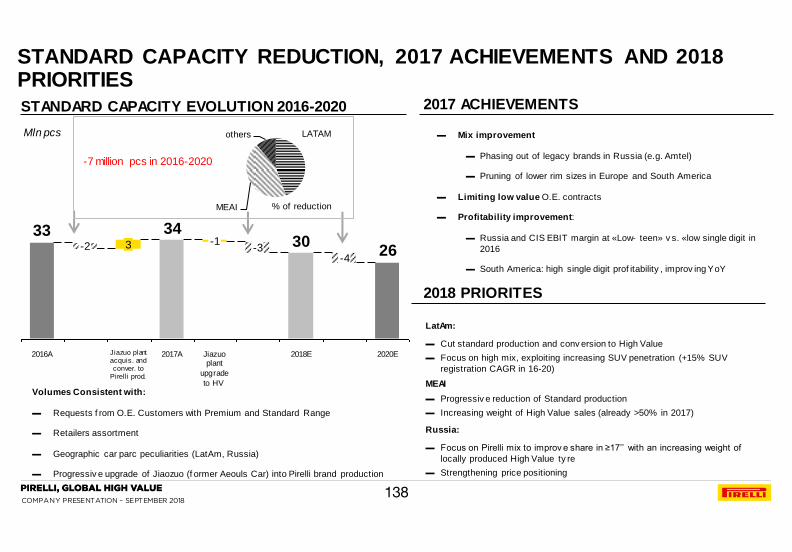
COMPANY PRESENTATION – SEPTEMBER 2018
STANDARD CAPACITY REDUCTION, 2017 ACHIEVEMENTS AND 2018 PRIORITIES
Volumes Consistent with:
▬ Requests f rom O.E. Customers with Premium and Standard Range
▬ Retailers assortment
▬ Geographic car parc peculiarities (LatAm, Russia)
▬ Progressiv e upgrade of Jiaozuo (f ormer Aeouls Car) into Pirelli brand production
Mln pcs
2630
3433
2020E
-4
2017A Jiazuo plant acquis. and conver. to
Pirelli prod.
3 -2
2016A Jiazuo plant
upgrade
to HV
-1
2018E
-3
STANDARD CAPACITY EVOLUTION 2016-2020 2017 ACHIEVEMENTS
2018 PRIORITES
▬ Mix improvement
▬ Phasing out of legacy brands in Russia (e.g. Amtel)
▬ Pruning of lower rim sizes in Europe and South America
▬ Limiting low value O.E. contracts
▬ Profitability improvement:
▬ Russia and CIS EBIT margin at «Low- teen» v s. «low single digit in
2016
▬ South America: high single digit prof itability , improv ing YoY
% of reduction
LatAm:
▬ Cut standard production and conv ersion to High Value
▬ Focus on high mix, exploiting increasing SUV penetration (+15% SUV
registration CAGR in 16-20)
MEAI
▬ Progressiv e reduction of Standard production
▬ Increasing weight of High Value sales (already >50% in 2017)
Russia:
▬ Focus on Pirelli mix to improv e share in ≥17’’ with an increasing weight of
locally produced High Value ty re
▬ Strengthening price positioning
LATAM
MEAI
others
-7 million pcs in 2016-2020
138

COMPANY PRESENTATION – SEPTEMBER 2018
PRODUCT TRADE CONSUMER
▬ Premium grow ing at a moderate
pace
▬ European OEM investments still
on going (Audi, Land Rover)
▬ Migration from Mono-brand to
Multi-brand retail
▬ Digital becomes more important
TOT O.E. + REPL. TYRE MARKET (million pieces)
+0.4% 70 70 77
2020E 2016A 2014A
+2.3%
-1.0% +2.8%
2%
2014A
86
94% 4%
2%
+10
-2
2020E
94
89%
8% 3%
2016A
85
92%
6%
TOTAL CAR PARC (million vehicles)
1.6% % Prestige & Premium
(o/w 50% in Brazil) 1.9% 1.6% 1.6%
+13.0% +10.0%
+11.5% +12.4%
-1.9% +1.9%
=17’’
≤16’’
≥18’’
CAGR ’14A-’16A
CAGR ’16A-’20E
CAGR ’14A-’16A
CAGR ’16A-’20E
REGION DEPLOYMENT LATAM_
Note: 2014A, 2016A, 2020E data based on IPO plan
139
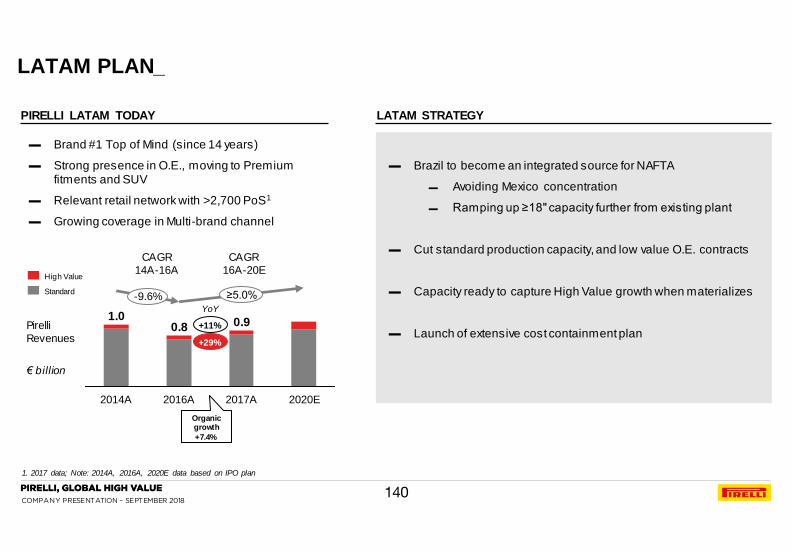
COMPANY PRESENTATION – SEPTEMBER 2018
PIRELLI LATAM TODAY LATAM STRATEGY
▬ Brand #1 Top of Mind (since 14 years)
▬ Strong presence in O.E., moving to Premium fitments and SUV
▬ Relevant retail network with >2,700 PoS1
▬ Growing coverage in Multi-brand channel
▬ Brazil to become an integrated source for NAFTA
▬ Avoiding Mexico concentration
▬ Ramping up ≥18" capacity further from existing plant
▬ Cut standard production capacity, and low value O.E. contracts
▬ Capacity ready to capture High Value growth when materializes
▬ Launch of extensive cost containment plan Pirelli
Revenues
€ billion
0.9
2017A
1.0
2014A
0.8
2016A 2020E
-9.6% ≥5.0%
CAGR
14A-16A
CAGR
16A-20E High Value
Standard
LATAM PLAN_
1. 2017 data; Note: 2014A, 2016A, 2020E data based on IPO plan
+11%
+29%
YoY
Organic growth
+7.4%
140
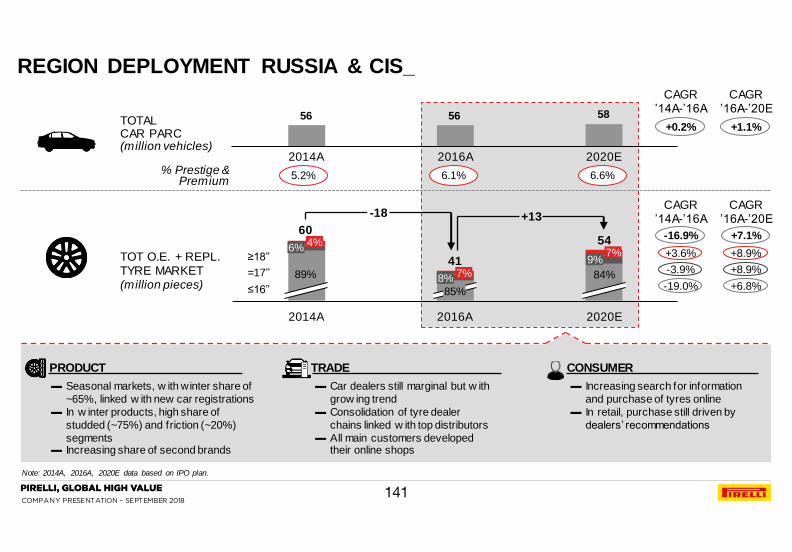
COMPANY PRESENTATION – SEPTEMBER 2018
PRODUCT TRADE CONSUMER
▬ Seasonal markets, w ith winter share of
~65%, linked w ith new car registrations
▬ In w inter products, high share of
studded (~75%) and friction (~20%)
segments ▬ Increasing share of second brands
▬ Car dealers still marginal but w ith
grow ing trend
▬ Consolidation of tyre dealer
chains linked w ith top distributors
▬ All main customers developed their online shops
▬ Increasing search for information
and purchase of tyres online
▬ In retail, purchase still driven by
dealers’ recommendations
TOT O.E. + REPL. TYRE MARKET (million pieces)
+0.2% 56 56 58
2020E 2014A 2016A
+1.1%
-16.9% +7.1%
89%
6%
60 4%
2014A
85%
8%
41
54
7%
+13
2020E
9%
84%
2016A
7%
-18
TOTAL CAR PARC (million vehicles)
1.6% % Prestige &
Premium 6.6% 5.2% 6.1%
+3.6% +8.9%
-3.9% +8.9%
-19.0% +6.8%
=17’’
≤16’’
≥18’’
CAGR ’14A-’16A
CAGR ’16A-’20E
CAGR ’14A-’16A
CAGR ’16A-’20E
REGION DEPLOYMENT RUSSIA & CIS_
Note: 2014A, 2016A, 2020E data based on IPO plan.
141

COMPANY PRESENTATION – SEPTEMBER 2018
▬ Improving mix:
▬ Phasing out of legacy brands
▬ Focus on Pirelli high mix to improve share in ≥17”
▬ Winter range extension
▬ Strengthening price positioning
▬ Export flexibility: correct balance between local / export sales
according to FX trend
▬ Extend network focusing on strategic locations and partnership
with Rosneft
▬ Co-marketing with Prestige / Car Dealers
▬ Recognized as Premium / Sport brand fitted on high-end cars
▬ Winter image improvement through Ice Hockey
World Championship sponsorship
▬ 2 local production plants
▬ >800 PoS, with qualified Marketing support1
▬ Partnership in distribution
PIRELLI TODAY RUSSIA STRATEGY
Pirelli
Revenues
€ billion
0.16
≥6.5%
0.16
2020E 2016A
-13.9%
2014A
0.22
2017A
High Value
Standard
CAGR 14A-16A
CAGR 16A-20E
RUSSIA & CIS PLAN_
1. 2017 data ; Note: 2014A, 2016A, 2020E data based on IPO plan
-2%
-4%
YoY
Organic growth -14.6% due to phase out of legacy brands
142

COMPANY PRESENTATION – SEPTEMBER 2018
1. 1H’18 FINANCIAL RESULTS
2. FY 2017 FINANCIAL RESULTS
AGENDA
3c. MARKET AND COMPETITION
3d. HIGH VALUE STRATEGY: LEVERS AND REGIONAL DEPLOYMENT
3e. HIGH VALUE STRATEGY: START-UPS
3f. TRANSFORMATION PROGRAMS
3g. STANDARD PROGRAMS
3h. TARGETS 2020
3. STRATEGY AND PLAN 2017-2020
4. GOVERNANCE
3a. PIRELLI AT A GLANCE
3b. KEY INVESTMENT HIGHLIGHTS
5. SUSTAINABILITY
6. APPENDIX
143

COMPANY PRESENTATION – SEPTEMBER 2018
€ million
Revenues
High Value weight on Revenues
Adjusted EBIT margin2,3
High Value weight on EBIT
Adjusted EBITDA margin1 21.7% ~ 23% ÷ ~ 24%
ROI4
Net financial position/ Adjusted EBITDA
CapEx on Revenues
TARGETS_
1 EBITDA margin adjusted excluding non recurring, one-off and extraordinary items; 2 EBIT margin adjusted excluding PPA amortization, non recurring, one-off and extraordinary items; 3 Margin to be impacted by start-up costs up to 1% in 2017 and 2018; 4 ROI calculated as EBIT Adjusted / average Net Invested Capital w/o financial assets and intangibles from PPA
144
4,976 ≥ 9% CAGR 16-20
55% ~63%
17.0%
81% ~ 85%
~ 18.5% ÷ ~ 19.5%
27% ~ 35%
4.6X < 2.0X
~ 7.0%
on average ’17-20 ~ 6.8%
2016A 2020E
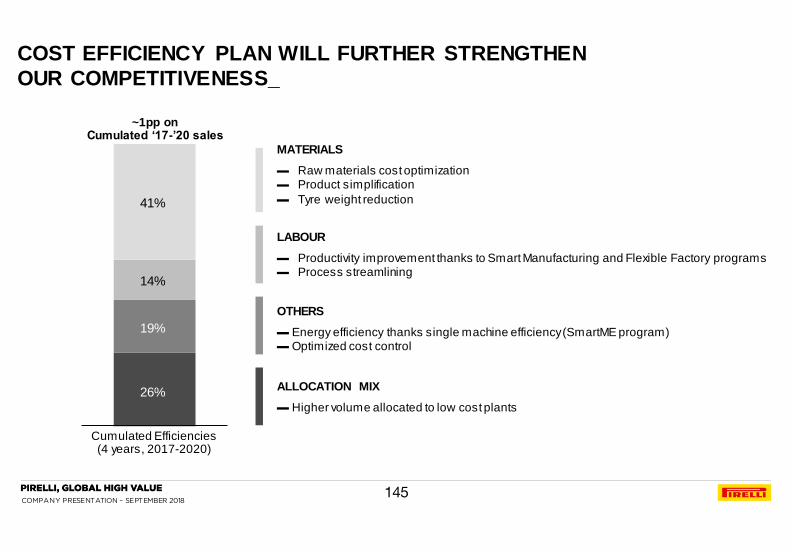
COMPANY PRESENTATION – SEPTEMBER 2018
MATERIALS
▬ Raw materials cost optimization ▬ Product simplification
▬ Tyre weight reduction
LABOUR
▬ Productivity improvement thanks to Smart Manufacturing and Flexible Factory programs ▬ Process streamlining
OTHERS
▬ Energy efficiency thanks single machine efficiency (SmartME program) ▬ Optimized cost control
ALLOCATION MIX
▬ Higher volume allocated to low cost plants
41%
14%
19%
26%
Cumulated Efficiencies (4 years, 2017-2020)
~1pp on Cumulated ‘17-’20 sales
COST EFFICIENCY PLAN WILL FURTHER STRENGTHEN
OUR COMPETITIVENESS_
145
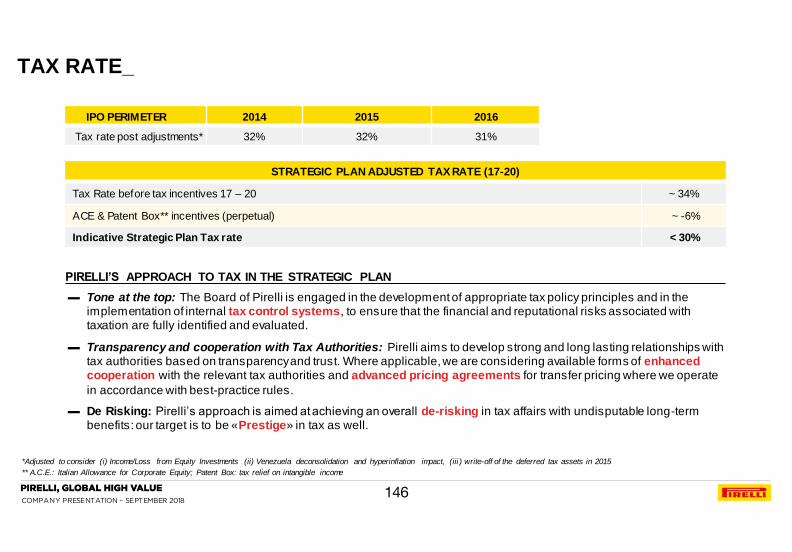
COMPANY PRESENTATION – SEPTEMBER 2018
STRATEGIC PLAN ADJUSTED TAX RATE (17-20)
Tax Rate before tax incentives 17 – 20 ~ 34%
ACE & Patent Box** incentives (perpetual) ~ -6%
Indicative Strategic Plan Tax rate < 30%
IPO PERIMETER 2014 2015 2016
Tax rate post adjustments* 32% 32% 31%
▬ Tone at the top: The Board of Pirelli is engaged in the development of appropriate tax policy principles and in the implementation of internal tax control systems, to ensure that the financial and reputational risks associated with taxation are fully identified and evaluated.
▬ Transparency and cooperation with Tax Authorities: Pirelli aims to develop strong and long lasting relationships with tax authorities based on transparency and trust. Where applicable, we are considering available forms of enhanced cooperation with the relevant tax authorities and advanced pricing agreements for transfer pricing where we operate
in accordance with best-practice rules.
▬ De Risking: Pirelli’s approach is aimed at achieving an overall de-risking in tax affairs with undisputable long-term benefits: our target is to be «Prestige» in tax as well.
PIRELLI’S APPROACH TO TAX IN THE STRATEGIC PLAN
TAX RATE_
*Adjusted to consider (i) Income/Loss from Equity Investments (ii) Venezuela deconsolidation and hyperinflation impact, (iii ) write-off of the deferred tax assets in 2015
** A.C.E.: Italian Allowance for Corporate Equity; Patent Box: tax relief on intangible income
146
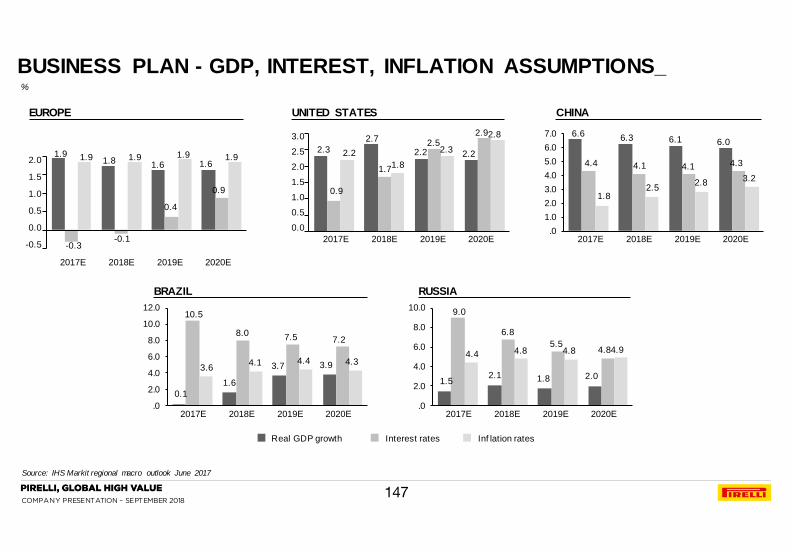
COMPANY PRESENTATION – SEPTEMBER 2018
%
UNITED STATES EUROPE
BRAZIL
CHINA
.0
2.0
4.0
6.0
8.0
10.0
2020E
4.9 4.8
2.0
2019E
4.8 5.5
1.8
2018E
4.8
6.8
2.1
2017E
4.4
9.0
1.5
Inf lation rates Interest rates Real GDP growth
.0
1.0
2.0
3.0
4.0
5.0
6.0
7.0
2020E
3.2
4.3
6.0
2019E
2.8
4.1
6.1
2018E
2.5
4.1
6.3
2017E
1.8
4.4
6.6 3.0
2.5
2.0
1.5
1.0
0.5
0.0
2020E
2.8 2.9
2.2
2019E
2.3 2.5
2.2
2018E
1.8 1.7
2.7
2017E
2.2
0.9
2.3 2.0
1.5
1.0
0.5
0.0
-0.5
2020E
1.9
0.9
1.6
2019E
1.9
0.4
1.6
2018E
1.9
-0.1
1.8
2017E
1.9
-0.3
1.9
.0
2.0
4.0
6.0
8.0
10.0
12.0
2020E
4.3
7.2
3.9
2019E
4.4
7.5
3.7
2018E
4.1
8.0
1.6
2017E
3.6
10.5
0.1
RUSSIA
BUSINESS PLAN - GDP, INTEREST, INFLATION ASSUMPTIONS_
Source: IHS Markit regional macro outlook June 2017
147

COMPANY PRESENTATION – SEPTEMBER 2018
2017E 2018E 2019E 2020E
EUR/USD 1.084 1.050 1.100 1.150
USD/CNY 6.891 7.300 7.400 7.400
USD/BRL 3.180 3.550 3.650 3.750
EUR/RUB 62.054 64.050 70.400 73.600
2017E 2018E 2019E 2020E
Natural rubber
($US/metric ton) 1,912 2,200 2,500 2,800
Butadiene
(€/metric ton) 1,547 1,800 2,000 2,100
Brent
($US/barrel) 58.00 61.46 64.51 67.16
FOREX
RAW MATERIALS
BUSINESS PLAN – FOREX AND RAW MATERIAL ASSUMPTIONS_
Source: FOREX Consensun March 2017, Oil: Reuters monthly-April 2017; Natural rubber: management assumption based on external studies
148
COMPANY PRESENTATION – SEPTEMBER 2018
1. 1H’18 FINANCIAL RESULTS
2. FY 2017 FINANCIAL RESULTS
AGENDA
3c. MARKET AND COMPETITION
3d. HIGH VALUE STRATEGY: LEVERS AND REGIONAL DEPLOYMENT
3e. HIGH VALUE STRATEGY: START-UPS
3f. TRANSFORMATION PROGRAMS
3g. STANDARD PROGRAMS
3h. TARGETS 2020
3. STRATEGY AND PLAN 2017-2020
4. GOVERNANCE
3a. PIRELLI AT A GLANCE
3b. KEY INVESTMENT HIGHLIGHTS
5. SUSTAINABILITY
6. APPENDIX
149
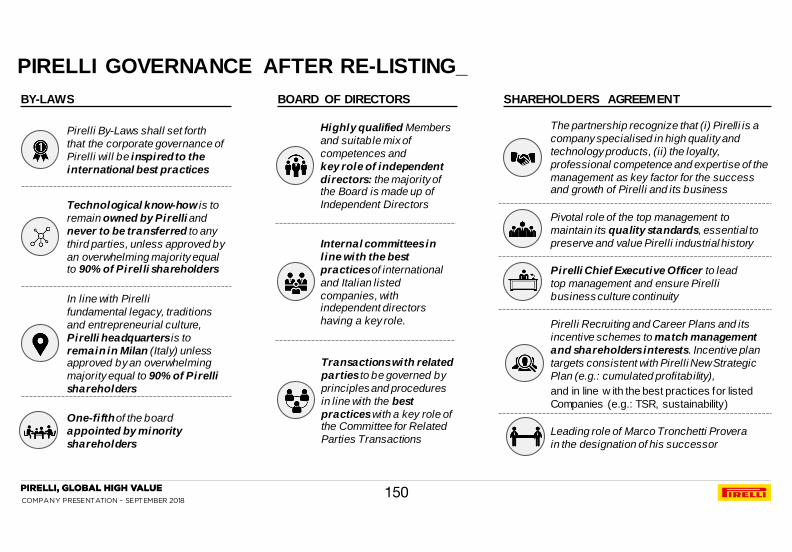
COMPANY PRESENTATION – SEPTEMBER 2018
PIRELLI GOVERNANCE AFTER RE-LISTING_
Technological know-how is to
remain owned by Pirelli and
never to be transferred to any
third parties, unless approved by
an overwhelming majority equal to 90% of Pirelli shareholders
In line with Pirelli
fundamental legacy, traditions
and entrepreneurial culture,
Pirelli headquarters is to
remain in Milan (Italy) unless approved by an overwhelming
majority equal to 90% of Pirelli
shareholders
Pirelli By-Laws shall set forth
that the corporate governance of
Pirelli will be inspired to the
international best practices
One-fifth of the board
appointed by minority
shareholders
BY-LAWS BOARD OF DIRECTORS SHAREHOLDERS AGREEMENT
Internal committees in
l ine with the best
practices of international
and Italian listed
companies, with independent directors
having a key role.
Highly qualified Members
and suitable mix of
competences and
key role of independent
directors: the majority of the Board is made up of
Independent Directors
Transactions with related
parties to be governed by
principles and procedures
in line with the best
practices with a key role of the Committee for Related
Parties Transactions
The partnership recognize that (i) Pirelli is a
company specialised in high quality and
technology products, (ii) the loyalty,
professional competence and expertise of the
management as key factor for the success and growth of Pirelli and its business
Pivotal role of the top management to
maintain its quality standards, essential to
preserve and value Pirelli industrial history
Pirelli Chief Executive Officer to lead
top management and ensure Pirelli
business culture continuity
Pirelli Recruiting and Career Plans and its
incentive schemes to match management
and shareholders interests. Incentive plan
targets consistent with Pirelli New Strategic
Plan (e.g.: cumulated profitability),
and in line w ith the best practices for listed
Companies (e.g.: TSR, sustainability)
Leading role of Marco Tronchetti Provera
in the designation of his successor
150
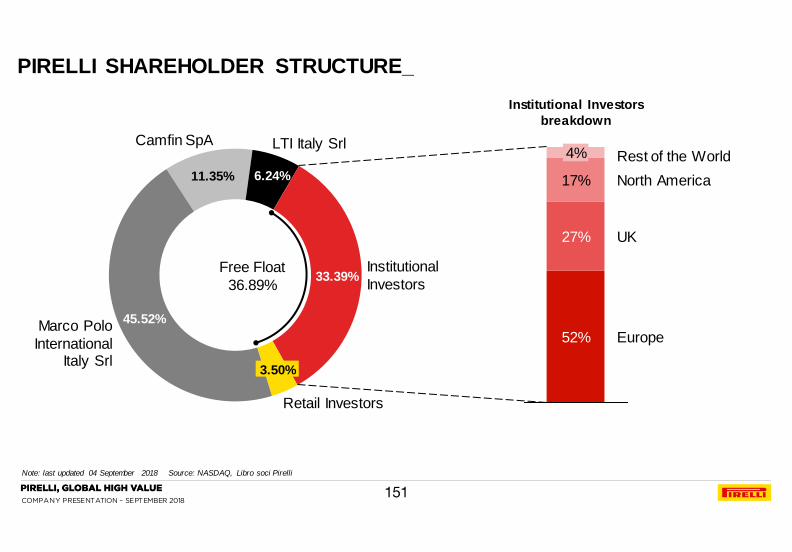
COMPANY PRESENTATION – SEPTEMBER 2018
PIRELLI SHAREHOLDER STRUCTURE_
Note: last updated 04 September 2018 Source: NASDAQ, Libro soci Pirelli
11.35% 6.24%
33.39%
45.52%
3.50%
Camfin SpA
Marco Polo
International Italy Srl
Retail Investors
LTI Italy Srl
Institutional
Investors Free Float
36.89%
Europe
UK
North America
Rest of the World
52%
27%
17%
4%
151
Institutional Investors
breakdown

COMPANY PRESENTATION – SEPTEMBER 2018
Pirelli remuneration system is governed by a specific Policy to
be approved by the Shareholders' meeting (May 15, 2018)
Guidelines on compensation mix for senior Management:
• fixed component: no more than 60% of Total Annual Direct Compensation at
target
• annual MBO: no less than 20% of the fixed component at target level
• medium-long term variable compensation: at least 60% of the total variable
compensation at target level
• all variable components are capped
No golden parachutes
No severance agreements
>
Clawback clauses in both MBO and LTI plans
>
>
>
>
> Non-compete agreement
Four-years Retention Plan: to guarantee the continuity of
management (also after the CEO Office’s expiration)
REMUNERATION SYSTEM_
152
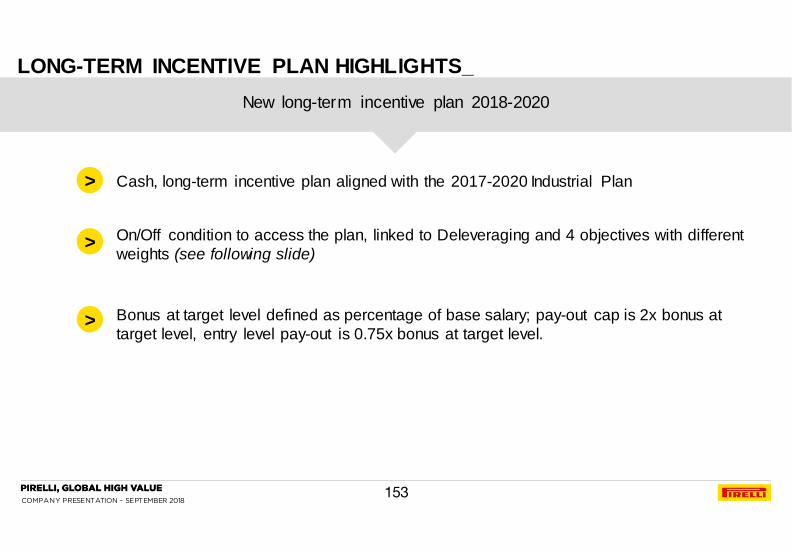
COMPANY PRESENTATION – SEPTEMBER 2018
New long-term incentive plan 2018-2020
Cash, long-term incentive plan aligned with the 2017-2020 Industrial Plan
On/Off condition to access the plan, linked to Deleveraging and 4 objectives with different
weights (see following slide)
Bonus at target level defined as percentage of base salary; pay-out cap is 2x bonus at
target level, entry level pay-out is 0.75x bonus at target level.
>
>
>
LONG-TERM INCENTIVE PLAN HIGHLIGHTS_
153
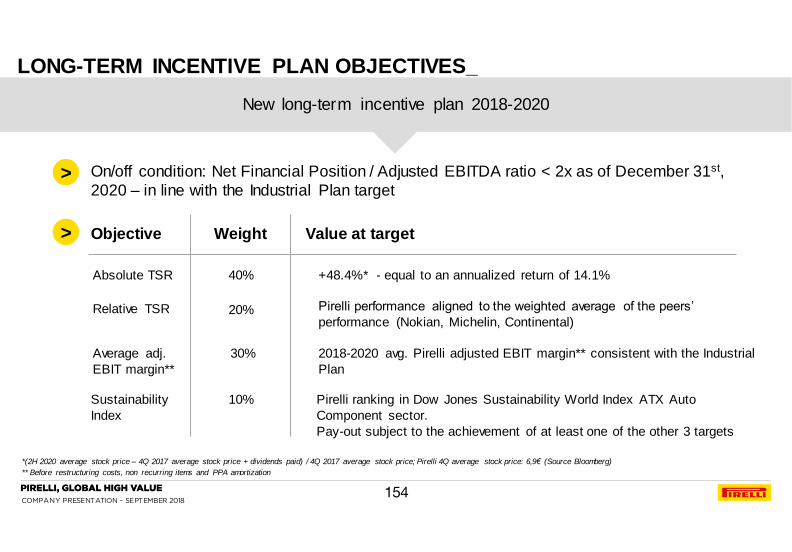
COMPANY PRESENTATION – SEPTEMBER 2018
New long-term incentive plan 2018-2020
On/off condition: Net Financial Position / Adjusted EBITDA ratio < 2x as of December 31st,
2020 – in line with the Industrial Plan target
Objective Weight Value at target
Average adj.
EBIT margin**
30% 2018-2020 avg. Pirelli adjusted EBIT margin** consistent with the Industrial
Plan
Sustainability
Index
10% Pirelli ranking in Dow Jones Sustainability World Index ATX Auto
Component sector.
Pay-out subject to the achievement of at least one of the other 3 targets
Relative TSR 20% Pirelli performance aligned to the weighted average of the peers’
performance (Nokian, Michelin, Continental)
40% +48.4%* - equal to an annualized return of 14.1% Absolute TSR
>
>
LONG-TERM INCENTIVE PLAN OBJECTIVES_
*(2H 2020 average stock price – 4Q 2017 average stock price + dividends paid) / 4Q 2017 average stock price; Pirelli 4Q average stock price: 6,9€ (Source Bloomberg)
** Before restructuring costs, non recurring items and PPA amortization
154

COMPANY PRESENTATION – SEPTEMBER 2018
1. 1H’18 FINANCIAL RESULTS
2. FY 2017 FINANCIAL RESULTS
AGENDA
3c. MARKET AND COMPETITION
3d. HIGH VALUE STRATEGY: LEVERS AND REGIONAL DEPLOYMENT
3e. HIGH VALUE STRATEGY: START-UPS
3f. TRANSFORMATION PROGRAMS
3g. STANDARD PROGRAMS
3h. TARGETS 2020
3. STRATEGY AND PLAN 2017-2020
4. GOVERNANCE
3a. PIRELLI AT A GLANCE
3b. KEY INVESTMENT HIGHLIGHTS
5. SUSTAINABILITY
6. APPENDIX
155
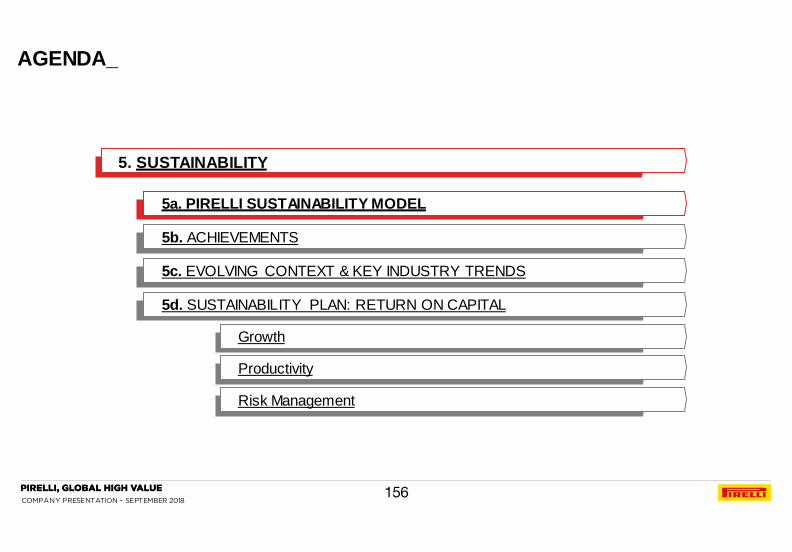
COMPANY PRESENTATION – SEPTEMBER 2018
5a. PIRELLI SUSTAINABILITY MODEL
5b. ACHIEVEMENTS
5c. EVOLVING CONTEXT & KEY INDUSTRY TRENDS
5d. SUSTAINABILITY PLAN: RETURN ON CAPITAL
5. SUSTAINABILITY
Growth
Productivity
Risk Management
AGENDA_
156
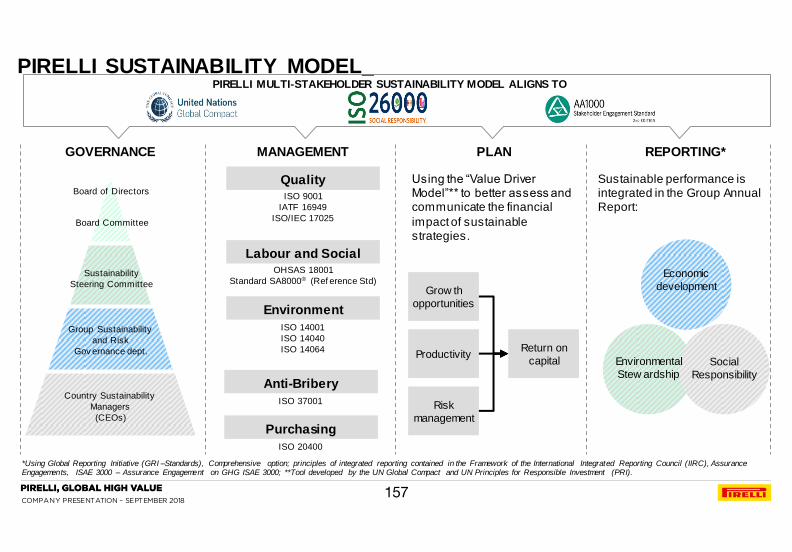
COMPANY PRESENTATION – SEPTEMBER 2018
GOVERNANCE MANAGEMENT
SYSTEMS
PLAN REPORTING*
Using the “Value Driver Model”** to better assess and communicate the financial
impact of sustainable strategies.
Quality ISO 9001
IATF 16949
ISO/IEC 17025
Environment
ISO 14001
ISO 14040
ISO 14064
Labour and Social OHSAS 18001
Standard SA8000® (Ref erence Std)
Group Sustainability
and Risk
Gov ernance dept.
Country Sustainability
Managers
(CEOs)
Economic
development
Environmental
Stew ardship Social
Responsibility
PIRELLI MULTI-STAKEHOLDER SUSTAINABILITY MODEL ALIGNS TO
Sustainable performance is integrated in the Group Annual Report:
Grow th
opportunities
Productivity
Risk
management
Return on
capital
Board Committee
Sustainability
Steering Committee
Board of Directors
ISO 37001
Purchasing
Anti-Bribery
ISO 20400
PIRELLI SUSTAINABILITY MODEL_
*Using Global Reporting Initiative (GRI –Standards), Comprehensive option; principles of integrated reporting contained in the Framework of the International Integrated Reporting Council (IIRC), Assurance Engagements, ISAE 3000 – Assurance Engagement on GHG ISAE 3000; **Tool developed by the UN Global Compact and UN Principles for Responsible Investment (PRI).
157
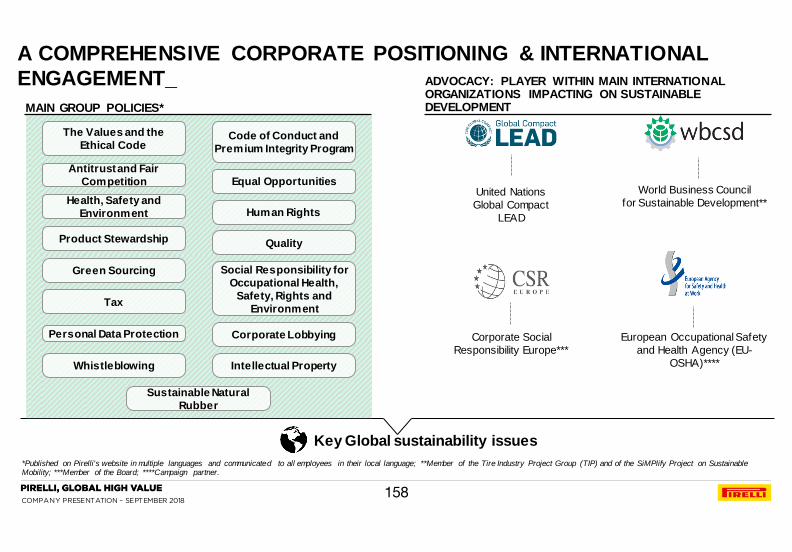
COMPANY PRESENTATION – SEPTEMBER 2018
MAIN GROUP POLICIES*
Equal Opportunities
The Values and the
Ethical Code
Tax
Code of Conduct and
Premium Integrity Program
Antitrust and Fair
Competition
Social Responsibility for
Occupational Health,
Safety, Rights and
Environment
Health, Safety and
Environment Human Rights
Product Stewardship
Corporate Lobbying
Green Sourcing
Personal Data Protection
Intellectual Property
Quality
Whistleblowing
European Occupational Safety
and Health Agency (EU-
OSHA)****
ADVOCACY: PLAYER WITHIN MAIN INTERNATIONAL ORGANIZATIONS IMPACTING ON SUSTAINABLE DEVELOPMENT
United Nations
Global Compact
LEAD
Corporate Social
Responsibility Europe***
World Business Council
for Sustainable Development**
Key Global sustainability issues
Sustainable Natural
Rubber
A COMPREHENSIVE CORPORATE POSITIONING & INTERNATIONAL
ENGAGEMENT_
*Published on Pirelli's website in multiple languages and communicated to all employees in their local language; **Member of the Tire Industry Project Group (TIP) and of the SiMPlify Project on Sustainable Mobility; ***Member of the Board; ****Campaign partner.
158
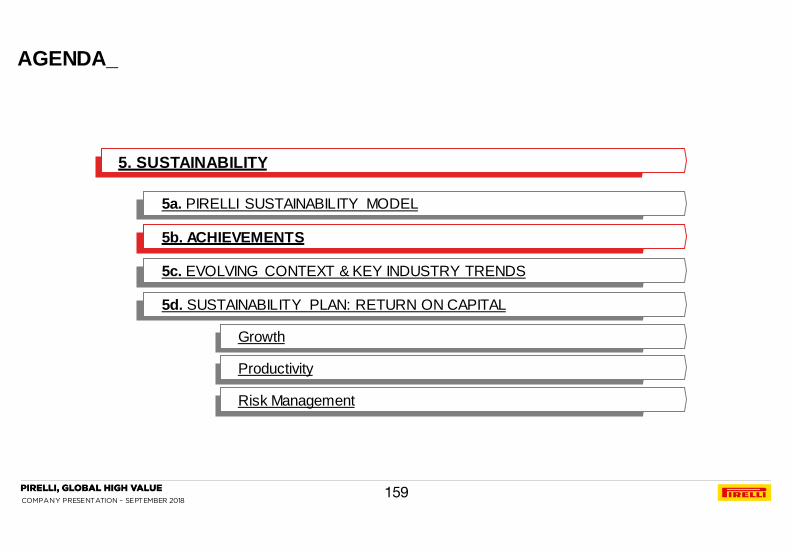
COMPANY PRESENTATION – SEPTEMBER 2018
5a. PIRELLI SUSTAINABILITY MODEL
5b. ACHIEVEMENTS
5c. EVOLVING CONTEXT & KEY INDUSTRY TRENDS
5d. SUSTAINABILITY PLAN: RETURN ON CAPITAL
5. SUSTAINABILITY
Growth
Productivity
Risk Management
AGENDA_
159
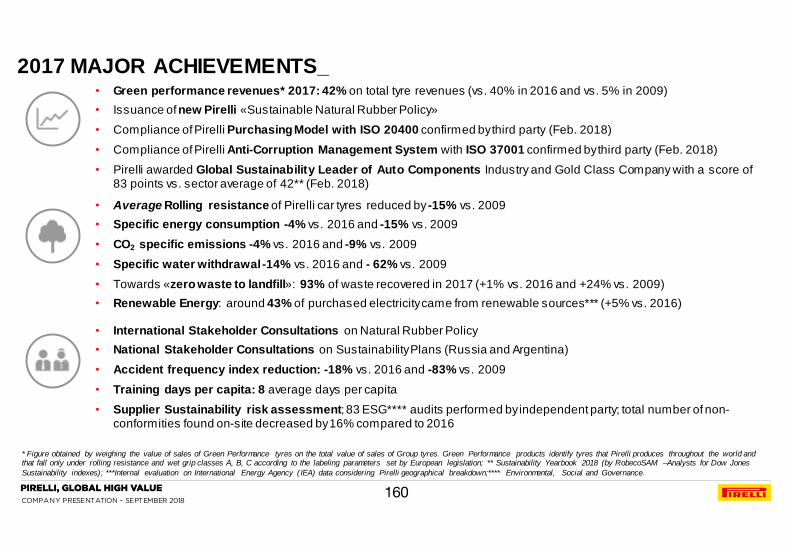
COMPANY PRESENTATION – SEPTEMBER 2018
• Green performance revenues* 2017: 42% on total tyre revenues (vs. 40% in 2016 and vs. 5% in 2009)
• Issuance of new Pirelli «Sustainable Natural Rubber Policy»
• Compliance of Pirelli Purchasing Model with ISO 20400 confirmed by third party (Feb. 2018)
• Compliance of Pirelli Anti-Corruption Management System with ISO 37001 confirmed by third party (Feb. 2018)
• Pirelli awarded Global Sustainability Leader of Auto Components Industry and Gold Class Company with a score of 83 points vs. sector average of 42** (Feb. 2018)
• Average Rolling resistance of Pirelli car tyres reduced by -15% vs. 2009
• Specific energy consumption -4% vs. 2016 and -15% vs. 2009
• CO2 specific emissions -4% vs. 2016 and -9% vs. 2009
• Specific water withdrawal -14% vs. 2016 and - 62% vs. 2009
• Towards «zero waste to landfill»: 93% of waste recovered in 2017 (+1% vs. 2016 and +24% vs. 2009)
• Renewable Energy: around 43% of purchased electricity came from renewable sources*** (+5% vs. 2016)
• International Stakeholder Consultations on Natural Rubber Policy
• National Stakeholder Consultations on Sustainability Plans (Russia and Argentina)
• Accident frequency index reduction: -18% vs. 2016 and -83% vs. 2009
• Training days per capita: 8 average days per capita
• Supplier Sustainability risk assessment; 83 ESG**** audits performed by independent party; total number of non-conformities found on-site decreased by 16% compared to 2016
2017 MAJOR ACHIEVEMENTS_
* Figure obtained by weighing the value of sales of Green Performance tyres on the total value of sales of Group tyres. Green Performance products identify tyres that Pirelli produces throughout the world and that fall only under rolling resistance and wet grip classes A, B, C according to the labeling parameters set by European legislation; ** Sustainability Yearbook 2018 (by RobecoSAM –Analysts for Dow Jones
Sustainability indexes); ***Internal evaluation on International Energy Agency ( IEA) data considering Pirelli geographical breakdown;**** Environmental, Social and Governance.
160

COMPANY PRESENTATION – SEPTEMBER 2018
5a. PIRELLI SUSTAINABILITY MODEL
5b. ACHIEVEMENTS
5c. EVOLVING CONTEXT & KEY INDUSTRY TRENDS
5d. SUSTAINABILITY PLAN: RETURN ON CAPITAL
5. SUSTAINABILITY
Growth
Productivity
Risk Management
AGENDA_
161

COMPANY PRESENTATION – SEPTEMBER 2018
SOCIO – DEMO
TRENDS Purchasing power growth Growing urbanization Digitalization
CAR EVOLUTION* • 10% of total sales in
2025 • 21% of Premium and
Prestige sales in 2025
• 12% of total car sales in 2025**
• 30% of Premium and
Prestige sales in 2025**
• 83% of total car sales in 2025
• 99% of Premium
& Prestige cars
• Only 1% of car sales but 5% of miles driven in
2025
Autonomous Connected Electric Shared
MOBILITY
EVOLUTION
Travel Urban life Transfer
• Car sharing will reduce cars on the streets
• Autonomous driving
will increase mobility demand including
elderly and impaired
• Thanks to autonomous driving capabilities, cars will
compete with trains and planes on long
distance trips
• Higher income and autonomous capabilities will
increase miles driven
Commuting
• Smart-working and multimodal transport will
reduce private car use for daily
commuting
EVOLVING CONTEXT & KEY INDUSTRY TRENDS_
*Research reports, Pirelli estimate; ** From level 3 (the driver can safely turn its attention away from the driving task but still be prepared to intervene) to level 5 (fully autonomous vehicle).
162

COMPANY PRESENTATION – SEPTEMBER 2018
AGENDA_
5a. PIRELLI SUSTAINABILITY MODEL
5b. ACHIEVEMENTS
5c. EVOLVING CONTEXT & KEY INDUSTRY TRENDS
5d. SUSTAINABILITY PLAN: RETURN ON CAPITAL
5. SUSTAINABILITY
Growth
Productivity
Risk Management
163

COMPANY PRESENTATION – SEPTEMBER 2018
The Plan 2020 with selected target 2025:
• was drafted and is presented according to Pirelli Value Driver Model, with a Return on Capital
approach
• integrates Group Industrial Plan and its High Value development strategy
• replaces previous 2013-2017 Sustainability Plan with selected targets 2020 (vs. 2009)
• maintains 2009 as base reference year to allow long-term numerical trends to be appreciated
• impacts on 12 UN SDGs (Sustainable Development Goals 2030) set forth by the United Nations:
following slides show which SDGs are related to the targets therein described
SUSTAINABILITY PLAN_
164

COMPANY PRESENTATION – SEPTEMBER 2018
GROWTH PRODUCTIVITY GOVERNANCE & RISK MANAGEMENT
▬ Long-term
Strategy ▬ Product
Innovation
▬ Operation Efficiency
▬ Human Capital Governance
▬ Corporate Governance,
Risk Management ▬ Supply Chain
RETURN ON CAPITAL
RETURN ON CAPITAL
Sustainability Plan Structure
REVENUE GROWTH COST SAVING &
AVOIDANCE
REVENUE AND REPUTATION RISK
REDUCTION; SUSTAINABILITY RISK
CONTAINMENT
RETURN ON CAPITAL: PIRELLI VALUE DRIVER MODEL*_
* Pirelli model is inspired to the Value Driver Framework of the UN-PRI (United Nations - Principles for Responsible Investment) and UN Global Compact, aimed at supporting dialogue between investors and operations on ESG themes
165
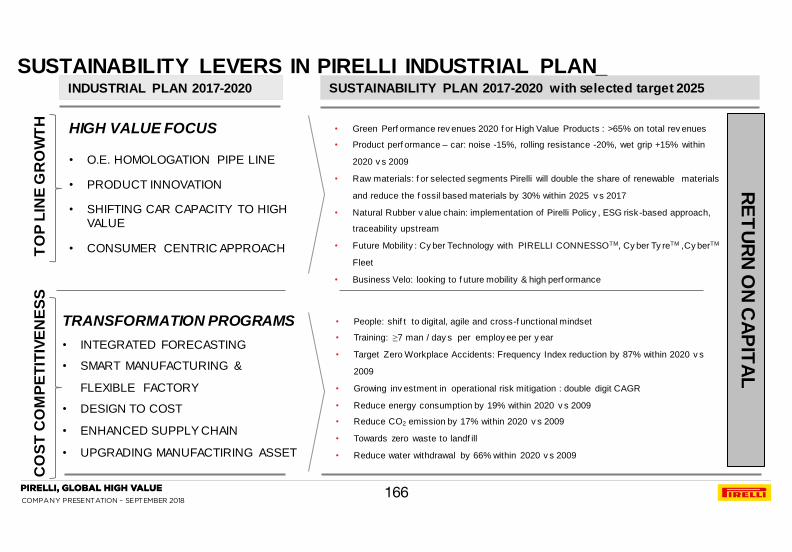
COMPANY PRESENTATION – SEPTEMBER 2018
INDUSTRIAL PLAN 2017-2020 SUSTAINABILITY PLAN 2017-2020 with selected target 2025
RE
TU
RN
ON
CA
PIT
AL
HIGH VALUE FOCUS
• O.E. HOMOLOGATION PIPE LINE
• CONSUMER CENTRIC APPROACH TO
P L
INE
GR
OW
TH
C
OS
T C
OM
PE
TIT
IVE
NE
SS
• SHIFTING CAR CAPACITY TO HIGH VALUE
TRANSFORMATION PROGRAMS
• INTEGRATED FORECASTING
• SMART MANUFACTURING &
FLEXIBLE FACTORY
• DESIGN TO COST
• ENHANCED SUPPLY CHAIN
• UPGRADING MANUFACTIRING ASSET
• Green Perf ormance rev enues 2020 f or High Value Products : >65% on total rev enues
• Product perf ormance – car: noise -15%, rolling resistance -20%, wet grip +15% within
2020 v s 2009
• Raw materials: f or selected segments Pirelli will double the share of renewable materials
and reduce the f ossil based materials by 30% within 2025 v s 2017
• Natural Rubber v alue chain: implementation of Pirelli Policy , ESG risk-based approach,
traceability upstream
• Future Mobility : Cy ber Technology with PIRELLI CONNESSOTM, Cy ber Ty reTM ,Cy berTM
Fleet
• Business Velo: looking to f uture mobility & high perf ormance
• People: shif t to digital, agile and cross-f unctional mindset
• Training: ≥7 man / day s per employ ee per y ear
• Target Zero Workplace Accidents: Frequency Index reduction by 87% within 2020 v s
2009
• Growing inv estment in operational risk mitigation : double digit CAGR
• Reduce energy consumption by 19% within 2020 v s 2009
• Reduce CO2 emission by 17% within 2020 v s 2009
• Towards zero waste to landf ill
• Reduce water withdrawal by 66% within 2020 v s 2009
• PRODUCT INNOVATION
SUSTAINABILITY LEVERS IN PIRELLI INDUSTRIAL PLAN_
166

COMPANY PRESENTATION – SEPTEMBER 2018
AGENDA_
5a. PIRELLI SUSTAINABILITY MODEL
5b. ACHIEVEMENTS
5c. EVOLVING CONTEXT & KEY INDUSTRY TRENDS
5d. SUSTAINABILITY PLAN: RETURN ON CAPITAL
5. SUSTAINABILITY
Growth
Productivity
Risk Management
167

COMPANY PRESENTATION – SEPTEMBER 2018
Pirelli Carbon & Water Life Cycle Assessment
3.5% 0.2% 0.1%
2.5% 2.4% 3.9%
10.9%
38.3%
46.8%
91.4%
Raw Materials Manufacturing Distribution Use End of Life
Global Warming Potential GWP
WD Water Depletion
GROWTH: ALIGNING STRATEGY TO FOOTPRINT_
168
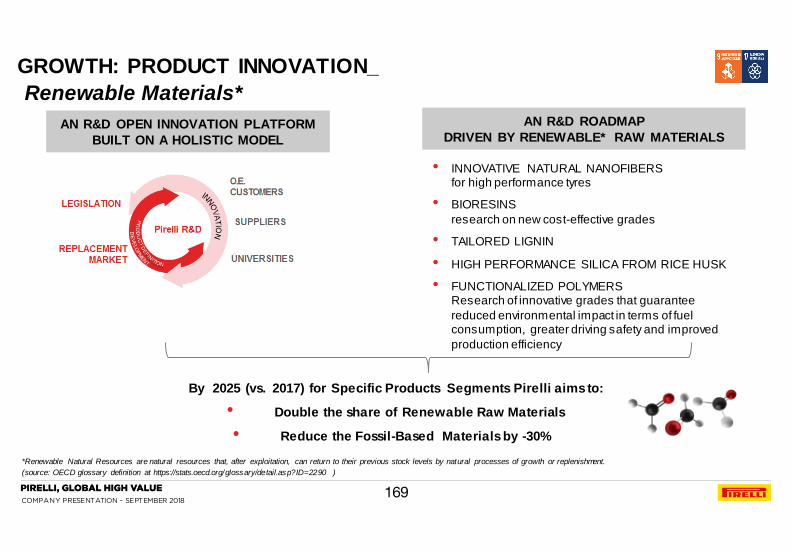
COMPANY PRESENTATION – SEPTEMBER 2018
AN R&D ROADMAP
DRIVEN BY RENEWABLE* RAW MATERIALS
• INNOVATIVE NATURAL NANOFIBERS for high performance tyres
• BIORESINS
research on new cost-effective grades
• TAILORED LIGNIN
• HIGH PERFORMANCE SILICA FROM RICE HUSK
• FUNCTIONALIZED POLYMERS Research of innovative grades that guarantee
reduced environmental impact in terms of fuel consumption, greater driving safety and improved
production efficiency
AN R&D OPEN INNOVATION PLATFORM
BUILT ON A HOLISTIC MODEL
Renewable Materials*
By 2025 (vs. 2017) for Specific Products Segments Pirelli aims to:
• Double the share of Renewable Raw Materials
• Reduce the Fossil-Based Materials by -30%
GROWTH: PRODUCT INNOVATION_
*Renewable Natural Resources are natural resources that, after exploitation, can return to their previous stock levels by natural processes of growth or replenishment.
(source: OECD glossary definition at https://stats.oecd.org/glossary/detail.asp?ID=2290 )
169
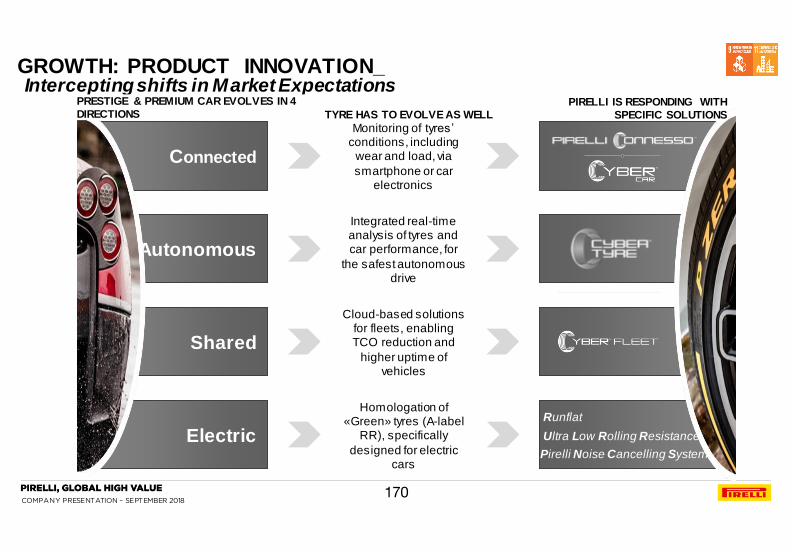
COMPANY PRESENTATION – SEPTEMBER 2018
Intercepting shifts in Market Expectations
Electric
Autonomous
Connected
Shared
Homologation of «Green» tyres (A-label
RR), specifically
designed for electric cars
Integrated real-time analysis of tyres and car performance, for
the safest autonomous drive
Cloud-based solutions for fleets, enabling TCO reduction and
higher uptime of vehicles
Monitoring of tyres’ conditions, including
wear and load, via
smartphone or car electronics
TYRE HAS TO EVOLVE AS WELL
Runflat
Ultra Low Rolling Resistance
Pirelli Noise Cancelling System
PIRELLI IS RESPONDING WITH
SPECIFIC SOLUTIONS
PRESTIGE & PREMIUM CAR EVOLVES IN 4
DIRECTIONS
GROWTH: PRODUCT INNOVATION_
170

COMPANY PRESENTATION – SEPTEMBER 2018
Less CO2 emissions
Better living environment
Increased tyre life
Less impact on natural resources
Less rolling resistance
Less noise
Increased mileage
Less weight
Car Moto Velo
**
GROWTH: TYRE DEVELOPMENT_
* Focus on HIGH VALUE products including RIM18+ and «specialties» (Run-Flat, PNCS, Seal Inside with rim ≤ 17); ** 2017: stating year of Velo Business.
171

COMPANY PRESENTATION – SEPTEMBER 2018
PRODUCTIVITY
GREEN PERFORMANCE
REVENUES*
TOTAL RANGE PRODUCTS
5
42 50
2009 2017 2020
+37
+8 >
• Figure calculated by applying the EU-label regulation to all tyre products sold WW
• Criteria to categorize the Green Performance products: Rolling Resistance and Wet Grip that falls ONLY in A, B, C classes
GREEN
PERFORMA
NCE
REVENUES
HIGH
VALUE
PRODUCTS*
*
14
52 65
2009 2017 2020
+38
+13 >
GROWTH: GREEN PERFORMANCE REVENUES_
* Figures calculated in % by weighing the value of sales of Green Performance Products on the total value of Group sales; ** Focus on HIGH VALUE products including RIM18+ and «specialties» (Run-Flat, PNCS, Seal Inside with rim ≤17”)
172

COMPANY PRESENTATION – SEPTEMBER 2018
AGENDA_
5a. PIRELLI SUSTAINABILITY MODEL
5b. ACHIEVEMENTS
5c. EVOLVING CONTEXT & KEY INDUSTRY TRENDS
5d. SUSTAINABILITY PLAN: RETURN ON CAPITAL
5. SUSTAINABILITY
Growth
Productivity
Risk Management
173
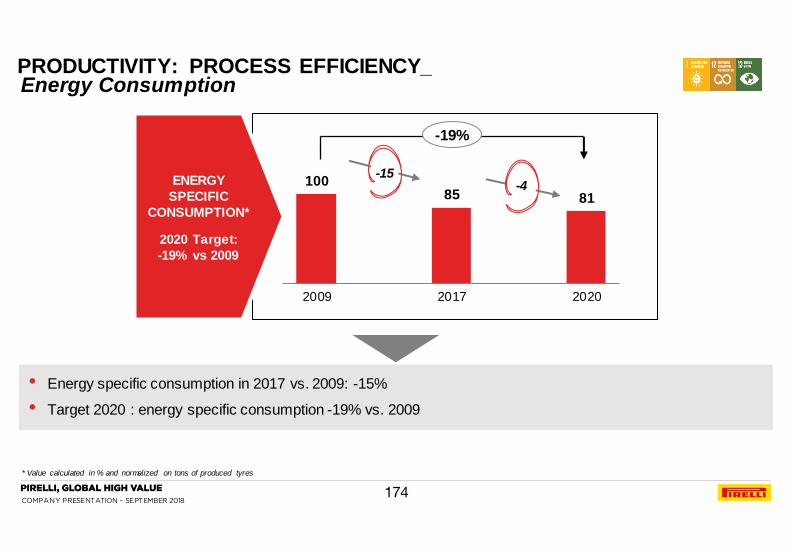
COMPANY PRESENTATION – SEPTEMBER 2018
PRODUCTIVITY
• Energy specific consumption in 2017 vs. 2009: -15%
• Target 2020 : energy specific consumption -19% vs. 2009
100 85 81
2009 2017 2020
-15 -4 ENERGY
SPECIFIC
CONSUMPTION*
2020 Target:
-19% vs 2009
-19%
Energy Consumption PRODUCTIVITY: PROCESS EFFICIENCY_
* Value calculated in % and normalized on tons of produced tyres
174

COMPANY PRESENTATION – SEPTEMBER 2018
100 91
83
2009 2017 2020
-9 -8 CO2 SPECIFIC
EMISSION*
2020 Target:
-17% vs 2009
-17%
• CO2 specific emissions in 2017 vs. 2009: -9%. Positive impacts from steam generated from biomass, and from
the use of renewable electrical energy;
• In 2017 around 43% of the electricity purchased by the Company came from renewable sources** (+5% vs.
2016);
• Target 2020: CO2 specific emissions -17% vs. 2009
CO2 Emissions & Renewables PRODUCTIVITY: PROCESS EFFICIENCY_
* Value calculated in % and normalized on tons of produced tyres; ** Internal evaluation based on Pirelli specific projects and International Energy Agency (IEA) data considering Pirelli geographical breakdown
175

COMPANY PRESENTATION – SEPTEMBER 2018
PRODUCTIVITY
100
38 34
2009 2017 2020
-62
-4
WATER
SPECIFIC
WITHDRAWAL*
2020 Target:
-66% vs 2009
-66%
• Water specific withdrawal in 2017 vs 2009: -62% (around 60 million cubic meters of water saved since 2009)
• Target 2020 : water specific withdrawal -66% vs 2009 (estimated 100 million cubic meters of water saved in the decade
2009-2020)
Water Withdrawal PRODUCTIVITY: PROCESS EFFICIENCY_
* Value calculated in % and normalized on tons of produced tyres
176
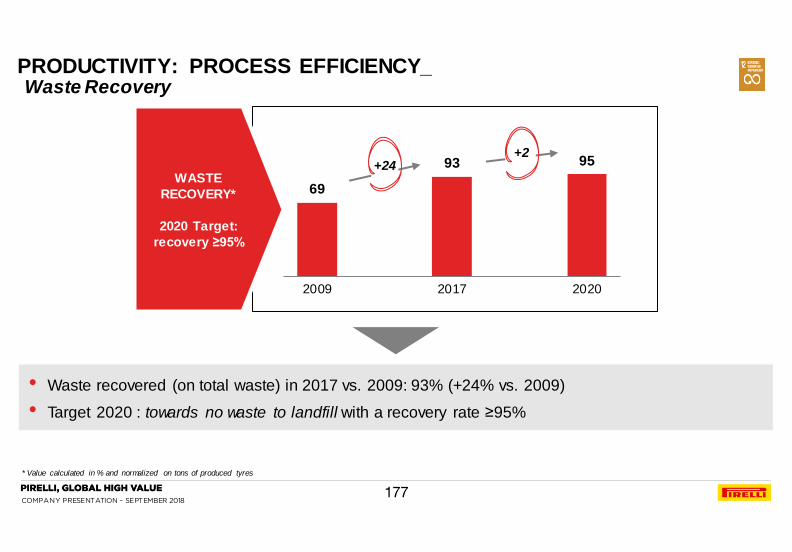
COMPANY PRESENTATION – SEPTEMBER 2018
69
93 95
2009 2017 2020
+24 +2
WASTE
RECOVERY*
2020 Target:
recovery ≥95%
• Waste recovered (on total waste) in 2017 vs. 2009: 93% (+24% vs. 2009)
• Target 2020 : towards no waste to landfill with a recovery rate ≥95%
Waste Recovery PRODUCTIVITY: PROCESS EFFICIENCY_
* Value calculated in % and normalized on tons of produced tyres
177

COMPANY PRESENTATION – SEPTEMBER 2018
A Digital, Agile, Cross-functional and Responsible Mind-set
supporting Pirelli long-term development
• Customer centric with focus
on products
• Trust and transparency
• Adaptiveness to respond to
changes and capture value
• Work horizontally
• Open collaboration
• Agile to stress customer
centric and iterative
approach
• Sharing information
• Single source of truth
• Technical excellence
practices
• Flexible technology stack
CULTURE & EDUCATION WAY OF WORKING DATA & TECHNOLOGY
Digital Transformation PRODUCTIVITY: HUMAN CAPITAL CULTURE_
178
COMPANY PRESENTATION – SEPTEMBER 2018
DIALOGUE & ENGAGEMENT
• As from 2018: introduction of new “Sustainable Engagement Index” to measure employees satisfaction
OCCUPATIONAL HEALTH & SAFETY
• Safety Culture focused on reaching «Zero Accident »
• Target 2020: reduction of accident frequency index (IF) by -87% vs. 2009 (2017 Performance : -83% vs 2009)
REMUNERATION
• ESG Targets integrated in management* annual and long-term incentives
DIVERSITY
• Historically, a multi-cultural” Company: 89.5% employees work outside Italy
• 53% of Senior Management experienced at least an assignment abroad during her/his career
• Women in the Board of Directors: 29%
• Women in management positions: 21.6%
WELFARE
Group Welfare Guidelines applied throughout the Group
• 4 pillars: lifestyle, support for families, working life and working environment, leisure time
TRAINING & DEVELOPMENT
• Average training days per capita/year ≥ 7
• 90% of employees involved in at least 1 training program/year
• Focus on developing skills and competences strategically supporting digital transformation
PRODUCTIVITY: HUMAN CAPITAL GOVERNANCE_
*Applied to the generality of Group top management and executives
179

COMPANY PRESENTATION – SEPTEMBER 2018
AGENDA_
5a. PIRELLI SUSTAINABILITY MODEL
5b. ACHIEVEMENTS
5c. EVOLVING CONTEXT & KEY INDUSTRY TRENDS
5d. SUSTAINABILITY PLAN: RETURN ON CAPITAL
5. SUSTAINABILITY
Growth
Productivity
Risk Management
180

COMPANY PRESENTATION – SEPTEMBER 2018
FOCUSING ON THE ORIGIN OF THE VALUE CHAIN
ESG assessment questionnaire Sustainability Clause
▬ >500 audits from 2009 to 2017
▬ checklist derived from SA8000®, sustainability
contractual obligations, local law
CONTRACTUAL STAGE ONSITE THIRD-PARTY AUDIT SELECTION +
QUALIFICATION/HOMOLOGATION ESG**
STEPS
ENGAGEMENT
• ESG** yearly training Campaign
• CDP*** Supply Chain 2020 target:
90% response rate of raw materials suppliers (2017 rate: 71%)
• Joint Development Agreements on
Innovative and Renewable Raw Materials.
• Sustainability Supplier Award
SUSTAINABLE NATURAL RUBBER POLICY
ON-GOING CONSULTATION WITH
• NGOs
• Suppliers
• Customers
• Development Agencies
• Multilateral Organisations
Full compliance of Purchasing Model with ISO 20400 provisions attested*
RISK MANAGEMENT: SUPPLY CHAIN SUSTAINABILITY_
*Third Party Opinion released in February 2018 by SGS Italy S.p.A; **ESG: environmental, social, governance; ***CDP: Carbon Disclosure Project
181

COMPANY PRESENTATION – SEPTEMBER 2018
The Policy…
• is the result of one year and a half analysis, consultation and engagement process with key international Stakeholders
• imports governance models from major international reference documents and tools
• targets transparency and traceability of the whole supply chain upstream, with a risk-based approach
….and is based on substantial pillars:
• Protection of labour and human rights, local community development, prevention of conflict related to land ownership
• No Deforestation, No Burn, No Peat, No land grabbing; Ecosystems protection through land planning
• a call to co-operation and constructive dialogue among Stakeholders playing a material role in natural rubber value
chain
• encouragement to invest in solid and internationally recognized forms of certifications
• transparent reporting on implementation results
...in 2018
• Release of the Policy Implementation Manual (drafted with the contribution of key stakeholders) and on-site training
• Deforestation risk mapping through innovative digital tools
• Traceability and ESG risk evaluation activities through local engagement
RISK MANAGEMENT: PIRELLI NATURAL RUBBER SUSTAINABILITY
POLICY (OCTOBER 2017)_
182

COMPANY PRESENTATION – SEPTEMBER 2018
RE
PU
TA
TIO
NA
L A
ND
SU
ST
AIN
AB
ILIT
Y R
ISK
S EXTERNAL RISKS*
External risks refer to events whose occurrence is outside the Company's
control (i.e. country risk-
macroeconomic volatility)
SCENARIO ANALYSIS OF KEY MACRO GEOPOLITICAL EVENTS
LOW
EXPOSURE TO HIGH RISK
COUNTRY
Strategic risks refer to events that stem from business. The correct
management of such risks is a source
of competitive advantage, or otherwise, the cause of failing to
achieve planned targets
0,0%
0,5%
1,0%
1,5%
2,0%
2,5%
3,0%
3,5%
Prob
abilit
y
AR PBIT [M EUR]
424 M €
74% probabilità di avere PBIT < AR PBIT 26% probabilità di avere PBIT > AR PBIT
Probabilità di avere:
PBIT < 540 M€ 19 %
540 < PBIT < 599,5 M€ 55 %
599,5 < PBIT < 660 M€ 25 %
PBIT > 660 M€ 1 %
718 M €
660 M €
PBIT atteso 572,6 M€
AR PBIT 599,5 M€
540 M €
EBIT TARGET IN
LINE WITH RISK
APPETITE
Operational risks refer to events generated by the organisational
structure. Assuming these risks do not
produce any competitive edge. (i.e. ICT-HSE-Loss Prevention and Business
Continuity-Compliance)
MONTECARLO SIMULATION TO ASSESS EXPECTED VOLATILITY
ANNUAL OPERATIONAL RISK ASSESSMENT
DOUBLE DIGIT
CAGR INVESTMENT IN
RISK MITIGATION
STRATEGIC RISKS*
OPERATIONAL RISKS*
A Holistic Approach: Stretching from Sustainability to External Risks
RISK MANAGEMENT: ENTERPRISE RISK MANAGEMENT_
*Some risk clusters may be transversal to more areas
183

COMPANY PRESENTATION – SEPTEMBER 2018 184
COMPANY PRESENTATION – SEPTEMBER 2018
1. 1H’18 FINANCIAL RESULTS
2. FY 2017 FINANCIAL RESULTS
AGENDA
3c. MARKET AND COMPETITION
3d. HIGH VALUE STRATEGY: LEVERS AND REGIONAL DEPLOYMENT
3e. HIGH VALUE STRATEGY: START-UPS
3f. TRANSFORMATION PROGRAMS
3g. STANDARD PROGRAMS
3h. TARGETS 2020
3. STRATEGY AND PLAN 2017-2020
4. GOVERNANCE
3a. PIRELLI AT A GLANCE
3b. KEY INVESTMENT HIGHLIGHTS
5. SUSTAINABILITY
6. APPENDIX
185
COMPANY PRESENTATION – SEPTEMBER 2018
AGENDA_
6. APPENDIX
6a. HISTORICAL FINANCIALS
186

COMPANY PRESENTATION – SEPTEMBER 2018
2014A 2015A 2016A 2017A
Revenues adjusted 4,480 4,785 4,976 5,352
% YoY 7% 4% +8%
EBITDA Adjusted w /o start-up costs 890 1,021 1,082 1,175
Margin % 20% 21% 22% 22%
EBIT Adjusted w/o start-up costs 654 769 844 927
Margin % 15% 16% 17% 17%
EBIT Adjusted 654 769 844 876
Margin % 15% 16% 17% 16%
Net income Adjusted 281 388 297 387
Margin % 6% 8% 6% 7%
Capex 297 349 340 489
As % of revenues 7% 7% 7% 9%
EBITDA Adjusted - CapEx 592 672 742 686
Cash conversion ratio % 67% 66% 69% 58%
€ million
KEY FINANCIAL HIGHLIGHTS_
Note: carve-out historical financials adjusted, i.e. before amortization of PPA, non recurring items and restructuring costs; restated with Steelcord among discontinued operations (2014) and net of Venezuela deconsolidation impact (both 2014 and 2015). Cash conversion ratio defined as (EBITDA Adjusted-CapEx) / EBITDA Adjusted
Due to higher capex in 2017
187

COMPANY PRESENTATION – SEPTEMBER 2018
€ million %
2015A
vs. 2014A
2016A
vs. 2015A
2017A
vs. 2016A
Δ Volumes 0.7% 3.5% 1.0%
- o/w High Value volumes 17.1% 15.5% 12.5%
Δ Price/Mix 4.1% 3.4% 6.9%
Δ Exchange rate 2.0% (4.4%) (0.7%)
Δ Perimeter (Aeolus and
others carve-out) 0.0% 1.5% 0.4%
Δ Revenues 6.8% 4.0% 7.6%
ORGANIC REVENUES GROWTH REVENUES ADJUSTED
(2.4%)
+14.8%
CAGR
14A-17A
Standard
High value
52% 55%
2014A
55% 48%
4,480 4,785
45%
45%
2015A
+6.1%
2017A
5,352
42%
58%
2016A
4,976
Standard
High value
BEST IN CLASS TOP LINE GROWTH DRIVEN BY HIGH VALUE AND
INDUSTRY LEADING PRICE/MIX_
Note: carve-out historical financials adjusted, i.e. before amortization of PPA, non recurring items and restructuring costs; restated with Steelcord among discontinued operations (2014) and net of Venezuela deconsolidation impact (both 2014 and 2015)
188

COMPANY PRESENTATION – SEPTEMBER 2018
Relentless Push Towards High Value Drives Growth Outperformance and Margin Expansion
EBIT margin (%)
14.6% 16.1% 17.0%
EBIT ADJUSTED W/O START-UP COSTS BRIDGE EBIT ADJUSTED
€ million
83
566
241
927
654
Raw
mat.
Price/Mix
(151)
Input
costs
(246)
Eff ic.
(37)
(183)
exch.
Rate
depr. &
others
2016A Vol. 2014A
€ million
HIGH VALUE FOCUS WITH TANGIBLE IMPACT ON MARGIN_
Note: carve-out historical financials adjusted, i.e. before amortization of PPA, non recurring items and restructuring costs; restated with Steelcord among discontinued operations (2014) and net of Venezuela deconsolidation impact (both 2014 and 2015)
2014A
844
2016A
High
Value
769
81%
Standard
927 + 12.3%
83%
17%
2015A
23%
2017A
68%
19%
77%
654
32%
17.3%
189
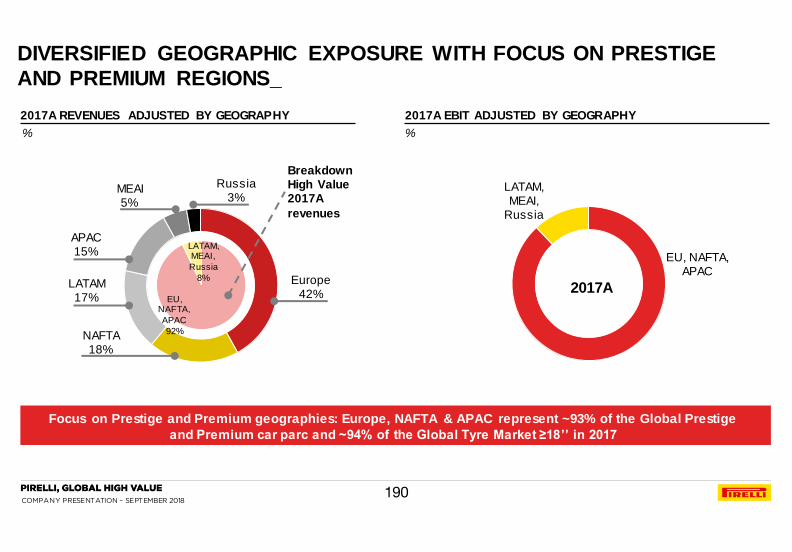
COMPANY PRESENTATION – SEPTEMBER 2018
% %
Europe 42%
NAFTA 18%
LATAM 17%
APAC 15%
MEAI 5%
Russia 3%
EU, NAFTA,
APAC
92%
LATAM, MEAI,
Russia
8%
Breakdown High Value 2017A
revenues
EU, NAFTA, APAC
LATAM, MEAI,
Russia
Focus on Prestige and Premium geographies: Europe, NAFTA & APAC represent ~93% of the Global Prestige
and Premium car parc and ~94% of the Global Tyre Market ≥18’’ in 2017
2017A
2017A EBIT ADJUSTED BY GEOGRAPHY 2017A REVENUES ADJUSTED BY GEOGRAPHY
DIVERSIFIED GEOGRAPHIC EXPOSURE WITH FOCUS ON PRESTIGE
AND PREMIUM REGIONS_
190

COMPANY PRESENTATION – SEPTEMBER 2018
OPERATING COSTS BREAKDOWN
€ million, % on Total
10% 10% 12% 12%
7% 7% 6% 6%
7% 7% 11% 9%
5% 4%
3% 3%
5% 5%
6% 6%
3% 3%
2% 2% 1% 2%
1% 1% 2% 1%
1% 1% 1% 1%
1% 1% 1% 1%
1% 1%
23% 23% 21%
20%
35% 35% 33% 37%
2014A 2015A 2016A 2017A
Raw Materials
& Consumables
Personnel
Other costs
Purchases of goods f or resale*
Fluids and energy
Adv ertising
Sales costs
4,244 4,515 4,624
Consultancies Maintenance
Rents
Warehousing Travels
COST STRUCTURE_
Note: data not adjusted; * off/take car Turkey and moto Brazil
5,079
191
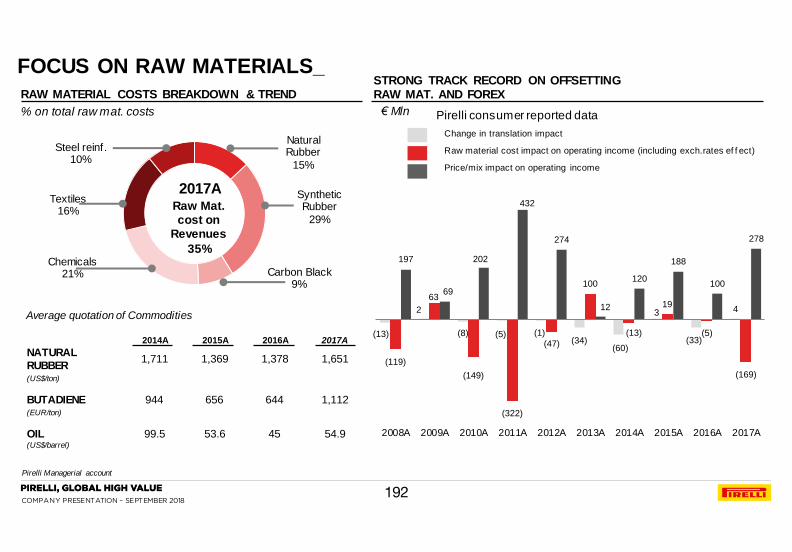
COMPANY PRESENTATION – SEPTEMBER 2018
2014A 2015A 2016A 2017A
NATURAL
RUBBER 1,711 1,369 1,378 1,651
(US$/ton)
BUTADIENE 944 656 644 1,112 (EUR/ton)
OIL 99.5 53.6 45 54.9 (US$/barrel)
STRONG TRACK RECORD ON OFFSETTING RAW MAT. AND FOREX
Average quotation of Commodities
RAW MATERIAL COSTS BREAKDOWN & TREND
Natural Rubber
15%
Synthetic Rubber
29%
Carbon Black 9%
Chemicals 21%
Textiles 16%
Steel reinf. 10%
% on total raw mat. costs
2017A Raw Mat. cost on
Revenues
35%
€ Mln
(13)
2
(8) (5) (1) (34)
(60)
3
(33)
4
(119)
63
(149)
(322)
(47)
100
(13)
19
(5)
(169)
197
69
202
432
274
12
120
188
100
278
2008A 2009A 2010A 2011A 2012A 2013A 2014A 2015A 2016A 2017A
Change in translation impact
Raw material cost impact on operating income (including exch.rates ef f ect)
Price/mix impact on operating income
Pirelli consumer reported data
FOCUS ON RAW MATERIALS_
Pirelli Managerial account
192

COMPANY PRESENTATION – SEPTEMBER 2018
HISTORICAL BALANCE SHEET _
2014A 2015A 2016A 2017A
Tangible assets 2,114.5 2,074.7 2,925.5 2,980.3
Intangible assets 674.1 657.3 5,996.4 5,893.7
o/w goodwill 577.3 572.7 1,877.4 1,877.4
Other non current assets 740.5 614.0 566.6 590.8
Total non current assets 3,529.1 3,346.1 9,488.5 9,464.8
Current assets 2,699.2 2,607.7 3,449.7 3,208.4
Assets held for sale 44.0 0.0 0.0 60.7
TOTAL ASSETS 6,272.3 5,953.8 12,938.2 12,733.9
Shareholders' Equity 1,850.5 1,636.4 2,633.4 4,177.0
o/w Group's Equity 1,796.9 1,582.6 2,569.6 4,116.8
Non current liabilities 2,351.8 1,755.6 7,789.4 5,646.7
Current liabilities 2,057.4 2,561.8 2,515.4 2,910.2
Liabilities related to assets held for sale 12.6 0.0 0.0 0.0
Total Liabilities 4,421.8 4,317.4 10,304.8 8,556.9
TOTAL EQUITY AND LIABILITIES 6,272.3 5,953.8 12,938.2 12,733.9
BALANCE SHEET (2014, 2015 AND 2016 CARVE-OUT CONSUMER CONSOLIDATED FIGURES)
€ Mln
193

COMPANY PRESENTATION – SEPTEMBER 2018
1,082
(75)
89
(340)
∆ WC CapEx Adjusted
EBITDA1
280
Interests
(49)
Taxes
(427)
Net Cash
Flow
Other Net Cash
Flow
200
Start-up
& Other
(111)
Interests
(363)
Taxes
(136)
1,175
(489)
CapEx
124
Adjusted
EBITDA1
w/o start-
up costs2
∆ WC
€ Mln € 742 M ln -> 68.6% CONVERSION RATE
CASH FLOW BRIDGE (2016)
2016
HISTORICAL CASH FLOW STATEMENT (2017 vs 2016)_
€ Mln € 686 M ln -> 58% CONVERSION RATE
CASH FLOW BRIDGE (2017)
2017
(1,189)
Industrial
Reorganization
(305)
3,219
Capital
Increase
NFP 2017
(200)
NCF NFP 2016
Reported
4,913 134
NFP 2016
carv e-out
4,961
Bidco NFP
May 2016
Debt push
down f rom
merger
1,241
NCF
(280)
NFP 2015
carv e-out
4,132
Sale of
38% Pirelli
Industrial
to Cinda
(266)
194

COMPANY PRESENTATION – SEPTEMBER 2018
2015
1,021
(349)
(106)
(171)
(285)
87 198
EBITDAAdjusted
Capex ∆ WC Taxes Interests other NCF
€ Mln € Mln
€ 672 M ln -> 65.7% CONVERSION RATE
CASH FLOW BRIDGE (2015)
1,082
(340)
89 (75)
(427)
(49) 280
EBITDAAdjusted
Capex ∆ WC Taxes Interests other NCF
€ 742 M ln -> 68.6% CONVERSION RATE
CASH FLOW BRIDGE (2016)
2016
includes 6 €/mln related to cash & cash
equiv alents relativ e to discontinued operations
1,038 (198)
278 (46)
168
1,241 1,241
(280) (266) 4,132
134
4,961
HISTORICAL CASH FLOW STATEMENT1 (2016 vs 2015)_
1 Carve-out figures
195
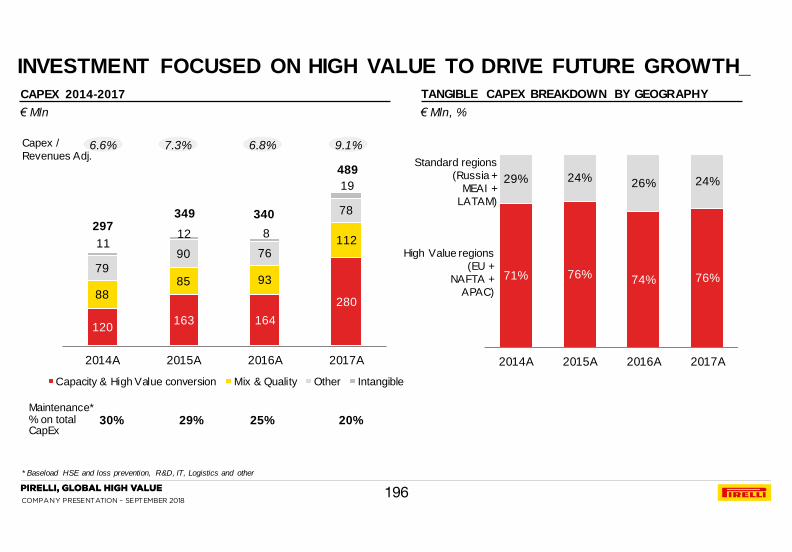
COMPANY PRESENTATION – SEPTEMBER 2018
CAPEX 2014-2017
120 163 164
280 88
85 93
112
79
90 76
78
11 12 8
19
2014A 2015A 2016A 2017A
Capacity & High Value conversion Mix & Quality Other Intangible
297 349 340
TANGIBLE CAPEX BREAKDOWN BY GEOGRAPHY
€ Mln, %
6.6% 7.3% 6.8% Capex /
Revenues Adj.
71% 76% 74% 76%
29% 24% 26% 24%
2014A 2015A 2016A 2017A
Standard regions
(Russia +
MEAI +
LATAM)
High Value regions
(EU +
NAFTA +
APAC)
30% 29% 25% Maintenance* % on total CapEx
€ Mln
INVESTMENT FOCUSED ON HIGH VALUE TO DRIVE FUTURE GROWTH_
* Baseload HSE and loss prevention, R&D, IT, Logistics and other
489
9.1%
20%
196

COMPANY PRESENTATION – SEPTEMBER 2018
(1.243) (1.173) (1.280) (1,499)
(1,674)
850 849 874 1,056 941
566 584 680 679
653
2014A 2015A 2016A 2016A 2017A
NET OPERATING WORKING CAPITAL DEVELOPMENT
3.7% 5.2% 5.5%
174 260
236
Operating NWC / Rev enues
▬ Seasonal products campaign (mainly w inter tyres) leads to a low er level of 4Q
w orking capital, consistently with the w ider industry
2014A carve-out
2015A carve-out
2016A carve-out
2016A restated
2017A restated
Days Rotation Days Rotation Days Rotation Days Rotation Days Rotation
44 8.2 42 8.6 49 7.3 49 7.3 44 8.2
66 5.5 61 5.9 63 5.7 76 4.7 63 5.7
26.7%* 2.6 23.4%* 3.0 25.7%* 2.8 30.1%* 2.4 31.3%* 2.4
€ Mln
WORKING CAPITAL MANAGEMENT_
Note: Net operating working capital defined as Inventories + Trade receivables - Trade payables.
Days Receivables defined as Receivables/Revenues*360; Rotation of Receivables defined as Revenues/Receivables.
Days Inventories defined as Inventories/Revenues*360; Rotation of Inventories defined as Revenues/inventories..
* Payables / Revenues . Rotation of Payables defined as (Raw Material & Consumables (net of ch. inventories) + Other Costs) / Payables.
274 (80)
carve-out carve-out carve-out restated restated
4.8% -1.5%
RECEIVABLES
INVENTORIES
PAYABLES
197

COMPANY PRESENTATION – SEPTEMBER 2018
NET DEBT – NFP RECONCILIATIONS & TREND 2014 – 2017
TREND 2014 - 2017
Net Debt / EBITDA adjusted w /o start-up costs 1.2 x 1.3 x 4.7 x 2.8 x
2014A
carve out
2015A
carve out
2016A
carve out
2016A
reported
2017A
reported
Net Debt 1,093 1,284 5,045 5,008 3,313
Other non-current f inancial receivables (49) (44) (85) (95) (95)
Net Debt adjusted 1,044 1,241 4,961 4,913 3,218
Cash & cash equivalents related to discontinued
operations (6)
Net Financial Position 1,038 1,241 4,961 4,913 3,218
Cash & cash equivalents & other current f in. assets
Current f inancial liabilities
Non-current liabilities
3,313
(1,209)
570
3,952
5,008
(1,616)
678
5,946
5,045
(1,511)
670
5,886
1,284
(933)
979
1,238
1,093
(1,000)
347
1,746
€ million
4.6x
NET DEBT EVOLUTION_
198

COMPANY PRESENTATION – SEPTEMBER 2018
5,069 4,976 (93)
Pirelli Consumer
2016 Annual Report
Pirelli IPO new
perimeter*
Perimeter
REVENUES
851 844
Pirelli IPO New
Perimeter*
Perimeter
and off-take
Pirelli Consumer
2016 Annual Report
FY 2016 results were restated to better reflect the final result of the Industrial Business separation, progressively effective during 2016 and 2017
▬ The difference in EBIT and EBITDA includes both: ▬ Delta perimeter, and ▬ Off-take costs related to moto production in
Brazil and car production in Turkey in Prometeon’s plants
EBIT ADJUSTED**
▬ The change perimeter mostly refers to sales related to industrial business from consumer entities not yet fully separated in 2016
EBITDA margin
16.8% 17.0%
Pirelli Consumer
2016 Annual Report
1,094
Perimeter
and off-take
1,082
Pirelli IPO New
Perimeter*
EBITDA ADJUSTED**
€ million
EBIT margin
21.6% 21.7%
(12)
(7)
FROM 2016 CONSUMER ANNUAL REPORT VIEW TO 2016 IPO
NEW PERIMETER_
* Carve-out; ** Before ammortization of PPA, non recurring items and restructuring costs
199

COMPANY PRESENTATION – SEPTEMBER 2018
Copy right © 2018 Pirelli & C. S.p.A.


