COMPANY PRESENTATION - Prosegur€¦ · COMPANY PRESENTATION 2019 This presentation contains...
68
COMPANY PRESENTATION INVESTOR RELATIONS DEPARTMENT 1
Transcript of COMPANY PRESENTATION - Prosegur€¦ · COMPANY PRESENTATION 2019 This presentation contains...

COMPANY
PRESENTATION
INVESTOR RELATIONS
DEPARTMENT
1

DISCLAIMER
COMPANY PRESENTATION 2019
This presentation contains forward-looking statements and information relating to
[Prosegur Compañía de Seguridad, S.A.] (the “Company”) and its subsidiaries
that are based on the current beliefs of the Company’s management, key
expectations and assumptions, as well as information currently available to the
Company and projections of future events as well as assumptions made and
information currently available to the Company. These forward-looking
statements speak only as of the date they are made. These forward-looking
statements are often, but not always, made through the use of words or phrases
such as “anticipate,” “believes,” “can,” “could,” “may,” “predicts,” “potential,”
“should,” “will,” “estimate,” “plans,” “projects,” “continuing,” “ongoing,” “expects,”
“intends,” and similar words or phrases. Other forward-looking statements can be
identified in the context in which the statements are made or by the forward-
looking nature of discussions of strategy, plans or intentions. Such forward-
looking statements, as well as those included in any other material discussed at
any management presentation, reflect the current views of the Company with
respect to future events and are subject to known and unknown risks,
uncertainties and key assumptions about the Company and its subsidiaries and
investments, including, among other things, the development of their businesses,
trends in their operating industry, and future capital expenditures. In light of
these risks, uncertainties and assumptions, the events or circumstances referred
to in the forward-looking statements may not occur. None of the future
projections, expectations, estimates or prospects in this presentation should be
taken as forecasts or promises nor should they be taken as implying any
indication, assurance or guarantee that the assumptions on which such future
projections, expectations, estimates or prospects have been prepared are
correct or exhaustive or, in the case of the assumptions, fully stated in the
presentation.
Many factors could cause the actual results, performance or achievements of
the Company and its subsidiaries to be materially different from any future
results, performance or achievements that may be expressed or implied by such
forward-looking statements, including, among others: changes in general
economic, political, governmental and business conditions globally and in the
countries in which the Company and its subsidiaries do business; changes in
interest rates; changes in inflation rates; changes in prices; trends affecting the
Company and its subsidiaries businesses, financial condition, results of
operations or cash flows; the impact of current, pending or future legislation and
regulation in countries in which the Company and its subsidiaries do business;
acquisitions, investments or divestments which the Company and its subsidiaries
may make in the future; the Company and its subsidiaries capital expenditures
plans; their estimated availability of funds; their ability to repay debt with
estimated future cash flows; security threats worldwide and losses of customer
valuables; failure to maintain safe work environments; effects of catastrophes,
natural disasters, adverse weather conditions, unexpected geological or other
physical conditions, or criminal or terrorist acts; public perception of the
Company and its subsidiaries businesses and reputation; insufficient insurance
coverage and increases in insurance cost; loss of senior management and key
personnel; unauthorized use of the Company’s intellectual property and claims of
infringement by the Company or its subsidiaries of others’ intellectual property;
changes in business strategy and various other factors. Should one or more of
these risks or uncertainties materialize, or should any other unknown risk occur,
or should any of the underlying assumptions prove incorrect, actual results may
vary materially from those described herein as anticipated, believed, estimated,
expected or targeted.
No one intends, or assumes any obligations, to update or revise these forward-
looking statements, whether as a result of new information, future events or
otherwise nor to update the reasons why actual results could differ from those
reflected in the forward-looking statements.
As a result of these risks, uncertainties and assumptions, you should not place
undue reliance on these forward-looking statements as a prediction of actual
results or otherwise.
Not for general release, publication or distribution, directly or indirectly, in
or into The United States, Canada, Australia or Japan or any other
Jurisdiction in which the distribution or release would be unlawful.
These materials do not constitute an offer to sell, or a solicitation of offers to
purchase or subscribe for any securities in the United States or any other
jurisdiction. The securities referred to herein have not been, and will not be,
registered under the U.S. Securities Act of 1933, as amended, and may not be
offered or sold in the United States absent registration or an applicable
exemption from registration requirements. There is no intention to register any
portion of any offering in the United States or to conduct a public offering of
securities in the United States.
2

COMPANY PRESENTATION FY 2019
ONEGROUP,THREEBUSINESSES
3

PROSEGUR GROUP
Prosegur: a success story
Since its foundation in 1976, Prosegur has grown to become one of the undisputable global leaders in the security
industry…
COMPANY PRESENTATION FY 2019
4
Expansion in LatAm & Europe
and Increase of services
portfolio
• Focus on Security: disposal of
FM and Cleaning businesses
• 2001: Full entry in LatAm and
France
• Creation of the Technology
Business Unit
• 2008: Entry into Mexico and
Colombia
1998
2008
2,052
Foundation and initial Expansion
• Incorporated in 1976
• 1980: Entry into Portugal
• 1987: Publicly Listed on Madrid
Stock Exchange
• 1995: Initiating activities in LatAm
1976
1997
480Consolidation of the integrated
model and expansion into Asia-
Pacific
• Specialization in Security Solutions
for different client sectors
• 2011: Entry into Singapore, India
and Germany
• 2012: Entry into China
• 2013: Rated BBB Stable by S&P.
Issuance of a € 500 million Bond and
Entry into Australia
2009
2014
3,783
Yearly revenues of last year in the period in €Million
Focus on Business Lines
Profitability and continual
expansion
• Reorganization of structure
around business lines vs.
geographies
• Initiated Global CyberSecurity
services business unit
• 2016: Entry in South Africa
• 2017: Prosegur Cash IPO
• 2018: Entry in Central America
& Philippines
• 2019: Entry in the US
• 2019: Entry in Indonesia
2015
2018
3,939

PROSEGUR TODAY
>9,000ARMOREDVEHICLES
>100,000MANAGEDATMS
+550,000 ALARMCONNECTIONS
OVER 220 FULLYINTEGRATED ACQUISITIONS
26COUNTRIES
+170,000EMPLOYEES WORLDWIDE
COMPANY PRESENTATION FY 2019
5

A GLOBAL SECURITY COMPANY WITH A LEADERSHIP POSITION IN FOCUS MARKETS
WE ARE MARKET LEADERS IN 17 OUT OF OUR 26 GEOGRAPHIES
Cash in transit & cash
management
Guarding and
technology
Alarm
Monitoring
Position in the market
share ranking
1
Prosegur Intl’ Player 1 Intl’ Player 2 Intl’ Player 3 Intl’ Player 4
#2
#3 #1
#4
#2
#1 #3
COMPANY PRESENTATION FY 2019
Source: DBK, Aproser and internal sources
6
CHINA
5
SINGAPORE
1
INDIA
2
PHILIPPINES
1
AUSTRALIA
2
GERMANY
1
TURKEY
n/a
FRANCE
3
PORTUGAL
1
SPAIN
1
SOUTH AFRICA
n/a
USA
n/a
CHILE
1
PERU
1
COLOMBIA
1
URUGUAY
1
ARGENTINA
1
PARAGUAY
1
BRAZIL
1
MEXICO
3GUATEMALA
HONDURAS
COSTA RICA
NICARAGUA
EL SALVADOR
1 INDONESIA
n/a

DELIVERING SUPERIOR GROWTH AND SHAREHOLDER RETURNS
CUMULATIVE DIVIDEND DISTRIBUTED 2004-2018:
€1,103m
€ 823m ordinary dividend
€ 280m extraordinary dividend (2017)
Figures in €m
(1) Market Cap in 2017 as of Dec. 2017 was 4.042 – Actual Market Cap €m reflects IPO of CASH Listed in 2017
COMPANY PRESENTATION FY 2019
Revenue (€m) Market Cap (€m) (1)EBIT (€m)
7
2004
3,939
2018
1,112+254.1%
+9.5%
85
301
2004 2018
+252.5%
+9.4%
895
20182004
2,728
+204.8%
+8.3%

Publicly
listed
in 2017
ORGANISATIONAL MODEL: “ONE GROUP, THREE BUSINESSES”
COMPANY PRESENTATION FY 2019
B CA
ONE GROUP, THREE BUSINESSES
PROSEGURCASH
PGA(Financial and support
functions)
PROSEGURSECURITY
RATIONALE
▪ Accelerate growth
▪ Increase specialization and efficiency
▪ Simplify the organisation
IMPLICATIONS / BENEFITS
▪ All businesses have reached the
maturity to be managed separately
▪ Different capital needs and KPIs
▪ Customer centric model across
regions
▪ Accelerates sharing of best practices
across regions
PROSEGURALARMS
8

A. CASH IS A SUCCESS STORY: A GLOBAL LEADER WITH
RESILIENT GROWTH AND STRONG CASH GENERATION
SALES*
€1,732 MM
EBIT Margin(%)*
15.5%
Countries / empl.
20 / 60,000
▪ #2 globally with 14% market share (vs. 7% in 2007)
▪ #1 in our focus Cash markets (14/20 countries)
▪ Leading scale, density and market share
▪ Outperforming the market (business has grown x4 in € sales
in the last 7 years)
▪ Solid fundamentals → already growing in new products and
capturing the next “outsourcing wave”
OUR BUSINESS
OUR OBJECTIVES
▪ Continue delivering above-market organic growth at constant
currency
▪ Lead industry consolidation player
▪ Lead the third wave of outsourcing (Cash Automation in Client,
IAD, Back Office Management, Branch Teller Staff, etc.)
▪ Strong cash generation to fuel Group’s growth
COMPANY PRESENTATION FY 2019
*FY18 business figures
9

▪ #5 global player with a leading position in selected markets
▪ Industry leading technology-based solutions
▪ Differentiated growth strategies for each market based on
development stage
▪ Expanding into mature markets with disruptive value proposition.
▪ Main player in LatAm leading the transformation of the industry
B. SECURITY IS A BUSINESS TO TRANSFORM AND GROW,
TO BECOME AN “INDUSTRY CHAMPION” AGAIN
SALES*€1,946 MM
EBIT Margin(%)*2.8%
Countries / empl.14 / 103,000
▪ Continue transformation towards technology-based products
▪ Improve margins → all geographies with profitability in line with peers
and Group’s best practices
▪ Grow and expand in US
▪ Complete integration of legacy businesses and operational
improvements in Brazil
▪ Build a solid “Cybersecurity” platform
COMPANY PRESENTATION FY 2019
OUR BUSINESS
OUR OBJECTIVES
10
*FY18 business figures

C. ALARMS IS A HIGH GROWTH AND HIGH RETURN BUSINESS
WHICH WE WANT TO ACCELERATE WITH ADEQUATE INVESTMENTS
SALES*
€262 MM
Total Connections*
547,000
Countries / empl.
10 / 7,000
• Unparalleled platform → significant investments undertaken over the
last 5 years to enter and reach critical mass in 10 countries
• Developed state-of-the-art products and launched next generation
alarm “SMART”
• Strengthened sales force, tripled from 2011
• Best in class and improving churn from 12% in 2011
• Rapid and consistent growth benefiting from low penetration in focus
markets
• Accelerate customer acquisition through investments in sales &
marketing (e.g., sales team, lead generation)
• Selective new geographies (big city approach)
• Continue to grow ARPU through penetration of SMART
• Roll out SMART product in all geographies
• Continue to improve churn levels
• Focus on product innovation to capture “the smart home” opportunity
OUR OBJECTIVES
OUR BUSINESS
COMPANY PRESENTATION FY 201911
*FY18 business figures

ONE
GROUP
PGA - CENTRALIZED EXTERNAL SUPPORT TO THE THREE BUSINESSES…
COMPANY PRESENTATION FY 2019
▪ Human Resources
▪ Finance/Tax
▪ Legal
▪ Security
▪ Corporate Development
▪ IT
▪ Real Estate
▪ Brand
▪ Insurance
▪ Purchase
▪ Marketing
CASH
Commercials & Operations
Cash Internal Support
SECURITY
Commercials & Operations
Security Internal Support
ALARMS
Commercials & Operations
Alarm Internal Support
SERVICES OFFERED
PGA – External support
5% Mark Up
PROSEGUR HOLDING
12

… SUPPORTED BY STABLE INVESTMENT GRADE RATINGS
BBB/A-2Outlook Stable
October 2019
SUSTAINED STRONG
LIQUIDITY PROFILE
EXCELLENT CASH FLOW GENERATION
WITH MODERATE CAPITAL EXPENDITURE
AND WORKING CAPITAL REQUIREMENTS
MINIMAL TRAPPED CASH
ACROSS OPERATIONS
MODERATE
LEVERAGE
13COMPANY PRESENTATION FY 2019

COMPANY PRESENTATION 2019
PROSEGUR
Leading the consolidation process
of the Cash industry while fueling
the Group’s growth
CASH
14

628 677
806 840
10171083
11701231
2006 2012
913
2007 201320102008 2009 2011 2014 2015 2016 2017 2018
763
889956
11265.8%
4549 50
58 6064
73 74
20162006 2007 2008 20172009 2010 2011 2012 2013 2014 20182015
37 38
52 55
685.9%
853 888 942
11981299
1463 1571
20072006 2015
1380
20142008 2009 2010 20122011 2013 2016 2017
1127
2018
784 792
1035
1672
6.5%
101 113147 158
199215
297 309
2006 2009
220
2007 2008 201320122010 2011 2014 2015 2016 2017 2018
128
183
84
27011.5%
CASH, STRONG GROWTH OF THE UNDERLYING DRIVER…
COMPANY PRESENTATION FY 2019
15
Source:2019 Central Banks data, IE Economics. Trade Economics 2019
BRL
EUR USD
GBP
Despite the growing penetration of alternative payment methods, cash in circulation is a constant growing figure in all
economies, representing in 2019 more than 85% of total World transactions. (Source 2018 World Cash Report & Central Banks reports)
■ In Europe (ECB Diary Study), cash represents 78.8% of all transactions in volume and 53.8% in value.
USE OF CASH IN TERMS OF VALUE (MN)

…BOOSTS THE GROWTH OF THE CASH SECTOR, ALTHOUGH AT DIFFERENT LEVELS IN EACH REGION
CASH MARKET SIZE
(USD BN)
+4.4%
2015 2020
Main characteristics of attractive markets:
(i) Growing economies;
(ii) Moderated elevated inflation and interest rates;
(iii) Certain level of insecurity;
(iv) Degree of sophistication of banking sector
EXPECTED GROWTH BY
GEOGRAPHY 2015-2020
Africa &
Middle East
Latam
US & Canada
Asia Pacific
Europe
4
(26%)
4.7
(31%)
2.7
(18%)
2.4
(16%)
1.4
(9%)
COMPANY PRESENTATION FY 2019
8.3%
5.6%
4.0%
2.1%
1.6%
15.2
18.8
Source: Freedonia 2017 report
16
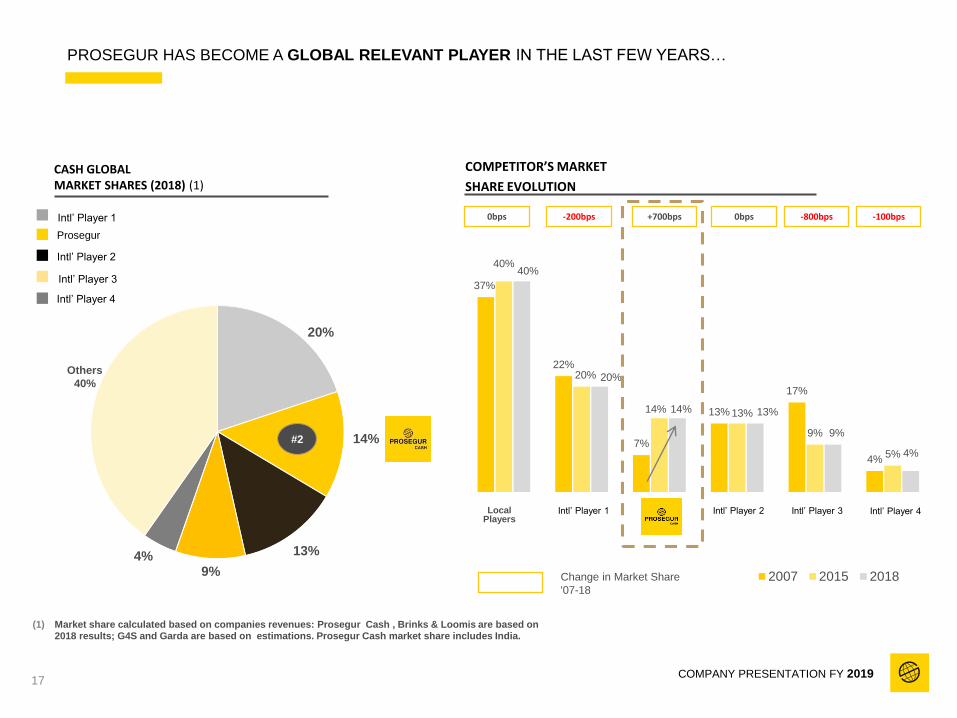
37%
22%
7%
13%
17%
4%
40%
20%
14% 13%
9%
5%
40%
20%
14% 13%
9%
4%
2007 2015 2018
20%
14%
13%
9%4%
CASH GLOBAL MARKET SHARES (2018) (1)
COMPETITOR’S MARKET
SHARE EVOLUTION
(1) Market share calculated based on companies revenues: Prosegur Cash , Brinks & Loomis are based on 2018 results; G4S and Garda are based on estimations. Prosegur Cash market share includes India.
#2
Local Players
Change in Market Share
'07-18
Others
40%
PROSEGUR HAS BECOME A GLOBAL RELEVANT PLAYER IN THE LAST FEW YEARS…
0bps -200bps +700bps -800bps -100bps0bps Intl’ Player 1
Prosegur
Intl’ Player 2
Intl’ Player 3
Intl’ Player 4
Intl’ Player 1 Intl’ Player 2 Intl’ Player 3 Intl’ Player 4
COMPANY PRESENTATION FY 201917

2018 MARKET SHARE
PROSEGUR
▪ Undisputed market leader in LatAm –
leadership position in fastest growing
markets
▪ Benefitting from growing security market
▪ Relying on its strong density, reputation,
brand and close relationship with clients
▪ Solid presence in key European countries
▪ Expected to be the fastest growing
economies in the area
▪ Growing footprint in Asia / Africa
▪ Highest Cash market growth regions
globally
Latam
Africa & Middle East
Europe
Asia Pacific
US and Canada
PROSEGUR CASH GLOBAL FOOTPRINT#2 GLOBAL MARKET POSITION
COMPANY PRESENTATION FY 2019
…WITH STRONG POSITIONS IN EACH OF THE LOCAL MARKETS
0%
10%
57%
10%
4%
# Market positioning
Cash in transit & cash management
Source: Freedonia 2017, DBK, Aproser and internal sources.
18
• GUATEMALA
• HONDURAS
• COSTA RICA
• NICARAGUA
• EL SALVADOR
1
MEXICO
3
CHILE
1
PERU
1
ARGENTINA
1
URUGUAY
1 PARAGUAY
1
BRAZIL
1
SPAIN
1
GERMANY
1
PHILIPPINES
1INDIA
2
AUSTRALIA
2
PORTUGAL
2
COLOMBIA
2
INDONESIA
n/a

DENSITY & SCALE AND PRODUCTIVITY GAINS: SEARCH FOR CONTINUOUS MARGIN IMPROVEMENT
1. DENSITY & SCALE
COMPANY PRESENTATION FY 2019
Prosegur Cash Market Share in
selected markets (%)
Pro
seg
ur
Ca
sh
EB
IT M
arg
in (
%)
19
2015 2016 2017 2018
2015 2016 2017 2018
382 382 428 340
282 314 360 268
21.9%
13.3%
22.2%
14.8%
22.2%
16.0%
19.7%
15.1%
18.0%
7.5%
18.6%
9.1%
18.7%
10.2%
15.5%
10.2%
EBIT EBIT Margin Peers Average
2. EBITDA (€m) and EBITDA margin (%)
Positive correlation
between market share
and profitability
• Leadership position in focus regions
• Footprint optimisation / higher density
• Profitability programs and best
practices
• Shift in revenue mix towards more
value added cash services
EBIT (€m) and EBIT margin (%)
EBITDA EBITDA Margin Peers Average

FOR THE FUTURE: UNPARALLELED POSITIONING TO BENEFIT FROM THREE KEY GROWTH LEVERS
COMPANY PRESENTATION FY 2019
Today Traditional market growth
(Organic)Consolidation play
(inorganic)
Third Wave of
Outsourcing
Third Wave of
Outsourcing
1 2 3
Source: IMF Nominal GDP forecast from 2016 – 2019. Expected growth calculated as a weighted average between our sales and the expected GDP
EXPECTED GROWTH
IN OUR FOOTPRINT1
CAGR
7.7%
2015 2020
> 500 CASH COMPANIES
GLOBALLY2
Room for further
consolidation
#14#7 #16#13#6 #9 #10 #11#8 #15#12#3 #4 #5#2 #17 #18 #19 #20 …#1
Cash automation in clients
OUTSOURCING
OPPORTUNITIES3
Back office management
IAD (Independent ATM
Deployer)
Branch teller staff
20

OUTSOURCING OPPORTUNITIES
Eff
icie
nc
ies
Business process outsourcing
BRANCH TELLER
STAFFBACK OFFICE
MANAGEMENT
IAD
(INDEPENDENT ATM
DEPLOYER)
ATM MGMT.
▪ Maintenance
▪ Fixing
▪ Replacement
▪ Full lifecycle
CASH PLANNING &
FORECASTING
▪ Branch Network
▪ Displaced ATMs
COMPANY PRESENTATION FY 2019
CASH LOGISTICS & PROCESSING
• Bank Branches
• ATMs
• Retail Clients
• Central Bank
Third wave of outsourcing
DAILY RECONCILIATION
▪ Incidence Mgmt.
▪ Branch Network
▪ Central Services
CASH AUTOMATION IN CLIENTS
21

PROSEGURSECURITYMoving from manned guarding
to technological solutions
COMPANY PRESENTATION FY 2019
22

PROSEGURSECURITYMoving from manned guarding
to technological solutions
2015 2020
SECURITY GLOBAL MARKET
EVOLUTION ($BN)
125
SECURITY GLOBAL MARKET SHARES
(2018)
KEY MARKET TRENDS
Commoditization, due to its low capital intensity and entry barriers. Competitiveness intensification and
considerable price pressure impacting margins, even with Facility Management companies
Increase in staff turnover, scarcity of qualified personnel. Increasing labor pressure
Budgeting restrictions in Public Sector
Double market:
▪ Client sophistication. Every time the client knows more and it gets more difficult to add value
▪ Stagnant sector that keeps the same criteria for some years and is into a mature phase
-
--
-
8%
6%
5%
4%2%
Others75%
Player 1
Player 2
Player 3
Player 4
Prosegur
Source: Freedonia 2017 report and internal
company data
LARGE MARKET WITH TECHNOLOGY AS A CATALYST
FOR FUTURE GROWTH
+
+
+
+
+
+6.1%
Increasing outsourcing from Public Sector and higher development of services to companies in
emerging countries
Design of integral offers that combine electronic systems with traditional guarding services improving
revenue mix
Intensive use of technology and its combination with human factor
Trend towards mobile services (dynamic guarding/patrolling) as an alternative
Growing market, with significant potential in emergent countries
168
23
COMPANY PRESENTATION FY 2019

PROSEGUR SECURITY HAS GLOBAL PRESENCE ACROSS LATAM, ASIA, EUROPE AND US
EMPLOYEES *
PROSEGUR SECURITY GLOBAL FOOTPRINT
#5 GLOBAL MARKET POSITION
SPAIN
BRAZIL
MEXICO
COLOMBIA
CHILE
ARGENTINA
URUGUAY
PORTUGAL
FRANCE
CHINA
PERUPARAGUAY
SINGAPORE
COMPANY PRESENTATION FY 2019Source: internal data
24
USA
* OPERATIONAL PERSONAL ONLY
Argentina
5,1%
Peru
Brazil
France
24,8%Spain
Colombia
Portugal
USA
11,4%
Chile
Mexico
Paraguay
Singapore
Uruguay
China
5,9%
26,1%
7,3%
8,3%
0,7%
4,7%
4,2%
2,5%
1,9%
1,4%
0,8%

27%
18% 17%12% 9% 9% 7% 6% 6% 4% 4% 1% 0% 1%
17%40%
16%22%
11% 9%
3%9%
3%
17% 15%28%
23%
56%
42%
67% 66%
80% 82%90%
85%91%
79% 81%
99% 100%
49%
Local Players
Largest National Player
Intl´ Players
Prosegur
WITH A LEADING POSITION IN SELECTED MARKETS ENABLING A SIGNIFICANT OPPORTUNITY
FOR CONSOLIDATION
GUARDING MARKET SHARES (%)
COMPANY PRESENTATION FY 2019Source: DBK, Investors presentations, internal estimates
25
Spain Uruguay Portugal Argentina Colombia Peru Brazil Paraguay Singapore Chile France Mexico China EEUU
#1 #2 #2 #2 #1 #2 #1 N.A. #2 N.A. #3 #7 N.A. N.A.

PROSEGUR’S SECURITY BUSINESS MODEL
IS BASED ON THREE KEY LEVERS
COMPANY PRESENTATION FY 2019
TECHNOLOGICAL
TRANSFORMATION
▪ Value proposition to client; moving
towards integrated solutions with
technology
HIGHER MARGIN
PRODUCTS
▪ Moving towards a high margin
product portfolio
STREAMLINING
▪ Size reduction
▪ Efficiency implementation
▪ Growth recovery
▪ Margin expansion
26
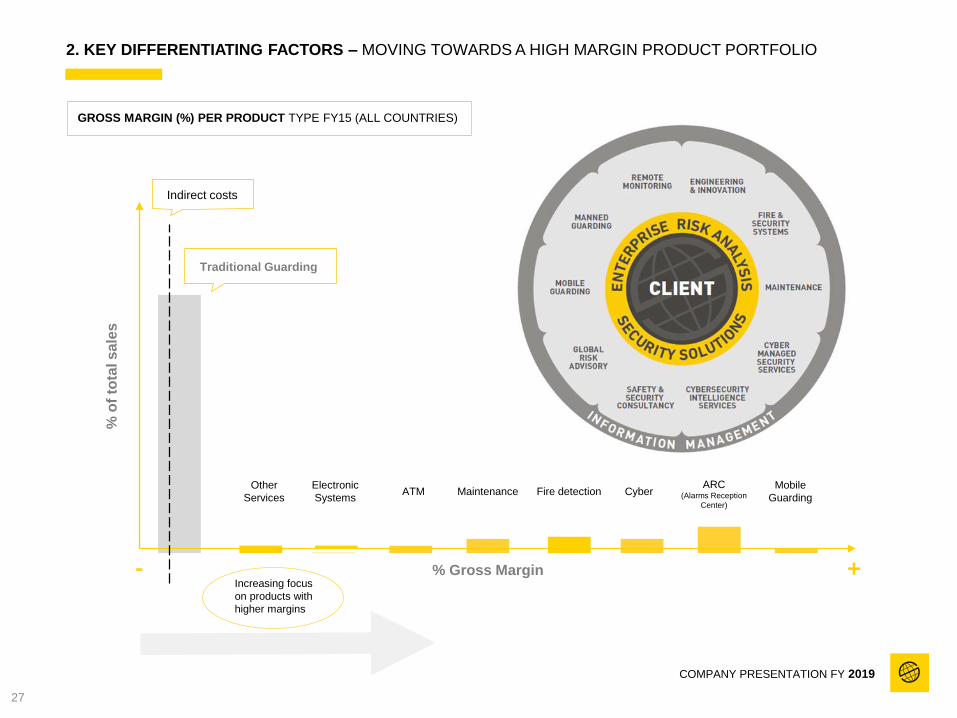
2. KEY DIFFERENTIATING FACTORS – MOVING TOWARDS A HIGH MARGIN PRODUCT PORTFOLIO
GROSS MARGIN (%) PER PRODUCT TYPE FY15 (ALL COUNTRIES)
COMPANY PRESENTATION FY 2019
% Gross Margin
% o
f to
tal s
ale
s
Other
Services
Electronic
SystemsATM Cyber
ARC(Alarms Reception
Center)
Mobile
GuardingMaintenance Fire detection
Indirect costs
Increasing focus
on products with
higher margins
Traditional Guarding
+-
27

PROSEGUR ALARMS
Betting on growth
and shaping
the future
COMPANY PRESENTATION FY 2019
28

ALARMS MARKET: SIGNIFICANTLY UNDERPENETRATED
ALARMS PENETRATION
RATES BY COUNTRY (%)
▪ World market is under-penetrated
▪ US is the most penetrated market globally and has only 20%
penetration
▪ Prosegur core markets are all <10% penetration
▪ Sales and marketing are the main drivers of penetration →
enormous growth potential that requires strong sales force
and investment
% of households with a connected alarm
COMPANY PRESENTATION FY 2019
29

ALARMS MARKET: FROM SINGLE DIGIT TO DOUBLE DIGIT GROWTH IN FOCUS REGIONS
COMPANY PRESENTATION FY 2019
PROSEGUR’S FOCUS REGIONS
EXPECTED TO LEAD THIS GROWTHGLOBAL ALARM MONITORING MARKET ($BN)
EXPECTED TO GROW AT 5.0% P.A.
CAGR:
5.0%
44
58
KEY DRIVERS
• Increasing role of crimes and
burglaries
• Rapid implementation of home
automation and security systems
• Integration of biometric technology in
smartphones
Alarm monitoring market
2015-20 CAGR Revenue expected growth by Region
2015 2020
8.35%
5.03%
4.12%
1.93%
1.67%
LATAM
Asia Pacific
World
North America
Western Europe
Source: Freedonia report 2017
30
2015 2020
75
2025

Installation
Revenues
Product
cost
Installation
cost
Sales cost
Marketing
cost
ALARMS: A DIFFERENT BUSINESS MODEL, SIGNIFICANT VALUE CREATION
VERY ATTRACTIVE RETURNS WITH UPFRONT CAPITAL REQUIREMENTS
CLIENT CONTRACT CASH FLOW
ARPU
Year 0
Operating costs (Including monitoring,
customer care, maintenance,...)
Year 1 Year 2 Year 3 Year 4 Year 5 Year 6 Year 7 Year 8 Year 9 Year 10 … Year N
Average life-cycle
▪ Payback period over
4 years
▪ Average subscription
period of 10 years
▪ Increasing ARPU on local
currency basis
▪ Very attractive returns
with upfront capital
requirements
COMPANY PRESENTATION FY 2019
31
…

1. KEY DIFFERENTIATING FACTORS – PRODUCT (1/2)
B2C(residential
& small
business)
PORTFOLIO OF PRODUCTS OFFERING A FULL RANGE OF SOLUTIONS ADAPTED TO CLIENTS’ NEEDS
B2B(transferred
to Security) ▪ Complex CCTV
systems
▪ Complex hybrid
and wired
systems
COMPANY PRESENTATION FY 2019
▪ Anti-theft systems,
▪ Smoke screen
2010
2015
2020▪ Wireless System
(video-verification)
▪ Professional
Hybrid & Wired
Solutions
▪ Video in the
Cloud
▪ Professional
CCTV Solutions
VIDEO
▪ Vehicle Security
Systems
▪ Mobile E-Health
Solutions ‘Smartlife’
▪ Internet of
Things applied
to security
HOME
AUTOMATION
32
2018
2012
▪ SMART solutions
for Technology-
Security integration
E-HEALTH
HAWK
EYE
INCLUSION
LOCATION▪ Intelligent security
services

1. KEY DIFFERENTIATING FACTORS – PRODUCT (2/2)
SMART PLATFORM AS THE CORE TOOL TO INTERACT WITH OUR CLIENTS
AND BUILD LOYALTY
SMART PLATFORM
▪ SMART: Platform to interact with our clients which builds loyalty
▪ Launched in 2016
▪ Productivity increase: Lower service costs
▪ Churn reduction: Connected clients have lower churn rates
(empirically proven 2-4% below average)
COMPANY PRESENTATION FY 2019
▪ Protection: In case of need, we send our response teams to
provide protection
▪ Police: Critical in those countries where Police does not have
the resources to provide reliable response
▪ Even in countries where Police provides a response we
provide value added services
RESPONSE
33
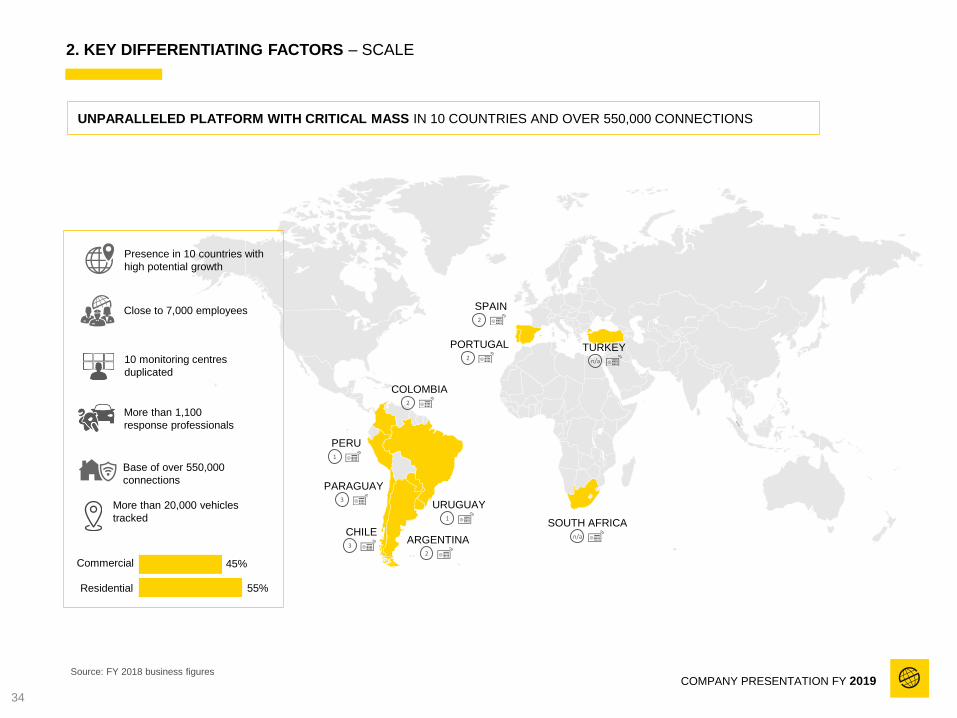
2. KEY DIFFERENTIATING FACTORS – SCALE
UNPARALLELED PLATFORM WITH CRITICAL MASS IN 10 COUNTRIES AND OVER 550,000 CONNECTIONS
COMPANY PRESENTATION FY 2019
Close to 7,000 employees
Presence in 10 countries with
high potential growth
10 monitoring centres
duplicated
More than 1,100
response professionals
Base of over 550,000
connections
Commercial
Residential
45%
55%
Source: FY 2018 business figures
34
More than 20,000 vehicles
tracked
TURKEY n/a
COLOMBIA2
PORTUGAL2
SPAIN2
ARGENTINA2
SOUTH AFRICAn/a
URUGUAY1
PERU1
PARAGUAY3
CHILE3

SOLID FINANCIAL PERFORMANCE BEING THE FASTEST GROWING
BUSINESS LINE WITHIN THE GROUP DRIVEN BY OUR FOCUS TO
INCREASE OUR CUSTOMER BASE
CUSTOMER BASE EVOLUTION
(# CONNECTIONS)
AVERAGE REVENUE
PER UNIT (ARPU)
2013 2014 2015 2016 2017
36.8 3538
36
38
Ø 36.5
+11.4%
35
355389
424
499547
2014 2015 2016 2017 2018 2018
36
▪ Net additions Increment of 10%
over same period in 2017
▪ Growth still over industry
average despite Argentina
slowdown
▪ Recurrent quota remains in line in the
long term despite the adverse macro
economic environment in Ibero-America
▪ Positive evolution in local currency
terms
COMPANY PRESENTATION 2019
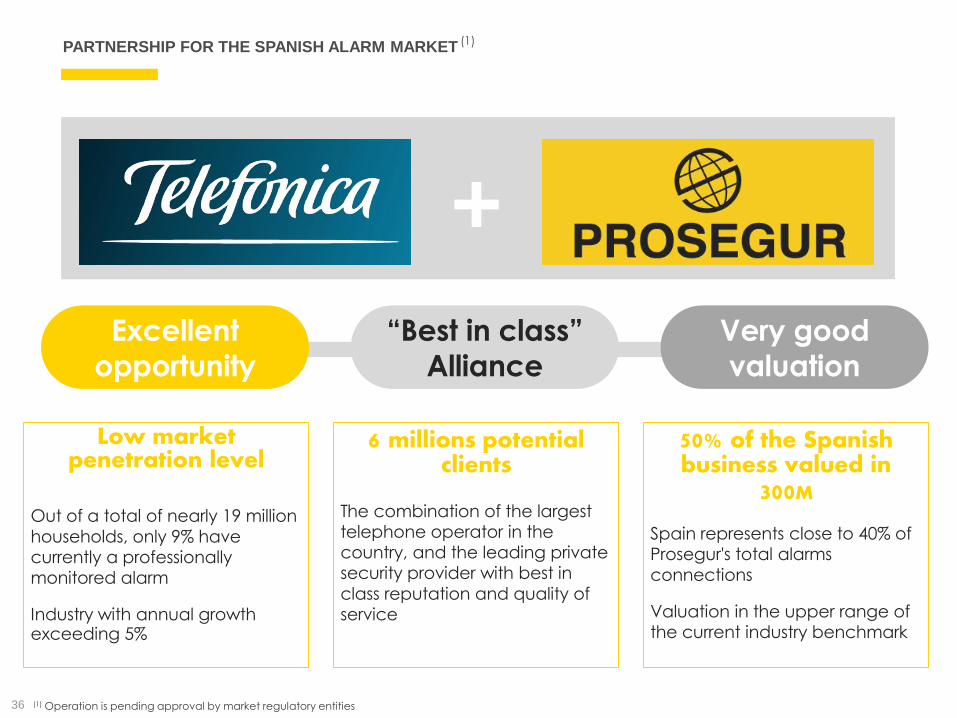
Excellent
opportunity
Low market penetration level
Out of a total of nearly 19 million
households, only 9% have currently a professionally monitored alarm
Industry with annual growth exceeding 5%
“Best in class”
Alliance
6 millions potential clients
The combination of the largest telephone operator in the country, and the leading private security provider with best in
class reputation and quality of service
Very good
valuation
50% of the Spanish business valued in
300M
Spain represents close to 40% of Prosegur's total alarms
connections
Valuation in the upper range of the current industry benchmark
(1) Operation is pending approval by market regulatory entities
(1)PARTNERSHIP FOR THE SPANISH ALARM MARKET
+
36

EnvironmentalSocialGovernance
COMPANY PRESENTATION FY 2019
37

+2 MILLIONHOURSOF TRAINING DELIVERED
+1,000PROFESSIONALS WITH DISABILITIES
+170,000PROFESSIONALS
+€12.MMINVESTED INTRAINING
We ensure the utmost respect for
the principle of equal treatment.
We take no risks when it comes to
safeguarding the physical safety
and integrity of our
professionals, raising their image
and profiles.
THE BEST HUMAN TEAM
COMPANY PRESENTATION FY 201938
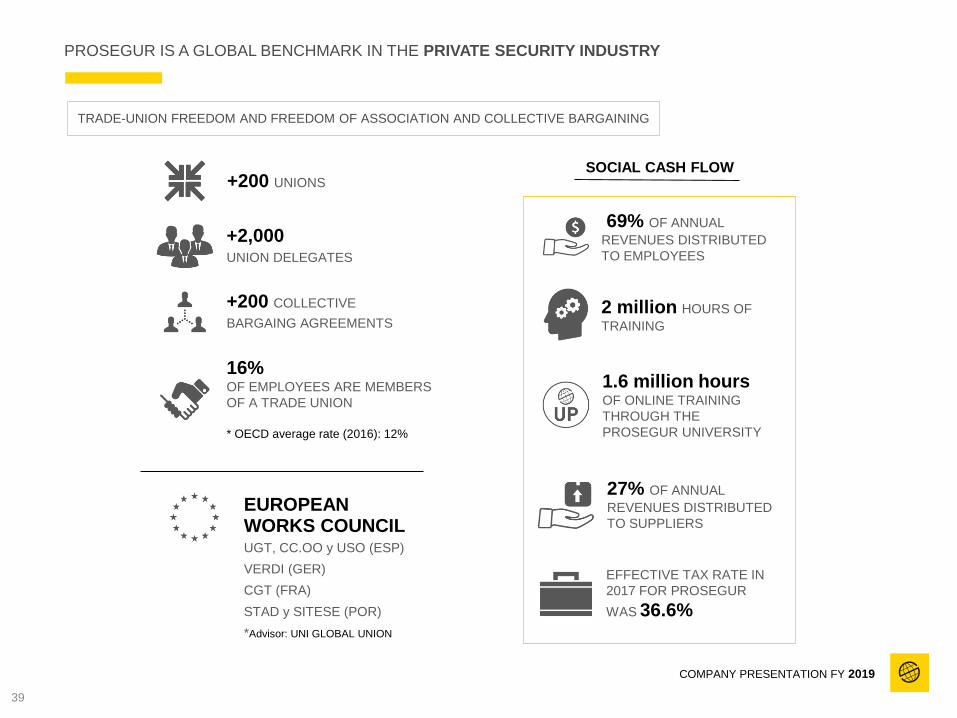
+200 COLLECTIVE
BARGAING AGREEMENTS
PROSEGUR IS A GLOBAL BENCHMARK IN THE PRIVATE SECURITY INDUSTRY
TRADE-UNION FREEDOM AND FREEDOM OF ASSOCIATION AND COLLECTIVE BARGAINING
+200 UNIONS
+2,000UNION DELEGATES
16%OF EMPLOYEES ARE MEMBERS
OF A TRADE UNION
* OECD average rate (2016): 12%
EUROPEAN WORKS COUNCILUGT, CC.OO y USO (ESP)
VERDI (GER)
CGT (FRA)
STAD y SITESE (POR)
*Advisor: UNI GLOBAL UNION
69% OF ANNUAL
REVENUES DISTRIBUTED
TO EMPLOYEES
27% OF ANNUAL
REVENUES DISTRIBUTED
TO SUPPLIERS
2 million HOURS OF
TRAINING
1.6 million hours OF ONLINE TRAINING
THROUGH THE
PROSEGUR UNIVERSITY
EFFECTIVE TAX RATE IN
2017 FOR PROSEGUR
WAS 36.6%
SOCIAL CASH FLOW
COMPANY PRESENTATION FY 2019
39
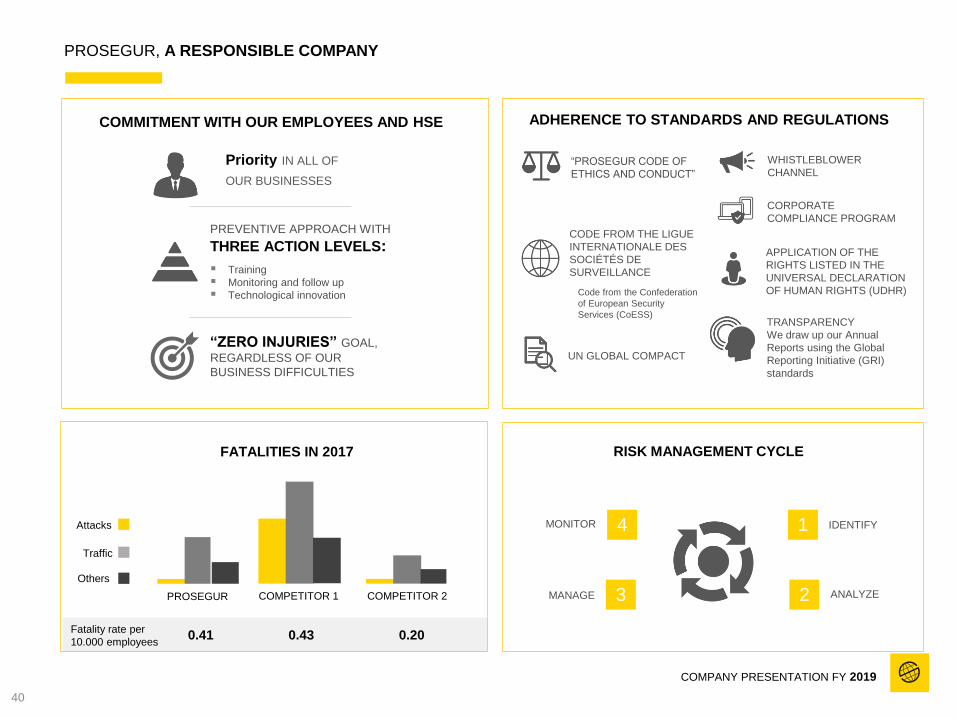
PROSEGUR, A RESPONSIBLE COMPANY
COMMITMENT WITH OUR EMPLOYEES AND HSE
PROSEGUR COMPETITOR 1 COMPETITOR 2
Fatality rate per
10.000 employees0.41 0.43 0.20
Attacks
Traffic
Others
FATALITIES IN 2017
ADHERENCE TO STANDARDS AND REGULATIONS
Priority IN ALL OF
OUR BUSINESSES
“ZERO INJURIES” GOAL,
REGARDLESS OF OUR
BUSINESS DIFFICULTIES
PREVENTIVE APPROACH WITH
THREE ACTION LEVELS:
▪ Training
▪ Monitoring and follow up
▪ Technological innovation
RISK MANAGEMENT CYCLE
4MONITOR
3MANAGE
1 IDENTIFY
2 ANALYZE
“PROSEGUR CODE OF
ETHICS AND CONDUCT”
CODE FROM THE LIGUE
INTERNATIONALE DES
SOCIÉTÉS DE
SURVEILLANCE
Code from the Confederation
of European Security
Services (CoESS)
UN GLOBAL COMPACT
WHISTLEBLOWER
CHANNEL
CORPORATE
COMPLIANCE PROGRAM
APPLICATION OF THE
RIGHTS LISTED IN THE
UNIVERSAL DECLARATION
OF HUMAN RIGHTS (UDHR)
TRANSPARENCY
We draw up our Annual
Reports using the Global
Reporting Initiative (GRI)
standards
COMPANY PRESENTATION FY 2019
40

WE ARE COMMITTED TO PEOPLE
COMPANY PRESENTATION FY 2019
Prosegur Foundation channels the company’s
social and cultural activities to help build a
more giving society while generating
opportunities for personal development, thus
making tangible our commitment to contribute
to the development of the regions the Group
operates in.
Our institution works to educate and improve
the job prospects of people with intellectual
disabilities and is also involved in corporate
volunteering and cultural outreach
We develop our own projects that are
sustainable, transparent and replicate best
practices
F O U N D A T I O N
P R O S E G U R
46PIECITOS COLORADOS SCHOOLS
4FIELDSOF ACTION
10COUNTRIES
34PROJECTS COMPLETED IN 2018
€3MM INVESTED
IN 2018
+43,000BENEFICIARIES IN 2018
41

9M 2019
FINANCIAL INFORMATION
COMPANY PRESENTATION FY 201942

43
P&L
Consolidated ResultsFY
2018
9M 2018
9M 2019
%
Variation
Sales 3,939 2,829 3,098 9.5%
EBITDA 456 332 378 14.0%
Margin 11.6% 11.7% 12.20%
Depreciation (129) (90) (129)
EBITA 327 242 249 3.2%
Margin 8.3% 8.6% 8.0%
Amortization of intangibles (26) (18) (21)
EBIT 301 224 228 2.2%
Margin 7.7% 7.9% 7.4%
Financial result (21) 13 (45)
Profit before Taxes 280 237 183 (22.7)%
Margin 7.1% 8.4% 5.9%
Taxes (100) (82) (65)
Tax rate 35.7% 34.7% 35.7%
Net Profit 180 155 118 (23.9)%
Minority Interests 48 39 35
Consolidated Net Profit 132 116 83 (28.3)%
Earnings per share(Euros per share)
0.2 0.19 0.14
• Excellent growth in local currency
close to 15%
• Comparable IAS 21&29 impact
• Profitability positively affected by recent divestments
!
9M 2018
2,829+7.8%
Org
+7.1%
Inorg
-5.4%
FX(1) 9M 2019
3,098
+9.5%
Amounts in Eur. millions - 2018 & 2019 figures have been elaborated applying IAS 21 & 2 9, additionally 2019 figures also include the application of IAS16 - (1) Includes exchange rate effect and IAS 21 & 29
44
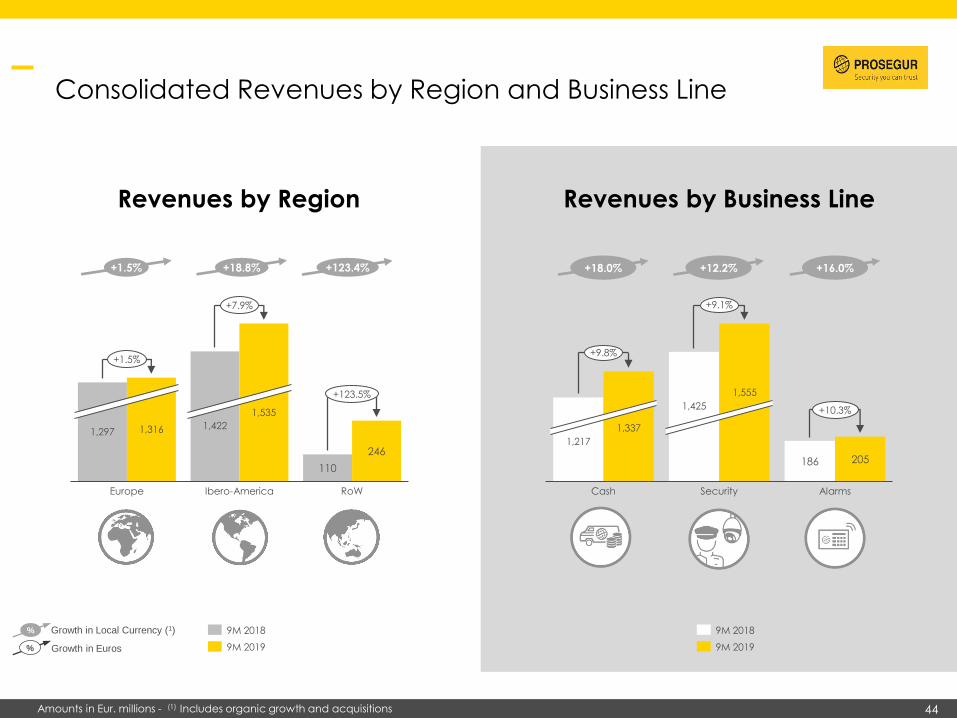
Consolidated Revenues by Region and Business Line
110
246
1,297 1,316
Europe
1,422
1,535
Ibero-America RoW
+1.5%
+7.9%
+123.5%
186 205
1,217
1,337
AlarmsCash
1,425
1,555
Security
+9.8%
+9.1%
+10.3%
9M 2018
9M 2019
% Growth in Local Currency (1)
% Growth in Euros
+18.0% +12.2% +16.0%
Revenues by Business LineRevenues by Region
+1.5% +18.8% +123.4%
9M 2018
9M 2019
Amounts in Eur. millions - (1) Includes organic growth and acquisitions
Amounts in Eur. millions - (1) Includes organic growth and acquisitions

45
+6.3%
+11.7%
9M
2018
Org Inorg
-8.2%
FX(1) 9M
2019
1,217
1,337
+9.8%
PROSEGUR CASH
198213
9M 2019
15.9%16.3%
9M 2018
+7.3%
• New products reach 16.0% of total sales in 9M 2019
• Sales of NPs grew by 52% in euros fueled by Smart Cash, AVOS and ATMs
• Continuous improvement of stand-alone quarterly margins
• Divestments in South Africa and
France partially compensate
the negative effect FX
• 18% growth in local currency
• 9.8% growth in Euro terms
• Positive contribution in all
markets except Australia
Revenues Profitability New Products
!EBIT
EBIT Margin
FY 2016 FY 2017 9M 2019FY 2018
6.4%
8.7%
11.8%
16.0%
+420 bps
Amounts in Eur. millions - (1) Includes exchange rate effect and IAS 21 & 29

46
PROSEGUR SECURITY
• Increased penetration of
“Integra” Solutions reaching
27.2% of current client portfolio
• Spain leads growth
• Profitability affected by the
IAS21&29 impact in Argentina,
integration of acquisitions in USA
and reorganization in France
• Growth in local currency above
12%
• Strong inorganic growth close to
9% driven by USA
Revenues Profitability(2) New Products(3)
!
1,425 +3.5%
9M
2018
Org Inorg
+8.7%
FX(1)
-3.1%
9M
2019
1,555
+9.1% 3934
9M 2019
2.7%
9M 2018
2.2%
-12.5%
EBIT Margin
EBIT
9M 2019FY 2016 FY 2017 FY 2018
17.0%20.0%
23.0%
27.2%
+420 bps
Amounts in Eur. millions - (1) Includes exchange rate effect and IAS 21 & 29 - (2) Profitability in Security excluding Overhead Costs - (3) Excludes USA

47
PROSEGUR ALARMS
Amounts in Eur. millions - Installed base in thousands of connections - ARPU in Euros - (1) Includes exchange rate effect and IAS 21 & 29
• Installed base increase of 3.6%
over the same period of 2018
• Affected by both macro and
strategic focus on quality of client
portfolio
Installed Base
• ARPU of € 36 per month maintained despite the strong
adverse FX.
• Penetration of “Smart” Platform
exceeding 23% of the installed base
ARPU
• Growth of more than 10% in Euros
and 16% in local currency
• Duplicating the average global
growth of the sector
Revenues
9M
2018
Inorg
+16.0%
Org
-5.7%
FX(1) 9M
2019
186
+0.0%
205
+10.3%
424
499
547 539559
2017 9M
2018
2016 2018 9M
2019
+3.6%+13.6% 3836
3836 36
201720162015 2018 9M
2019
48
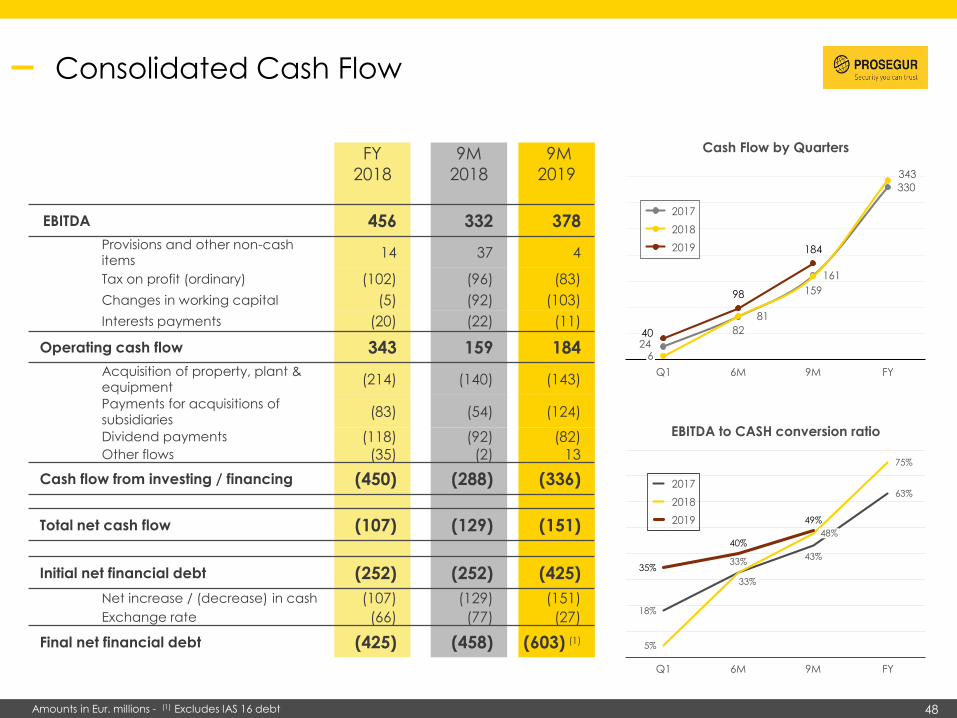
Consolidated Cash Flow
FY
2018
9M
2018
9M
2019
EBITDA 456 332 378
Provisions and other non-cash items
14 37 4
Tax on profit (ordinary) (102) (96) (83)
Changes in working capital (5) (92) (103)
Interests payments (20) (22) (11)
Operating cash flow 343 159 184
Acquisition of property, plant & equipment
(214) (140) (143)
Payments for acquisitions of
subsidiaries(83) (54) (124)
Dividend payments (118) (92) (82)Other flows (35) (2) 13
Cash flow from investing / financing (450) (288) (336)
Total net cash flow (107) (129) (151)
Initial net financial debt (252) (252) (425)
Net increase / (decrease) in cash (107) (129) (151)
Exchange rate (66) (77) (27)
Final net financial debt (425) (458) (603) (1)
Cash Flow by Quarters
24
81
161
330
15998
184
40
343
6
82
Q1 6M 9M FY
2019
2017
2018
18%
5%
35%
Q1
33%
33%
40%
6M
75%
43%
48%
9M
63%
FY
49%
EBITDA to CASH conversion ratio
2017
2018
2019
Amounts in Eur. millions - (1) Excludes IAS 16 debt

49
Financial Position
458 425
61581 594 603
78 95 109
-101 -84 -91
1.4%1.7%
Sep. 2019Dic. 2018
54
1.7%
Sep. 2018
127
Mar. 2019
1.4%
133-3
Jun. 2019
1.4%
132-15
Average Cost of Debt Treasury Stock (2)Net Financial DebtDeferred Payments
• Net financial Debt
• Increase of 178 millions of euros(1) vs. December 2018, deriving mainly from inorganic growth initiatives.
• Average cost of debt: reduction of c. 30 basis points vs. the same period in 2018 (1.4% vs. 1.7%)
• Rating. Confirmation by S&P of BBB rating, stable Outlook
(October 9, 2019)
IAS 16 Debt
1.5x 0.7x
Amounts in Eur. millions - (1) Excludes IAS 16 impact - (2) Treasury Stock of Prosegur and Prosegur Cash at closing market price of the period

50
Balance Sheet
FY 2018 9M 2019
Non-current assets 1,721 1,967Tangible fixed assets and real estate investments 745 873
Intangible assets 842 954
Others 133 141
Current assets 2,099 2,091Inventory 76 68
Customer and other receivables 975 1,080
Cash and equivalents and other financial assets 1,048 943
TOTAL ASSETS 3,820 4,058
Net equity 1,066 1,068Share capital 37 36
Treasury shares (53) (14)
Retained earnings and other reserves 1,013 958
Minority interest 69 88
Non-current liabilities 1,676 1,742
Bank borrowings and other financial liabilities 1,392 1,434
Other non-current liabilities 285 308
Current liabilities 1,077 1,248Bank borrowings and other financial liabilities 151 358
Trade payables and other current liabilities 926 890
TOTAL NET EQUITY AND LIABILITIES 3,820 4,058
• 80% of total Group debt is of
long-term nature
!
Amounts in Eur. millions - 2018 & 2019 figures have been elaborated applying IAS 21 & 2 9, additionally 2019 figures also include the application of IAS16

Recent M&A
COMPANY PRESENTATION FY 2019
• 20 Operations completed (10 in 2018)
• Across all business lines
• Cash (CIT, AVOS, ATM)
• Security (Guarding, Monitoring, Cybersecurity)
• Alarms
• More than €160 million in revenues (±100 in 2018)
USA
Central America
Peru
Paraguay
Colombia
Uruguay
Brazil
Spain
Germany
South Africa
Singapore
Philippines
Australia
51
Indonesia

52
Scalable
Growth
Process
Improvement
Savings
16 : 1Reduction of payroll
calculation hours in Brazil
100%Robotization of the employee registration process in
Spain
+25,000 contracts / year + social security payment
Reduces the time of incorporation from 48 to 24 hours
50% Reduced cost in the monitoring of 2,600
armoured vehicles using IOT
135Robotized Processes to achieve
efficiencies of 120,000 hours/year
Digital Transformation – an ongoing transformational project to reshape the group
Car SharingUse of electric and low consumption vehicles
in "car sharing" model for Alarms and Security
operational fleet
<60 daysProcess improvement in
“Opportunity 2 Cash” & “Procure 2
Pay” focusing on DSO reduction
COMPANY PRESENTATION FY 201952

5353
March 2019
Prosegur USA
Investor Relations Presentation
COMPANY PRESENTATION 2018

5454
US is the world’s largest Security market in terms of revenues, combined with strong profitability levels…
(1) Source: Freedonia Group. Figures estimates for Security services (2020 projection); (2) FY17 figures, corresponding to main international security players; (3) Source: Markets&Markets. MMS: Managed Security Services (2020 projection)
North America
Western Europe
Eastern
Europe
Africa/
Mideast
Central & South
America
19.4
18.4
24.2
5.448.6
42.8 5.8
USCanada &
Mexico
Revenues: Billions of USD1
~6%~6%
~4%
Average EBITA
margin2
China &
Japan
20.5
Rest of
Asia Pacific
31.4~3%
~5%
Prosegur
EBITA MarginRevenues
~40% Latam
~60% ROW* 3%**
Note: Figures FY18; *Rest of the world;
** Excludes Overhead Costs
+$13B in MSS CyberSecurity revenues3
+$9B in MSS
CyberSecurity revenues3
+$8B in MSS
CyberSecurity revenues3
+$1.5B in MSS
CyberSecurity revenues3
+$3B in MSS
CyberSecurity revenues3

5555
…where the guarding market characteristics and
the labor regulation allow for a great opportunity
for the sale of integrated solutions…
…benefitting from the attractiveness of the US
technology market, a global reference that leads the way
for other geographies…
… and where Cybersecurity plays a prominent role in a mature market with access to the latest solutions and best in class professionals to combine physical and logical solutions
Positive perception
of guarding
profession
High labour costs, due
to increasing minimum
wage
Security guards
scarcityHighly compliant
market
Matured technological
market with strong
growth potential
Leading innovation
market (observatory
of new trends)
Market underpinned
by a favourable
regulation
Highly efficient
solutions for
customersGreater exploitation of
economies of scale
Differentiated value
proposition with
respect to manned
guarding
Cultivated market with
double digit growth
expectations
Market where all the
largest players are
present Most technology-
advanced market with
top talent and skilled
professionals
Differentiated value
proposition when
combining physical and
logical solutions
Large benefits from
economies of
scale
Favourable market
regulation

5656
As of today, the US market has been traditionally focused on guarding, with an increasing weight of tech
solutions, that only international players are positioned to combine
# Market Rank
Guarding market1
EmployeesRevenues ($M)
Integrators & Technology market2
EmployeesRevenues ($M)…
(1) Source: Security magazine; figures for 2018; (2) Source: SDM Magazine. Figures for 2017; (1)(2) Considers recent acquisitions
~160 >5,200#8
~7,000 >200,000 #1
~4,200 >110,000#2
~300 >6,500#4
~200 >5,500#5
~200 >7,000#6
~180 >5,700#7
~850 ~2,500#3
~300 ~1,200#6
~2,000 >54,000#3
#4 ~760 ~2,500
#1 ~8,400 ~13,600
#2 ~4,500 ~19,500
~750 ~1,700#5
Note: This ranking excludes companies whose majority of their revenues come from integrated residential and burglar alarm systems: Vivint (~$900M); Brinks Home Security (~$550M),
Guardian Protection Services (~$200M), CPI Security Systems (~$100M) and Central Security Group (~$100M)
~100 ~550#10
~160 ~900#7
… …
~35 ~150N/A
…… …

5757
Prosegur’s entry into the US is based on four strategic pillars
Brand awareness and reputation
• Leverage Prosegur’s top tier global reputation as #5
Global Security player
Cross-selling opportunities
• Rapidly increase penetration in USA by cross-selling
complementary services to our existing customer base
Integrated commercial model
• Prosegur is in a unique position to combine integrated guarding and
technology services, defining its offering as Enterprise Risk
Management Solutions
Strong post merger integration Plan
• Drive value creation from the very outset, maximizing each company’s potential, by
executing our solid integration Plan

5858
Prosegur is #5 Global Security player and it can leverage top tier global reputation
5,000 CORPORATE
PROJECTS / YEAR
100,000 SECURITY
GUARDS +7,000 CORPORATE
CLIENTS
INTEGRATED SECURITY
SOLUTIONS
+10,000CAMERAS / YEAR
PROSEGUR SECURITY
Global security revenues2
(1) Integrated Advanced Security Solutions; Includes Cybersecurity & Enterprise Risk Advisory; (2) Market share represented by revenues
% Sales IASS over total Security revenues1
13% 13% 13% 14%17%
20% 23%
2012 2013 2014 2015 2016 2017 2018
LEADING POSITION IN 14
COUNTRIES

5959
There is an opportunity to rapidly increase our penetration in USA by cross-selling complementary
services
Main targets
Global
accounts
(US based)
Global
accounts
(Non-US based)
Acquired
accounts (US)
US-based clients served by Prosegur
in other countries
Non-US based clients served by
Prosegur in other countries, that have
relevant presence in US
Recently acquired US customer base
(CSC, Cipher, Viewpoint, and BSI)
1
2
3
Description

6060
Prosegur Integra
Guarding
Technology
Prosegur is in the best position to combine guarding and technology services, sold by risk
management specialists at higher margins…
• Market ready for disruptive player with
labor scarcity and customers in need of
integrated solutions
• International players, dragged by legacy
traditional guarding contracts are struggling
to change their culture
• Prosegur can differentiate itself by setting
up a risk specialists team who sell high value
added bundles, following a consulting
approach, and at better margins
Rationale

6161
…as we have already demonstrated in some of our core markets
Integra has proven to be a great
success story in Singapore, a
Security market with similar
characteristics to US.
Singapore has achieved the 2nd
best operating margins of
Prosegur in just a few years,
driven by profitable Integra
contracts, where margins keep
improving as weight of technology
increases year on year.
The recent sale of the greatest
ever Integra contract to the
Brazilian branch of a major US
delivery company represents a
milestone for Prosegur Security.
Services include manned
guarding, monitoring, and
technology installation &
maintenance for the client’s +130
branches around the country with
~1,000 partners involved.
The sale of a long-term
Integra contract to a top
CAC40 French engineering
and defence company was a
success story for Prosegur
Security in Europe.
With presence in two key
locations in the North of
France, this contract has
enhanced Prosegur sales and
margin in the country.
Singapore Brazil France

6262
Once the strategic intent was defined, we are ensuring that existing business momentum is
maintained and that the integration plan drives value creation
Execute
rigorously3
Prepare
well2
Prosegur USA’s integration process is prioritizing the following strategic drivers:
Focus on
value
creation
1• Optimizing synergies at all levels: revenue, costs, financial, marketing...
• Protecting business momentum to avoid loss of revenue and to retain key talent
• Defining a tailored integration approach, setting KPIs to ensure the best
combination of the different commercial/ operations teams
• Empowering a value-added IMO1, whose main goal is to ensure everything is
ready to start the integration execution since day 1
• Constantly monitoring the pre-defined strategic integration KPIs
• Over-communicating with messages customized to every stakeholder
• Building capabilities for future deals
(1) IMO: Integration Management Office
Prosegur USA capitalizes on our Group’s track record in +200 M&A operations, and
leverages each target competitive advantage and strong management team.

6363
Following this entry strategy and integrated model approach, the acquisitions roadmap was designed
to build a strong platform…
Manned
Guarding
Remote video
monitoring
Security
IntegratorCybersecurity
• Professional security officer
• On-site response service
• Mobile guards
• Real time, 24/7 monitoring
• Advanced Analytics
• Intelligent predictive CCTV
• Engineering capabilities
• Local installation resources
• Operation and maintenance
• SOC (Security operation centers)
• Managed Security Services
• Digital surveillance
• Cyber Intelligence
6464
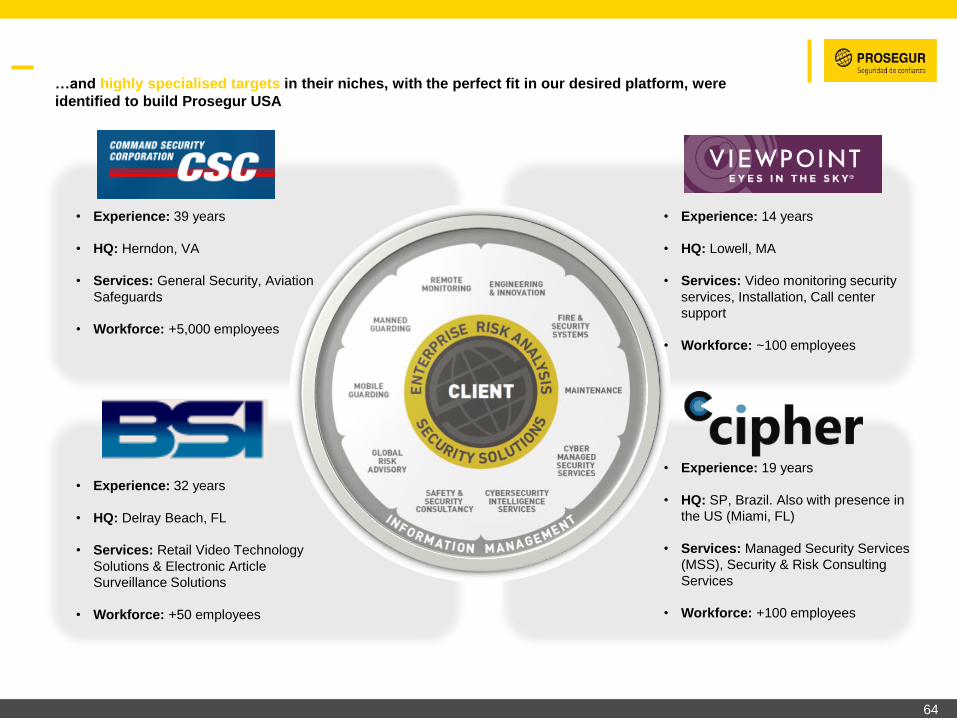
…and highly specialised targets in their niches, with the perfect fit in our desired platform, were
identified to build Prosegur USA
• Experience: 14 years
• HQ: Lowell, MA
• Services: Video monitoring security
services, Installation, Call center
support
• Workforce: ~100 employees
• Experience: 39 years
• HQ: Herndon, VA
• Services: General Security, Aviation
Safeguards
• Workforce: +5,000 employees
• Experience: 32 years
• HQ: Delray Beach, FL
• Services: Retail Video Technology
Solutions & Electronic Article
Surveillance Solutions
• Workforce: +50 employees
• Experience: 19 years
• HQ: SP, Brazil. Also with presence in
the US (Miami, FL)
• Services: Managed Security Services
(MSS), Security & Risk Consulting
Services
• Workforce: +100 employees

6565
Relevant presence in regions with the highest
concentration of clients and growth potential
This new brand national platform leaves us in a unique position as a full services integrator to cater for
our clients needs across the US
Guarding
Monitoring / Technology
Systems Integrator
Cybersecurity
WA
OR
CA
NV
ID
MT
WY
UT
AZNM
ND
SD
CO
NE
KS
OK
TX
LA
AR
MO
IA
MN
WI
MI
ILIN
OH
KY
MSAL
TN
GA
FL
SC
NC
VA
WV
PA
NY
VT
ME
NH
MA
RI
CT
NJ
DE
MD
C
B
V

6666
Entry into the largest and most
profitable security market with
the ambition to become
Prosegur’s second biggest
market in the midterm
Geographical portfolio
rebalancing, leading to strong
revenues increase in a very
stable market
Innovation and new trends
observatory to export successful
models to other countries
In conclusion, US Market entry will provide us with great benefits that will allow us to improve our
profitability and become a leader in Enterprise Risk Management Solutions
Market attractiveness Rationale for Prosegur
Brand awareness and
reputation
Cross-selling
opportunities
Integrated
commercial model
Strong post merger
integration Plan
Strategic pillars
Manned guarding
Technology
• Positive perception of guarding
profession
• Security guards scarcity
• High labour costs
• Highly compliant market
• Highly matured market with
strong growth potential
• Highly efficient solutions for
customers
• Great exploitation of economies
of scale
• Favourable regulation

6767
Legal Disclaimer
This document has been prepared
exclusively by Prosegur for use as
part of this presentation.
The information contained in this
document is provided by Prosegur
solely for information purposes, in
order to assist parties that may be
interested in undertaking a
preliminary analysis of it; the
information it contains is limited and
may be subject to additions or
amendments without prior notice.
This document may contain
projections or estimates concerning
the future performance and results
of Prosegur’s business.
These estimates derive from
expectations and opinions of
Prosegur and, therefore, are subject
to and qualified by risks,
uncertainties, changes in
circumstances and other factors
that may result in actual results
differing significantly from forecasts
or estimates. Prosegur assumes no
liability nor obligation to update or
review its estimates, forecasts,
opinions or expectations.
The distribution of this document in
other jurisdictions may be
prohibited; therefore, the recipients
of this document or anybody
accessing a copy of it must be
warned of said restrictions and
comply with them.
This document has been provided
for informative purposes only and
does not constitute, nor should it be
interpreted as an offer to sell,
exchange or acquire or a request
for proposal to purchase any shares
in Prosegur.
Any decision to purchase or invest
in shares must be taken based on
the information contained in the
brochures filled out by Prosegur
from time to time .

www.prosegur.com
THANK
YOU
CONTACT INFORMATION:
Antonio de Cárcer
Investor Relations Director
Tel: +34 91 589 83 29
Cristina Casado
Investor Relations Officer
Tel: +34 91 589 83 29