Company Presentation January 2009 - Piper JaffrayThe presentation is prepared by LDK Solar Co., Ltd....
34
Company Presentation January 2009 Company Presentation January 2009
Transcript of Company Presentation January 2009 - Piper JaffrayThe presentation is prepared by LDK Solar Co., Ltd....

Company Presentation January 2009 Company Presentation January 2009

2
DisclaimerDisclaimer
The presentation is prepared by LDK Solar Co., Ltd. (“LDK Solar” or the “Company”) and is being presented solely for the purpose of corporate communication and general reference. The presentation is not intended as an offer to sell, or to solicit an offer to buy or form any basis of investment decision for any class of securities of the Company in any jurisdiction. All such information should not be used or relied on without professional advice. The presentation is a brief summary in nature and do not purport to be a complete description of the Company, its business, its current or historical operating results or its future prospects.
This presentation contains forward-looking statements that involve risks and uncertainties. All statements other than statements of historical facts are forward-looking statements. These statements involve known and unknown risks, uncertainties and other factors that may cause our actual results, performance or achievements to be materially different from those expressed or implied by the forward-looking statements.
This presentation is provided without any warranty or representation of any kind, either expressed or implied. The Company specifically disclaims all responsibilities in respect of any use or reliance of any information, whether financial or otherwise, contained in this presentation.

Company OverviewCompany Overview

4
LDK at a GlanceLDK at a Glance
Company Description Key Figures
Leading manufacturer of multicrystalline solar wafers.
Expanding annualized wafer production capacity from 420MW at the end of 2007 to 1.20 GW by the end of the third quarter of 2008. Currently forecasting 1.46GW by the end of 2008, 2.30 GW by end of 2009 and 3.20 GW by end of 2010.
Constructing in-house polysilicon facilities, with expected production of 3,000-5,000 MT in 2009.
Diversified customer base mainly consisting of top PV cell and module manufacturers.
Silicon Ingot and Block WaferNote:1 Net income is defined as the net income available to ordinary shareholders
(US$'MM unless noted otherwise) 4Q07 1Q08 2Q08 3Q08Annual Capacity (MW) 420 580 880 1,200 Net Sales $192.8 $233.4 $441.7 $541.8 Growth(%) 21.4% 21.1% 89.2% 22.7%
Gross Profit 58.0 64.6 112.3 122.9 Margin(%) 30.1% 27.7% 25.4% 22.7%
Operating Profit 46.7 52.5 100.3 107.8 Margin(%) 24.2% 22.5% 22.7% 19.9%
Net Income(2) 49.2 49.8 149.5 88.4 Margin(%) 25.5% 21.3% 33.9% 16.3%
EPS (Diluted) $0.44 $0.45 $1.29 $0.77

5
Leading Wafer Manufacturer with Rapid Capacity Expansion
Cost Leader in Wafer Manufacturing Industry
Diversified Global Customer Base with a Strong Sales Backlog
Continuous R&D efforts on Technological and Product Innovation
Upside Potential from In-house Polysilicon Production
1
3
4
2
5
Key Investment HighlightsKey Investment Highlights

6
1
3,200
420580
880
1,200
1,460
2,300
4Q07A 1Q08A 2Q08A 3Q08A 2008A 2009E 2010E
Wafer Capacity Expansion Plan (MW) (1)
Note:1 Annualized wafer production capacity as of period/year end
Wafer Plant
Leading Wafer Manufacturer with Rapid Capacity Expansion Leading Wafer Manufacturer with Rapid Capacity Expansion
7
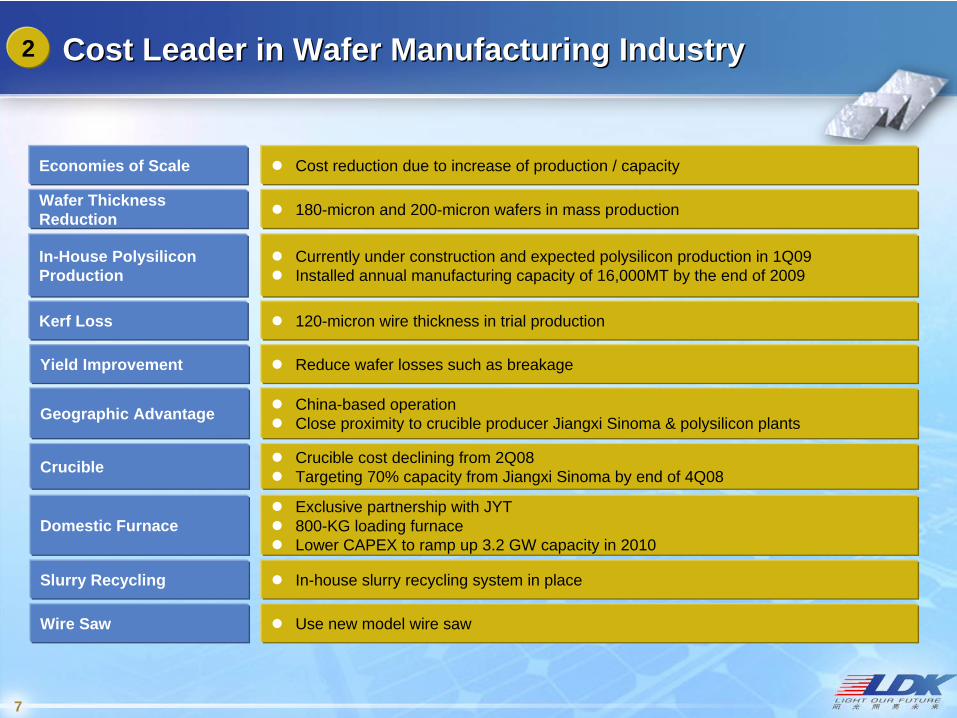
Cost Leader in Wafer Manufacturing IndustryCost Leader in Wafer Manufacturing Industry2
In-House Polysilicon Production
Currently under construction and expected polysilicon production in 1Q09Installed annual manufacturing capacity of 16,000MT by the end of 2009
Kerf Loss 120-micron wire thickness in trial production
Wafer Thickness Reduction 180-micron and 200-micron wafers in mass production
Economies of Scale Cost reduction due to increase of production / capacity
Yield Improvement Reduce wafer losses such as breakage
Geographic Advantage China-based operationClose proximity to crucible producer Jiangxi Sinoma & polysilicon plants
Crucible Crucible cost declining from 2Q08Targeting 70% capacity from Jiangxi Sinoma by end of 4Q08
Domestic Furnace Exclusive partnership with JYT 800-KG loading furnaceLower CAPEX to ramp up 3.2 GW capacity in 2010
Slurry Recycling In-house slurry recycling system in place
Wire Saw Use new model wire saw

8
R&D RoadmapR&D Roadmap
Parameter 2007 Current StatusFuture Goals
(2013)
Ingot Weight 270kg 450kg 1,000kg
Ingot Energy Consumption 9.2 kwh/kg 8.0 kwh/kg 6.0 kwh/kg
Wafer Size 156X156 (mm2) 156X156 (mm2) 210X210 (mm2)
Wafer Thickness 220μm 180μm 120μm
Kerf Loss 175μm 155μm 130μm
Polysilicon Consumption 8-10 g/w 6-8 g/w 4-5 g/w
Cell Efficiency (with Customers)
15.3% 15.8% 18.0%

From Manufacturing Cost Leader to Total Cost LeaderFrom Manufacturing Cost Leader to Total Cost Leader
Continued cost reduction focus in 2009 and beyond
In-house polysilicon supply starting in 2009
Continued use of recycle silicon
In-house slurry recovery starting in 2009
Further reduction in silicon consumption/Wp. Wafer thickness, wire diameter
-
0.5
1.0
1.5
2.0
2.5
3.0
0 500 1,000 1,500 2,000 2,500 3,000 3,500 4,000 4,500
FY 08 Shipment (MW)
Tota
l Waf
er C
ost (
$/W
p)
Mfg Cost Si Cost
LDK in FY08
-
0.2
0.4
0.6
0.8
1.0
1.2
1.4
1.6
0 500 1,000 1,500 2,000 2,500 3,000 3,500 4,000 4,500 5,000 5,500 6,000 6,500
FY 09e Shipment (MW)
Tota
l Waf
er C
ost (
$/W
p)
Mfg Cost Si Cost
LDK in FY09
Source: Morgan Stanley Research
10
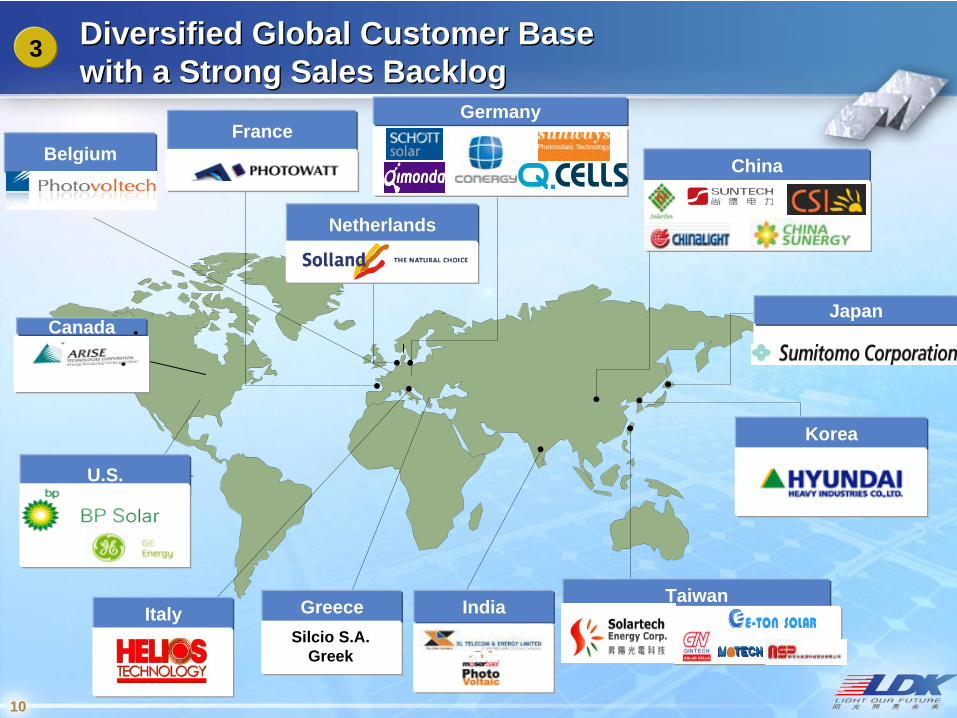
Diversified Global Customer Base with a Strong Sales Backlog Diversified Global Customer Base with a Strong Sales Backlog
China
Germany
U.S.
Korea
Japan
TaiwanIndiaGreeceSilcio S.A.
Greek
Netherlands
France
Italy
Belgium
3
Canada

11
3
Recently Signed Contracts
Diversified Global Customer Base with a Strong Sales Backlog Diversified Global Customer Base with a Strong Sales Backlog
10-year supply contract for more than 640 MW, commencing in mid 2008April 2, 2008
4-and 6-year contracts for an aggregate of less than 100 MW, both commencing in 2008April 4, 2008 / Silcio S.A. Greek
5-year supply contract for 540 MW, commencing in 2009May 5, 2008
10-year supply contract for 800 MW, commencing in 2009 Follow-on to 3 year contract signed in Oct. 2007June 30, 2008
July 16, 2008 10-year contract for 400 MW, commencing in 2009
5-year supply contract for 70 MW, commencing in 2009June 13, 2008 Solar PV Corporation
August 29, 2008 7-year contract for 440 MW, commencing in 2009
August 13, 2008 5-year contract for 300 MW, commencing in 2009
September 3, 2008 5-year contract for 550 MW, commencing in 2009
September 5, 2008 8-year contract for 750 MW, commencing in 2009
September 12, 200811-year processing service agreement to process minimum of 20,000 MT upgraded metallurgical grade (UMG) solar-grade silicon
October 20, 2008 7-year contract for 70 MW, commencing in 2009
October 17, 2008 3-year contract for 90 MW over 3-year, commencing in 2009
November 14, 2008 3-year contract for 435 MW, commencing in 2009
US-based leading supplier
12
3
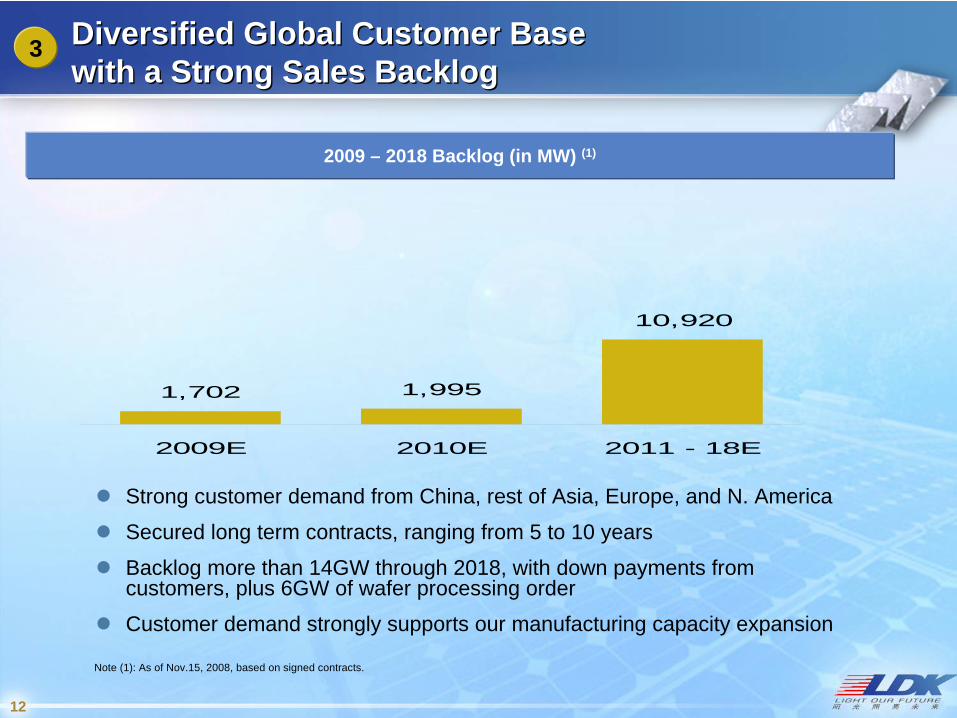
2009 – 2018 Backlog (in MW) (1)
Strong customer demand from China, rest of Asia, Europe, and N. America
Secured long term contracts, ranging from 5 to 10 years
Backlog more than 14GW through 2018, with down payments from customers, plus 6GW of wafer processing order
Customer demand strongly supports our manufacturing capacity expansion
1,702 1,995
10,920
2009E 2010E 2011 - 18E
Diversified Global Customer Base with a Strong Sales Backlog Diversified Global Customer Base with a Strong Sales Backlog
Note (1): As of Nov.15, 2008, based on signed contracts.

13
Continuous R&D efforts on Technological and Product Innovation Continuous R&D efforts on Technological and Product Innovation
Production process enhancement
Locally-produced quality consumables and
supplemental equipment
Dedicated R&D team Cooperation with Jiaotong University
Dedicated R&D efforts to secure cost competitive leadership
Cooperation with Nanchang University
Improvement of manufacturing processSolidification purification process
Ingot size
Wafer thickness
Polysilicon kerf loss
Recycling of silicon material
Use of domestic material
Producing lower-cost consumables
4

14
Anticipated Cell Efficiency13 14 15 16 17 18 19 20 21 22 23 24
Terra Wafers
Aurora wafers
Bright Wafers
Standard Multi-Wafers
Nova Wafers
Standard Mono-Wafers
4
Terra Wafers: N-type Mono-wafers for high-efficiency cells
Aurora Wafers: Mono-crystalline wafers with innovative casting process
Bright Wafers: Multi-crystalline wafers with improved quality
Nova Wafers: Multi-crystalline wafers with UMG silicon
Continuous R&D efforts on Technological and Product Innovation Continuous R&D efforts on Technological and Product Innovation
15
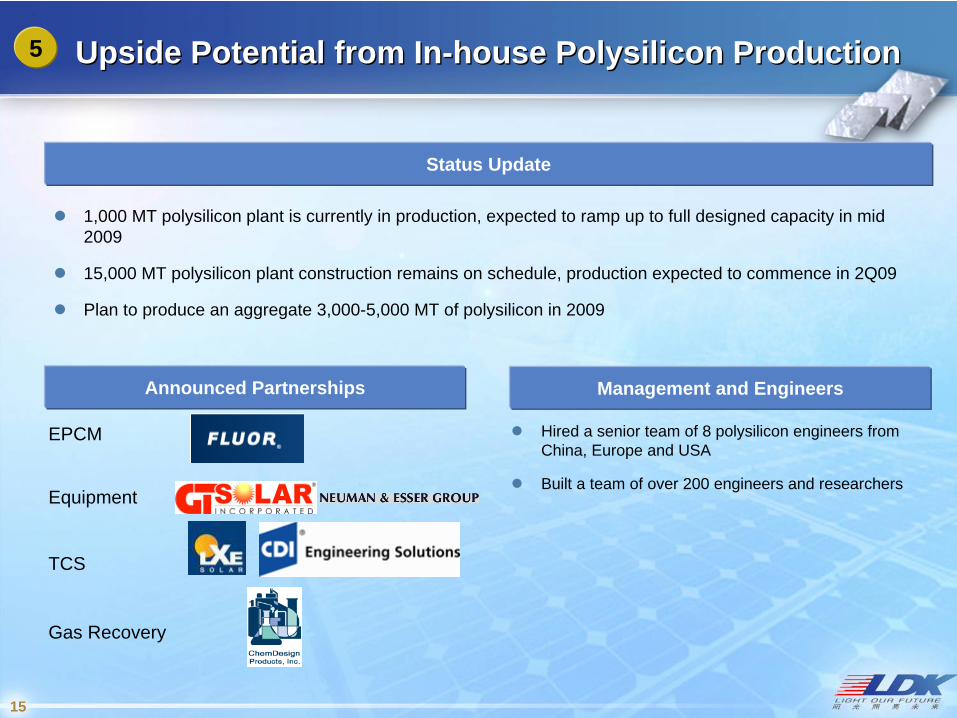
Upside Potential from In-house Polysilicon ProductionUpside Potential from In-house Polysilicon Production
Management and EngineersAnnounced Partnerships
Equipment
TCS
Gas Recovery
EPCM
5
1,000 MT polysilicon plant is currently in production, expected to ramp up to full designed capacity in mid 2009
15,000 MT polysilicon plant construction remains on schedule, production expected to commence in 2Q09
Plan to produce an aggregate 3,000-5,000 MT of polysilicon in 2009
Hired a senior team of 8 polysilicon engineers from China, Europe and USA
Built a team of over 200 engineers and researchers
Status Update
LDK 1,000 MT/Y Polysilicon Plant UpdateJan. 16, 2009LDK 1,000 MT/Y LDK 1,000 MT/Y PolysiliconPolysilicon Plant UpdatePlant UpdateJan. 16, 2009Jan. 16, 2009
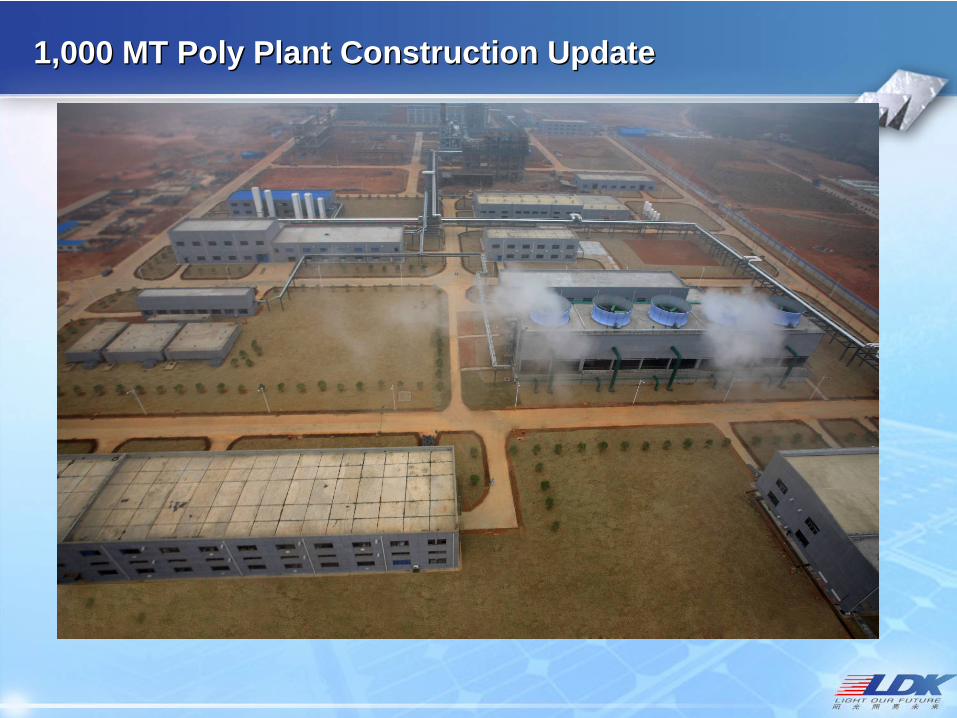
1,000 MT Poly Plant Construction Update1,000 MT Poly Plant Construction Update

1,000 MT Poly Plant Construction Update1,000 MT Poly Plant Construction Update

1,000 MT Poly Plant Construction Update1,000 MT Poly Plant Construction Update
TCS Purification and Off Gas Recovery System

1,000 MT Poly Plant Construction Update1,000 MT Poly Plant Construction Update

21
1,000 MT Poly Plant Construction Update1,000 MT Poly Plant Construction Update
Off-gas recovery system
Compressed airProcess control roomFire water pump station
Hydrogen SystemCooling water pump station

22
1,000 MT Poly Plant Construction Update1,000 MT Poly Plant Construction Update
Switchgear StationSwitchgear control room CVD Reactors (2)
TCS Distillation (Nightscape)
TCS Distillation & CDI/OGR
CVD Reactors (1)
TCS Storage Tanks

LDK 15,000 MT/Y Polysilicon Plant Update Jan. 30, 2009
LDK 15,000 MT/Y LDK 15,000 MT/Y PolysiliconPolysilicon Plant UpdatePlant Update Jan. 30, 2009Jan. 30, 2009
15,000 MT Poly Plant Construction Update15,000 MT Poly Plant Construction Update

Progress and Performance Jan.30, 2009 Progress and Performance Jan.30, 2009
CATEGORY PLAN ACTUAL
Polysilicon Plant 74.9% 72.2%
TCS Plant 69.9% 58.7%
Line 1. 95%Utilities, Infrastructure 93.0% 87.0%
Total 80.9% 75.0%
Construction started November 25, 2007

Jan. 30, 2009 UpdateJan. 30, 2009 Update

Jan. 30, 2009 UpdateJan. 30, 2009 Update

Jan. 30, 2009 UpdateJan. 30, 2009 Update

Financial OverviewFinancial Overview

29
Wafer Shipment and ASP TrendWafer Shipment and ASP Trend
84.7 100.171.8
260.3
8.719.1
31.5
44.3
50.6
93.4
191.7
252.6
91.3
310.9
160.2
208.3
19.5
119.2
4Q07 1Q08 2Q08 3Q08 1H07 1H08
Wafer Sales Volume (MW)
OEM Wafer Sales
Growth
29
Average Selling Price (US$ / Watt)
2.29 2.22
2.44 2.482.25
2.36
4Q07 1Q08 2Q08 3Q08 1H07 1H08
CQGR of 28.2% from 4Q07 to 3Q08

3030
88.4
149.5
49.849.2
26.2% 21.3%
33.9%
16.3%
4Q07 1Q08 2Q08 3Q08Net Income Net Income Margin
46.7 52.5
100.3 107.8
24.2%22.5% 22.7% 19.9%
4Q07 1Q08 2Q08 3Q08Operating Profit Operating Profit
58.0 64.6
112.3122.9
30.1% 27.7%25.4%
22.7%
4Q07 1Q08 2Q08 3Q08Gross Profit Gross Profit Margin
192.8 233.4
441.7541.8
4Q07 1Q08 2Q08 3Q08
Total Revenue (US$ MM) Gross Profit (US$ MM)
Operating Profit (US$ MM) Net Income(1) (US$ MM)
Financial PerformanceFinancial Performance
Note(1): Net income is defined as the net income available to ordinary shareholders

31
Top Customers by Revenue for 3Q08Top Customers by Revenue for 3Q08
By Geography By Customer
#126%
#211%
#38%
#46%#5
5%
Other44%
Mainland China29%
Asia Pacific ex- Mainland China25%
Europe42%
North America4%

32
Balance SheetBalance SheetLDK Solar Co., Ltd.Unaudited Condensed Consolidated Balance Sheet Information(In US$’000)
9/30/2008 6/30/2008 3/31/2008AssetsCash and cash equivalents 347,762 83,742 93,705Pledged bank deposits (1) 164,504 295,378 172,106Inventories 709,992 666,731 540,995Prepayments to suppliers (1) 316,937 274,344 226,864Property, plant and equipment, net 1,138,539 705,784 501,078Deposits for property, plant and equipments 301,252 222,400 200,725Total assets 3,181,217 2,427,851 1,853,106
Total debt (2) 1,011,405 874,792 351,728Leverage ratio (3) 50.3% 55.6% 31.1%
Advance payments from customers (1) 777,182 607,668 532,402
Total shareholders' equity 999,375 697,636 779,779Total liabilities and shareholders' equity 3,181,217 2,427,851 1,853,106
(1) Include both current and non-current portions(2) Total debt includes short-term and long-term interest-bearing borrowings(3) Total debt / (total debt + total shareholders’equity)

33
Financial Guidance (Updated on Jan.5th 09)
Revenue
Wafer Capacity
245 MW – 255 MW
$425 M - $435 M
1.46GW
Gross Margin 10% - 13% 22% - 27%
$2.3 B - $2.5 B
1.57 GW – 1.67 GW
2.30 GW
4Q08 2009
Wafer Shipment

34
Our Growth StrategyOur Growth Strategy
Improve R&D to reduce manufacturing costs,
improve production yield and pursue technological
innovation
Consider selective alliances
and acquisitions
Broaden geographic presence and strengthen customer relationships
Develop in-house polysilicon
manufacturing capabilities
Secure polysilicon feedstock supply from
third party vendors
Expand wafer production capacity to meet
customer demand