Company Overview August 2015 Company Overview August 2015.
34
Company Overview August 2015
-
Upload
laureen-walton -
Category
Documents
-
view
237 -
download
8
Transcript of Company Overview August 2015 Company Overview August 2015.

Company Overview
August 2015
Company Overview
August 2015

Forward-Looking Statements and Confidentiality
Forward-Looking Statements and Confidentiality
This presentation contains forward-looking statements within the meaning of the federal securities laws. These statements relate to future events or future financial performance and reflect management’s expectations and opinions. These statements are only predictions, and our actual future results may differ significantly from those anticipated in any forward-looking statements due to numerous known and unknown risks, uncertainties and other factors. All of the forward-looking statements are qualified in their entirety by reference to the factors described in “Risk Factors” and “Management’s Discussion and Analysis of Financial Conditions and Results of Operations” in our Annual Report on Form 10-K for the year ended December 31, 2014 and Quarterly Reports on Form 10-Q for the quarterly periods ended March 31, 2015 and June 30, 2015 as well as any other filings we make with the Securities and Exchange Commission under the Securities Exchange Act of 1934, as amended. These factors may not be exhaustive, and we cannot predict the extent to which any factor, or combination of factors, may cause actual results to differ materially from those predicted in any forward-looking statements. Forward-looking statements speak only as of the date of the document in which they are made. We do not intend, and do not undertake any obligation, to update any forward-looking statements to reflect future events or circumstances after the date of such statements.
The information in this presentation is confidential, and should not be photocopied, distributed or disclosed to anyone. Your acceptance of this document is deemed to be an agreement to these terms.

Entercom OverviewEntercom Overview
3
# 4 radio group
Leading brands and clusters focused on top 50 markets
Undervalued medium with massive reach
Significant Entercom value creating catalysts

Entercom Market Overview125 Stations in 27 Markets
Entercom Market Overview125 Stations in 27 Markets
4

Entercom Competitive StrengthsEntercom Competitive Strengths
5
• Pure-play focus
• Strong balance sheet
• Disciplined acquirer
• Highly-rated brands and leading clusters in top 50 markets
• Strong local personalities and content
• Significant management ownership

Entercom Catalysts for Value Creation Entercom Catalysts for Value Creation
6
Solid core operations with strong
expense management
Recent acquisition
SmartReach Digital
Opportunity to refinance 10.5% high yield bonds

Acquisition UpdateAcquisition Update

Lincoln Financial Media AcquisitionLincoln Financial Media Acquisition
8
• Entercom announced the acquisition of Lincoln Financial Media in December 2014
• To satisfy DOJ concerns, Entercom agreed to swap 4 Denver stations with Bonneville International Corporation in exchange for Bonneville’s KSWD-FM in Los Angeles and$5 million in additional cash consideration
• The purchase price for LFM is $105 million - $77.5 million in cash and $27.5 million in new Series A perpetual convertible preferred stock
• LFM acquisition closed July 16, 2015

Bonneville Swap OverviewBonneville Swap Overview
9
Bonneville ReceivesEntercom Receives
• + $5 million in additional consideration
• Entercom and Bonneville to operate respective stations under time brokerage agreements until close (expected by 4Q)
*
*
** Acquired through purchase of LFM

Bonneville Swap BackgroundBonneville Swap Background
10
• Swap with Bonneville offers opportunity to acquire rapidly growing Classic Rock station KSWD-FM in Los Angeles with strong audience and ratings
• KSWD revenues up significantly through first half
• Strong ratings position with men and adults in nation’s largest radio revenue market

Acquisition HighlightsAcquisition Highlights
11
• Adds stations in Atlanta, Denver, Los Angeles, Miami and San Diego
• Expands Entercom reach with four new top 20 markets
• Adds two remaining major West Coast markets to Entercom’s current footprint
• Terrific brands with significant growth potential
• Significant opportunity for margin enhancement
• Transaction structure creates future cash tax shields

Stations Added Through LFM Acquisition and Bonneville Swap
Stations Added Through LFM Acquisition and Bonneville Swap
12
Lincoln Financial Media and Bonneville Radio Stations to be added to Entercom
Market Stations Format
Atlanta WSTR-FM WQXI-AM
Hot Adult Contemporary Hot Adult Contemporary
Denver KQKS-FM KRWZ-AM Translator – 103.1 FM
Rhythmic CHR Oldies Comedy
Los Angeles KSWD-FM Classic Rock
Miami WAXY-AM/FM WLYF-FM WMXJ-FM
Sports Adult Contemporary Classic Hits
San Diego KBZT-FM KSON-FM/KSOQ-FM KIFM-FM
Alternative Country Adult Contemporary
Entercom Denver Stations after LFM acquisition and Bonneville Exchange Market Stations Format
Denver KALC-FM KQMT-FM KQKS-FM KEZW-AM KRWZ-AM Translator – 103.1 FM
Hot Adult Contemporary Adult Rock Rhythmic CHR Adult Standards Oldies Comedy

Industry UpdateIndustry Update

Industry OverviewIndustry Overview
14
Rad
io
Only real-time mass reach medium
Least disrupted medium
Undervalued
Industry catalysts
Great business model with strong free cash flow generation

15
“There are still huge, huge radio audiences and
frankly, it is a massively underutilized
medium.”- Andrew Robertson, CEO of BBDO
December 22, 2014

TV Radio Internet Newspapers
$75Bn
$16Bn
$33Bn
$23Bn
5.0hr
2.8hr
2.0hr
0.3hr
Ad Spend Pro Forma by Usage
US Ad Spend ($ Billions)
Time Spent with Each Medium
23% of Media Consumption7% of the Ad Spend
Source: SNL Kagan. 2011; Nielsen Cross Platform Report March 2014; Newspaper -- Arbitron Inc and Edison Research The Infinite Dial 2013
16

Radio #1 Medium 5Am to 5PMBeating TV, On-line and Mobile
Radio #1 Medium 5Am to 5PMBeating TV, On-line and Mobile
17
Source: Nielsen
93% of Americans listen weekly

18
Source: Nielson Catalina
FACT:Brands averaged a sales lift of more than $6 for every $1 spent on radio ads – an ROI double that of even the best results from many
recent studies of digital or TV media

Entercom OverviewEntercom Overview

Leading Clusters with Strong Competitive Positions
Leading Clusters with Strong Competitive Positions
20
68% of Revenue Derived from Markets Where ETM Cluster is Ranked # 1 or # 2 in Revenue Share
Source: Based on 2014 revenue using markets measured by Miller Kaplan
ETM #1 Rank39%
ETM #2 Rank29%
ETM #3 Rank6%
ETM #4 Rank26%
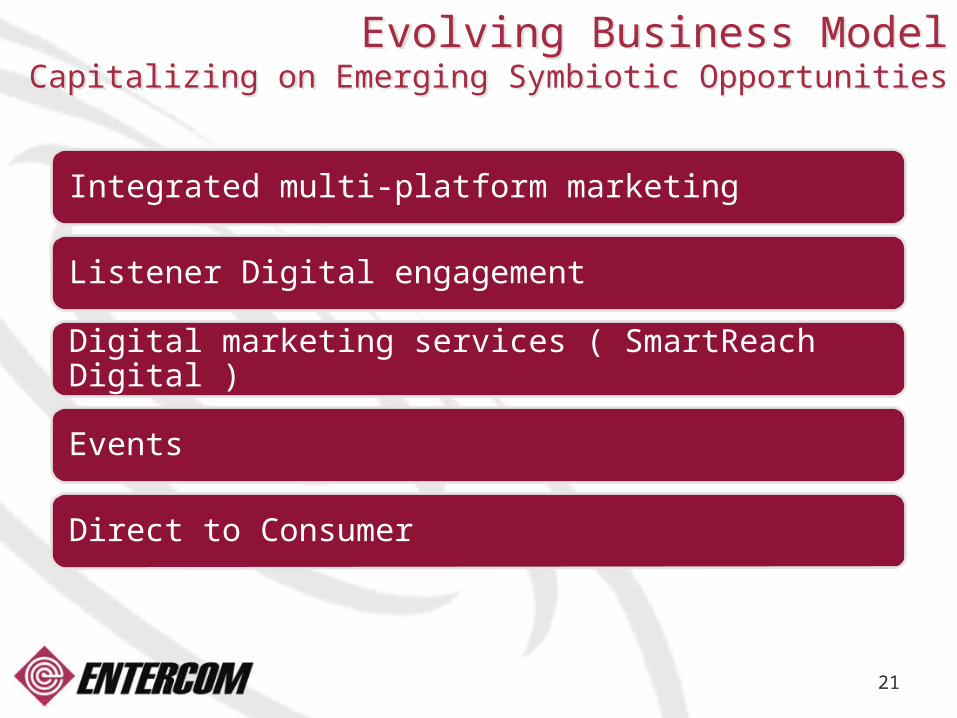
Evolving Business ModelCapitalizing on Emerging Symbiotic Opportunities
Evolving Business ModelCapitalizing on Emerging Symbiotic Opportunities
21
Integrated multi-platform marketing
Listener Digital engagement
Digital marketing services ( SmartReach Digital )
Events
Direct to Consumer

Market-Leading Local ContentMarket-Leading Local Content
22

Entercom EventsEntercom Events
23

SmartReach DigitalSmartReach Digital
24
• SmartReach Digital launched in April 2014• New local digital marketing services business
• Rolled out in 12 Entercom markets
• SmartReach products complimentary with radio
• Revenues growing steadily as business ramps up
Financial OverviewFinancial Overview

2014 Financial Review2014 Financial Review
26
• Revenues increased 1% to $380MM
• Launched SmartReach Digital in Q2 2014 which increased reported expense growth
• 2014 Adjusted EBITDA of $99MM
• $57MM of debt repaid and leverage reduced to 4.5x
• In December, announced acquisition ofLincoln Financial Media with 15 radio stations in 4 markets

Second Quarter 2015 Overview
Second Quarter 2015 Overview
27
• 2Q revenue increased slightly
• ETM revenue growth exceeded that of its markets which were down for the quarter
• Station expenses increased 2% due to SmartReach expense growth from 2Q 2014 start up
• Adjusted EBITDA decreased 5%
• 2Q leverage of 4.5x

Outstanding FreeCash Flow Generation
Outstanding FreeCash Flow Generation
28
• $1.45 per share 2014 Free Cash Flow
• Large annual tax shields and nearly $300 million in net operating loss carryforward
• Accretive LFM acquisition
• Opportunity to refinance $220MM 10.5% bonds with significant interest savings
• Refinancing could add $0.25 - $0.30 per share in incremental free cash flow

Strong FCF Generation and Disciplined Use of FCF has Driven Significant Debt Reduction
Strong FCF Generation and Disciplined Use of FCF has Driven Significant Debt Reduction
29
Entercom Net Debt Reduced by $450MM Since 2007 ($MM)
2007 August 2015
$963
$512

30
ETM Balance SheetAugust 1, 2015
ETM Balance SheetAugust 1, 2015
Amount (MM) Maturity Rate
Cash $12 N/A N/A
Revolver: ($50MM total capacity)
$42 December 2016 L + 4.75%
Term Loan B: $261 December 2018 L + 3.00%1.00% LIBOR floor
Sr. Sub. Notes: $220 December 201910.5%
Can be called December 2015 at 105.25

Non-GAAP Reconcilations
Non-GAAP Reconcilations

Non-GAAP ReconciliationsNon-GAAP Reconciliations
32
Calculation of GAAP Operating Income To Free Cash Flow: Operating Income $ 85,576 Depreciation And Amortization 7,794 Non-Cash Compensation Expense 5,232
Impairment Loss - Interest Expense, Net of Interest and Dividend Income And Exclusive of Deferred Financing Costs And Original Issue Discount (34,656) Capital Expenditures (8,408) Merger and acquisition costs 1,042 Net (Gain) Loss On Sale Or Disposal Of Assets (379) Income Taxes Paid (79) Free Cash Flow $ 56,122
Free Cash Flow Per Share - Diluted Weighted Average Shares - Diluted 38,664
Free Cash Flow Per Share - Diluted $ 1.45
Years EndedDecember 31,
2014

Non-GAAP ReconciliationsNon-GAAP Reconciliations
33
Reconciliation Of GAAP Net Income To Adjusted EBITDA Net Income $ 26,823 Income Taxes 19,911 Total Other Expense 38,842 Corporate Expenses - Non-Cash Compensation Expense 4,313 Station Expenses - Non-Cash Compensation Expense 919 Depreciation And Amortization 7,794 Impairment Loss - Merger and acquisition costs 1,042 Net (Gain) Loss On Sale Or Disposal Of Assets (379) Adjusted EBITDA $ 99,265
2014
Company Overview
August 2015
Company Overview
August 2015