COMPANY OVERVIEW -...
36
COMPANY OVERVIEW MARCH 2015
Transcript of COMPANY OVERVIEW -...
COMPANY OVERVIEW MARCH 2015
DISCLAIMER
2
Some of the statements made in this presentation are forward-looking statements and are based on the current beliefs, assumptions, expectations, estimates, objectives and projections of the directors and management of Zee Entertainment Enterprises Limited (ZEE) about its business and the industry and markets in which it operates.
These forward-looking statements include, without limitation, statements relating to revenues and earnings.
The words “believe”, “anticipate”, “expect”, “estimate”, “intend”, “project” and similar expressions are also intended to identify forward looking statements.
These statements are not guarantees of future performance and are subject to risks, uncertainties and other factors, some of which are beyond the control of the Company and are difficult to predict. Consequently, actual results could differ materially from those expressed or forecast in the forward-looking statements as a result of, among other factors, changes in economic and market conditions, changes in the regulatory environment and other business and operational risks. ZEE does not undertake to update these forward-looking statements to reflect events or circumstances that may arise after publication.
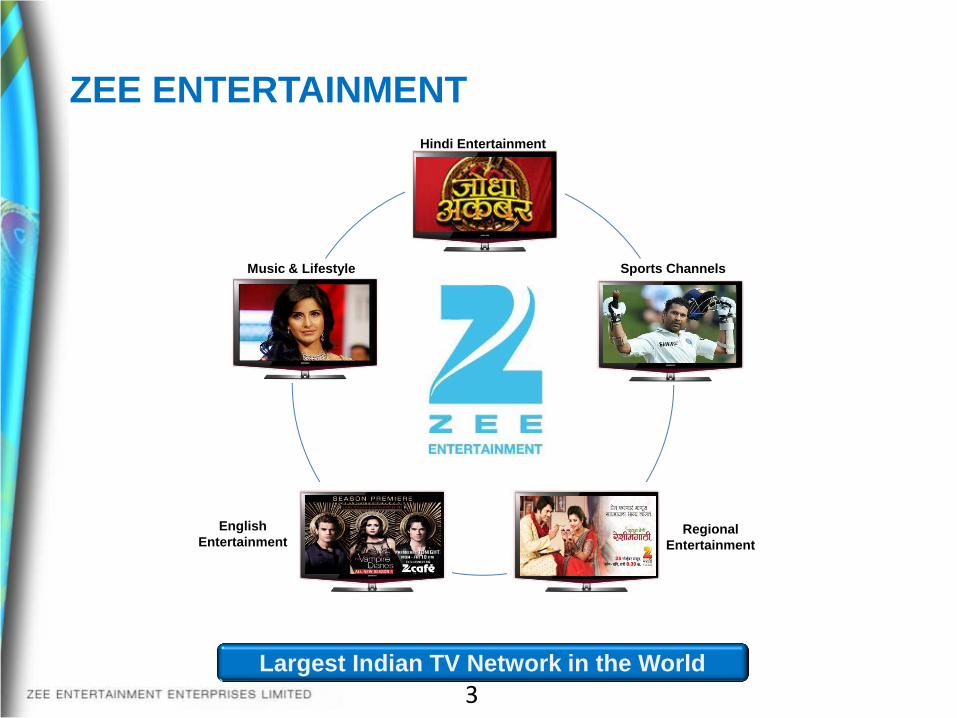
ZEE ENTERTAINMENT
Largest Indian TV Network in the World
Sports Channels
Regional
Entertainment
Music & Lifestyle
Hindi Entertainment
English
Entertainment
3

Leading Hindi Entertainment Network
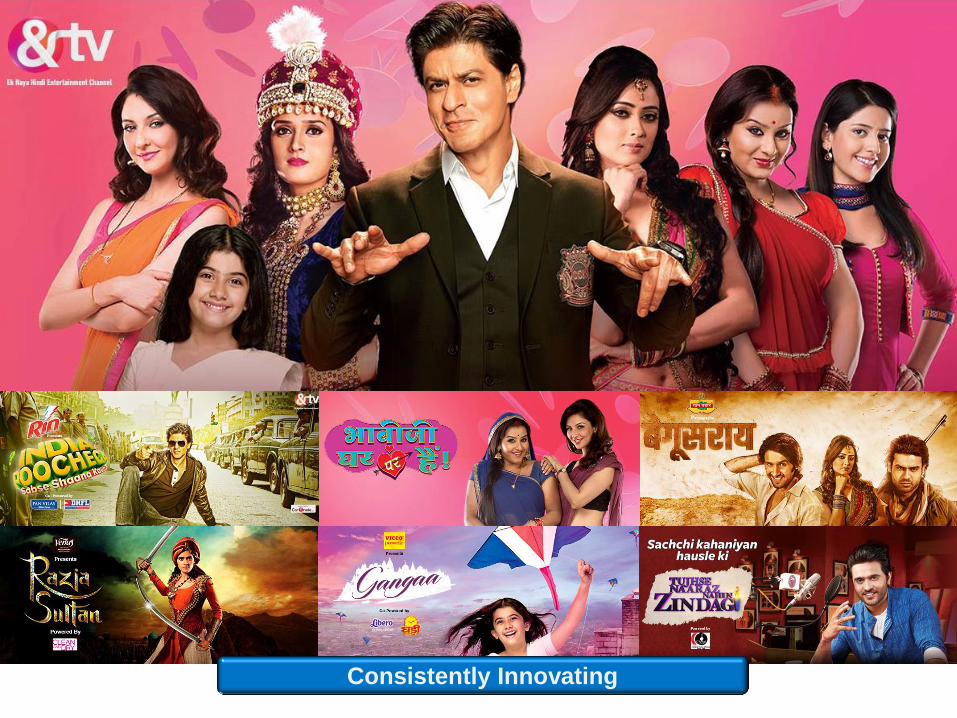
Consistently Innovating

Leading Sports Network

ZEE MARATHI
Leading Regional Entertainment Network
English Entertainment
9
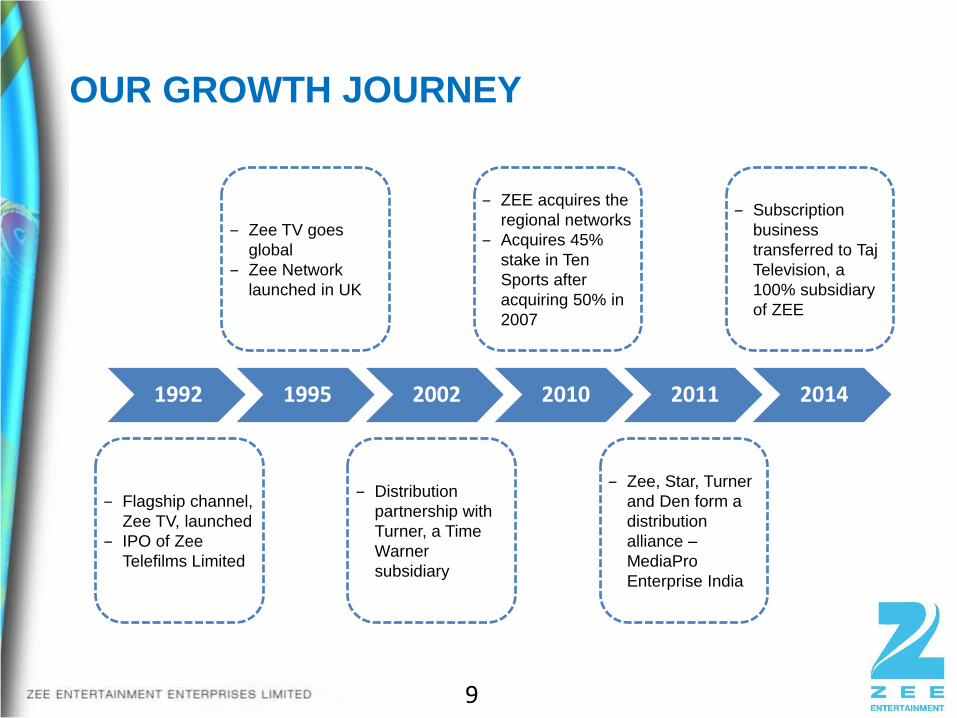
1992 1995 2002 2010 2011 2014
‒ Flagship channel,
Zee TV, launched
‒ IPO of Zee
Telefilms Limited
‒ Zee TV goes
global
‒ Zee Network
launched in UK
‒ Distribution
partnership with
Turner, a Time
Warner
subsidiary
‒ ZEE acquires the
regional networks
‒ Acquires 45%
stake in Ten
Sports after
acquiring 50% in
2007
‒ Zee, Star, Turner
and Den form a
distribution
alliance –
MediaPro
Enterprise India
‒ Subscription
business
transferred to Taj
Television, a
100% subsidiary
of ZEE
OUR GROWTH JOURNEY
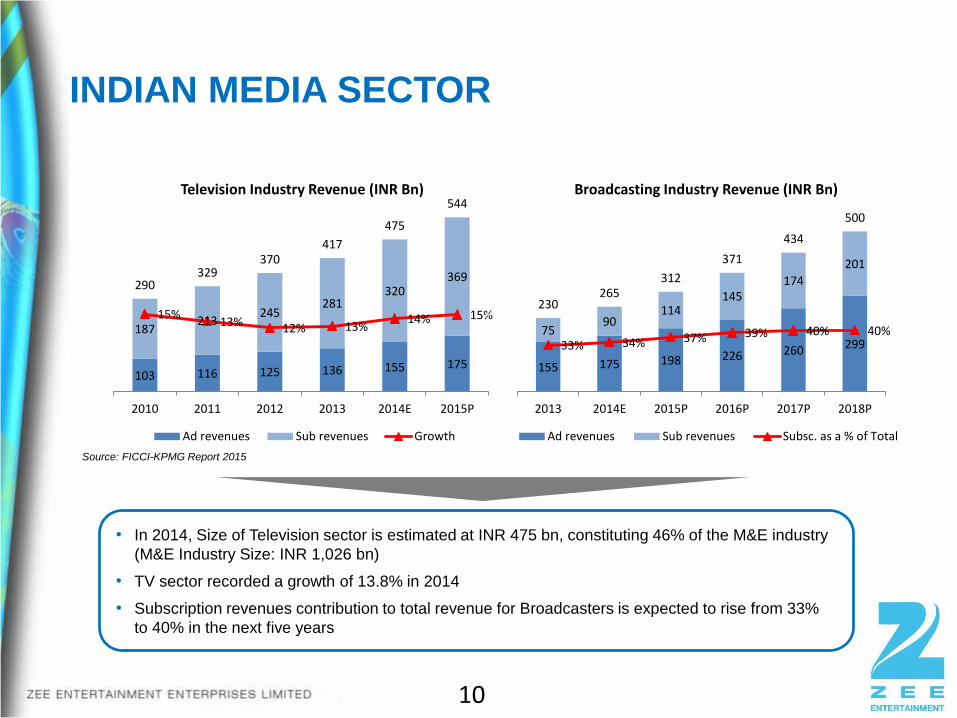
• In 2014, Size of Television sector is estimated at INR 475 bn, constituting 46% of the M&E industry
(M&E Industry Size: INR 1,026 bn)
• TV sector recorded a growth of 13.8% in 2014
• Subscription revenues contribution to total revenue for Broadcasters is expected to rise from 33%
to 40% in the next five years
INDIAN MEDIA SECTOR
Source: FICCI-KPMG Report 2015
10
103 116 125 136 155 175
187 213
245 281
320 369
290 329
370 417
475
544
15% 13% 12% 13%
14% 15%
0%
5%
10%
15%
20%
25%
30%
-50
50
150
250
350
450
550
2010 2011 2012 2013 2014E 2015P
Television Industry Revenue (INR Bn)
Ad revenues Sub revenues Growth
155 175 198 226 260 299 75
90 114
145 174
201
230 265
312
371
434
500
33% 34% 37% 39% 40% 40%
0%
20%
40%
60%
80%
100%
-50
50
150
250
350
450
550
2013 2014E 2015P 2016P 2017P 2018P
Broadcasting Industry Revenue (INR Bn)
Ad revenues Sub revenues Subsc. as a % of Total
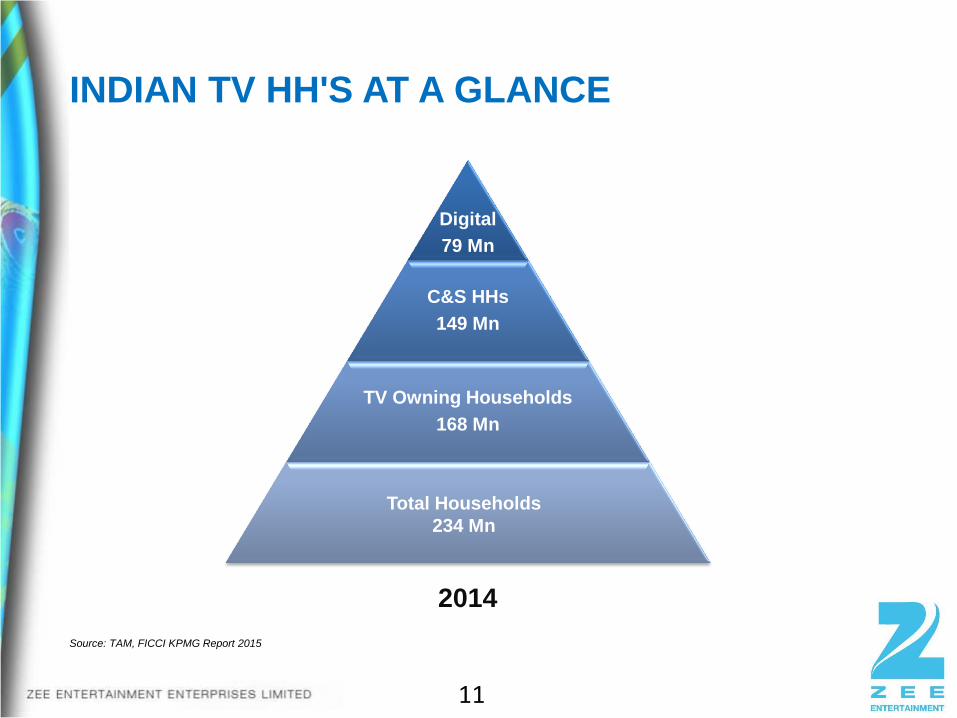
INDIAN TV HH'S AT A GLANCE
Digital
79 Mn
C&S HHs
149 Mn
TV Owning Households
168 Mn
Total Households
234 Mn
2014
Source: TAM, FICCI KPMG Report 2015
11
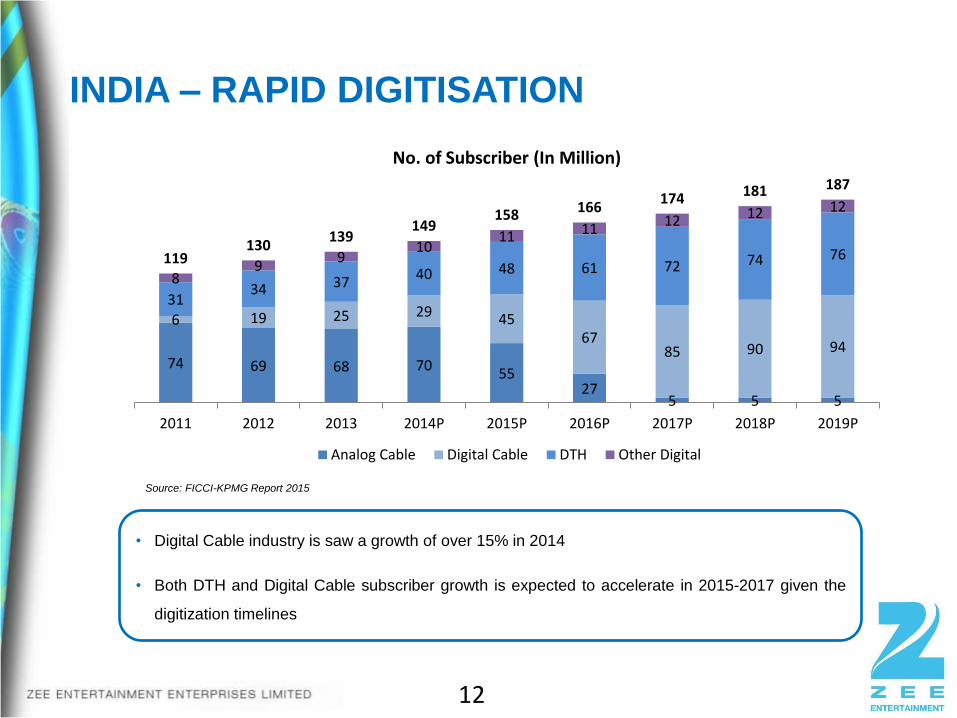
INDIA – RAPID DIGITISATION
Source: FICCI-KPMG Report 2015
12
• Digital Cable industry is saw a growth of over 15% in 2014
• Both DTH and Digital Cable subscriber growth is expected to accelerate in 2015-2017 given the
digitization timelines
74 69 68 70 55
27 5 5 5
6 19 25 29 45 67
85 90 94
31 34 37
40 48 61 72 74 76
8 9
9 10
11 11 12 12 12
119 130
139 149
158 166 174 181 187
2011 2012 2013 2014P 2015P 2016P 2017P 2018P 2019P
No. of Subscriber (In Million)
Analog Cable Digital Cable DTH Other Digital
13
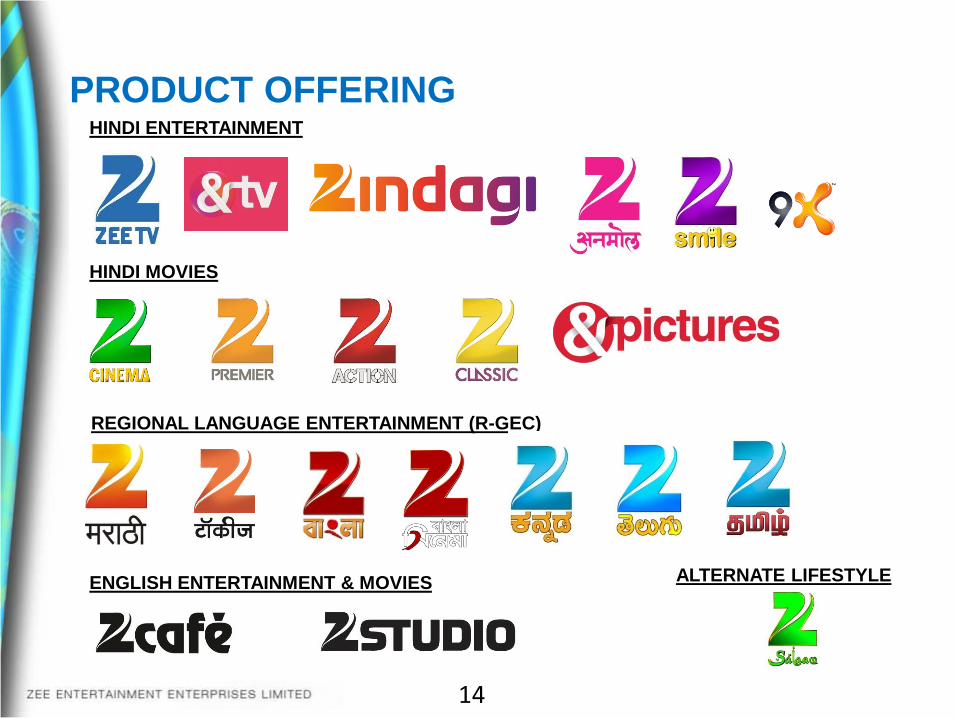
PRODUCT OFFERING HINDI ENTERTAINMENT
HINDI MOVIES
REGIONAL LANGUAGE ENTERTAINMENT (R-GEC)
14
ENGLISH ENTERTAINMENT & MOVIES ALTERNATE LIFESTYLE
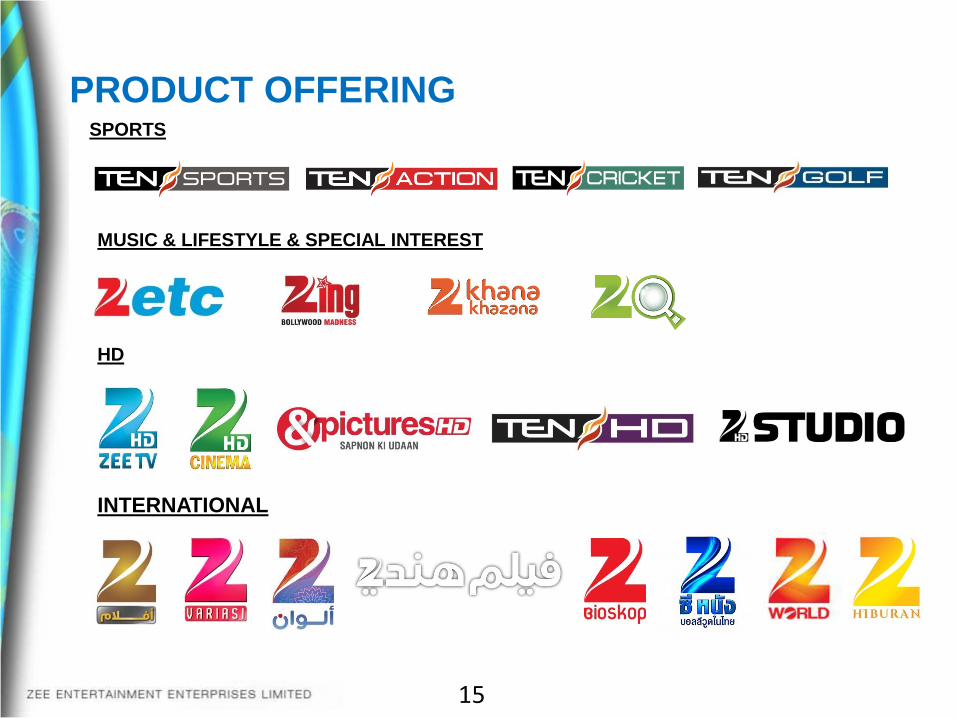
PRODUCT OFFERING SPORTS
MUSIC & LIFESTYLE & SPECIAL INTEREST
15
HD
INTERNATIONAL
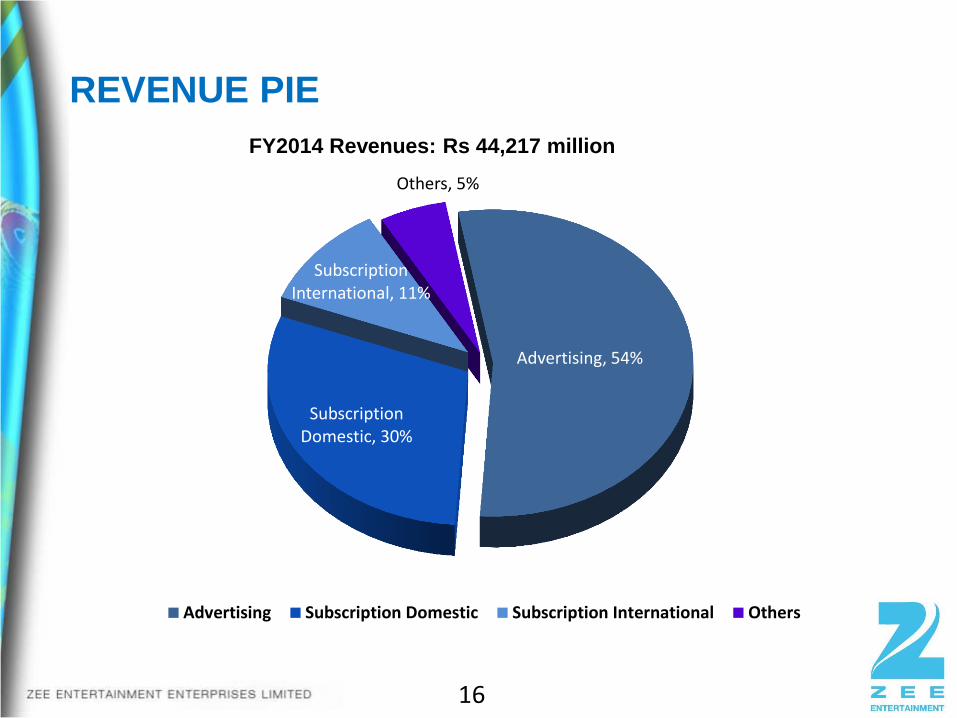
Advertising, 54%
Subscription Domestic, 30%
Subscription International, 11%
Others, 5%
Advertising Subscription Domestic Subscription International Others
REVENUE PIE
16
FY2014 Revenues: Rs 44,217 million

BUSINESS
PERFORMANCE
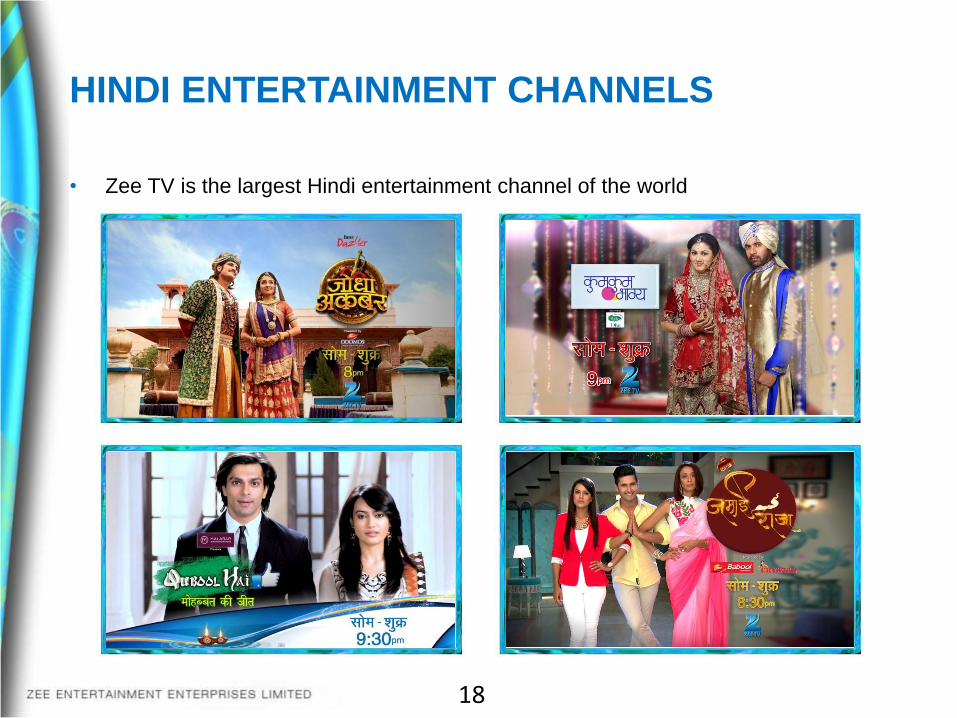
HINDI ENTERTAINMENT CHANNELS
• Zee TV is the largest Hindi entertainment channel of the world
18
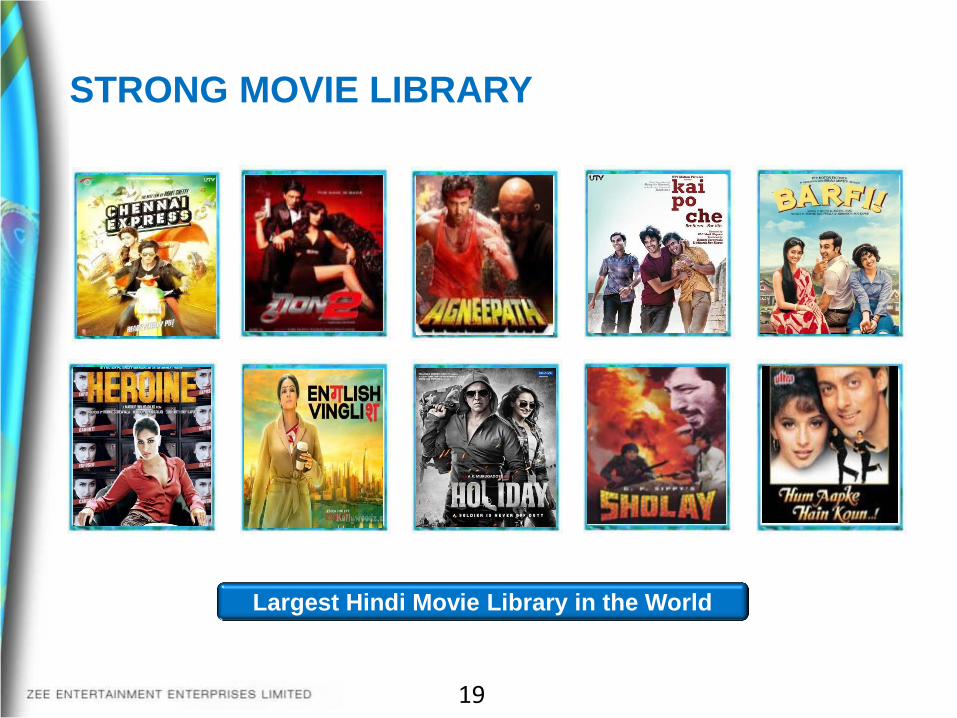
STRONG MOVIE LIBRARY
19
Largest Hindi Movie Library in the World
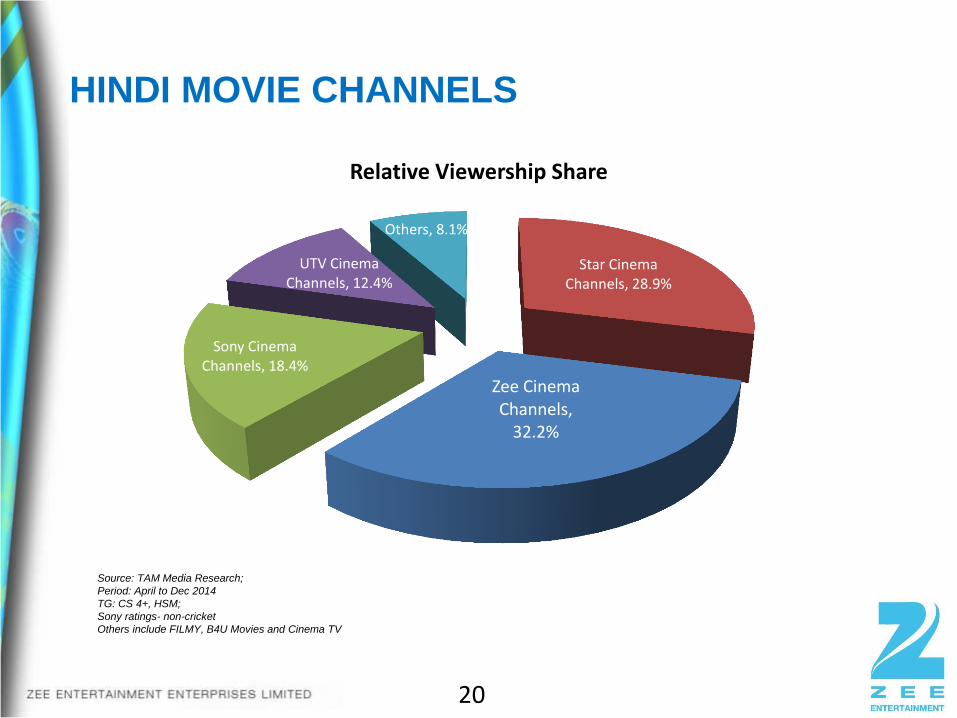
HINDI MOVIE CHANNELS
20
Source: TAM Media Research;
Period: April to Dec 2014
TG: CS 4+, HSM;
Sony ratings- non-cricket
Others include FILMY, B4U Movies and Cinema TV
Star Cinema Channels, 28.9%
Zee Cinema Channels,
32.2%
Sony Cinema Channels, 18.4%
UTV Cinema Channels, 12.4%
Others, 8.1%
Relative Viewership Share

21
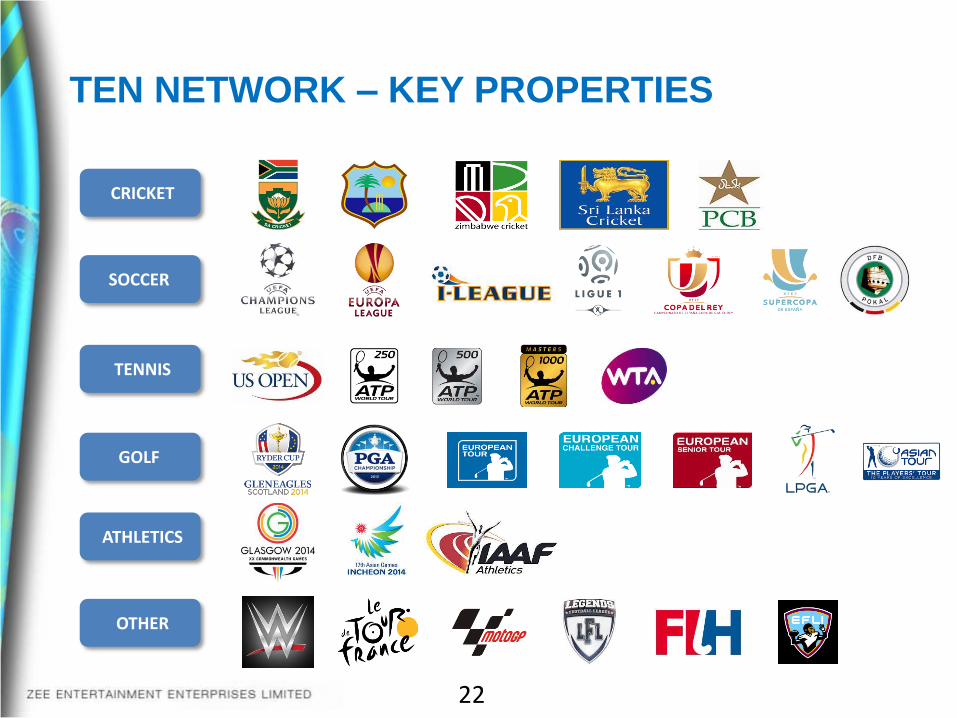
TEN NETWORK – KEY PROPERTIES
22
CRICKET
SOCCER
TENNIS
ATHLETICS
GOLF
OTHER
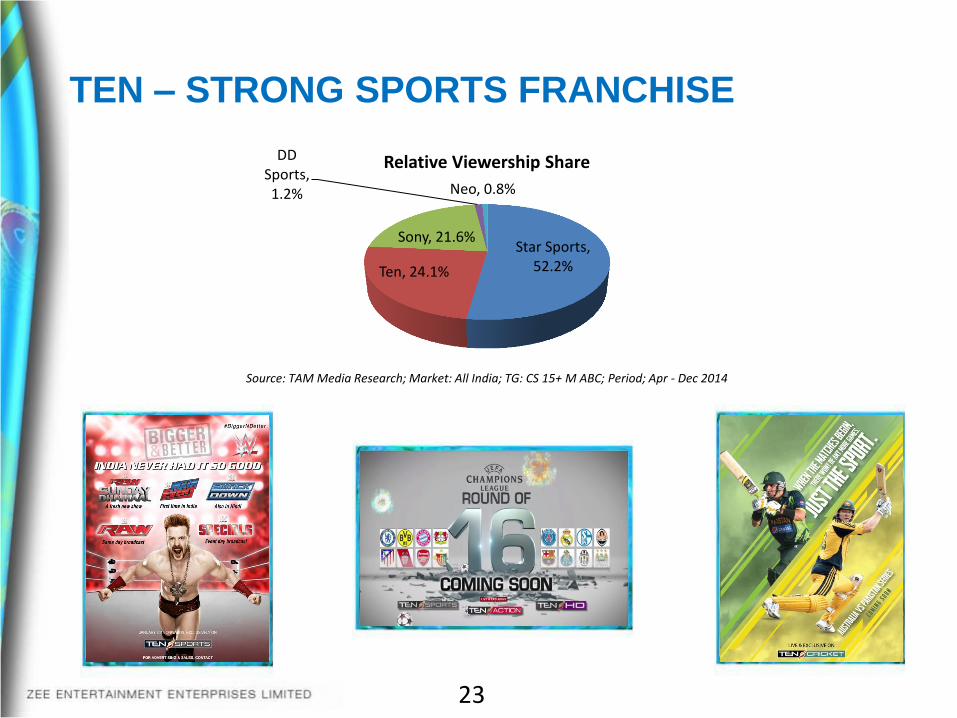
TEN – STRONG SPORTS FRANCHISE
23
Source: TAM Media Research; Market: All India; TG: CS 15+ M ABC; Period; Apr - Dec 2014
Star Sports, 52.2% Ten, 24.1%
Sony, 21.6%
DD Sports, 1.2% Neo, 0.8%
Relative Viewership Share
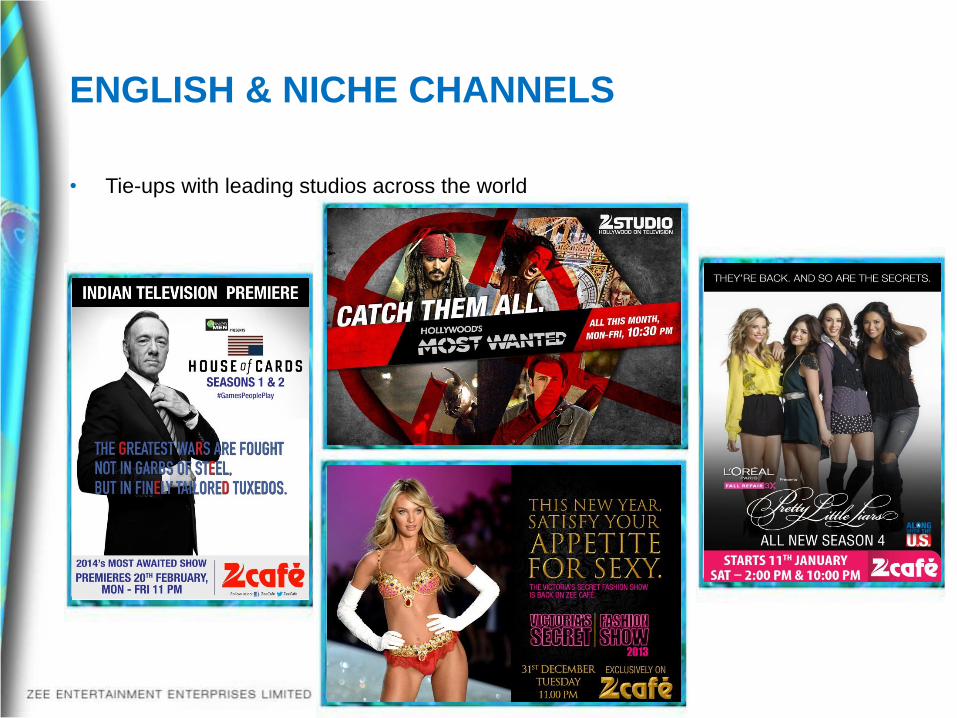
ENGLISH & NICHE CHANNELS
• Tie-ups with leading studios across the world
24
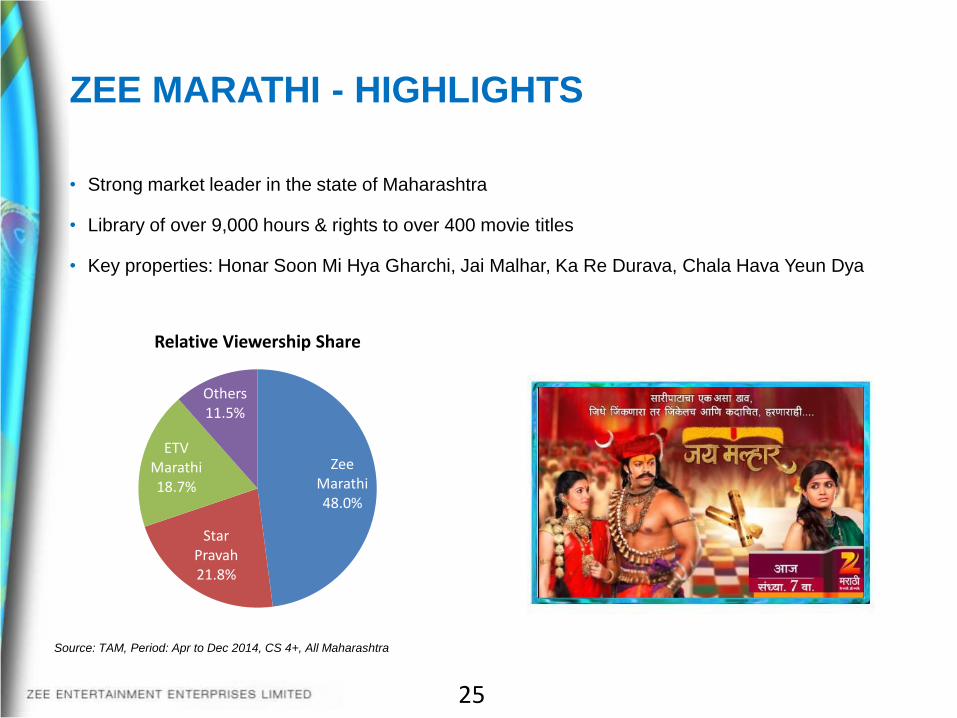
ZEE MARATHI - HIGHLIGHTS
• Strong market leader in the state of Maharashtra
• Library of over 9,000 hours & rights to over 400 movie titles
• Key properties: Honar Soon Mi Hya Gharchi, Jai Malhar, Ka Re Durava, Chala Hava Yeun Dya
25
Source: TAM, Period: Apr to Dec 2014, CS 4+, All Maharashtra
Zee Marathi 48.0%
Star Pravah 21.8%
ETV Marathi 18.7%
Others 11.5%
Relative Viewership Share
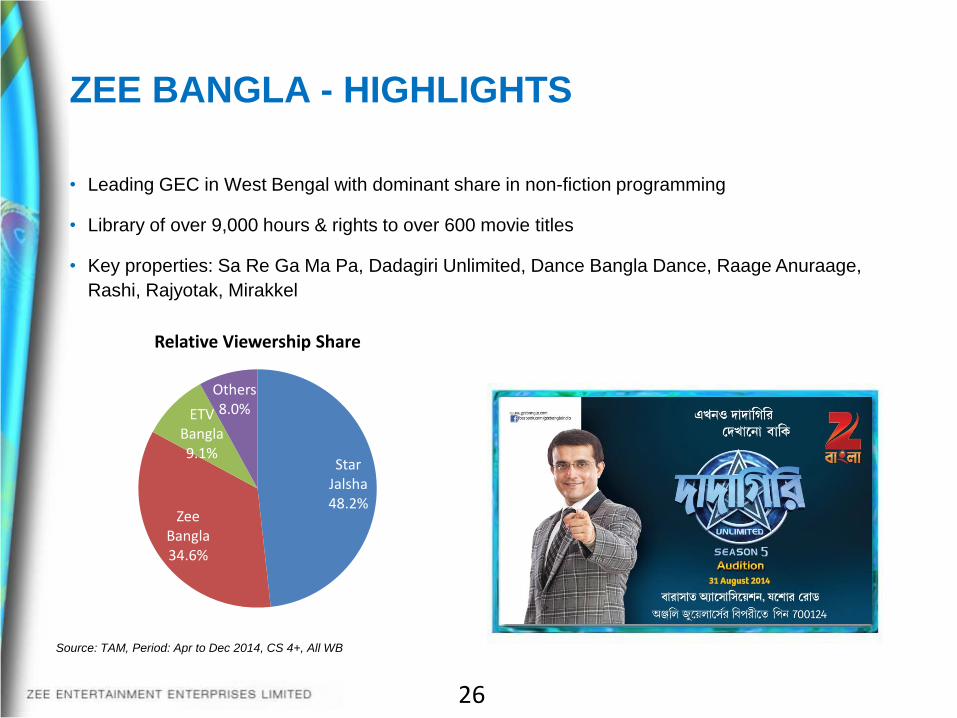
ZEE BANGLA - HIGHLIGHTS
• Leading GEC in West Bengal with dominant share in non-fiction programming
• Library of over 9,000 hours & rights to over 600 movie titles
• Key properties: Sa Re Ga Ma Pa, Dadagiri Unlimited, Dance Bangla Dance, Raage Anuraage,
Rashi, Rajyotak, Mirakkel
26
Source: TAM, Period: Apr to Dec 2014, CS 4+, All WB
Star Jalsha 48.2%
Zee Bangla 34.6%
ETV Bangla 9.1%
Others 8.0%
Relative Viewership Share
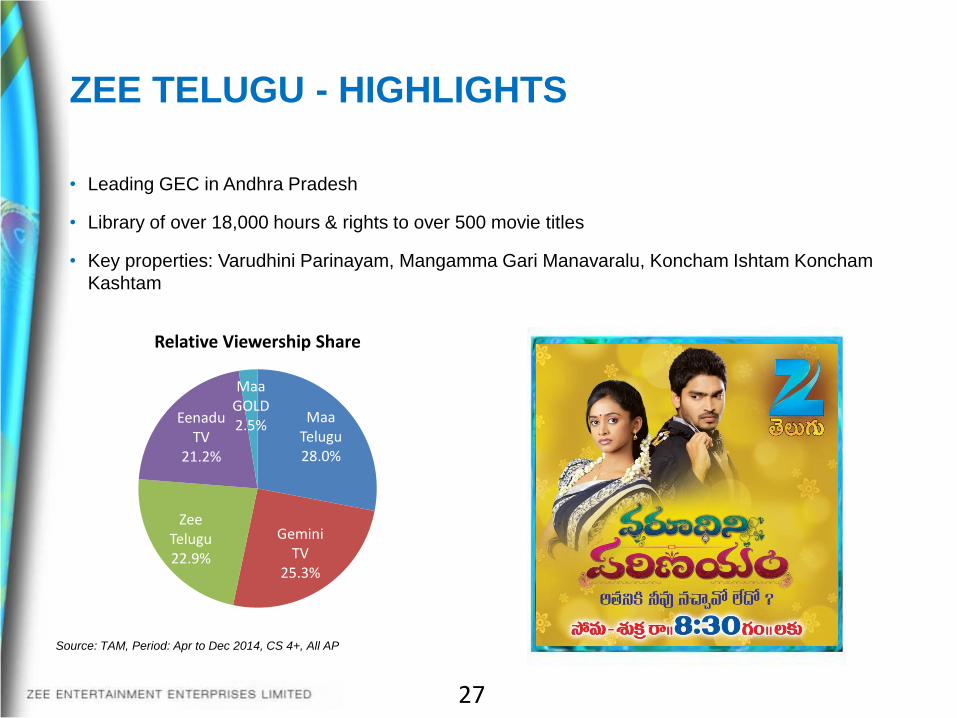
ZEE TELUGU - HIGHLIGHTS
• Leading GEC in Andhra Pradesh
• Library of over 18,000 hours & rights to over 500 movie titles
• Key properties: Varudhini Parinayam, Mangamma Gari Manavaralu, Koncham Ishtam Koncham
Kashtam
27
Source: TAM, Period: Apr to Dec 2014, CS 4+, All AP
Maa Telugu 28.0%
Gemini TV
25.3%
Zee Telugu 22.9%
Eenadu TV
21.2%
Maa GOLD 2.5%
Relative Viewership Share
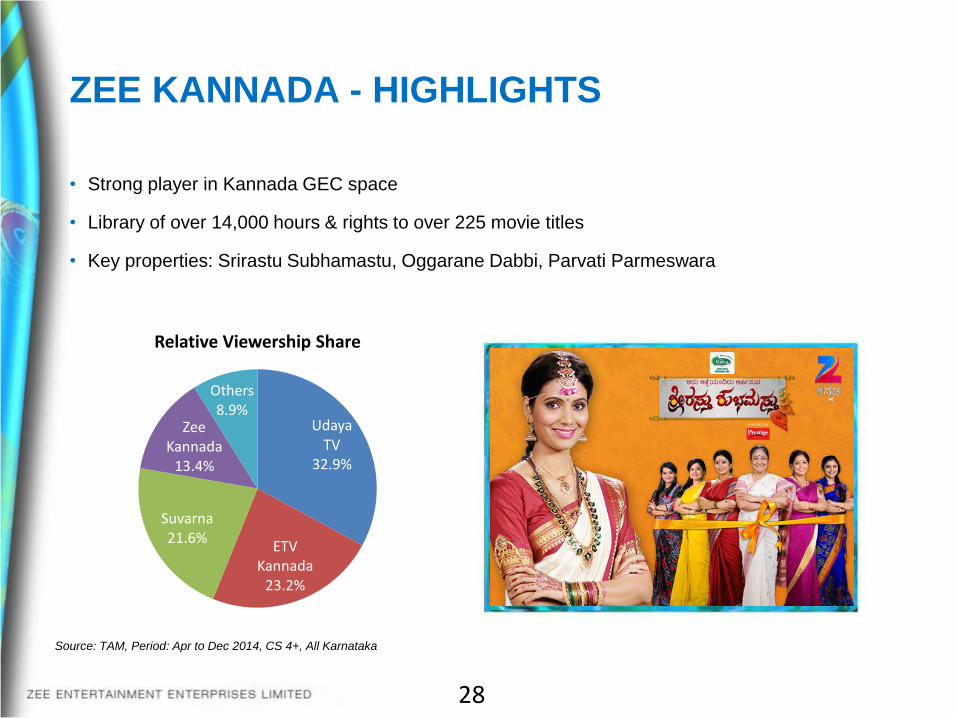
ZEE KANNADA - HIGHLIGHTS
• Strong player in Kannada GEC space
• Library of over 14,000 hours & rights to over 225 movie titles
• Key properties: Srirastu Subhamastu, Oggarane Dabbi, Parvati Parmeswara
28
Source: TAM, Period: Apr to Dec 2014, CS 4+, All Karnataka
Udaya TV
32.9%
ETV Kannada
23.2%
Suvarna 21.6%
Zee Kannada
13.4%
Others 8.9%
Relative Viewership Share
• Presence across 5 continents through
over 34 dedicated channels
• Catering to both South Asian as well as
non South Asian communities
• Recent local language launches in
Indonesia, Saudi Arabia, Russia
• International subscription contributed
11% of company top line in FY2014
• Renewed focus on advertising as a
source of revenues
INTERNATIONAL OPERATIONS
29
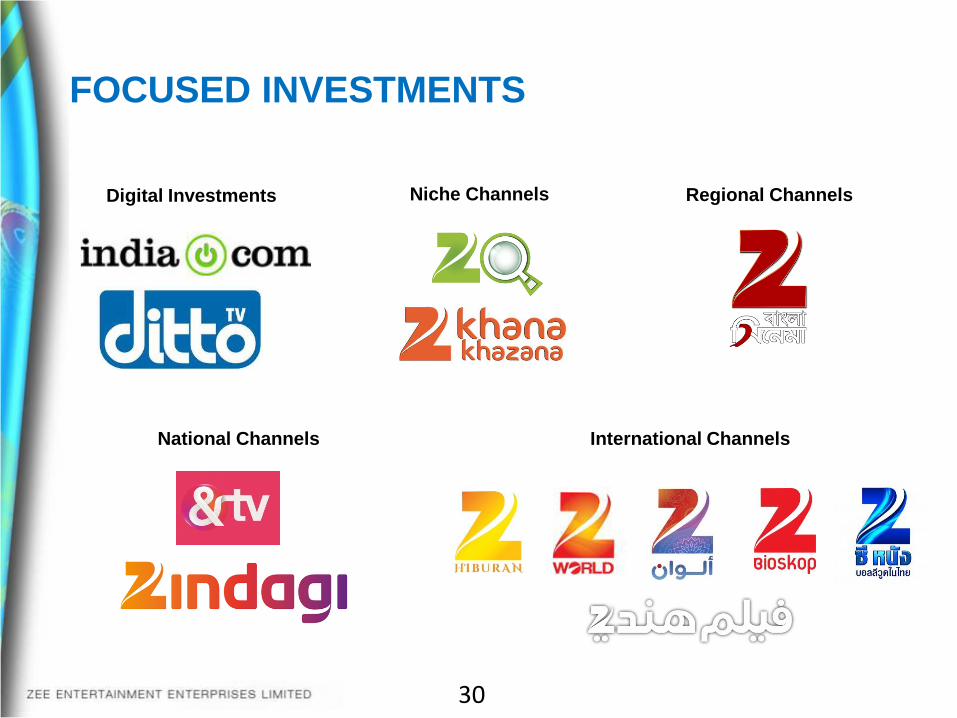
FOCUSED INVESTMENTS
Digital Investments Regional Channels
National Channels
30
Niche Channels
International Channels

KEY FINANCIALS
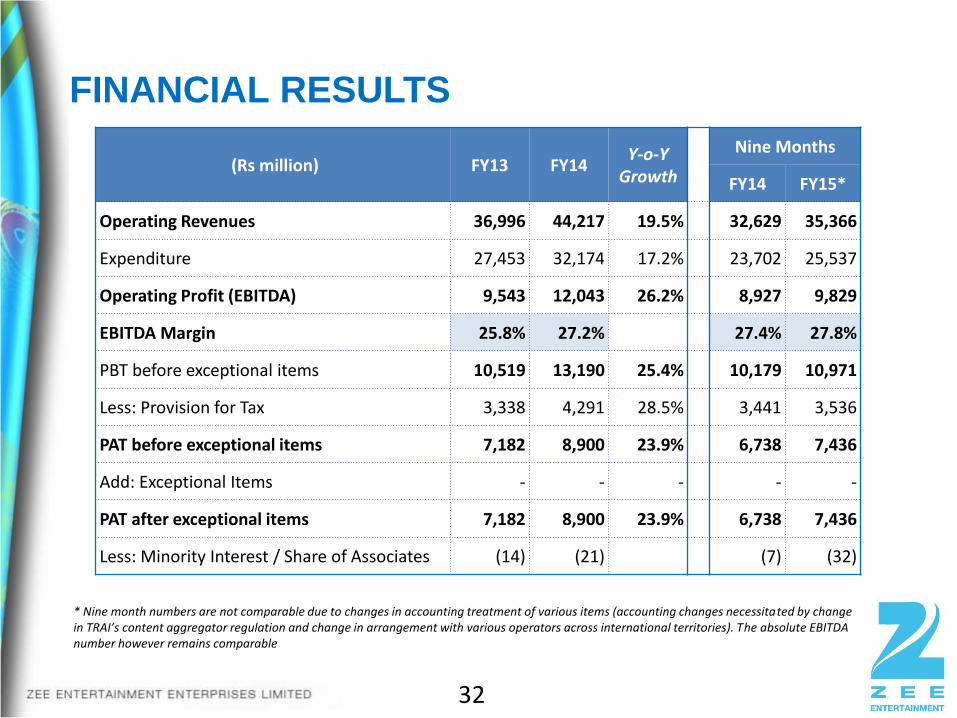
FINANCIAL RESULTS
32
* Nine month numbers are not comparable due to changes in accounting treatment of various items (accounting changes necessitated by change in TRAI’s content aggregator regulation and change in arrangement with various operators across international territories). The absolute EBITDA number however remains comparable
(Rs million) FY13 FY14 Y-o-Y
Growth
Nine Months
FY14 FY15*
Operating Revenues 36,996 44,217 19.5% 32,629 35,366
Expenditure 27,453 32,174 17.2% 23,702 25,537
Operating Profit (EBITDA) 9,543 12,043 26.2% 8,927 9,829
EBITDA Margin 25.8% 27.2% 27.4% 27.8%
PBT before exceptional items 10,519 13,190 25.4% 10,179 10,971
Less: Provision for Tax 3,338 4,291 28.5% 3,441 3,536
PAT before exceptional items 7,182 8,900 23.9% 6,738 7,436
Add: Exceptional Items - - - - -
PAT after exceptional items 7,182 8,900 23.9% 6,738 7,436
Less: Minority Interest / Share of Associates (14) (21) (7) (32)
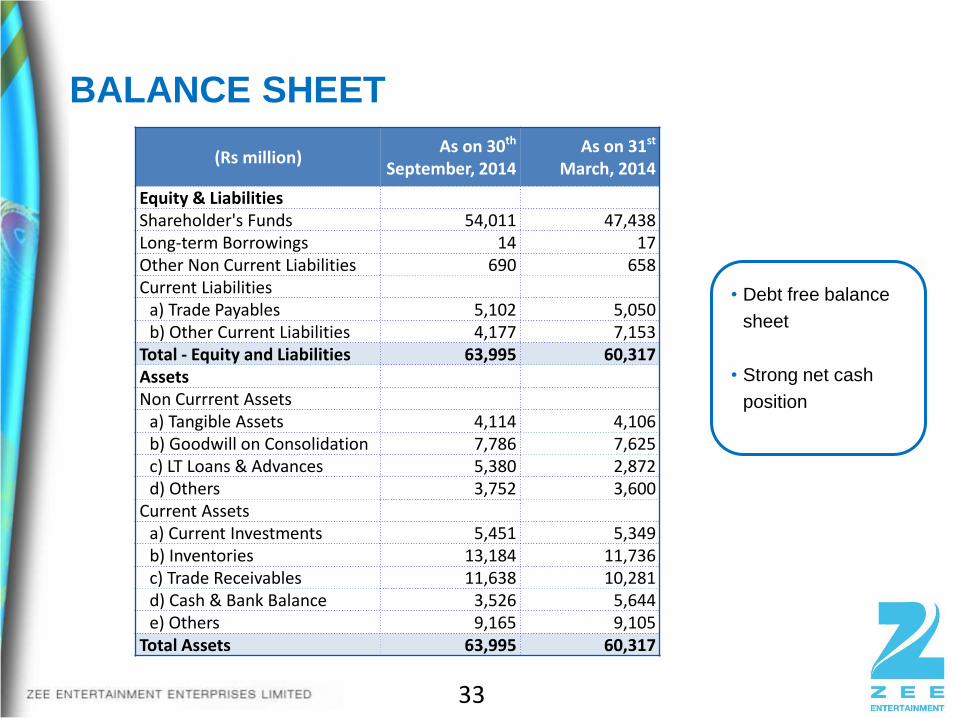
BALANCE SHEET
33
• Debt free balance
sheet
• Strong net cash
position
(Rs million) As on 30th
September, 2014 As on 31st
March, 2014
Equity & Liabilities Shareholder's Funds 54,011 47,438 Long-term Borrowings 14 17 Other Non Current Liabilities 690 658 Current Liabilities
a) Trade Payables 5,102 5,050 b) Other Current Liabilities 4,177 7,153
Total - Equity and Liabilities 63,995 60,317 Assets Non Currrent Assets
a) Tangible Assets 4,114 4,106 b) Goodwill on Consolidation 7,786 7,625 c) LT Loans & Advances 5,380 2,872 d) Others 3,752 3,600
Current Assets a) Current Investments 5,451 5,349 b) Inventories 13,184 11,736 c) Trade Receivables 11,638 10,281 d) Cash & Bank Balance 3,526 5,644 e) Others 9,165 9,105
Total Assets 63,995 60,317
21,998
30,088 30,406
36,996
44,217
6,135 8,219 7,396
9,543 12,043
FY2010 FY2011 FY2012 FY2013 FY2014
Revenues and Operating Profit (Rs in mm)
Revenue Operating profit (EBITDA)
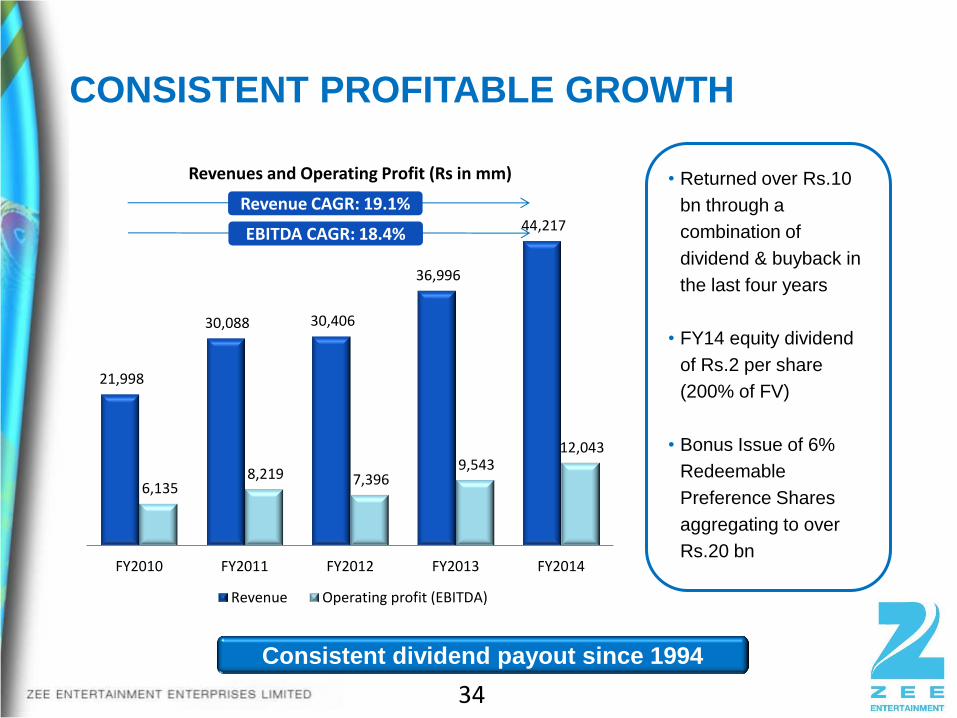
CONSISTENT PROFITABLE GROWTH
34
Consistent dividend payout since 1994
Revenue CAGR: 19.1%
EBITDA CAGR: 18.4%
• Returned over Rs.10
bn through a
combination of
dividend & buyback in
the last four years
• FY14 equity dividend
of Rs.2 per share
(200% of FV)
• Bonus Issue of 6%
Redeemable
Preference Shares
aggregating to over
Rs.20 bn
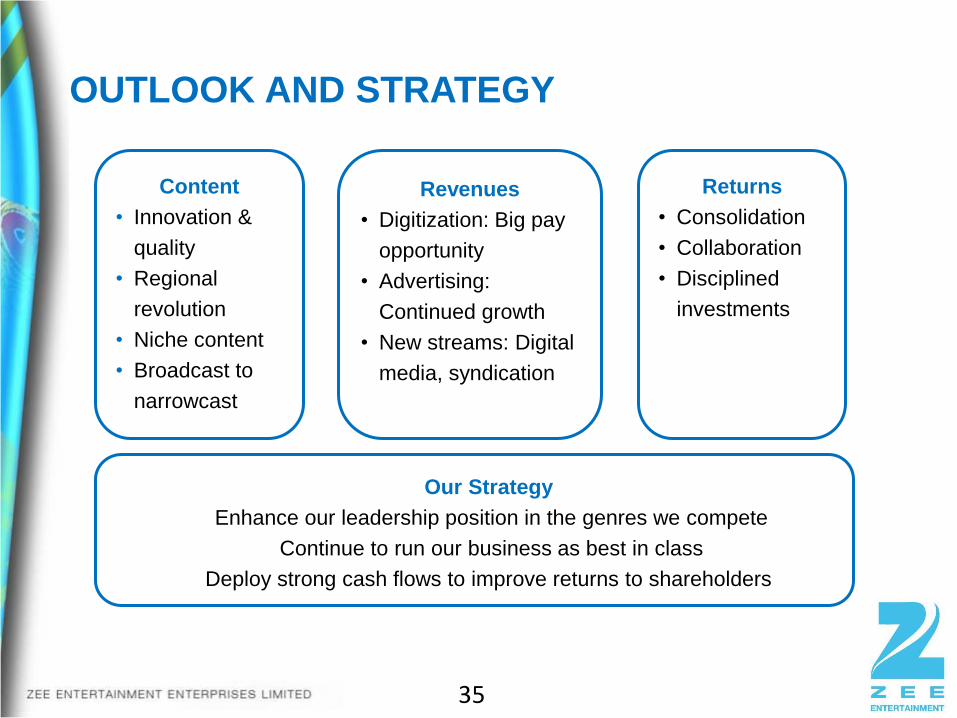
OUTLOOK AND STRATEGY
35
Revenues
• Digitization: Big pay
opportunity
• Advertising:
Continued growth
• New streams: Digital
media, syndication
Content
• Innovation &
quality
• Regional
revolution
• Niche content
• Broadcast to
narrowcast
Our Strategy
Enhance our leadership position in the genres we compete
Continue to run our business as best in class
Deploy strong cash flows to improve returns to shareholders
Returns
• Consolidation
• Collaboration
• Disciplined
investments
36
Pioneer in several entertainment genres
World’s leading Indian TV network with 960 million viewers in over 169 countries
Consistent performer since inception; Shareholder value CAGR of >30% since listing
The global force in entertainment