Comp Env 2007 Chp3
54
Chapter Three Biodiversity
-
Upload
robin-shergill -
Category
Documents
-
view
218 -
download
0
Transcript of Comp Env 2007 Chp3

8/14/2019 Comp Env 2007 Chp3
http://slidepdf.com/reader/full/comp-env-2007-chp3 1/54
Chapter Three
Biodiversity

8/14/2019 Comp Env 2007 Chp3
http://slidepdf.com/reader/full/comp-env-2007-chp3 2/54
CHAPTER THREE
BIODIVERSITY
3.1 The term ‘biodiversity’ encompassesthe variety of life on Earth. It is defined as
the variability among living organisms and
the ecological complexes of which they are
part, including diversity within and between
species and ecosystems. Biodiversity
manifests at species genetic and ecosystem
levels. Biodiversity has direct consumptive
value in food, agriculture, medicine,
industry, etc. It also has aesthetic and
recreational value.
3.2 India is one of the 12 mega-
biodiversity countries of the world. From
about 70% of the total geographical area
surveyed so far, 46,000 plant species and
81,000 animal species representing about
7% of the worlds flora and 6.5% of the
world's fauna, respectively, have been
described. Out of the total twelve
biodiversity hot spots in the world, India has
two, one is the north east region and other the western ghats.
3.3 Though more than one-fifth of
India’s geographic area is recorded as forest
area, it is not known with certainity how
much forest area actually bears forest cover.
The National Forest Policies (1952 and
1988) aim at having one third of country’s
land area under forest and tree cover. As per
the latest State of Forest Reort 2003 , the
forest cover in the country is 678,333 kmsq.and constitutes 20.64 percent of its
geographic area. There is an increase of
2,795 kmsq or 0.41 percent in forest cover
in year 2003 as compared to assessment
made in 2001. The total tree cover of the
country has been estimated as 99,896 km sq.
or about 3.04 percent of the country’s
geographic area, which is 18,424 kmsq
more than what was assessed in 2001.
3.4 Plant biodiversity as a national andglobal resource is extremely valuable but is
poorly understood, inadequatelydocumented and often wasted. The
preservation of biodiversity is both a matter
of investment and insurance to a) sustain
and improve agricultural, forestry and
fisheries production, b) act as a buffer
against harmful environmental changes, c)
provide raw materials for scientific and
industrial innovations, and d) safe guard
transferring biological richness to future
generations.
3.5 Biodiversity the world over is in
peril because the habitats are threatened due
to such development programmes as
creation of reservoirs, mining, forest
clearing, laying of transport and
communication networks, etc. It is
estimated that in the world wide
perspective, slightly over 1000 animal
species and sub-species are threatened with
an extinction rate of one per year, while20,000 flowering plants are thought to be at
risk.
Conservation Measures
Biospheres:
3.6 Areas rich in biodiversity and
encompassing unique and representative
ecosystems are identified and designated as
Biosphere Reserves. The goal is to facilitateconservation of representative landscape
and India's immense biological diversity as
described above. Till date, 14 Biosphere
Reserves have been set up. The last one was
set up in 30.3.2005 at Achankmar-
Amarkantak in parts of Districts of MP and
Chattisgarh State.
Project Tiger
3.7 As per the recommendations of aspecial task-force of the Indian Board of

8/14/2019 Comp Env 2007 Chp3
http://slidepdf.com/reader/full/comp-env-2007-chp3 3/54
Wildlife, Project Tiger was launched in
1973 with the following objectives:-
• To ensure maintenance of available
population of tiger in India for
scientific, economic, aesthetic,
cultural and ecological value.• To preserve, for all times, the areas
of such biological importance as a
national heritage for the benefit,
education and enjoyment of the
people.
3.8 At present, there are 28 Tiger
Reserves spreading over 14 states and
covering an area of about 37,761 sq. kms.
The population of tigers is estimated
through tiger census conducted once in 4 to
6 years. The last such census was
conducted in 2001-02.
National Parks and Wild life Sanctuaries
The wild life Act provided for setting up
National parks and sanctuaries for wild life.
The basic idea in trying to encourage wild
life .is that human welfare is initially linked
with it. The Government of India has pledged for all out efforts to conserve which
not only seeks to protect and preserve what
remains of wild fauna and flora but also
seeks to augment this priceless national
heritage.
3.9 Multipronged pressures on forests
come from population, cattle grazing, fuel
and fodder collection, industry and forest
fires, etc. The remaining good forest cover
is, therefore, estimated to be just 11%against the desirable 33% of the total land
area as per the National Forest Policy. Up
to the late seventies, forest land was a prime
target for diversion for resettlement,
agriculture and industrialization, and this
trend was contained only by the
Forest (Conservation) Act, 1980.
3.12 The National Bureau of Plant
Genetic Resources (NBGR) established in
1976 as an institution under Indian Councilof Agricultural Research (ICAR) emerged
as an important organization dealing with
various establishments of plant genetic
resources. The organization is entrusted
with the vital responsibility of germ plasm,
exchange with appropriate quarantine
measures, survey exploration, their
organization, planning and coordination,
comprising evaluation, documentation and
conservation of diverse plant genetic
resources. The National Gene Bank has also been established within the complex. Within
3.10 A two pronged strategy to increase
forest cover essentially comprises
• Improving canopy cover in the forestland; and
• Undertaking afforestation in non-
forest and degraded lands, preferably
contiguous to forest blocks.
3.11 Realising the role of forests in
controlling soil erosion, moderation of floods, recharging of ground aquifers, as
habitat for wildlife, conservation of bio-
diversity and gene pool, etc., programmes
were launched as early as the Second Five
Year Plan for extensive Watershed
Management followed later by
establishment of a Protected Areas Network,
under the Wildlife (Protection) Act, 1972,
comprising of Biosphere Reserves, National
Parks and Sanctuaries- both terrestrial and
aquatic. This Network comprised of 14Biosphere Reserves, 90 National Parks, 502
Wildlife Sanctuaries, along with such
dedicated conservation programmes as
Project Tiger, Crocodile Rehabilitation and
Project Elephant. The Central Zoo
Authority caters to the ex-situ conservation
of wildlife through 275 zoos, deer parks,
safari parks and aquaria, etc. India is a also
signatory to several International
Conventions like CITES, International
Whaling Convention (IWC); Convention on
Migratory Species (CMS), World Heritage
Convention (WHC), etc. India has recently
taken the lead in the formation of the Global
Tiger Forum.
Agro Biodiversity

8/14/2019 Comp Env 2007 Chp3
http://slidepdf.com/reader/full/comp-env-2007-chp3 4/54
FLORA
Sl.
No.
Type No. of
Known
Species
in the
World
No. of
Known
Species
in India
Percentage
of
Occurrence
in India
No. of
Species
Endemic
No. of
Species
Endangered
No. of
Species
Extinct
1 2 3 4 5 6 7 8
I Flowering Plants
1 Gymnosperm 650 48 7.38 8* 7* Not Known
2 Angiosperm 250000 17672 7.00 5725* 1700* 28
II Non-flowering Plants
1 Fern & Fernallics 10000 1135 11.35 193* 113* Not Known
2 Algae 40000 6500 16.25 1100* 120* Not Known
3 Fungi 70000 14500 20.71 3500* 140* Not Known
4 Lichens 13500 2021 14.97 417* 400* Not Known
5 Liverworts 7500 852 11.26 260* 100* Not Known6 Mosses 7000 2000 28.6 608* 115 Not Known
Source : Botanical Survey of India, Kolkata.
* : Approximate
TABLE 3.1.1 : NUMBER AND STATUS OF PLANT SPECIES IN INDIA
India has a rich heritage of species and genetic strains of flora.
Overall about six percent of world species are found in India. It is
estimated that India is tenth among the plant rich countries of the world
and sixth among the centres of diversity and origin of agrodiversity. Out
of the total twelve biodiversity hot-spots in the world, India has two, one
is the north east region and other is western ghats (Khoshoo, T.N.,
1995). The growing urbanization and industrialization causes the
decrease of Natural habitats, which further results in the loss to
biological diversity. Biodiversity, once lost cannot be recovered.
26

8/14/2019 Comp Env 2007 Chp3
http://slidepdf.com/reader/full/comp-env-2007-chp3 5/54
FLORA
Sl.
No.Category Approximate Number
1 2 3
1 Rare 287
2 Vulnerable 167
3 Endangered 1366
4 Possibly Extinct 40
5 Extinct 28
Source : Botanical Survey of India, Kolkata.
TABLE 3.1.2 : RARE AND THREATENED SPECIES
(VASCULAR PLANTS)
15%
9%
73%
2% 1%
Rare Vulnerable Endangered Possibly Extinct Extinct
27

8/14/2019 Comp Env 2007 Chp3
http://slidepdf.com/reader/full/comp-env-2007-chp3 6/54
FLORA
Category Total Number Total Holdings of
Collections and
Specimens
1 2 3 4
1 Herbarium 51 4594795
2 Museums 18 60100
Source : Botanical Survey of India, Kolkata.
Category Number Total Geographical
Area (Sq. Km.)
1 2 3 4
I Within Habitats
(insitu)
1 Biosphere Reserves 13 53849
2 National Parks 89 406313 Sanctuaries 484 115374
4 Reserve Forests NA 416547
5 Protected Forests 19 223321
II Outside Habitats
(ex situ)
1 Botanical Gardens 120 26.24
2 Gene Banks NA NA
Source : Botanical Survey of India, Kolkata.
Sl.
No.
Sl.
No.
TABLE 3.1.3 : REFERENCE COLLECTIONS OF FLORA
TABLE 3.1.4 : CONSERVATION MEASURES
28

8/14/2019 Comp Env 2007 Chp3
http://slidepdf.com/reader/full/comp-env-2007-chp3 7/54
FLORA
Sl.
No.
Name of
Biosphere
Reserve
Area (in
sq.km.)
Date of
Notification
Location (State) and Bio-Geographic
Zones
1 2 3 4 5
1 Nilgiri 5520.00 01.08.1986 Part of Wynad, Nagarhole, Bandipur and
Mudumalai, Nilambur, Silent Valley and
Siruvani hills (Tamil Nadu, Kerala and
Karnataka)-Western Ghats
2 Nanda Devi 5860.69 18.01.1988 Part of Chamoli, Pithoragarh & Almora
Districts (Uttranchal)-West Himalayas
3 Nokrek 820.00 01.09.1988 Part of Garo Hills (Meghalaya)-East
Himalayas
4 Manas 2837.00 14.03.1989 Part of Kokrajhar, Bongaigaon, Barpeta,
Nalbari, Kamrup and Darang districts (Assam)
East Himalayas
5 Sunderbans 9630.00 29.03.1989 Part of Delta of Ganges & Barahamaputra
river system (West Bengal)-Gigantic Delta
6 Gulf of Mannar 10500.00 18.02.1989 Indian part of Gulf of Mannar between India
and Sri Lanka (Tamil Nadu)-Coasts
7 Great Nicobar 885.00 06.01.1989 Southern Most Islands of Andaman and
Nicobar (A&N Islands)-Islands
8 Similipal 4374.00 21.06.1994 Part of Mayurbhanj district (Orissa)-Deccan
Peninsula
9 Dibru-Saikhowa 765.00 28.07.1997 Part of Dibrugarh and Tinsukhia districts
(Assam)-East Himalayas
10 Dehang Debang 5112.00 02.09.1998 Part of Siang and Debang Valley in Arunachal
Pradesh-East Himalayas
11 Pachmarhi 4926.28 03.03.1999 Part of Betul, Hoshangabad and Chindwara
Districts of Madhya Pradesh-Semi-Arid-
Gujarat Rajputana
12 Kanchanjunga 2619.92 07.02.2000 Parts of Kanchanjunga Hills in Sikkim-East
Himalayas
13 Agasthyamalai 1701.00 12.11.2001 Part of Thirunelvedi and Kanya kumari
Districts in Tamil Nadu and
Thiruvananthapuram, Kollam and
Pathanmthita of Kerala
14 Achankmar-
Amarkantak
3835.31 30.3.2005 Part of Anupur and Dindori Distt.,of MP, part
of Bilaspur distts., of Chhattisgarh State
Source: Ministry of Environment and Forests
TABLE 3.1.5 : BIOSPHERE RESERVES SETUP IN INDIA
29

8/14/2019 Comp Env 2007 Chp3
http://slidepdf.com/reader/full/comp-env-2007-chp3 8/54

8/14/2019 Comp Env 2007 Chp3
http://slidepdf.com/reader/full/comp-env-2007-chp3 9/54
FLORA
Sl.
No.
Storage Temp.
(0C)
Optimum
Subculture
Interval (Months)
No. of Accessions
in Culture
1 2 3 4 5
I
1 Musa spp. 25 8-12 383
2 Actinidia spp 25 10--12 3
3 Aegle marmelos 25 12 1
4 Fragaria spp 25 8-10 485 Prunus spp. 25 4--6 2
6 Rubus spp. 25 8--10 5
7 Malus spp. 25 4--6 4
8 Morus sp. 25 8--10 48
9 Vitis vinifera 25 3--4 3
II
1 Allium sativum 25, 4 6-12 139
2 Allium spp. 25, 4 4-23 16
III
1 Alocasia spp. 25 10 3
2 Colocasia esculenta 25 8-10 141
3 Dioscorea spp. 25 8-12 85
4 Ipomoea batatas 25 8-12 255
5 Xanthosoma sagittifolium 25 10 9
IV1 Aristolochia indica 25 - 1
2 Bacopa monnieri 25 6 16
3 Centella asiatica - - 9
4 Coleus aromaticus - - 3
5 Coleus forskohlii 25 12 14
6 Cholorophytum sp. - - 2
7 Costus speciosus - - 1
8 Curculigo orchioides - - 2
9 Digitalis spp. 4 11 6
10 Eremostachys superba 4 10 2
11 Gentiana kurroo 4 12 1
12 Kaempferia galanga 25 - 5
13 Kaempferia rotundata 25 - 4
14 Mentha sp. 4 12 24
15 Peristrophe bicalyculata 116 Picrorhiza kurroa 4 12 9
17 Plumbago zeylanica 25 6-10 11
18 Pogostemon patchouli 25 12 2
19 Pycnanthemum spp. 4 12 4
20 Rauvoljfia spp. 25 12 11
21 Rheum spp. 4 12 5
22 Saussurea lappa 4 12 3
23 Swertia chirayta 4 6 3
24 Tylophora indica 25 6--12 10
25 Valeriana wallichii 4 12 10
V
1 Curcuma spp. 25 6-10 117
2 Elettaria spp 25 15 5
3 Piper spp. 25 10-22 10
4 Zingiber spp. 25 8-24 184
5 Vanilla planifolia 25 6 4
VI
1 Humulus lupulus 25 - 8
2 Simmondsia chinensis 25 6 12
VII
Cicer microphyllum - - 1
Gladiolous cv. - - 4
Total 1649
Source : National Bureau of Plant Genetic Resources
TABLE 3.1.7 : STATUS OF IN-VITRO CONSERVATION
(As on 31st
March, 2005)
Spices
Fruits
Crop groups/Crops
Others
Medicinal and Aromatic Plants
Tuber Crops
Bulbous Crops
Industrial Plants
31

8/14/2019 Comp Env 2007 Chp3
http://slidepdf.com/reader/full/comp-env-2007-chp3 10/54
FLORA
Sl.
No.
No. of Accession
1
I Intermediate & Recalcitrant1 Fruits & Nuts 14192 Spices & Condiments 953 Plantation Cro s 194 Agroforestry & Firestry species 1712
5 Industrial crops 145II Orthodox
1 Cereals 2082 Millets and Fora es 2823 Pseudocereals 764 Grain Le umes 6165 Oilseeds 3396 Fibre 58
7 Vegetables 4118 Medicinal & Aromatic Plants 6389 Narcotics & dyes 32
10 Miscellaneous 9
Source : National Bureau of Plant Genetic Resources
Note : Total number of Speices - 573
Sl.
No.1
1 43
2 1
3 1
4 5
5 2
6 Garcinia spp. 4
7 Mangifera indica 132
8 Poncirus trifoliata 1
9 4
10 1
11 9
12 Litchi chinensis 19
Source : National Bureau of Plant Genetic Resources
TABLE 3.1.8 : STATUS OF GERMPLASM AT NATIONAL CRYOBANK
TABLE 3.1.9 : STATUS OF CRYOPRESERVATION OF POLLEN
6059
3
Plant Species
3
Category
2
Total
222
No. of Accession
Total
(As on 31st
March, 2005)
Eruca species
(As on 31st
March, 2005)
Sesamum spp.
Zea mays & allied genera
Brassica spp. (oleracea, napus, campestris, carinata,
juncea, nigra)
2
Raphanus sativus
Camellia sinensis
Cicer microphyllum
Citrus spp.
32

8/14/2019 Comp Env 2007 Chp3
http://slidepdf.com/reader/full/comp-env-2007-chp3 11/54
FOREST
(Sq.km)
Reserved
Forest
Protected
Forest
Unclassed
Forest
Total
Forest
Area1 2 3 4 5 6 7 8
1 Andhra Pradesh 275069 50479 12365 977 63821 23.20
2 Arunachal Pradesh 83743 10546 9528 31466 51540 61.55
3 Assam 78438 17864 - 8968 26832 34.21
4 Bihar 94163 693 5779 1 6473 6.87
5 Chhattisgarh 135191 25782 24036 9954 59772 44.21
6 Delhi 1483 78 7 - 85 5.73
7 Goa 3702 237 - 987 1224 33.06
8 Gujarat 196022 14067 696 4199 18962 9.67
9 Haryana 44212 249 1158 152 1559 3.53
10 Himachal Pradesh 55673 1896 33043 2094 37033 66.52
11 Jammu & Kashmir 222236 17643 2551 36 20230 9.10
12 Jharkhand 79714 4387 19185 33 23605 29.61
13 Karnataka 191791 28690 3931 5663 38284 19.96
14 Kerala 38863 11123 142 - 11265 28.99
15 Madhya Pradesh 308245 61886 31098 1705 94689 30.72
16 Maharashtra 307713 49226 8195 4518 61939 20.13
17 Manipur 22327 1467 4171 11780 17418 78.01
18 Meghalaya 22429 1112 12 8372 9496 42.34
19 Mizoram 21081 7909 3568 5240 16717 79.30
20 Nagaland 16579 86 508 8628 9222 52.05
21 Orissa 155707 26329 15525 16282 58136 37.34
22 Punjab 50362 44 1137 1903 3084 6.12
23 Rajasthan 342239 11860 17652 2976 32488 9.49
24 Sikkim 7096 5452 389 - 5841 82.31
25 Tamil Nadu 130058 19388 2183 1306 22877 17.59
26 Tripura 10486 4175 2 2117 6294 60.02
27 Uttar Pradesh 240928 11509 1837 3450 16796 6.97
28 Uttaranchal 53483 24638 9882 131 34651 64.79
29 West Bengal 88752 7054 3772 1053 11879 13.38
30 Union Territories 9478 3159 4253 2 7414 78.18
3287263 419028 216605 133993 769626 23.41
Source : State of Forest Report 2005
Recorded Forest Area, 2005 Percentage
of Forest to
Geo. Area
TABLE 3.2.1 : STATE/UT WISE FOREST AREA
Total
Sl.
No.
State/UT Geographic
Area
India has 76.96 million hectares of recorded forest area in March 2005. This
accounts for 23.41% of total geographic area. Per Capita availability of forests in India
is 0.06 ha which is much lower than the world average of 0.8 ha.

8/14/2019 Comp Env 2007 Chp3
http://slidepdf.com/reader/full/comp-env-2007-chp3 12/54
3 4
CHART 3.2.1 :FOREST COVER IN DIFFERENT STATES AS COMPARED TO TOT
0
50000
100000
150000
200000
250000
300000
350000
400000
A n
d h r aP r a
d e
s h
A r un
a c h
al P r a
d e s h
A s s am
B i h
ar
C h h
a t t i s g ar h
D el h i
G o a
G u j ar a
t
H ar y
an
a
Hi m
a c h
al P r a
d e s h
J amm
u & K
a s h mi r
J h
ar k h
an
d
K ar n
a t ak
a
K er al a
M a d h
y aP r a
d e s h
M ah
ar a
s h
t r a
M ani p
ur
M e gh
al a
y a
Mi z
or am
N a g al an
d
Or i s
s a
STATES/UTS
ARE A
I N
S Q.KM S .
Forest Area Total Geographical Area

8/14/2019 Comp Env 2007 Chp3
http://slidepdf.com/reader/full/comp-env-2007-chp3 13/54
FOREST
Total Forest Cover*
Source : State of Forest Report, 2005
* : Includes 4461 km2
under mangroves (0.14% of country's geographic area)
** : Excludes scrubs and includes water bodies
Non-Forest Cover
20.60677088
100
Scrub
Total Geographic Area
2571700 78.23
3287263
38475 1.17
Non-forest**
1.66
3
Forest Cover
54569
8.82Open Forest 289872
TABLE 3.2.2 : FOREST COVER IN INDIA 2005
Area
( Sq. Km))
Class
Very Dense Forest
1 2
10.12
Percentage of
Geographic Area
Moderately Dense Forest 332647
Chart No 3.2.2: Forest cover of India
1.6610.12
8.82
1.17
78.23Very Dense Forest Moderately Dense Forest
Open Forest Scrub
Non-forest**

8/14/2019 Comp Env 2007 Chp3
http://slidepdf.com/reader/full/comp-env-2007-chp3 14/54
State/
Union Territory Reserved Protected Unclassed Total Area Under
Sanctioned
Working Plans
Rev
Depa
For
1 2 3 4 5 6 7
1 A&N Islands 2928.76 4241.93 Nil 7170.69 7170.69 N
2 Andhra Pradesh 50479.00 12365.00 970.00 63814.00 - 3 Arunachal Pradesh 10177.60 9535.79 31826.52 51540.00 1053.91
4 Assam 15203.00 Nil 8957.00 24160.00 15203.00 589
5 Bihar 664.23 5834.73 - 6498.96 6498.96 1220
6 Chhattisgarh 25782.17 24036.10 9954.12 59772.39 -
7 Dadra & Nagar Haveli 198.76 4.82 Nil 203.58 198.76 N
8 Goa 235.89 795.51 192.98 1224.38 - 247
9 Gujarat 14180.03 377.02 4523.94 19080.99 13873.44
10 Haryana 249.00 1158.00 17.00 1424.00 867.00
11 Himachal Pradesh 1896.00 33043.00 977.00 35916.00 24535.00
12 Jammu & Kashmir 2551.20 17643.00 36.00 20230.00 20194.00 N
13 Jharkhand 4387.20 19184.78 33.49 23605.47 14329.49
14 Karnataka 28689.97 3930.70 5230.99 37851.66 37651.66 12415 Kerala 11119.63 128.66 15.5 11263.79 2944.33 N16 Madhya Pradesh 58734.00 35587.00 900.00 95221.00 79592.00 n
17 Maharashtra 43916.00 7992.00 3459.00 55367.00 42617.00 244
18 Manipur 1467.00 4171.00 11780.00 17418.00 NA N
19 Meghalaya 712.74 12.39 399.48 1124.61 -
20 Mizoram 7127.00 3568.00 5240.00 15935.00 -
21 Nagaland 85.83 507.56 192.47 - -
22 Orissa 26329.12 15524.46 20.55 41874.13 30281.45 1626
23 Punjab 43.36 1119.40 191.06 1353.82 1353.51
24 Rajasthan 11859.95 17651.68 2976.38 32488.01 -
25 Sikkim 2261.00 285.00 104.00 2650.00 Nil N
26 Tamil Nadu 19388.00 2183.00 1306.00 22877.00 20751.00 213
27 Tripura 3588.18 509.03 2195.47 6292.68 Nil N
28 Uttar Pradesh 11105.00 2530.00 3191.00 16826.00 - 15
29 Uttaranchal 23819.76 124.96 44.04 23988.76 23819.76 514
30 West Bengal 7113.79 3958.58 1018.11 12090.48 395.29 N
Source : Forestry Statistics India, 2003
Note: Blank cell indicates information is not available
3 6
Sl.
No.
TABLE 3.2.3(a) : FOREST AREA BY OWNERSHIP(during 200
Forest Department

8/14/2019 Comp Env 2007 Chp3
http://slidepdf.com/reader/full/comp-env-2007-chp3 15/54
State/
Union Territory Chir Deodar Others
Conifers
Sal Teak
1 2 3 4 5 6 7
1 Andhra Pradesh - - - 47.00 9145.00
2 Arunachal Pradesh 243.00 NA 3530.00 NA NA
3 Chhattisgarh Nil Nil Nil 24244.88 5633.13 4 Dadra & Nagar Haveli Nil Nil Nil Nil Nil
5 Goa - - - - 95.10
6 Gujarat - - - - 4859.24
7 Haryana 23.00 - - 30.00 -
8 Himachal Pradesh 1336.00 854.00 6760.00 183.00 129.00
9 Jammu & Kashmir 1825.00 1075.00 5369.00 - -
10 Jharkhand NA NA NA 23605.47 NA
11 Karnataka Nil Nil Nil Nil Nil
12 Kerala Nil Nil Nil Nil 748.72
13 Madhya Pradesh - - - 3716.72 17040.62
14 Maharashtra Nil Nil Nil Nil 9508.00
15 Meghalaya Nil Nil 145.14 Nil Nil 16 Orissa NA NA NA 972.15 608.96
17 Punjab 121.75 - - - -
18 Rajasthan - - - - 942.24
19 Sikkim Nil Nil 949.80 24.55 Nil
20 Tamil Nadu - - - - 195.00
21 Tripura Nil Nil Nil 1829.00 507.34
22 Uttar Pradesh - - - 1876.00 270.00
23 Uttaranchal 4121.66 246.75 1196.97 2563.67 216.25
24 West Bengal - - 89.00 - -
Source : Forestry Statistics India, 2003
Note: Blank cell indicates information is not available
Nonresponding States A & N Island, Assam, Bihar, Delhi, Manipur, Mizoram and Nagaland.
3 7
TABLE 3.2.3(b) : FOREST AREA BY COMPOSITION (during
Sl.
No.
Coniferous forest Non-conifero
8/14/2019 Comp Env 2007 Chp3
http://slidepdf.com/reader/full/comp-env-2007-chp3 16/54
FOREST
(Sq.KM)
Sl.
No.States/Uts
2005
Assessment
2003*
Assessment
2001*
Assessment
1999
Assessment
Change
in 2001
Change
in 2003
Change
in 2005
1 2 3 4 5 8 6 7
1 Andhra Pradesh 44372 44412 43195 44229 -1034 1217 -40
2 Arunachal Pradesh 67777 67692 69760 68847 913 -2068 85
3 Assam 27645 27735 25290 23688 1602 2445 -904 Bihar 5579 5573 5375 4830 545 198 6
5 Chhatisgarh 55863 55992 57730 56693 1037 -1738 -129
6 Delhi 176 174 125 88 37 49 2
7 Goa 2164 2164 1565 1251 314 599 0
8 Gujarat 14715 14814 12913 12965 -52 1901 -99
9 Haryana 1587 1576 1135 964 171 441 11
10 Himachal Pradesh 14369 14359 12907 13082 -175 1452 10
11 Jammu & Kashmir 21273 21273 19886 20441 -555 1387 0
12 Jharkhand 22591 22569 22531 21644 887 38 22
13 Karnataka 35251 35246 33296 32467 829 1950 5
14 Kerala 15595 15595 13417 10323 3094 2178 0
15 Madhya Pradesh 76013 76145 75282 75137 145 863 -132
16 Maharashtra 47476 47514 45040 46672 -1632 2474 -38
17 Manipur 17086 17259 17889 17384 505 -630 -173
18 Meghalaya 16988 16925 16535 15633 902 390 63
19 Mizoram 18684 18583 16397 18338 -1941 2186 101
20 Nagaland 13719 14015 13980 14164 -184 35 -29621 Orissa 48374 48353 49044 47033 2011 -691 21
22 Punjab 1558 1545 1628 1412 216 -83 13
23 Rajasthan 15850 15821 14542 13871 671 1279 29
24 Sikkim 3262 3262 3164 3118 46 98 0
25 Tamil Nadu 23044 23003 20992 17078 3914 2011 41
26 Tripura 8155 8123 8869 5745 3124 -746 32
27 Uttar Pradesh 14127 14127 10778 10756 22 3349 0
28 Uttaranchal 24442 24460 23354 23260 94 1106 -18
29 West Bengal 12413 12389 10392 8362 2030 1997 24
30 A. & N. Islands 6629 6807 6621 7606 -985 186 -178
31 Chandigarh 15 15 13 7 6 2 0
32 Dadra & Nagar Haveli 221 221 217 202 15 4 0
33 Daman & Diu 8 8 6 3 3 2 0
34 Lakshadweep 25 25 12 0 12 13 0
35 Pondicherry 42 42 18 0 18 24 0
677088 677816 653898 637293 16605 23918 -728
Source : State of Forest Report, 2005
*: Revised
Total
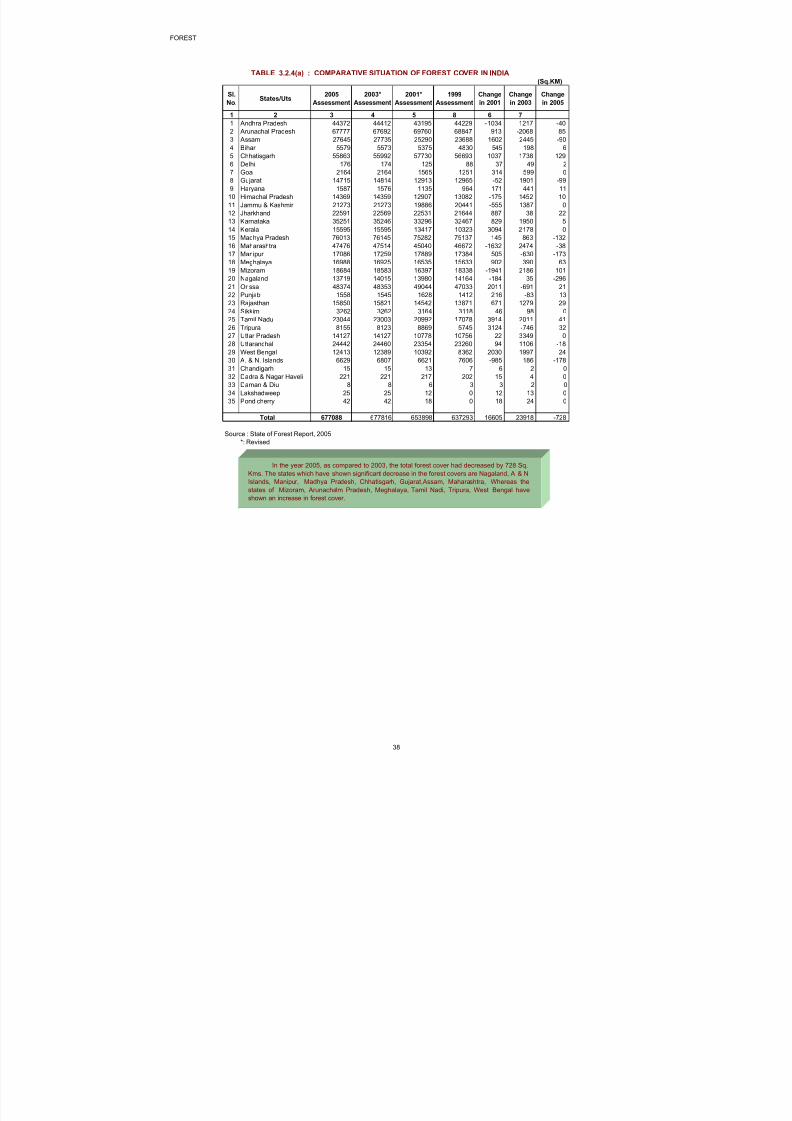
TABLE 3.2.4(a) : COMPARATIVE SITUATION OF FOREST COVER IN INDIA
In the year 2005, as compared to 2003, the total forest cover had decreased by 728 Sq.
Kms. The states which have shown significant decrease in the forest covers are Nagaland, A & N
Islands, Manipur, Madhya Pradesh, Chhatisgarh, Gujarat,Assam, Maharashtra, Whereas the
states of Mizoram, Arunachalm Pradesh, Meghalaya, Tamil Nadi, Tripura, West Bengal have
shown an increase in forest cover.

8/14/2019 Comp Env 2007 Chp3
http://slidepdf.com/reader/full/comp-env-2007-chp3 17/54
FORESTS
1 2 3 9 10
1 Arunachal Pradesh 67777 - 19 + 245 - 802 - 26 85
2 Assam 27645 - 237 - 136 + 4026 + 112 -90
3 Manipur 17086 - 140 - 34 - 458 + 293 -173
4 Meghalaya 16988 - 57 - 24 - 49 + 1255 63
5 Mizoram 18684 + 199 - 437 - 844 + 936 101
6 Nagaland 13719 - 70 - 57 - 819 + 264 -296
7 Tripura 8155 + 8 + 199 + 1320 + 1028 32
170054 - 316 - 244 + 2374 + 3532 -278
Source : State of Forest Report, 2005
TABLE 3.2.4(b) : CHANGES IN FOREST COVER OF THE NORTH-EASTERN REGION
1997-991995-97 2001-03
(Sq. Km.)
2003-05
Total
1999-2001
Sl.
No.
State Forest Cover
2005
Assessment
876
The forest cover in the North-Eastern Region (NER) is about 67% of the Geographical Area.
There has been a decrease in the forest cover in 2005 over the year 2003 by 278 sq. km. There
was significant increase in forest cover in 2001 over 1999 and in 2003 over 2001.

8/14/2019 Comp Env 2007 Chp3
http://slidepdf.com/reader/full/comp-env-2007-chp3 18/54
C (cum) NC (cum) C (cum) NC (cum) (cum) (cum)
2000-01 2000-01 2001-02 2001-02 2000-01 2001-02
1 2 3 4 5 6 7 8
1 Andhra Pradesh - 29490.08 - 18364.80 32073.45 4191.16 2 Arunachal Pradesh 2057.00 - 15546 - 23265.07 38221.76 26
3 Assam Nil Nil Nil Nil 277.86 6681.94
4 Chhattisgarh Nil 60092.00 Nil 115435.00 109655.17 129640.69
5 Goa - 10144.00 - 13538.37 22369.63 23944.24
6 Gujarat - 10129.38 - 9671.11 30963.73 44203.51
7 Haryana - 125345.00 - 110937.00 83287.00 70647.00
8 Himachal Pradesh 5451.54 28218.93 10397.11 23196.41 - 8700.80
9 Jammu & Kashmir 102480.00 - 152180 - 5859.20 8700.80
10 Karnataka - 39856.00 - 54056.00 294118.00 313453.00
11 Kerala - 31299.00 - 38915.00 10131.00 13978.00
12 Madhya Pradesh - 242011.66 - 564162.07 323659.50 499224.00
13 Maharashtra Nil 56.00 Nil 45.00 152.00 107.00
14 Mizoram Nil 4.84 Nil 6.30 6481.06 Nil
15 Orissa - 33867.49 - 10423.67 19280.30 19413.40
16 Punjab - 5051.00 1995 141826.00 193267.00 6930.00
17 Rajasthan - 25675.08 - 22541.36 62295.11 487421.40 18 Sikkim Nil nil Nil Nil 297.61 168.29
19 Tamil Nadu - 229.64 - 142273.00 181689.00 110528.00 1
20 Tripura - 297.66 - 894.35 2474.72 4631.96
21 Uttar Pradesh - 177182.00 - 171297.00 28490.00 25561.00
22 Uttaranchal 104829.08 91015.48 112045.53 114737.49 7509.39 6791.80
23 West Bengal 3686.00 45411.00 5252 22853.00 189735.00 270729.00
263410.62 910469.24 297415.64 1575172.92 1627033.20 2093868.75
Source: Forestry Statistics in India, 2003
Note: Blank cell indicates information is not available
C : Confiferous
NC : Non- consferous
Total
TABLE 3.2.5 :STATE-WISE PRODUCTION OF FOREST PRODUCE ……..C
Sl.
No.
State/Union Territory
4 0
Round Wood Woof Fuel

8/14/2019 Comp Env 2007 Chp3
http://slidepdf.com/reader/full/comp-env-2007-chp3 19/54
2000-01 2001-02 2000-01 2001-02 2000-01 200
1 2 13 14 15 16 17 1
1 Andhra Pradesh - - 56192.16 53239.12 78.08 2 Arunachal Pradesh NA
3 Chhattisgarh 33300.00 47700.00 78640.00 66640.00 168.61
4 Gujarat - - 2237.55 2030.35 0.30
5 Himachal Pradesh -
6 Jammu &Kashmir Nil
7 Jharkhand 1282.86 NA 3924.63 2774.17
8 Karnataka Nil Nil 1278.00 1171.00 8.92
9 Kerala Nil
10 Madhya Pradesh 104.49 120.60 117960.00 84880.00 78.36
11 Maharashtra - - 33125.00 29467.00 13.00
12 Orissa 20609.27 7494.59 51900.00 40700.00 90.60
13 Punjab -
14 Rajasthan Nil Nil 23815.24 18127.48
15 Uttar Pradesh 45.00
16 Uttaranchal NA Nil NA 628.09 -
17 West Bebgal 1843.37 NA 371.22 NA
Source: Forestry Statistics in India, 2003
Note: Blank cell indicates information is not available
C : Confiferous
NC : Non- consferous
Sal SeedSl.
No.
State/Union Territory
TABLE 3.2.5 :STATE-WISE PRODUCTION OF FOREST PRODUCE --
Tendu/Kendu/Biddi Gums
(M. Tonne) Leaves (M. Tonne) (Metric Tonne)
4 1

8/14/2019 Comp Env 2007 Chp3
http://slidepdf.com/reader/full/comp-env-2007-chp3 20/54
FOREST
Area (Km2) % of Geog. Area
1 2 3 4 5 6
1 Western Himalayas 329255 21.74 6950 2.11
2 Eastern Himalayas 74618 10.18 255 0.34
3 North East 133990 15.28 1726 1.29
4 Northern Plains 295780 13.43 10747 3.63
5 Eastern Plains 223339 11.18 5447 2.44
6 Western Plains 319098 9.86 7815 2.45
7 Central Highlands 373674 9.39 8124 2.17
8 North Deccan 355988 9.41 7383 2.07
9 East Deccan 336289 10.61 11293 3.36
10 South Deccan 292416 10.98 7656 2.62
11 Western Ghats 72381 19.69 3886 5.37
12 Eastern Ghats 191698 11.11 3967 2.07
13 West Coast 127242 20.65 8307 6.85
14 East Coast 167493 17.67 8106 4.84
3287263 12.14 91663 2.79
Source : State of Forest Report, 2005
CNFA : Culturable Non Forest Area
TABLE 3.2.6 (a) :PHYSIOGRAPHIC ZONE WISE TREE COVER ESTIMATED
Total
Tree Cover Sl.
No.
Physiographic Zone Geographic Area (Km2)
(From Trees Outside Forest)Trees per ha of
CNFA

8/14/2019 Comp Env 2007 Chp3
http://slidepdf.com/reader/full/comp-env-2007-chp3 21/54
In Forest In Tree
Outside
Forest
Total
1 2 3 4 5 6 7
1 W. Himalayas 329255 91073 976.214 194.230 1170.444
2 E. Himalayas 74618 47965 500.364 67.470 567.834
3 North East Ranges 133990 79431 404.116 99.390 503.506
4 Northern Plains 295780 14230 169.448 113.803 283.251
5 Eastern Plains 223339 31709 295.808 91.437 387.245
6 Western Plains 319098 13666 6.314 82.215 88.529
7 Central Highlands 373675 80665 96.078 106.806 202.884
8 North Deccan 355988 87260 267.964 71.157 339.1219 East Deccan 336289 128757 588.329 175.255 763.584
10 South Deccan 292416 49459 252.54 147.608 400.148
11 Western Ghats 72381 32399 463.315 109.329 572.644
12 Eastern Ghats 191698 74418 412.605 89.839 502.444
13 West Coast 121242 20765 84.829 158.329 243.158
14 East Coast 167494 17826 84.113 109.439 193.552
3287263 769621 4602.038 1616.244 6218.282
Source : State of Forest Report, 2005
CNFA : Culturable Non Forest Area
TABLE 3.2.6 (b):PHYSIOGRAPHIC ZONE WISE VOLUME OF GROWING STOCK
Total
Sl.
No.
Physiographic Zone Area of
Phy.Zone
(Km2)
Recorded
Forest Area
(Km2)
Growing Stock (volume in m.Cum)
43

8/14/2019 Comp Env 2007 Chp3
http://slidepdf.com/reader/full/comp-env-2007-chp3 22/54
FOREST
Area (Km2) % of Geog.
Area
1 2 3 4 5 6
1 Andhra Pradesh 275069 12.76 7640 2.78
2 Arunachal Pradesh 83743 11.07 446 0.53
3 Assam 78438 11.91 1484 1.89
4 Bihar 94163 10.80 2522 2.68
5 Chhattisgarh 135191 10.43 4492 3.32
6 Delhi 1483 26.44 107 7.22
7 Goa 3702 25.29 268 7.24
8 Gujarat 196022 13.41 7621 3.89
9 Haryana 44212 13.15 1565 3.54
10 Himachal Pradesh 55673 19.02 709 1.27
11 Jammu & Kashmir 222236 22.54 5633 2.53
12 Jharkhand 79714 11.01 3080 3.8613 Karnataka 191791 11.09 5467 2.85
14 Kerala 38863 16.50 2632 6.77
15 Madhya Pradesh 308245 9.68 6267 2.03
16 Maharashtra 307713 11.16 8978 2.92
17 Manipur 22327 15.31 142 0.64
18 Meghalaya 22429 15.32 405 1.81
19 Mizoram 21081 15.65 122 0.58
20 Nagaland 16579 15.26 238 1.44
21 Orissa 155707 12.42 4589 2.95
22 Punjab 50362 13.61 1823 3.62
23 Rajasthan 342239 9.54 8379 2.45
24 Sikkim 7096 22.62 27 0.38
25 Tamil Nadu 130058 16.40 5621 4.32
26 Tripura 10486 15.31 134 1.2827 Uttar Pradesh 240928 12.71 8203 3.40
28 Uttaranchal 53483 17.38 658 1.23
29 West Bengal 88752 11.43 2269 2.56
30 A. & N. Islands 8249 17.16 53 0.64
31 Chandigarh 114 37.11 9 7.89
32 Dadra & Nagar Haveli 491 18.98 28 5.70
33 Daman & Diu 112 13.08 9 8.04
34 Lakshadweep 32 15.20 4 12.50
35 Pondicherry 480 21.80 42 8.75
3287263 12.14 91663 2.79
Source : State of Forest Report, 2005CNFA : Culturable Non Forest Area
Total
Trees per ha
of CNFA
Tree Cover
TABLE 3.2.7 :STATE/UT WISE TREE COVER ESTIMATES
Sl. No. State/UT Geographic
Area (Km2)

8/14/2019 Comp Env 2007 Chp3
http://slidepdf.com/reader/full/comp-env-2007-chp3 23/54
Dense
Forest
Open
Forest
Total
Forest
1 2 3 4 5 6 7 8
1 Andhra Pradesh 275069 24329 20043 44372 16.13 9862
2 Arunachal Pradesh 83743 52388 15389 67777 80.93 128
3 Assam 78438 12831 14814 27645 35.24 146
4 Bihar 94163 3114 2465 5579 5.92 129
5 Chhattisgarh 135191 38728 17135 55863 41.32 91
6 Delhi 1483 54 122 176 11.87 0.62
7 Goa 3702 1150 1014 2164 58.45 2
8 Gujarat 196022 6138 8577 14715 7.51 1495
9 Haryana 44212 526 1061 1587 3.59 165
10 Himachal Pradesh 55673 8928 5441 14369 25.81 38311 Jammu & Kashmir 222236 10529 10744 21273 9.57 2821
12 Jharkhand 79714 11622 10969 22591 28.34 733
13 Karnataka 191791 22098 13153 35251 18.38 3151
14 Kerala 38863 9660 5935 15595 40.13 70
15 Madhya Pradesh 308245 41082 34931 76013 24.66 2172
16 Maharashtra 307713 28384 19092 47476 15.43 4248
17 Manipur 22327 6464 10622 17086 76.53 39
18 Meghalaya 22429 7146 9842 16988 75.74 181
19 Mizoram 21081 6306 12378 18684 88.63 0
20 Nagaland 16579 5838 7881 13719 82.75 13
21 Orissa 155707 28194 20180 48374 31.07 4743
22 Punjab 50362 723 835 1558 3.09 1523 Rajasthan 342239 4470 11380 15850 4.63 4527
24 Sikkim 7096 2410 852 3262 45.97 363
25 Tamil Nadu 130058 12440 10604 23044 17.72 1808
26 Tripura 10486 5030 3125 8155 77.77 59
27 Uttar Pradesh 240928 5979 8148 14127 5.86 738
28 Uttaranchal 53483 18398 6044 24442 45.70 320
29 West Bengal 88752 6079 6334 12413 13.99 68
30 A. & N. Islands 8249 6005 624 6629 80.36 3
31 Chandigarh 114 9 6 15 13.16 1
32 Dadra & Nagar Haveli 491 130 91 221 45.01 0
33 Daman & Diu 112 2 6 8 7.14 0
34 Lakshadweep 32 15 10 25 78.13 035 Pondicherry 480 17 25 42 8.75 0
3287263 387216 289872 677088 20.60 38475
Source: State of Forest Report 2005
Scrub
Total
(Area in Sq. km)
TABLE 3.2.8 : FOREST COVER IN STATES/UTs IN INDIA
State/UTSl.
No.
Geographic
Area
Forest Cover Area Percent
of G.A.

8/14/2019 Comp Env 2007 Chp3
http://slidepdf.com/reader/full/comp-env-2007-chp3 24/54
(Sq. km)
Very
Dense
Forest
Moderately
Dense
Forest
Open
Forest
Total
1 2 3 4 5 6 7 8 9
1 Arunachal Pradesh 13 83743 14411 37977 15389 67777 80.93
2 Assam 3 19153 752 5777 6522 13051 68.14
3 Himachal Pradesh 12 55673 1097 7831 5441 14369 25.81
4 Jammu & Kashmir (a) 14 101388 1593 6328 7692 15613 15.40
(b) * 120848 542 2066 3052 5660 4.68
5 Karnataka 6 48046 401 16305 5600 22306 46.43
6 Kerala 10 29572 748 7019 5044 12811 43.32
7 Maharashtra 7 69905 385 6362 5812 12559 17.97
8 Manipur 9 22327 923 5541 10622 17086 76.53
9 Meghalaya 7 22429 338 6808 9842 16988 75.74
10 Mizoram 8 21081 133 6173 12378 18684 88.63
11 Nagaland 8 16579 236 5602 7881 13719 82.75
12 Sikkim 4 7096 498 1912 852 3262 45.97
13 Tamil Nadu 5 22789 1164 2893 2172 6229 27.33
14 Tripura 4 10486 61 4969 3125 8155 77.77
15 Uttaranchal 13 53483 4002 14396 6044 24442 45.70
16 West Bengal 1 3149 472 893 856 2221 70.53
124 707747 27756 138852 108324 274932 38.85
Source: State of Forest Report, 2005
* : Area under illegal occupation of Pakistan and China.
Percent
Forest
Cover
Total
Geograp
hic Area
in Hill
Districts
TABLE 3.2.9 : STATE/UT WISE FOREST COVER IN HILL DISTRICTS
Sl.
No.
Name of State/UT Number
of Hill
Districts
Forest Cover Area
8/14/2019 Comp Env 2007 Chp3
http://slidepdf.com/reader/full/comp-env-2007-chp3 25/54
Very
Dense
Forest
Moderately
Dense
Forest
Open
Forest
Total
1 2 3 4 5 6 7 8 9
1 Andaman & Nicobar 2 8249 3359 2646 624 6629 80.36
2 Andhra Pradesh 8 87090 51 16278 8974 25303 29.05
3 Arunachal Pradesh 13 83743 14411 37977 15389 67777 80.93
4 Assam 16 50137 639 4561 6778 11978 23.89
5 Chhattisgarh 9 92656 2002 25991 12208 40201 43.39
6 Dadra & Nagar Haveli 1 491 0 130 91 221 45.01
7 Daman & Diu 1 72 0 0.66 2.44 3.1 4.31
8 Gujarat 8 48409 105 3510 3270 6885 14.22
9 Himachal Pradesh 3 26764 459 1483 1253 3195 11.94
10 Jharkhand 8 44413 1552 5804 6281 13637 30.70
11 Karnataka 5 26597 246 8394 3555 12195 45.85
12 Kerala 9 27228 692 6673 4815 12180 44.73
13 Lakshadweep 1 32 0 15 10 25 78.1314 Madhya Pradesh 18 139448 3638 20084 17129 40851 29.29
15 Maharashtra 11 138272 6701 11545 10769 29015 20.98
16 Manipur 9 22327 923 5541 10622 17086 76.53
17 Meghalaya 7 22429 338 6808 9842 16988 75.74
18 Mizoram 8 21081 133 6173 12378 18684 88.63
19 Nagaland 8 16579 236 5602 7881 13719 82.75
20 Orissa 12 86124 537 18885 13627 33049 38.37
21 Rajasthan 5 38218 0 2323 3952 6275 16.42
22 Sikkim 4 7096 498 1912 852 3262 45.97
23 Tamil Nadu 6 30720 543 2575 3492 6610 21.52
24 Tripura 4 10486 61 4969 3125 8155 77.77
25 Uttar Pradesh 1 7680 366 502 446 1314 17.11
26 West Bengal 11 69403 2285 3683 5827 11795 16.99188 1105744 39775 204065 163192 407032 36.81
Source: State of Forest Report 2005
Percent
Forest
Cover
Total
Number of
Tribal
Districts
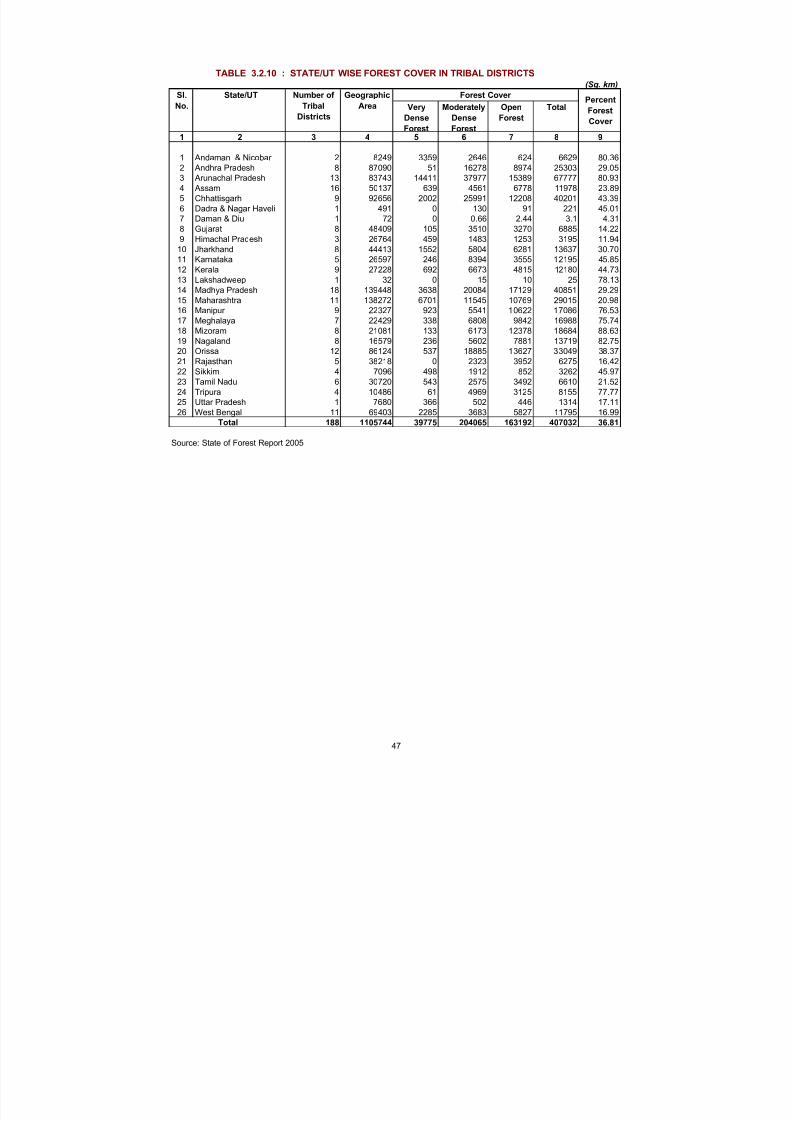
TABLE 3.2.10 : STATE/UT WISE FOREST COVER IN TRIBAL DISTRICTS
Sl.
No.
State/UT Geographic
Area
Forest Cover
(Sq. km)

8/14/2019 Comp Env 2007 Chp3
http://slidepdf.com/reader/full/comp-env-2007-chp3 26/54
(Sq. km)
State/UT
1989 1991 1993 1995 1997 1999 2001 2003
1 2 4 5 6 7 8 9 10 10
1 Andhra Pradesh 405 399 378 383 383 397 333 329
2 Goa 3 3 3 3 5 5 5 16
3 Gujarat 412 397 419 689 901 1031 911 916
4 Karnataka 0 0 0 2 3 3 2 35 Maharashtra 114 113 155 155 124 108 118 158
6 Orissa 192 195 195 195 211 215 219 203
7 Tamil Nadu 47 47 21 21 21 21 23 35
8 West Bengal* 2109 2119 2119 2119 2123 2125 2081 2120
9 Andaman & Nicobar 973 971 966 966 966 966 789 65810 Pondicherry 0 0 0 0 0 0 1 111 Kerala 0 0 0 0 0 0 0 8
12 Daman & Diu 0 0 0 0 0 0 0 1
4255 4244 4256 4533 4737 4871 4482 4448
Source: State of Forest Report 2005
*: As per the West bengal Forest Department, mangrove area in Sundarban is 4200 sq. km.
which is almost double of the area estimated by FSI.
SlNo.
State/UT VeryDense
Mangrove
OpenMangrove
Total
1 2 5 6
1 Andhra Pradesh 0 15 314 329 0
2 Goa 0 14 2 16 0
3 Gujarat 0 195 741 936 20
4 Karnataka 0 3 0 3 0
5 Kerela 0 3 5 8 0
6 Maharashtra 8 58 100 158 0
7 Orissa 0 156 47 203 0
8 Tamil Nadu 0 18 17 35 0
9 West Bengal 892 895 331 2118 -2
10 Andaman & Nicobar 255 272 110 637 -21
11 Daman & Diu 0 0 1 1 012 Pondicherry 0 0 1 1 0
1147 1629 1669 4445 -3
Source: State of Forest Report 2005
Sl
No.
State/UT
1 2
1 West Bengal Sunderbans.
2 Orissa Bhaitarkanika, Mahandi, Subernarekha, Devi, Dharma,
MGRC, Chilka
3 Andhra Pradesh Coringa, East Godavari, Krishna4 Tamil Nadu Pichavram, Muthupet, Ramnad, Pulicat, Kazhuveli
5 Andman & Nicobar North Andamans, Nicobar
6 Kerala Vembanad, kannur
7 Karnataka Coondapur, Dakshin Kannada/Honnavar,
Mangalore forest division, Karwar
8 Goa Goa
9 Maharashra
Malvan
10 Gujarat Gulf of Kutch, Gulf of Khambat, Dumas-Ubhrat
Source : Annual Report 2005-2006, Ministry of Environment & Forests
Mumbara-Diva, Vikroli, Shreevardhan, Vaitarna, Vasasi-Manori,
7
Achra-Tatnagiri, Devgarh-Vijay Dur, Veldur, Kundalika-Ravdana,
Total
mangrove Area
4
3
TABLE 3.2.11(c) : STATE-WISE LIST OF MANGROVE AREAS
TABLE 3.2.11 (a) : STATE/UT WISE MANGROVE COVER ASSESSMENT
TABLE 3.2.11 (b) : STATE/UT WISE MANGROVE COVER, 2005
Sl
No.
Total
Moderately DenseMangrove
(Sq. km)
Change w.r.t.2003 assessment

8/14/2019 Comp Env 2007 Chp3
http://slidepdf.com/reader/full/comp-env-2007-chp3 27/54
FORESTS
1 2 3 4 5 6
1 Andhra Pradesh 23 275068.00 51750.19 18.81
2 Arunachal Pradesh 13 83743.00 18326.25 21.88
3 Assam 23 78438.00 20019.17 25.52
4 Bihar 55 173877.00 20997.55 12.08
5 Goa 2 3702.00 613.27 16.57
6 Gujarat 25 196024.00 43021.28 21.95
7 Haryana 19 44212.00 3733.98 8.45
8 Himachal Pradesh 12 55673.00 31659.00 56.87
9 Jammu & Kashmir 14 101387.00 65444.24 64.55
10 Karnataka 27 191791.00 20839.28 10.87
11 Kerala 14 38863.00 1448.18 3.73
12 Madhya Pradesh 62 443446.00 69713.75 15.72
13 Maharashtra 32 307690.00 53489.08 17.38
14 Manipur 9 22327.00 12948.62 58.00
15 Meghalaya 7 22429.00 9904.38 44.16
16 Mizoram 3 21081.00 4071.68 19.31
17 Nagaland 7 16579.00 8404.10 50.69
18 Orissa 30 155707.00 21341.71 13.71
19 Punjab 17 50362.00 2228.40 4.42
20 Rajasthan 32 342239.00 105639.11 30.87
21 Sikkim 4 7096.00 3569.58 50.30
22 Tamilnadu 4 10486.00 1276.03 12.17
23 Tripura 29 130058.00 23013.90 17.70
24 Uttar Pradesh 83 294411.00 38772.80 13.17
25 West Bengal 18 88752.00 5718.48 6.44
26 UTs 20 10973.00 574.30 5.23
584 3166414.00 638518.31 20.17
Un -Surveyed Area (J& K) 120849.00
Total Geog. Area 3287263.00
Source : Forestry Statistics in India, 2003
TABLE 3.2.12 : STATE-WISE WASTE LANDS OF INDIA
Sl.
No.
(Area in Sq. Km.)
Total
Number of
districts covered
Total Geog. Area
of dist. Covered
Total Wasteland
area in dists.
Covered
% to total
Geog,
area
States/Uts.

8/14/2019 Comp Env 2007 Chp3
http://slidepdf.com/reader/full/comp-env-2007-chp3 28/54
FORESTS
1 2 3 4 5 6 7 8 9
1 Andhra Pradesh 692.68 20256.64 1035.02 603.26 13.80 22237.78 709.29
2 Arunachal Pradesh 0.00 3326.78 41.47 0.00 3088.08 1416.67 2134.99
3 Assam 0.00 843.72 1633.56 0.00 8391.48 3112.71 2217.85
4 Bihar 559.17 4689.93 1198.87 0.51 45.45 13066.53 164.97
5 Goa 0.00 292.83 41.02 0.00 0.00 71.99 2.47
6 Gujarat 1013.39 21786.72 2656.26 7637.34 0.00 5443.02 387.45
7 Haryana 49.50 988.42 238.30 285.63 0.00 732.52 721.65
8 Himachal Pradesh 121.89 2056.50 15.69 1.36 0.00 4589.98 4278.17
9 Jammu & Kashmir 21.25 4495.30 246.50 0.00 0.00 2491.66 267.51
10 Karnataka 301.52 9087.68 32.76 125.11 0.00 8299.41 97.4611 Kerala 0.00 357.93 136.00 0.00 0.00 609.30 3.99
12 Madhya Pradesh 7569.11 36977.87 51.72 162.81 0.00 20437.77 302.44
13 Maharashtra 1700.37 31386.91 527.57 251.66 0.00 13430.67 1349.40
14 Manipur 0.00 1.32 324.60 0.00 12014.06 608.64 0.00
15 Meghalaya 0.00 4190.63 14.87 0.00 2086.77 3612.11 0.00
16 Mizoram 0.00 0.00 0.00 0.00 3761.23 310.45 0.00
17 Nagaland 0.00 1596.46 0.00 0.00 5224.65 1582.99 0.00
18 Orissa 185.82 8358.68 379.10 51.49 115.25 10014.07 13.43
19 Punjab 168.52 339.44 352.01 173.29 0.00 353.29 113.71
20 Rajasthan 4952.77 27152.76 289.66 2722.99 0.00 12541.89 12208.44
21 Sikkim 0.00 1073.11 0.00 0.00 0.00 1060.57 0.0022 Tamilnadu 0.00 286.87 0.11 0.00 400.88 588.18 0.00
23 Tripura 226.12 7697.91 415.80 2479.73 0.53 9634.25 168.94
24 Uttar Pradesh 2806.52 5498.99 4981.43 5811.94 0.00 3338.32 446.36
25 West Bengal 171.90 1245.16 1931.54 131.25 0.00 777.58 384.97
26 UTs 12.83 25.74 24.60 39.01 0.00 289.97 5.43
20553.36 194014.30 16568.46 20477.38 35142.18 140652.32 25978.92
Source : Forestry Statistics in India, 2003
Note : 1,20,8849 sq kms in Jammu & Kashmir is not mapped and hence not curidered for calculating per precentage
50
Deg.
Notified
forest land
Gullied/
Ravinous
land
Shiffting
cultivation
area
Total
States/UTs.Sl.
No.
Waterlogged/
Marshy land
TABLE 3.2.13 : STATE WISE AND CATEGORY WISE WASTE LANDS OF INDIA
Saline/
alkaline
area
(Sq.km)
Deg.
Pastures/o
razing
land
Land
with/without
scrub

8/14/2019 Comp Env 2007 Chp3
http://slidepdf.com/reader/full/comp-env-2007-chp3 29/54
FORESTS
(Sq Km)
States/UTs.
1 10 11 12 13 14 15 16 17 18
Andhra Pradesh 52.91 464.70 98.88 5196.27 388.96 0.00 51750.19 275068.00 18.81
Arunachal Pradesh 6.07 309.43 0.30 1262.36 7.93 6732.17 18326.25 83743.00 21.88
Assam 0.00 3764.54 0.43 54.88 0.00 0.00 20019.17 78438.00 25.52
Bihar 79.80 222.08 184.23 688.91 97.10 0.00 20997.55 173877.00 12.08
Goa 32.19 0.00 110.73 58.55 3.49 0.00 613.27 3702.00 16.57
Gujarat 78.32 188.42 49.66 3293.39 487.31 0.00 43021.28 196024.00 21.95
Haryana 134.12 465.01 13.72 105.12 0.00 0.00 3733.98 44212.00 8.45
Himachal Pradesh 2457.59 105.04 85.66 3858.04 1529.67 12559.42 31659.00 55673.00 56.87
Jammu & Kashmir 640.56 869.26 0.31 32821.50 1685.42 21904.97 65444.24 101387.00 64.55
Karnataka 104.74 43.96 77.78 2627.89 40.97 0.00 20839.28 191791.00 10.87Kerala 25.65 27.87 0.49 146.46 140.49 0.00 1448.18 38863.00 3.73
Madhya Pradesh 910.40 24.57 141.44 2950.97 184.65 0.00 69713.75 443446.00 15.72
Maharashtra 687.43 77.63 100.45 2587.42 1 389.57 0.00 53489.08 307690.00 17.38
Manipur 0.00 0.00 0.00 0.00 0.00 0.00 12948.62 22327.00 58.00
Meghalaya 0.00 0.00 0.00 0.00 0.00 0.00 9904.38 22429.00 44.16
Mizoram 0.00 0.00 0.00 0.00 0.00 0.00 4071.68 21081.00 19.31
Nagaland 0.00 0.00 0.00 0.00 0.00 0.00 8404.10 16579.00 50.69
Orissa 193.93 212.49 35.45 1574.09 207.88 0.00 21341.71 155707.00 13.71
Punjab 81.58 619.67 26.89 0.00 0.00 0.00 2228.40 50362.00 4.42
Rajasthan 21.14 40639.51 128.65 4799.02 182.28 0.00 105639.11 342239.00 30.87
Sikkim 0.00 0.00 0.00 10.34 0.00 1425.56 3569.58 7096.00 50.30Tamilnadu 0.00 0.00 0.00 0.00 0.00 0.00 1276.03 10486.00 12.17
Tripura 221.96 590.80 120.46 1155.92 301.50 0.00 23013.90 130058.00 17.70
Uttar Pradesh 50.44 470.21 29.26 1180.13 992.83 13166.37 38772.80 294411.00 13.17
West Bengal 2.93 879.13 47.34 130.46 16.24 0.00 5718.48 88752.00 6.44
UTs 46.34 47.33 0.00 83.05 0.00 0.00 574.30 10973.00 5.23
Total 5828.10 50021.65 1252.13 64584.77 7656.29 55788.49 638518.31 3166414.00 20.17
Source : Forestry Statistics in India, 2003
51
Total
Geog.
Area
% to
Total
Geog.
Area
Steep
Sloping
area
Snow/
Glacial
area
Total
Wasterland
Mining/
Industrial
wasterlands
Sands-
inland/
costal
TABLE 3.2.13 : STATE WISE AND CATEGORY WISE WASTE LANDS OF INDIA..Concld.
Barren
Rocky
area
Deg. Land
under
plantation
crop

8/14/2019 Comp Env 2007 Chp3
http://slidepdf.com/reader/full/comp-env-2007-chp3 30/54
5 2
CHART 3.2.13 : STATE-WISE WASTELAND AS PERCENTAGE TO THE TOTAL G
0.00
10.00
20.00
30.00
40.00
50.00
60.00
70.00
A n d h r aP r a d
e s h
A r un a c h al P r a d e s h
A s s am
B i h ar
G o a
G u j ar a t
H ar y an a
Hi m a c h al P r a d e s h
J amm u & K a
s h mi r
K ar n a t ak a
K er al a
M a d h y aP r a d e s h
M ah ar a s h t r a
M ani p ur
M e gh al a y a
Mi z or am
N a g al an d
Or i s s a
P un j a b
STATES
P E R C E N T A G E A R E A
I N
S Q . K M
Geog. Area

8/14/2019 Comp Env 2007 Chp3
http://slidepdf.com/reader/full/comp-env-2007-chp3 31/54
FORESTS
Sl.No.
Year Forest Area Diverted Cummulative Area Diverted
1 1980 Nil Nil
2 1981 1331.70 1331.70
3 1982 3674.32 5006.02
4 1983 5100.51 10106.53
5 1984 9348.90 19455.43
6 1985 7676.83 27132.26
7 1986 9310.45 36442.71
8 1987 25925.97 62368.68
9 1988 4868.71 67237.39
10 1989 66768.09 134005.48
11 1990 127361.79 261367.27
12 1991 5065.35 266432.62
13 1992 21756.77 288189.39
14 1993 16182.51 304371.90
15 1994 59962.02 36433.92
16 1995 51428.98 41562.90
17 1996 32862.55 448625.45
18 1997 24738.43 47363.88
19 1998 18425.21 491789.09
20 1999 45784.41 537573.50
21 2000 22386.43 559959.93
22 2001 267897.61 827857.54
23 2002 51172.31 879029.85
24 2003 42729.68 921759.53
25 2004 33079.50 954839.03
Source : Forests & Wildlife Statistics, India, 2004,MOEF
TABLE 3.2.14 : DIVERSION OF FOREST LAND FOR NON FOREST USE
SINCE THE ENFORCEMENT OF FOREST CONSERVATION ACT,1980
(Area in ha.)

8/14/2019 Comp Env 2007 Chp3
http://slidepdf.com/reader/full/comp-env-2007-chp3 32/54
5 4
CHART 3.2.14: FOREST LAND DIVERSION
0.00
500.00
1000.00
1500.00
2000.00
2500.00
3000.00
1981 1985 1990 1995 1996 1997 1998 1999 20
YEAR
A R E
A
I N
S Q . K M S .

8/14/2019 Comp Env 2007 Chp3
http://slidepdf.com/reader/full/comp-env-2007-chp3 33/54
FORESTS
(As on 01-01-2004)
Sl.
No.
State No. of JFM
Committees
Area Under JFM
( in ha)
Total No. of
Families involved
in JFM
1 2 3 4 5
1 Andhra Pradesh 7245 1886764.00 611095
2 Arunachal Pradesh 308 80217.00 20474
3 Assam 503 79251.00 67341
4 Bihar 493 267240.94 242639
5 Chhattisgarh 6881 2846762.16 1360251
6 Goa 26 13000.00 336
7 Gujarat 1424 160525.41 149191
8 Haryana 875 56000.00 165500
9 Himachal Pradesh 835 290922.80 259069
10 Jammu & Kashmir 935 49544.00 48460
11 Jharkhand 3358 847967.93 296135
12 Karnataka 3470 232734.00 243357
13 Kerala 323 170712.00 4062414 Madhya Pradesh 13698 5500000.00 1641000
15 Maharashtra 5322 1411215.00 921634
16 Mnipur 205 93941.00 19451
17 Mizoram 249 10980.00 32241
18 Nagaland 306 22930.00 57492
19 Orissa 15985 821504.00 --
20 Punjab 287 56243.95 38022
21 Rajasthan 3667 376766.00 300295
22 Sikkim 158 600.00 3268
23 Tamil Nadu 1816 445965.00 270934
24 Tripura 234 34154.00 20239
25 Uttar Pradesh 2030 112652.93 620265
26 Uttranchal 10107 859028.00 499980
27 West Bengal 3892 604334.00 465395
84632 17331955.12 8384788
Source : Ministry of Environment & Forests, Annual Report 2003-2004
Total
TABLE: 3.2.15 : PROGRESS OF JOINT FOREST MANAGEMENT IN INDIA
Participation of people in the protection and management of forests has been
emphasised in the National Forest Policy, 1988. Pursuant to this policy,
Government of India through its resolution dated 1st June '90 formalised the JFM
Programme. The JFM is being practiced through constitution of forest protection
committees. About 84,632 committees are managing a total of 17.33 million ha
of forest area under JFM .

8/14/2019 Comp Env 2007 Chp3
http://slidepdf.com/reader/full/comp-env-2007-chp3 34/54
FAUNA
Sl. No. Biogeographic Zone Biotic Province Total Area (Sq.Km)
1 2 3 4
1 Trans-Himalayan Upper Regions 186200
2 Himalayan North-Western 69000
Western 72000
Central 123000
Eastern 83000
3 Desert Kachchh 45000
Thar 180000
Ladakh (cold) NA
4 Semi-Arid Central India 107600Gujarat-Rajwara 400400
5 Western Ghats Malabar Coast 59700
Western Ghat Mountains 99300
6 Deccan Peninsula Deccan South Plateau 378000
Central Plateau 341000
Eastern Plateau 198000
Chhota Nagpur 217000
Central Highlands 287000
7 Gangetic Plain Upper Gangetic 206400Lower Gangetic 153000
8 North-East India Brahmaputra Valley 65200
North-Eastern Hills 106200
9 Islands Andaman Islands 6397
Nicobar Islands 1930
Lakshadweep 180
10 Coasts West Coast 6500
East Coast 6500
Source : "Conserving our Biological Wealth", WWF for Nature-India (modified) and
Zoological Survey of India
TABLE 3.3.1 : INDIA'S MAJOR BIOGEOGRAPHIC HABITATS

8/14/2019 Comp Env 2007 Chp3
http://slidepdf.com/reader/full/comp-env-2007-chp3 35/54
FAUNA
Sl. % In India
No. India World
1 2 3 4 5
I PROTISTA 2577 31250 8.24
1 Protozoa 2577 31250 8.24
II ANIMALIA 86808* 1196903 7.25
1 Mesozoa 10 71 14.08
2 Porifera 486 4562 10.65
3 Cnidaria 842 9916 8.49
4 Ctenophora 12 100 12.00
5 Platyhelminthes 1622 17500 9.27
6 Nemertinea -- 600 --
7 Rotifera 330 2500 13.20
8 Gastrotricha 100 3000 3.33
9 Kinorhyncha 10 100 10.00
10 Nematoda 2850 30000 9.50
11 Nematomorpha -- 250 --
12 Acanthocephala 229 800 2862.0013 Sipuncula 35 145 24.14
14 Mollusca 5070 66535 7.62
15 Echiura 43 127 33.86
16 Annelida 840 12700 6.61
17 Onychophora 1 100 1.00
Arthropoda 68389 987949 6.90
1 Crustacea 2934 35534 8.26
2 Insecta 59353 867391 6.83
3 Arachnida 5818 73440 7.90
4 Pycnogonida 16 600 2.67
5 Pauropoda -- 360 --
6 Chilopoda 100 3000 3.33
7 Diplopoda 162 7500 2.168 Symphyla 4 120 3.33
9 Merostomata 2 4 50.00
10 Phoronida 3 11 27.27
11 Bryozoa (Ectoprocta) 200 4000 5.00
12 Entoprocta 10 60 16.66
13 Brachiopoda 3 300 1.00
14 Pogonophora -- 80 --
15 Priapulida -- 8 --
16 Pentastomida -- 70 --
17 Chaetognatha 30 111 27.02
18 Tardigrada 30 514 5.83
19 Echinodermata 765 6223 12.29
20 Hemichordata 12 120 10.00
Chordata 4886 48451 10.07
1 Protochordata 119 2106 5.65
(Cephalochordata +Urochordata)
2 Pisces 2546 21723 11.72
3 Amphibia 209 5150 4.06
4 Reptilia 456 5817 7.84
5 Aves 1166 9026 12.91
6 Mammalia 390 4629 8.42
89385 1228153 7.28
(Protista I + Animalia II)
No. of Species
TABLE 3.3.2 : ESTIMATED NUMBER OF SPECIES
Taxonomic Group
Grand Total
Source : Zoological Survey of India

8/14/2019 Comp Env 2007 Chp3
http://slidepdf.com/reader/full/comp-env-2007-chp3 36/54
FAUNA
Category
Mammalia Aves Reptilia Amphibia Total
1 2 3 4 5 6 7
1 Rare -- 2 -- -- 2
2 Vulnerable 28 22 4 -- 54
3 Endangered 29 21 16 1 67
4 Critical* 3 8 -- -- 11
5 Extinct** 1 2 -- -- 3
6 Insufficiently Known 16 -- -- -- 16
77 55 20 1 153
Source : Zoological Survey of India.
* Mammal - Brow - Antlered Deer, Yak, Hispid Hare
Aves - Christmas Island Frigate Bird, Mrs. Hume's Bartailed Pheasant,
Burmese Peafowl, Blacknecked Crane, Hooded Crane, Masked
Finfoot, Jerdon's Courser, Forest Spotted Owlet.
** Mammal - Cheetah.
Aves - Pinkheaded Duck, Mountain Quail
TABLE 3.3.3 (a): RARE AND THREATENED SPECIES (VERTEBRATES)
Sl.
No.
Approximate Number
Total
A taxon is Rare when its populations are small and at present not endangered or vulnerable
but are at risk .
A taxon is Insufficiently Known when an evaluation has been made but the available data are
inadequate to assign a category.
A taxon is Extinct, when there is no reasonable doubt that the last Individual has died.
A taxon is Critical when it is facing an extremely high probability of extinction in the wild in the
immediate future.
A taxon is Endangered when it is not critical but is facing a very high probability of extinction in
the wild in the near future.
A taxon is Vulnerable when it is not critical or endangered but is facing a high probability of
extinction in the wild in the medium-term future.

8/14/2019 Comp Env 2007 Chp3
http://slidepdf.com/reader/full/comp-env-2007-chp3 37/54
FAUNA
1 Schedule 1a)
(i) Anoxypristis cuspidate
(ii) Carcharhinus hemiodon
(iii) Glyphius gangeticus
(iv) Glyphius glyphius
(v) Himantura fluviatilis
(vi) Pristis microdon
(vii) Pristis zijsron
(viii) Rhynchobatus djiddensis(ix) Urogymnus asperrimus
(b)
1 Cassis cornuta (Linnalus)
2 Charonia tritonis (Linnalus)
3 Conus milne -edwardi Jousseaume
4 Cypraecssis rufa (Linnacus)
5 Hippopus hippopus
6 Nautilus Pompilius (Linnaeus)
7 Tridacna maxima (Roeding)8 Tridacna squamosa Lamarela
9 Tudicla Spirillus (Linnaeus)
2
i. Cypraea limacina' Lamarck
ii. Cypraea mappa Linnaeus
iii. Cypraea talpa Linnaeus
iv. Fasciolaria trapezium = Pleuroploca trapezium (Linnaeus)
v. Harpulina arausica
vi. Lambis chiragra Chiragra (Linnaeus)
vii. Lambis chiragra arthiticavii i. Lambis Crocalta Croeata (Link)
ix. Lambis millepeda (Linnaeus)
x. Lambis scorpio (Linnaeus)
xi. Lambis trunceta (Humphrey)
xii. Plaeuna placenta Linnaeus
xii i. Strombus plicatus sibbaldi Sowerby
xiv. Trochus niloticus Linnaeus
xv. Turbo marmoratus Linnaeus
Source : Zoological Survey of India.
As per the Gazette Notification number 1-4/95 WL dated 5th
November, 2001, published in Part II Section 3,
subsection (II), Extraordinary Gazette of India, the Central Government ( Ministry of Environment and Forests)
has made amendments in Schedule I and Schedule IV of the Subsection (1) of section 61 of the Wild Life
(Protection ) Act, 1972 and included the following species in the Schedules of Threatened and endangered
species
for Part IVB, relating to Mollusca and the entries relating there to, the following Part IVB and the entries
shall be substituted, namely:-
3.3.3 (b): RECENT ADDITION IN THE LIST OF THREATENED/ ENDANGERED SPECIES
"2. Shark and Ray
"Part lV B-Mollusca
"19. Mollusca
In Schedule IV to the said Act, after serial number 18 and the entries relating there to, the following
serial numbers and entries shall be added, namely:-
in Para II related to " Fishes" for serial number 2 and the entry relating thereto the following serial
number and entries shall be substituted, namely
8/14/2019 Comp Env 2007 Chp3
http://slidepdf.com/reader/full/comp-env-2007-chp3 38/54
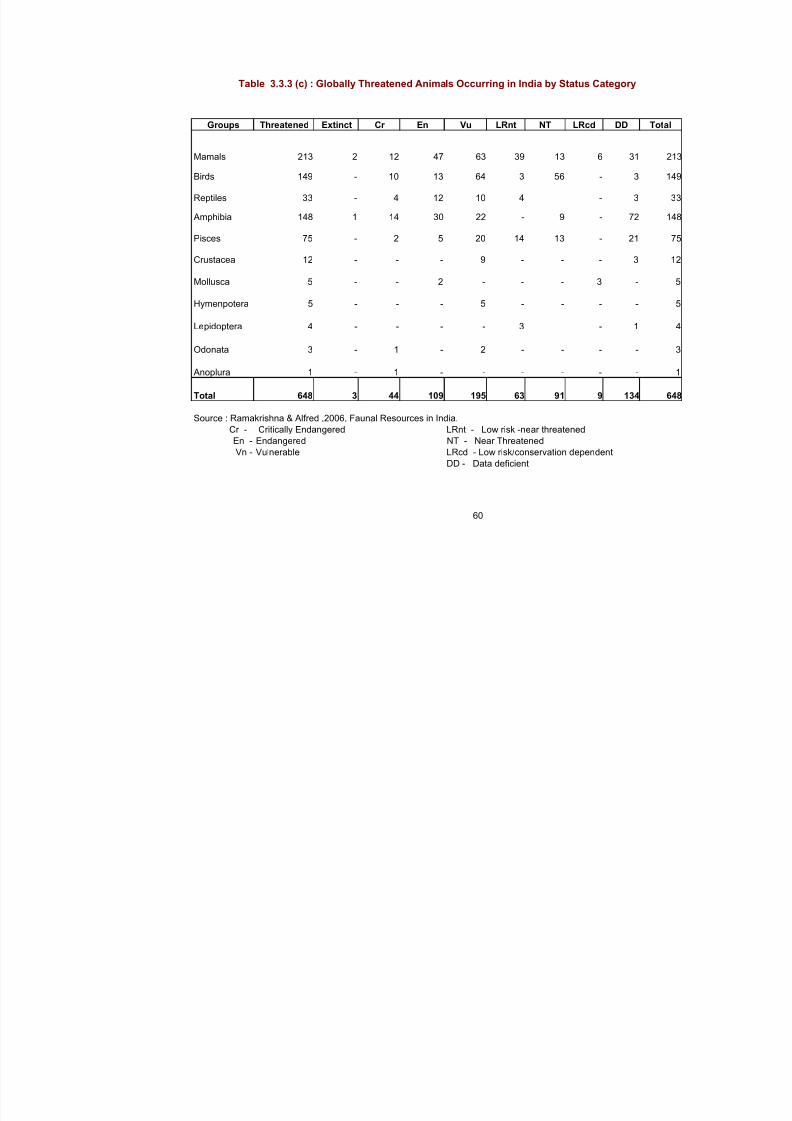
Groups Threatened Extinct Cr En Vu LRnt NT LRcd DD
Mamals 213 2 12 47 63 39 13 6 31
Birds 149 - 10 13 64 3 56 - 3
Reptiles 33 - 4 12 10 4 - 3
Amphibia 148 1 14 30 22 - 9 - 72
Pisces 75 - 2 5 20 14 13 - 21
Crustacea 12 - - - 9 - - - 3
Mollusca 5 - - 2 - - - 3 -
Hymenpotera 5 - - - 5 - - - -
Lepidoptera 4 - - - - 3 - 1
Odonata 3 - 1 - 2 - - - -
Anoplura 1 - 1 - - - - - -
Total 648 3 44 109 195 63 91 9 134
Source : Ramakrishna & Alfred ,2006, Faunal Resources in India.
Cr - Critically Endangered LRnt - Low risk -near threatened
En - Endangered NT - Near Threatened
Vn - Vulnerable LRcd - Low risk/conservation dependent
DD - Data deficient
Table 3.3.3 (c) : Globally Threatened Animals Occurring in India by Status Category
60

8/14/2019 Comp Env 2007 Chp3
http://slidepdf.com/reader/full/comp-env-2007-chp3 39/54
FAUNA
Sl.
No.
1 2 3 4 5
1 Protozoa
I Free living 1247 90 7.21
II Parasitic 1330 550 41.33
2 Mesozoa 10 10 100.00
3 Porifera
I Freshwater 31 13 41.93
4 Cnidaria 842 10 * --
5 Platyhelminthes 1622 1160 71.88
6 Rotifera 330 23 7.00
7 Gastroticha 100 64 64.00
8 Kinorhyncha 10 7 70.00
9 Nematoda 2850 400 * --
10 Acanthocephala 229 203 88.64
11 Mollusca
I Terrestrial 1487 498 33.50
II Freshwater 183 77 41.80
12 Echiura 43 12 28.00
13 Annelida
I Oligochaeta 473 368 77.80
II Hirudinea 59 25 42.37
14 Arthropoda
I Crustacea 2934 501 17.07
II Insecta 59353 20717 34.90
III Arachnida 5818 2623 45.08
15 Phoronida 11 1 9.00
16 Bryozoa 4000 12 * --
17 Entoprocta 10 1 10.00
18 Chaetognatha 111 3 2.70
19 Chordata
I Pisces 2546 223 8.75
II Amphibia 209 128 61.24
III Reptilia 456 214 47.00
IV Aves 1166 ** 50 ** 4.29 **
V Mammalia 390 42 ** 11.28
Source : Faunal Diversity in India (1998) with updated (**) figures, Zoological Survey of India.
* : Complete data not available, hence percentage not calculated
** : Rec. Zool. Survey of India, occasional paper no. 200 (2002)
Rec. Zool. Survey of India, occasional paper no. 201 (2002)
TABLE 3.3.4 : ESTIMATED NUMBER/PERCENTAGE OF ENDEMIC SPECIES IN INDIA
PercentageTaxon Number of Species
Total Endemic

8/14/2019 Comp Env 2007 Chp3
http://slidepdf.com/reader/full/comp-env-2007-chp3 40/54
FAUNA
As on 31st July 2004Total Area
Number Area Number Area
1 2 3 4 5 6 7
1 Andhra Pradesh 4 373.23 21 13096.23 13469.46
2 Arunachal Pradesh 2 2468.23 11 7606.37 10074.60
3 Assam 5 1977.79 16 888.22 2866.01
4 Bihar 1 335.60 11 2993.16 3328.76
5 Chhatisgarh 3 2929.50 10 3419.46 6348.96
6 Delhi 0 0.00 1 17.76 17.76
7 Goa 1 107.00 6 647.96 754.96
8 Gujarat 4 479.67 22 16602.61 17082.28
9 Haryana 2 46.98 9 287.32 334.30
10 Himachal Pradesh 2 1429.40 32 5665.92 7095.32
11 Jammu & Kashmir 4 3810.07 16 10163.67 13973.74
12 Jharkhand 1 231.67 10 1868.31 2099.98
13 Karnataka 5 2472.18 21 4231.44 6703.6214 Kerala 3 536.52 12 1788.20 2324.72
15 Madhya Pradesh 9 3656.35 25 7199.52 10855.87
16 Maharashtra 5 955.93 36 14729.64 15685.57
17 Manipur 1 40.00 5 706.50 746.50
18 Meghalaya 2 267.48 3 34.21 301.69
19 Mizoram 2 200.00 5 775.00 975.00
20 Nagaland 1 202.02 3 20.35 222.37
21 Orissa 2 990.70 18 7961.94 8952.64
22 Punjab 0 0.00 10 316.71 316.71
23 Rajasthan 4 3859.37 24 5301.84 9161.21
24 Sikkim 1 1784.00 6 265.10 2049.10
25 Tamil Nadu 5 307.84 20 2997.57 3305.41
26 Tripura 0 0.00 4 603.08 603.08
27 Uttaranchal 6 4083.31 6 2868.00 6951.31
28 Uttar Pradesh 1 490.10 23 5185.90 5676.00
29 West Bengal 5 1692.65 15 1223.47 2916.12
30 Andaman & Nicobar Islands 9 1153.94 96 466.22 1620.16
31 Chandigarh 0 0.00 2 26.01 26.01
32 Dadra & Nagar Haveli 0 0.00 1 92.00 92.00
33 Daman & Diu 0 0.00 1 2.18 2.18
34 Lakshadweep 0 0.00 1 0.01 0.01
35 Pondicherry 0 0.00 0 0.00 0.00
90 36881.53 502 120051.88 156933.41
Source:Wildlife Division of MOE&F
Total
TABLE 3.3.5 : NATIONAL PARKS AND WILDLIFE SANCTUARIES OF INDIA
( Area in Sq. Km.)
Sl.
No.
State National Parks Wildlife Sanctuaries
The Wildlife (Protection) Act, 1972 provided for setting up National
Parks and Sanctuaries for Wildlife. The basic idea of these National Parks and
Sanctuaries is to provide natural habitats for the Wildlife. The aim is not only to
protect and preserve remains of wild fauna and flora but also to augment this
price-less national heritage.
In India, at present there are 502 Wildlife Sanctuaries and 90
National Parks, covering an area of 156933.41 Sq. Km.

8/14/2019 Comp Env 2007 Chp3
http://slidepdf.com/reader/full/comp-env-2007-chp3 41/54
FAUNA
1972 1979 1984 1989 1993 1995 1997 2001-02 *
1 2 3 4 5 6 7 8 9 10
1 Bandipur (Karnataka) 10 39 53 50 66 74 75 822 Corbett(Uttaranchal) 44 84 90 91 123 128 138 137
3 Kanha(Madhya Pradesh) 43 71 109 97 100 97 114 127
4 Manas(Assam) 31 69 123 92 81 94 125 65*
5 Melghat (Maharashtra) 27 63 80 77 72 71 73 73
6 Palamu (Jharkhand) 22 37 62 55 44 47 44 32
7 Ranthombore (Rajasthan) 14 25 38 44 36 38 32 35
8 Similipal(Orissa) 17 65 71 93 95 97 98 99
9 Sunderbans (West Bengal) 60 205 264 269 251 242 263 245
10 Periyar (Kerala) - 34 44 45 30 39 40 36
11 Sariska (Rajasthan) - 19 26 19 24 25 24 22
12 Buxa (West Bengal) - - 15 33 29 31 32 31
13 Indravati (Madhya Pradesh) - - 38 28 18 15 15 29
14 Nagarkimasagar (Andhra Pradesh) - - 65 94 44 34 39 6715 Namdhapa (Arunachal Pradesh) - - 43 47 47 52 57 61
16 Dudhwa (Uttar Pradesh) - - - 90 94 98 104 76*
17 Kalalad (Tamil Nadu) - - - 22 17 16 28 27
18 Valmiki (Bihar) - - - 81 49 N.R 53 53
19 Pench (Madhya Pradesh) - - - - 39 27 29 40
20 Tadoba (Maharashtra) - - - - 34 36 42 38
21 Bandhavgarh (Madhya Pradesh) - - - - 41 46 46 56
22 Panna (Madhya Pradesh) - - - - 25 22 22 31
23 Dampha(Mizoram) - - - - 7 4 5 4
24 Pench (Maharashtra) - - - - -
10
(1994) - 14
25 Bhadra (Karnataka) - - - - - - - 35
26 Pakhui- Nameri (Arunachal Pradesh) - - - - - - - 26 Nameri
27 Bori-Satpura (Madhya Pradesh) - - - - 30 35
268 711 1121 1327 1366 1333 1498 1576
Source: Project Tiger, Ministry of Environment & Forests
* : under compilation/vetting
TABLE 3.3.6 (a) : ALL INDIA TIGER POPULATION IN TIGER RESERVES
Total
Sl.
No.Name of Reserve
Years

8/14/2019 Comp Env 2007 Chp3
http://slidepdf.com/reader/full/comp-env-2007-chp3 42/54
Sl.
No.
State 1972 1979 1984 1989 1993 1997 2001-02**
1 2 3 4 5 6 7 8 9
1 Tamilnadu 33 65 95 97 62 602 Maharashtra 160 174 301 417 276 257 238
3 West Bengal 73 296 352 353 335 361 349
4 Karnataka 102 156 202 257 305 350 401
5 Bihar 85 110 138 157 137 103 76
6 Assam 147 300 376 376 325 458 354
7 Rajasthan 74 79 96 99 64 58 58
8 Madhya Pradesh 457 529 786 985 912 927 710
9 Uttar Pradesh 262 487 698 735 465 475 284
10 Andhra Pradesh 35 148 164 235 197 171 192
11 Mizoram - 65 33 18 28 12 28
12 Gujarat 8 7 9 9 5 1 -
13 Goa Daman & Diu - - - 2 3 6 514 Orissa 142 173 202 243 226 194 173
15 Kerala 60 134 89 45 57 73 71
16 Chattisgarh - - - - - - 227
17 Jhaarkhand - - - - - - 34
18 Uttaranchal - - - - - - 251
Total 1638 2723 3446 4026 3432 3508 3511
19 Meghalya 32 35 125 34 53 * 47
20 Manipur 1 10 6 31 - * NR
21 Tripura 7 6 5 - - * NR
22 Nagaland 80 102 104 104 83 * 23
23 Arunachal Pradesh 69 139 219 135 180 * 61***
24 Sikkim - - 2 4 2 * NR
25 Haryana - - 1 - - - -
Total 189 292 462 308 318 - 131
1 Grand Total 1827 3015 3908 4334 3750 3508 3642
Source: Project Tiger, Ministry of Environment & Forests-2005
NR : Not Reported by States
* : Tiger Census was not carried out in North East States in 1997.
** : Under vettting
*** : only for Namdapha Tiger Reserve
TABLE 3.3.6 (b) : POPULATION OF TIGERS IN STATES
Chart 3.3.6:Population of Tigers
0
1000
2000
3000
4000
5000
1972 1979 1984 1989 1993 1997 2001-02**
Year

8/14/2019 Comp Env 2007 Chp3
http://slidepdf.com/reader/full/comp-env-2007-chp3 43/54
FAUNA
Sl. Year of Name of Tiger State Total Area in
No. Creation Reserve sq. Kms.
1 2 3 4 5
1 1973-74 Bandipur Karnataka 866
1999-2000 Nagarhole (extension) 642
2 1973-74 Corbett Uttaranchal 1316
3 1973-74 Kanha Madhya pradesh 1945
4 1973-74 Manas Assam 2840
5 1973-74 Melghat Maharashtra 1677
6 1973-74 Palamau Bihar 1026
7 1973-74 Ranthambhore Rajasthan 34
8 1973-74 Similipal Orissa 2750
9 1973-74 Sunderbans West Bengal 2585
10 1978-79 Periyar Kerala 777
11 1978-79 Sariska Rajasthan 6
12 1982-83 Buxa West Bengal 759
13 1982-83 Indravati Madhya Pradesh 2799
14 1982-83 Nagarjunsagar Andhra Pradesh 3568
15 1982-83 Namdapha Arunachal Pradesh 1985
16 1987-88 Dudhwa Uttar Pradesh 811
1999-2000 Katerniaghat (extension) 551
17 1988-89 Kalakad- Mundanthurai Tamil Nadu 800
18 1989-90 Valmiki Bihar 840
19 1992-93 Pench Madhya Pradesh 758
20 1993-94 Tadoba-Andheri Maharashtra 620
21 1993-94 Bandhavgarh Madhya Pradesh 1162
22 1994-95 Panna Madhya Pradesh 542
23 1994-95 Dampha Mizoram 500
24 1998-99 Bhadra Karnataka 492
25 1998-99 Pench Maharashtra 257
26 1999-2000 Pakui Arunachal Pradesh 862
27 1999-2000 Nameri Assam 344
28 1999-2000 Bori, Satpura, Panchmari Madhya pradesh 1486
37761
TABLE 3.3.7 : AREA OF TIGER RESERVES IN TIGER RANGE STATES
Total
Source : Annual Report, MOE & F -2006-07

8/14/2019 Comp Env 2007 Chp3
http://slidepdf.com/reader/full/comp-env-2007-chp3 44/54
Sl. No. Elephant Range Elephant Reserve State Date of
Notification
Total Area
(Sq. Km)
P.A. in ER
(Sq.Km)
Elephant
Population
in 2005
1 2 3 4 5 6 7 8
Mayurjharna W. Bengal 24.10.2002 414 - 96
Singhbhum Jharkhand 26.09.2001 4530 193 371
Mayurbhanj Orissa 29.09.2001 3214 1309 465
Mahanadi* Orissa 19.06.2002 1038 964 464
Sambalpur* Orissa 27.03.2002 427 427 284
Baitarni ER# Orissa 1755 - 108
South Orrissa ER# Orissa 4216 750 138
Lemru # Chattisgarh 450 - -
Badalkhol-Tamorpingla # Chattisgarh 1048.3 1154.93 -
15594 3643 1978
Kameng Ar. Pradesh 19.06.2002 1892 748
Sonitpur Assam 7.03.2003 1420 420 612
3312 1168 612+
Dihing-Patkai Assam 17.04.2003 937 345 295
Deormali* Ar. Pradesh 1957.5 378.13 129
1837+ 345 424
Kaziranga-Karbi Anglong Assam 17.04.2003 3270 1073 1940
Dhansiri-Lungding Assam 19.04.2003 2740 - 275
Intanki # Nagaland 28.02.2005 202 202 30
6212 1275 2245
Chirang-Ripu Assam 6.03.2003 2600 526+ 658
E. Dooars W. Bengal 28.08.2002 978 484 300-350
3578 1010 1008
6 Garo Hills (Meghalaya) Garo Hills Meghalaya 31.10.2001 3500 402 1047
Khasi Hills ER^ Meghalaya - 383
1430
Mysore Karnataka 25.11.2002 6724 3103 4452
Wayanad Kerala 2.04.2002 1200 394 636
Nilgiri Tamilnadu 15.10.2003 4663 716 2862
Rayala # A. Pradesh 766 525 12
13353 4738 7962
Nilambur Kerala 2.04.2002 1419 90 281
Coimbatore Tamilnadu 15.10.2003 566 482 329
1985 572 610
Anamalai Tamilnadu 15.10.2003 1457 300 179
Anamudi Kerala 2.04.2002 3728 780 10726
5185 1080 1430
Periyar Kerala 2.04.2002 3742 1058 1100Srivilliputhur Tamilnadu 15.10.2003 1249 568 638
4991 1626 1738
11 Northern India
(Uttaranchal)
Shivalik Uttaranchal 28.10.2002 5405 1340 1510
Ganga-Jamuna ER# U.P. 744 - NA
6149 1340 1510
TOTAL 58900+ 16400+ 21200+
Sorce : Project Elephant, Ministry of Environment and Forests
# Approved by Govt. of India, but not yet notified by the Stale Government.
* Proposalfor extension approved by GOI, but not yet notified by the state.
^ Under consideration ER : Elephant Reserve
Total
Nilgiri -Eastern Ghat
(Karnataka- Kerala-
Tamilnadu-Andhra)
10
North Brahamputra
Arunachal - Assam)
3 South Brahamputra
(Assam- Arunachal)
2
Periyar (Kerala-Tamilnadu)
9
South Nilgiri (Kerala-
Tamilnadu)
8
Total
TABLE 3.3.8: DESIGNATED ELEPHANT RESERVES IN INDIA (Revised Network-2005)
Eastern India ( South
West Bengal-Jharkhand-
Orissa)
5 Eastern Dooars (Assam-
\W. Bengal)
4 Kaziranga (Assam-
Nagaland)
1
Total
Western Ghat
(Tamilnadu- Kerala)
7
TOTAL
Total
Total
Total
Total
Total
Total
Total
8/14/2019 Comp Env 2007 Chp3
http://slidepdf.com/reader/full/comp-env-2007-chp3 45/54
Sl.
No
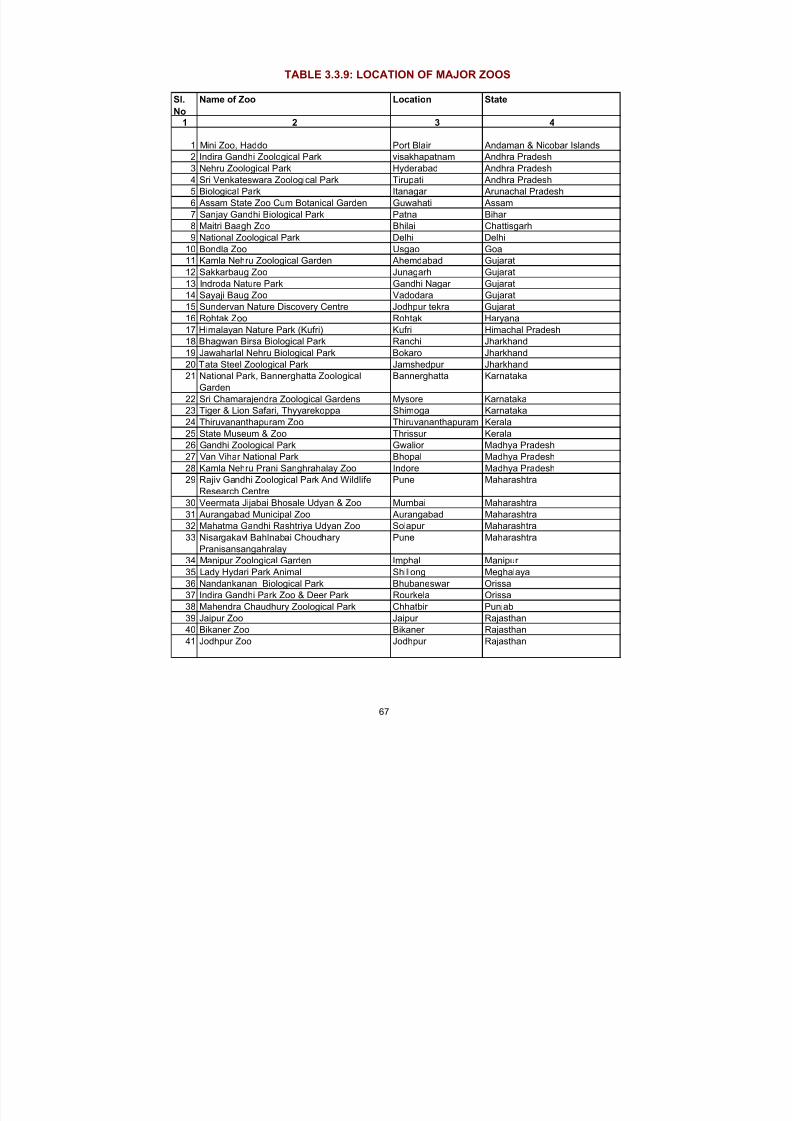
Name of Zoo Location State
1 2 3 4
1 Mini Zoo, Haddo Port Blair Andaman & Nicobar Islands
2 Indira Gandhi Zoological Park visakhapatnam Andhra Pradesh
3 Nehru Zoological Park Hyderabad Andhra Pradesh
4 Sri Venkateswara Zoological Park Tirupati Andhra Pradesh
5 Biological Park Itanagar Arunachal Pradesh
6 Assam State Zoo Cum Botanical Garden Guwahati Assam
7 Sanjay Gandhi Biological Park Patna Bihar
8 Maitri Baagh Zoo Bhilai Chattisgarh
9 National Zoological Park Delhi Delhi
10 Bondla Zoo Usgao Goa
11 Kamla Nehru Zoological Garden Ahemdabad Gujarat
12 Sakkarbaug Zoo Junagarh Gujarat13 Indroda Nature Park Gandhi Nagar Gujarat
14 Sayaji Baug Zoo Vadodara Gujarat
15 Sundervan Nature Discovery Centre Jodhpur tekra Gujarat
16 Rohtak Zoo Rohtak Haryana
17 Himalayan Nature Park (Kufri) Kufri Himachal Pradesh
18 Bhagwan Birsa Biological Park Ranchi Jharkhand
19 Jawaharlal Nehru Biological Park Bokaro Jharkhand
20 Tata Steel Zoological Park Jamshedpur Jharkhand
21 National Park, Bannerghatta Zoological
Garden
Bannerghatta Karnataka
22 Sri Chamarajendra Zoological Gardens Mysore Karnataka
23 Tiger & Lion Safari, Thyyarekoppa Shimoga Karnataka
24 Thiruvananthapuram Zoo Thiruvananthapuram Kerala
25 State Museum & Zoo Thrissur Kerala
26 Gandhi Zoological Park Gwalior Madhya Pradesh
27 Van Vihar National Park Bhopal Madhya Pradesh
28 Kamla Nehru Prani Sanghrahalay Zoo Indore Madhya Pradesh
29 Rajiv Gandhi Zoological Park And Wildlife
Research Centre
Pune Maharashtra
30 Veermata Jijabai Bhosale Udyan & Zoo Mumbai Maharashtra
31 Aurangabad Municipal Zoo Aurangabad Maharashtra
32 Mahatma Gandhi Rashtriya Udyan Zoo Solapur Maharashtra
33 Nisargakavl Bahlnabai Choudhary
Pranisansangahralay
Pune Maharashtra
34 Manipur Zoological Garden Imphal Manipur
35 Lady Hydari Park Animal Shillong Meghalaya
36 Nandankanan Biological Park Bhubaneswar Orissa
37 Indira Gandhi Park Zoo & Deer Park Rourkela Orissa
38 Mahendra Chaudhury Zoological Park Chhatbir Punjab
39 Jaipur Zoo Jaipur Rajasthan
40 Bikaner Zoo Bikaner Rajasthan
41 Jodhpur Zoo Jodhpur Rajasthan
67
TABLE 3.3.9: LOCATION OF MAJOR ZOOS

8/14/2019 Comp Env 2007 Chp3
http://slidepdf.com/reader/full/comp-env-2007-chp3 46/54
Sl.
No
Name of Zoo Location State
1 2 3 4
42 Udaipur Zoo Udaipur Rajasthan
43 Arigna Anna Zoological Park Vandalur Tamil Nadu
44 Madras Crocodile Bank Trust/Centre For
Herpetology
Mahabalipuram Tamil Nadu
45 Chennai Snake Park Trust Guindy Tamil Nadu
46 Children's Corner Guindy Tamil Nadu
47 V.O.C. Park Mini Zoo Coimbatore Tamil Nadu
48 Sepahijala Zoological Park Sepahijala Tripura
49 Kanpur Zoological Park Kanpur Uttar Pradesh
50 Lucknow Prani Udyan Lucknow Uttar Pradesh
51 Pt Govind Ballabh Pant High Altitude Zoo Nainital Uttaranchal
52 Alipore Zoological Garden Calcutta West Bengal53 Calcutta Snake Park Badu West Bengal
54 Marble Palace Zoo Calcutta West Bengal
55 Padmaja Naidu Himalayan Zoological Park Darjeeling West Bengal
Source : Central Zoo Authority, Ministry of Environment & Forests
68
TABLE 3.3.9: LOCATION OF MAJOR ZOOS- Concld.

8/14/2019 Comp Env 2007 Chp3
http://slidepdf.com/reader/full/comp-env-2007-chp3 47/54
FAUNA
1977 1982 1987 1992 1997 2003
1 2 3 4 5 6 7 7
1 Cattle 180140 192453 199695 204584 198882 185181
2 Buffaloes 62019 69783 75967 84206 89918 97922
3 Sheep 40907 48765 45703 50783 57494 61469
4 Goats 75620 95255 110207 115279 122721 124358
5 Horses & Ponnies 916 900 797 817 826 751
6 Pigs 7647 10071 10626 12788 13291 13519
7 Mules 89 131 167 193 220 176
8 Donkeys 978 1024 958 967 881 650
9 Camels 1068 1078 1001 1031 911 632
II Other Livestock
1 Yaks 132 128 36 58 59 65
2 Mithuns 129 154 129 154 177 278
369645 419742 445286 470860 485379 485002
Source : Live Stock Census, Ministry of Agriculture
TABLE 3.3.10 : INDIA'S LIVESTOCK POPULATION
Total
Sl.
No.Livestock
Number of Animals
( Thousand)
The livestock population in the country increased from 292 million in 1951 tothe current estimate of 485 million. Grazing by Livestock puts pressure on
grasslands and forests. Because of excessive grazing, natural regeneration is either
absent or inadequate in 52.8% of the forests in the country.
An analysis of forests vis-a-vis livestock indicates continued free access to the
forest area which has resulted in high rates of growth of livestock population causing
land degradation and arresting the development of markets for forage crops.
Overgrazing impedes regeneration, retards growth of vegetation, and leads to
extinction of good palatable grasses which are replaced by less palatable and inferior
grasses. Extensive areas have been invaded by bushes which are not browsed,
excessive trampling makes the soil compact and impervious and prevents circulation
of air, water, thus exposing the soil to erosion by wind and water.
69

8/14/2019 Comp Env 2007 Chp3
http://slidepdf.com/reader/full/comp-env-2007-chp3 48/54
7 0
CHART 3.3.10 : INDIA'S LIVESTOCK POPULATION
0
50000
100000
150000
200000
250000
1982 1987 1992 1997
P O P U L A T I O N I N
T H O U S A N D S

8/14/2019 Comp Env 2007 Chp3
http://slidepdf.com/reader/full/comp-env-2007-chp3 49/54
Sr. No. States/UTs Mules D
Cross
bred
Indigenous Total
1 Andhra Pradesh 1107 8193 9300 10630 21376 6277 570 9 -
2 Arunachal Pradesh 13 445 458 11 19 231 330 7 0
3 Assam 440 7999 8440 678 170 2987 1543 12 0
4 Bihar* 1274 9455 10729 5743 382 9490 672 117 4
5 Chhatisgarh 253 8629 8882 1598 121 2336 552 4 -
6 Goa 12 63 76 37 - 11 87 - 0
7 Gujarat 639 6785 7424 7140 2062 4541 351 18 1
8 Haryana 573 967 1540 6035 633 460 120 25 14
9 Himachal Pradesh 677 1559 2236 774 926 1125 3 18 24
10 Jammu & Kashmir 1320 1764 3084 1039 3411 2055 2 172 40
11 Jharkhand 145 7513 7659 1343 680 5031 1108 5 -
12 Karnataka 1602 7936 9539 3991 7256 4484 312 14 -
13 Kerala 1735 387 2122 65 4 1213 76 - -
14 Madhya Pradesh 317 18595 18913 7575 546 8142 358 32 4
15 Maharashtra 2776 13527 16303 6145 3094 10684 439 40 1
16 Manipur 69 349 418 77 6 33 415 2 0
17 Meghalaya 23 744 767 18 18 327 419 2 0
18 Mizoram 9 27 36 6 1 17 218 2 -
7 1 19 Nagaland 243 208 451 34
4 175 644 1 -
20 Orissa 1063 12840 13903 1394 1620 5803 662 - -
21 Punjab 1531 508 2039 5995 220 278 29 29 9
22 Rajasthan 464 10390 10854 10414 10054 16809 338 25 3
23 Sikkim 80 79 159 2 6 124 38 2 0
24 Tamilnadu 5140 4001 9141 1658 5593 8177 321 25 0
25 Tripura 57 702 759 14 3 472 209 0 0
26 Uttar Pradesh 1634 16917 18551 22914 1437 12941 2284 154 52
27 Uttaranchal 228 1961 2188 1228 296 1158 33 17 22
28 West Bengal 1119 17794 18913 1086 1525 18774 1301 18 -
29 A& Nicobar 13 51 64 16 0 64 52 0 0
30 Chandigarh 5 1 6 23- 1 - - -
31 D & Nagar Haveli 1 49 50 4 - 21 3 - 0
32 Daman & Diu 0 4 4 1 - 4 - - 0
33 Delhi 58 34 92 231 3 17 28 1 1
34 Lakshadweep 2 2 4 0 0 47 0 0 0
35 Pondicherry 63 16 78 4 3 48 1 - 0
All India 24686 160495 185181 97922 61469 124358 13519 751 176
PigsCattle Horses
and
ponies
Buffalos Sheep Goats
Source: Department of Animal Husbandary and dairying
Note: *- Data from 2 districts are yet to be received from State Government.
-' denotes less than 500.
TABLE 3.3.11: LIVESTOCK POPULATION AS PER 2003 CENSUS

8/14/2019 Comp Env 2007 Chp3
http://slidepdf.com/reader/full/comp-env-2007-chp3 50/54
FAUNA
Sl
No.
Year Marine
1 2 3
1 1950-51 5.34
2 1960-61 8.80
3 1970-71 10.86
4 1980-81 15.555 1981-82 14.45
6 1982-83 14.27
7 1983-84 15.19 9.87 25.06
8 1984-85 16.98
9 1985-86 17.16
10 1986-87 17.13
11 1987-88 16.58
12 1988-89 18.17
13 1989-90 22.75
14 1990-91 23.00
15 1991-92 24.47
16 1992-93 25.76
17 1993-94 26.49
18 1994-95 26.92
19 1995-96 27.07
20 1996-97 29.67
21 1997-98 29.50
22 1998-99 26.96
23 1999-00 28.52
24 2000-01 28.11
25 2001-02 28.30
26 2002-03 29.90
27 2003-04 29.41
28 2004-05* 27.79 35.25 63.05
29 2005-06 28.16
Source : Department of Animal Husbandry and Dairying, Ministry of Agriculture
*: Revised
Sl.
No.
Continental
Shelf
(‘000 Sq
Kms.)
Number of
Landing
Centres
Number of
Fishing
Villages
App. Length
of Coast
Line (Kms.)
1 33 508 508 9742 10 88 72 1043 184 286 851 16004 27 29 221 300
5 40 226 222 5906 112 184 395 7207 26 63 329 4808 41 362 446 10769 17 65 652 15810 35 57 45 191211 - 7 31 2712 4 11 10 13213 1 28 45 45
530 1914 3827 8118
Source: Department of Animal Husbandry and Dairying, Ministry of Agriculture
11.60
12.29
13.01
28.76
29.59
38.36
65.72
31.26 59.56
56.75
23.81
49.49
41.57
43.65
46.44
31.52
29.42
36.77
24.4224.44
23.67
28.01
17.89
19.95
20.97 47.89
4 5
17.56
56.56
53.48
53.8824.38
26.02
28.23
52.98
9.40
9.998.87
28.45
22.42
17.10
13.35
14.02
15.36
11.03
TABLE 3.3.12 : FISH PRODUCTION
TABLE 3.3.13 : MARINE FISHERY RESOURCES OF INDIA
6.70
Inland
(Lakh tonne)
Total
7.52
11.602.80
2.18
PondicherryLakshadweep
34.58 63.99
State/Union Territory
Andhra Pradesh
GujaratKarnataka
Goa
37.56
32.10 62.00
TOTAL
KeralaMaharashtraOrissa
Daman & DiuAndaman & Nicobar IslandsWest BengalTamil Nadu
72

8/14/2019 Comp Env 2007 Chp3
http://slidepdf.com/reader/full/comp-env-2007-chp3 51/54
Marine Inland Total Marine Inland Total Marine Inla
1 2 6 7 8 9 10 11 12 1
1 Andhra Pradesh 263930 680710 944640 210733 642321 853054 21884 6
2 Arunachal Pradesh 0 2650 2650 0 2704 2704 0
3 Assam 0 181000 181000 0 186314 186314 0 1
4 Bihar 0 266490 266490 0 267510 267510 0 2
5 Goa 83760 3600 87360 94813 4231 99044 10091
6 Gujarat 609140 45480 654620 584779 50426 635205 66388
7 Haryana 0 39130 39130 0 42050 42050 0
8 Himachal Pradesh 0 6530 6530 0 6901 6901 0
9 Jammu & Kashmir 0 19750 19750 0 19100 19100 0
10 Karnataka 187000 70000 257000 171227 80000 251227 17697 1
11 Kerala 608520 76180 684700 601863 76451 678314 55891
12 Madhya Pradesh 0 50820 50820 0 62060 62060 0
13 Maharashtra 420010 125120 545130 417769 130250 548019 44534 1
14 Manipur 0 17600 17600 0 17800 17800 0
15 Meghalaya 0 5150 5150 0 5638 5638 0
16 Mizoram 0 3380 3380 0 3680 3680 0
17 Nagaland 0 5560 5560 0 4900 4900 0
18 Orissa 116880 190020 306900 121928 193657 315585 12221 2
19 Punjab 0 83650 83650 0 77700 77700 0 20 Rajasthan 0 14300 14300 0 16391 16391 0
21 Sikkim 0 140 140 0 140 140 0
22 Tamil Nadu 373000 101140 474140 307693 151734 459427 30799 1
23 Tripura 0 17980 17980 0 19838 19838 0
24 Uttar Pradesh 0 267000 267000 0 277074 277074 0 2
25 West Bengal 181600 988000 1169600 179500 1035500 1215000 16000 10
26 A & N Islands 31060 90 31150 32600 83 32683 1205
27 Chandigarh 0 80 80 0 84 84 0
28 Dadar & Nagar Haveli 0 50 50 0 48 48 0
29 Daman & Diu 13770 0 13770 12506 0 12506 1772
30 Delhi 2100 2100 0 1410 1410 0
31 Lakshadweep 10030 0 10030 11964 0 11964 1196
32 Pondicherry 42800 5200 48000 31500 5250 36750 1927
33 Chattisgarh 0 111050 111050 0 120072 120072 0 134 Uttranchal 0 2560 2560 0 2566 2566 0
35 Jharkhand 0 75380 75380 0 22000 22000 0
2941500 3457890 6399390 2778875 3525883 6304758 281605 37
Source : Department of Animal Husbandary and Dairying, Ministry of Agriculture
7 3
Sl.
No.States/UT's
2004-2005
Total
2005-2
TABLE 3.3.14 : STATE-WISE FISH PRODUCTIO
2003-2004

8/14/2019 Comp Env 2007 Chp3
http://slidepdf.com/reader/full/comp-env-2007-chp3 52/54
FAUNA
1 2 3 4 5 6 7
1 Andhra Pradesh 11,514 2.34 5.17 - 0.60
2 Arunachal Pradesh 2,000 - 2.76 0.42 -
3 Assam 4,820 0.02 0.23 1.10 -
4 Bihar 3,200 0.60 0.95 0.50 -
5 Chhattisgarh 3,573 0.84 0.63 - 1.47
6 Goa 250 0.03 0.03 - Neg
7 Gujarat 3,865 2.43 0.71 0.12 1.00
8 Haryana 5,000 0.09 0.10 0.10 -
9 Himachal Pradesh 3,000 0.42 0.01 - -10 Jammu & Kashmir 27,781 0.07 0.17 0.06 -
11 Jharkhand 4,200 0.94 0.29 - -
12 Karnataka 9,000 4.40 2.90 - 0.10
13 Kerala 3,092 0.30 0.30 2.43 2.40
14 Madhya Pradesh 17,088 2.27 0.60 - -
15 Maharashtra 16,000 2.79 0.59 - 0.10
16 Manipur 3,360 0.01 0.05 0.04 -
17 Meghalaya 5,600 0.08 0.02 Neg -
18 Mizoram 1,395 - 0.02 - -
19 Nagaland 1,600 0.17 0.50 Neg -
20 Orissa 4,500 2.56 1.14 1.80 4.30
21 Punjab 15,270 Neg 0.07 - -
22 Rajasthan 5,290 1.20 1.80 - -
23 Sikkim 900 - - 0.03 -
24 Tamil Nadu 7,420 5.70 0.56 0.07 0.60
25 Tripura 1,200 0.05 0.13 - -
26 Uttar Pradesh 28,500 1.38 1.61 1.33 -
27 Uttaranchal 2,686 0.20 0.01 0.00 -
28 West Bengal 2,526 0.17 2.76 0.42 2.10
29 Andaman & Nicobar Islands 115 0.01 0.03 - 1.2030 Chandigarh 2 - Neg Neg -
31 Dadra & Nagar Haveli 54 0.05 - - -
32 Daman & Diu 12 - Neg - Neg
33 Delhi 150 0.04 - - -
34 Lakshadweep - - - - -35 Pondicherry 247 - Neg 0.01 Neg
195,210 29.07 24.14 7.98 12.40
Source: Annual Report 2005-06, Department of Animal Husbandry and Dairying, Ministry of Agriculture
Neg - Negligible
Total
TABLE 3.3.15 : INLAND FISHERY WATER RESOURCES OF INDIA
Sl.
No.
State/UTs Rivers &
Canals
(Kms.)
Reservoirs
(Lakh Ha)
Tanks &
Ponds
(Lakh Ha)
Floodplain
Lakes &
Derelict
Water (Lakh Ha)
Brackish
Water
(Lakh Ha)
74

8/14/2019 Comp Env 2007 Chp3
http://slidepdf.com/reader/full/comp-env-2007-chp3 53/54
Outbreak Attack Death
1 Foot and mouth diseas Bovine 1623 49469 280
Buffalo 5 10244 59
Ovine/Caprin 15 5345 88
Swine 3 15 1Total 1646 65073 428
2 Hamorrhagic septicaemia Bovine 405 2633 1056
Ovine/Caprin 52 1069 161
Buffalo 313 1441 766
Total 770 5143 19833 Black quarter Bovine 527 2204 1029
Ovine/Caprin 3 8 4
Buffalo 4 49 29
Total 534 2261 10624 Anthrax Bovine 43 202 146
Ovine/Caprin 70 408 301
Buffalo 0 6 6
Total 113 616 4535 Fascioliasis Bovine 65 527559 11
Ovine/Caprin 1 50 11
Buffalo 0 49 0
Swine 0 10 0
Total 66 527668 226 Enterotoxaemia Ovine/Caprin 461 3974 19327 Sheep pox and goat po Ovine/Caprin 1389 19935 53578 Cow Pox Bovine 1 10 09 Buffalo Pox Buffalo 17 181 0
10 Blue Tongu Ovi/Cap 154 4951 65111 CCPP Ovi/Cap 1 45 1912 Ampjostp,oasos Bovine 7 35 19
Caprine 5 340 35Total 12 375 54
13 Swine Fever Swine 40 4519 232714 Coccidiosis Bovine 7 137 0
Avian 327 23564 11763
Swine 1 62 0
Total 335 23763 1176315 Ranikhet (New Castle) Diseas Avian 391 36416 1012016 Fowl Pox Avian 44 1566 38817 Fowl choler Avian 4 284 152
18 Marks Disease Avian 6 925 92519 I.B.D. Avian 260 20198 1211720 Duck Plagu Avian 34 1177 546
21 Salmonellosis Avian 7 599 18022 Chronic Respiratory Diseas Avian 122 21778 2036923 Canine Disetmpe Canine 34 825 2924 Rabies Bovine 16 42 42
Canine 1 1 1
Total 17 43 4375
TABLE 3.3.16: INCIDENCE OF LIVESTOCK AND POULTRY DISEASES IN INDIA - 2006
Sl.
No.
Disease Name SpeciesNumber of

8/14/2019 Comp Env 2007 Chp3
http://slidepdf.com/reader/full/comp-env-2007-chp3 54/54
Outbreak Attack Death
25 Babesiosis Bovine 26 1233 626 Mastitis Bovine 34 11889 0
Caprine 1 18 0
Total 35 11907 027 Trypanismiasis Bovine 19 255 2
Buffalo 5 61 7
Camel 2 5 0
Total 26 321 928 Mange Swine 292 4766 0
Canine 244 2647 0
Total 536 7413 029 Peste Des Petits Ruminants(PPR Ovine/Caprin 577 28075 7059
30 Anaplasmosis Bovine 14 73 131 Brucellosis Ovine/Caprine 6 551 632 Coryza Avian 2 500 1333 Highly Pathogenic Avian Influenz
(HPAI) Avian2 - 1043834*
34 Glander Disease Equine 2 23# 23+GRAND TOTAL 7684 792398 $ 78014**
*# 1702 samples tested out of which 23 found postive and destroyed+ Figure pertains to number of animals destroyed$ Total does not include animals attacked by Glander disease
**
76
SpeciesNumber of
Source: Department of Animal Husbandry and Dairying, Ministry of Agriculture
Figure pertains to number of poulty destroyed.
The total does not include poultry destroyed due to HPAI and equine destroyed due to Glander disease.
Sl.
No.
Disease Name