Comox Valley Professional Development Day
55
Comox Valley Professional Development Day February 8, 2010 Richard V. DeMerchant
Transcript of Comox Valley Professional Development Day

Comox Valley Professional Development Day
February 8, 2010
Richard V. DeMerchant

Agenda
• Background
• Examine the Mathematical Processes
• Questions
www.wncp.ca

Key Terms
WNCP – Western and Northern Canadian Protocol
CCF – Common Curriculum Framework: basis for K-12 mathematics in BC, YT, AB, NT, SK, NU, MB, NB, PEI, NF
Pathways – series of courses students take in high school
PLO – Prescribed Learning Outcomes: specific knowledge, skills and understandings that students are required to attain by the end of a given course
AIs – Achievement Indicators: how students may demonstrate their achievement of the goals of a specific outcome
Mathematical Processes – critical aspects of learning, doing and understanding mathematics

Demographics
7.1% 7.5% 8.2% 8.5%16.0% 17.2% 18.6% 18.1%
76.9% 75.2% 73.3% 73.4%
0.0%
10.0%
20.0%
30.0%
40.0%
50.0%
60.0%
70.0%
80.0%
90.0%
100.0%
2004/2005 2005/2006 2006/2007 2007/2008
Scho
ol Y
ear
Percentage of Students
Grade 10 Student Percentages
AM 10
EM 10
PM 10

Demographics
6.6% 8.7% 9.5% 9.9% 9.9% 11.0% 10.7%8.9%
24.0% 23.5% 23.2% 21.6% 21.5% 23.4%
84.5%
67.3% 67.0% 66.9% 68.5% 67.4% 66.0%
0.0%
10.0%
20.0%
30.0%
40.0%
50.0%
60.0%
70.0%
80.0%
90.0%
100.0%
2001/2002 2002/2003 2003/2004 2004/2005 2005/2006 2006/2007 2007/2008
Perc
ent
School Year
Grade 11 Student Percentage
AM 11EM 11

Demographics
3.2% 4.2% 4.6% 5.3% 5.4% 6.0%0.3% 1.0% 0.8% 0.7% 0.7% 0.7%
96.5% 94.8% 94.6% 93.9% 93.9% 93.3%
0.0%
10.0%
20.0%
30.0%
40.0%
50.0%
60.0%
70.0%
80.0%
90.0%
100.0%
2002/2003 2003/2004 2004/2005 2005/2006 2006/2007 2007/2008
Perc
ent
of S
tude
nts
School Year
Grade 12 Student Percentages
AM 12EM 12

Current Situation
Teachers
Too much content for the instructional time
Want to provide a deeper understanding of mathematics
Students are in the “wrong” pathway
Post Secondary
Students are not prepared well enough
Need a better understanding of “the basics”
Parents
Students are struggling
Do not want to “close doors”

Overview of Pathways
K to 9
Foundations of Mathematics
Pre-calculusApprenticeship and Workplace
Mathematics
GRADE 10
GRADE 11
GRADE 12
Foundations of Mathematics
Foundations of Mathematics and Pre-calculus
Apprenticeship and Workplace
Mathematics
Pre-calculusApprenticeship and Workplace
Mathematics
Majority of Trades and Workforce
Programs not requiring
theoretical calculus
Programs requiring
theoretical calculus
Intended for study in

Some Factors to Consider

Post-Secondary AdmissionsUBC Case Study
Math 1XX* No Math** Grand TotalCampus ProgVancouver BA (Arts) 688 1365 2053
BASC (Applied science/engineering) 731 8 739BCOM (Commerce) 510 37 547BDSC (Dental Hygene) 20 20BHK (Human Kinetics) 33 76 109BMUS (Music) 1 39 40BMW (Midwifery) 1 1BSAB (Bachelor of Applied Biology) 6 1 7BSAG (Agroecology) 12 5 17BSC (Science) 1560 77 1637BSCN (Nursing) 29 13 42BSCW (Wood products, Forestry) 14 14BSF (Forestry) 22 4 26BSFN (Food, Nutrition and Health) 162 18 180BSFS (Forest Sciences) 16 3 19Unclassified 3 3
Vancouver Total 3784 1670 5454Grand Total 3784 1670 5454* Students taking first year math at UBC (2009 Direct Entry)** Student did not take a first year math at UBC (including IB, AP, BC Calc 12)

Post-Secondary Admissions:UBC Case Study
UBC Student Population (2003-2006)
Total BC Grade 12 Students 170,000
UBC Entrants 10,303
PM 11 Entrants 991
Percent of UBC Entrants with PM 11 only 9.62%
Percent of Total BC Grade 12 Student Population 0.58%
Grade 12 Math (PM 12, IB, AP, BC Calculus 12) 9,312
Percent of UBC Entrants with Grade 12 Math 91.38%
Percent of Total BC Grade 12 Student Population 5.48%
Note: Only Arts, Dental Hygiene, Human Kinetics, Midwifery, and Music do not require PM 12 for admission

Post-Secondary Admissions
• UBC – Foundations of Mathematics 12 or Pre-calculus 11 for general admission (i.e. Arts, Dental Hygiene, Human Kinetics, Midwifery, and Music) all other programs will require additional mathematics courses
• Decisions from other post-secondary institutions pending
• Information will be posted on www.educationplanner.cawhen available

Overview of 10-12 Courses –The Blankets

Mathematical Processes –The Threads
Com
munication
Reasoning
Technology
Visualization

Mathematical Processes – Why?
“... three issues that make all the difference, according to our advisors, first year instructors, and the research I have seen:
•study skills ...•conceptual level ... •processes ...
- Walter Whitley - Chair Curriculum Committee for Mathematics for Education Program

Mathematics Processes – Why?
There is an underlying feeling among college/university instructors that overall the secondary mathematics curriculum, in the main, contains the content and topics with which a mathematics/ statistics student would need familiarity in order to succeed in most post-secondary environments. However, the success rates, especially in Calculus, are evidence that to judge student preparedness solely on the curricular content of a prerequisite course is unwise. In a full analysis of the reasons for student success, other influences and other mathematical proficiencies must be considered.http://bccupms.ca/document/Mathematics%20Proficiencies%20Project.pdf

Mathematics Processes – Why?
Calculus Statistics Elementary Education WNCP
Thinking Skills Thinking Skills Thinking Skills Reasoning / ME
Solving Word Problems Solving Word Problems Problem Solving / Technology
Multi-step Problems Problem Solving / Connections
Modeling Modeling Visualization/Connections
Integration of Topics Integration of Topics Integration of Topics Connections
Abstracting/Generalising
Connections / Technology
Symbolism Symbolism Symbolism Connections
Language Skills Communication
Positive AttitudeToward Math
Positive AttitudeToward Math
Affective Domain
How do the proficiencies align?

Rush Hour / Traffic Jam
Why is this important??
Can you see a solution?How would you solve

Rush Hour / Traffic Jam

Rush Hour / Traffic Jam

Rush Hour / Traffic Jam

Mathematics Processes -Communication
Frayer Model
With a partner pick one term and complete:
Equation, Expression, Polynomial, Linear, Inscribed Angles, Scale Diagram

Mathematics Processes -Communication
Frayer Model
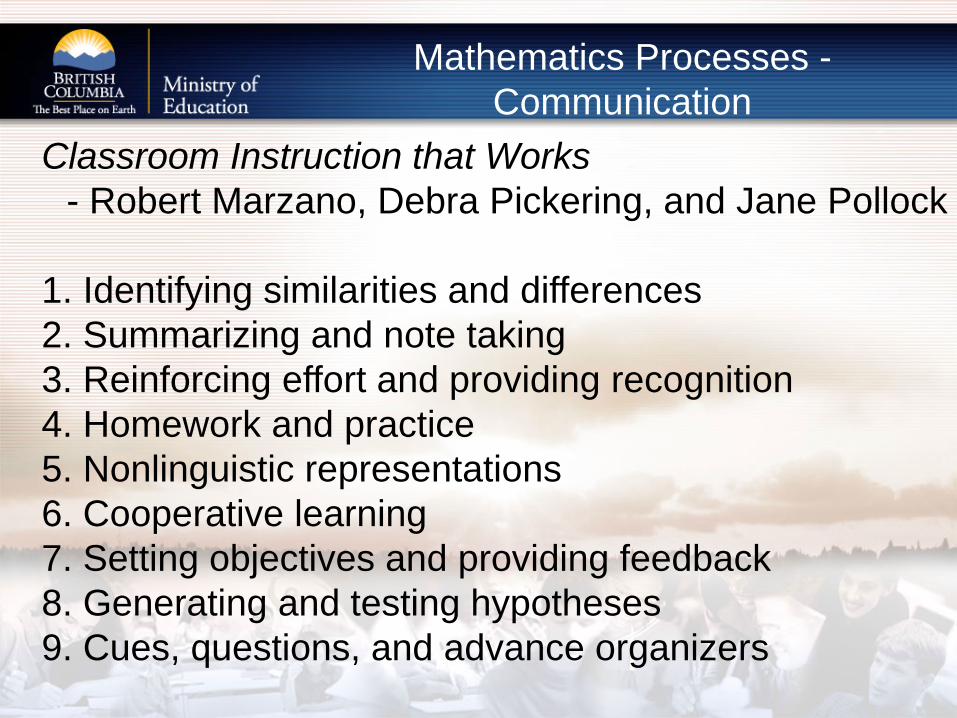
Mathematics Processes -Communication
Classroom Instruction that Works- Robert Marzano, Debra Pickering, and Jane Pollock
1. Identifying similarities and differences2. Summarizing and note taking3. Reinforcing effort and providing recognition4. Homework and practice5. Nonlinguistic representations6. Cooperative learning7. Setting objectives and providing feedback8. Generating and testing hypotheses9. Cues, questions, and advance organizers
Mathematics Processes –Connections
“Wherever possible, meaningful contexts should be used in examples, problems and projects.”
CCF (pg. 17)

Mathematics Processes –Connections
Course Organizer PLOGrade 9 Transformations • Demonstrate an understanding of line and rotation
symmetry
AWM 10 Geometry • Model and draw 3-D objects and their views.• Draw and describe exploded views, component parts and scale diagrams of simple 3-D objects.
FOM 11 Statistics • Demonstrate an understanding of normal distribution, including: standard deviation, z-scores.
PCM 11 Relations and Functions
• Analyze arithmetic sequences and series to solve problems.• Analyze geometric sequences and series to solve problems.

Mathematics Processes –Connections
Course PLO summary
Grade 9 • line and rotation symmetry
AWM 10 • 3-D objects and their views,exploded views, component parts and scale diagrams
• Flat pack furniture
FM 11 • normal distribution, including: standard deviation, z-scores.
• Galton Box• Mr Tubbs
PM 11 • arithmetic and geometric sequences and series
• Spreadsheets to compare data models such as • Simple vs. Compound Interest

Mathematics Processes –Mental Mathematics and Estimation
“ Mental mathematics is a combination of cognitive strategies that enhance flexible thinking and number sense. It involves using strategies to perform mental calculations ....
WNCP (pg. 8)

Mathematics Processes –Mental Mathematics and Estimation
Estimation is used for determining approximate values or quantities, usually by referring to benchmarks or referents, or for determining the reasonableness of calculated values. Estimation is also used to make mathematical judgements and to develop useful, efficient strategies for dealing with situations in daily life. When estimating, students need to learn which strategy to use and how to use it.”
WNCP (pg. 8)

Mathematics Processes –Estimation and Mental Mathematics
Benchmark - A benchmark is something (for example a number) that serves as a reference to which something else (another number) may be compared. The most common use for benchmarks is in estimation. Benchmarks tend to not be personal.
e.g. 0, 0.5, ½, ¾, 1, 100%, 50%

Mathematics Processes –Estimation and Mental Mathematics
Referent – A known quantity used to estimate or compare. Referents tend to be personal.
e.g. Metre and inch, litre and gallon

Mathematics Processes –Estimation and Mental Mathematics
Pre-calculus 11

Mathematics Processes –Estimation and Mental Mathematics
Apprenticeship and Workplace 10

Mathematics Processes –Problem Solving
“A problem can be defined as any task or activity for which the students have not memorized a method or rule, nor is there an assumption by the students that there is only one correct way to solve the problem”
Hiebert et al. 1997

Mathematics Processes –Problem Solving
A problem for learning mathematics also has these features:• The problem must begin where the students
are.• The problematic or engaging aspect of the
problem must be due to the mathematics that the students are to learn.
• The problem must require justifications and explanations for answers and methods.
Van de Walle 2006

Mathematics Processes –Problem Solving
In order to be successful, students must develop, and teachers model, the following characteristics:
• interest in finding solutions to problems
• confidence to try various strategies
• willingness to take risks
• ability to accept frustration when not knowing
• understanding the difference between
• not knowing the answer and not having found it yet
(Burns 2000)

Mathematics Processes –Problem Solving
A final word on problem solving ...
• both groups [calculus and statistics] stress the importance of problem solving abilities, particularly in the context of word problems. (BCCUPMS)
• Multi-step problems involve two or more stages to arrive at a solution. They are not necessarily word problems. (BCCUPMS)

Mathematics Processes –Reasoning
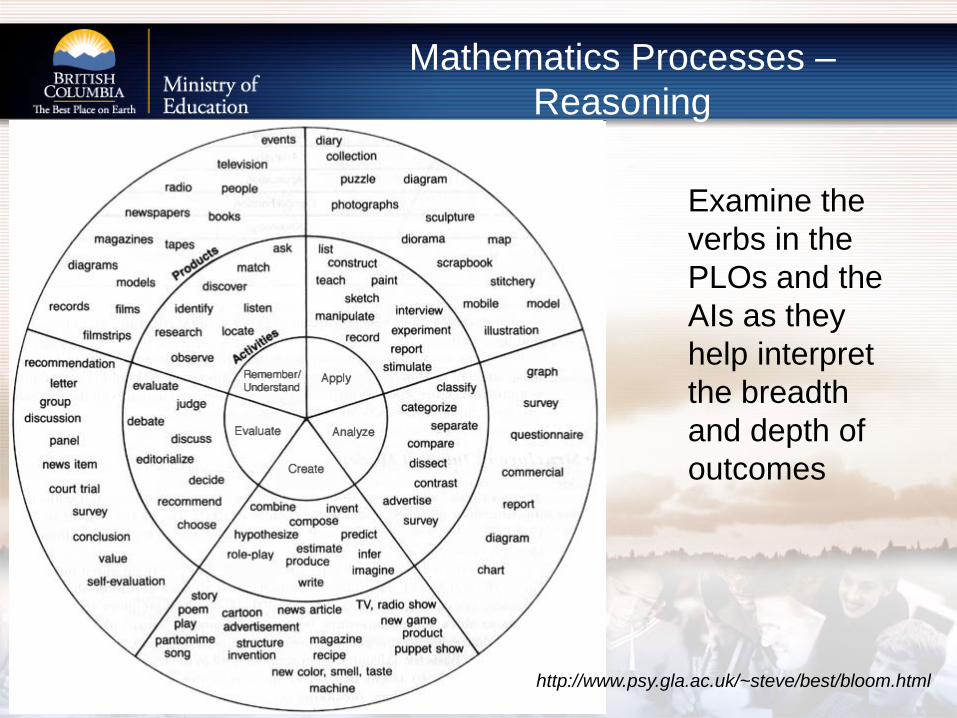
Mathematics Processes –Reasoning
Examine the verbs in the PLOs and the AIs as they help interpret the breadth and depth of outcomes
http://www.psy.gla.ac.uk/~steve/best/bloom.html

Mathematics Processes –Reasoning
Grade 9

Mathematics Processes –Reasoning
Foundations of Mathematics 11

Mathematics Processes –Technology
The use of [ T ] in the PLOs does not include routine calculation.
Calculators and computers can be used to:
• explore and demonstrate mathematical relationships and patterns
• organize and display data
• generate and test inductive conjectures
• extrapolate and interpolate
• assist with calculation procedures as part of solving problems
• increase the focus on conceptual understanding by decreasing the time spent on repetitive procedures
• reinforce the learning of basic facts
• develop personal procedures for mathematical operations
• model situations
• develop number and spatial sense. (pg. 9)

Mathematics Processes –Technology
Grade 8

Mathematics Processes –Technology
Foundations 11
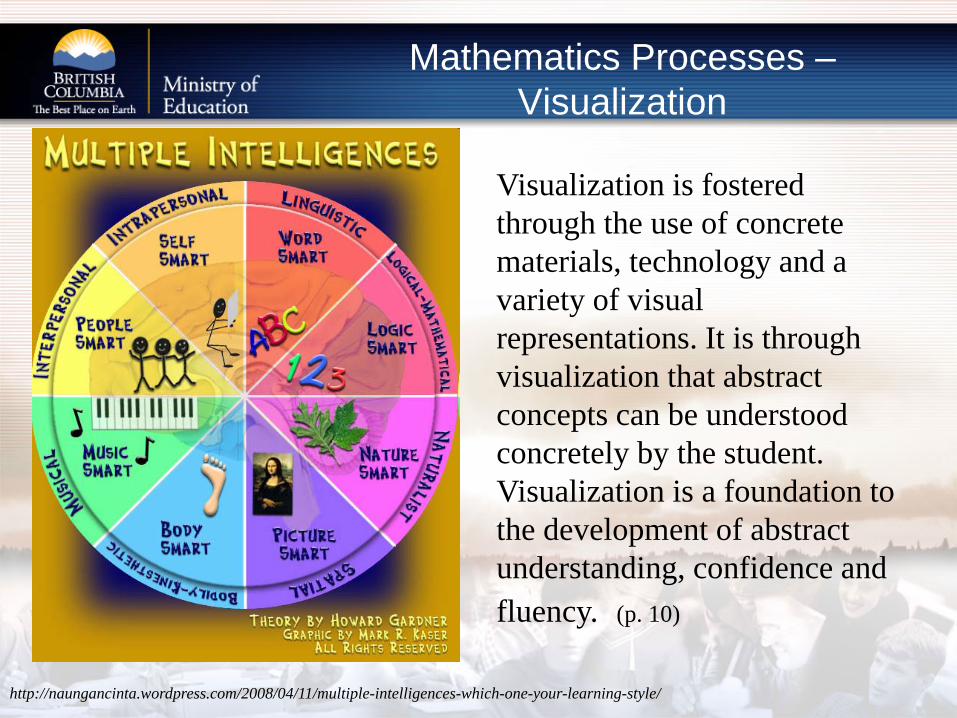
Mathematics Processes –Visualization
http://naungancinta.wordpress.com/2008/04/11/multiple-intelligences-which-one-your-learning-style/
Visualization is fostered through the use of concrete materials, technology and a variety of visual representations. It is through visualization that abstract concepts can be understood concretely by the student. Visualization is a foundation to the development of abstract understanding, confidence and fluency. (p. 10)

Mathematics Processes –Visualization
Apprenticeship and Workplace 11

Mathematics Processes –Visualization
Foundations of Mathematics 12

Visualization Canadian VS US National Debt
Canada United States
$100 $100
Images from istockphoto.com and pagetutor.com

Visualization Canadian VS US National Debt
Canada United States
$10 0001/2” thick
$10 000½” thick

Visualization Canadian VS US National Debt
Canada United States
$1 000 000 $1 000 000
Visualization Canadian VS US National Debt
Canada United States
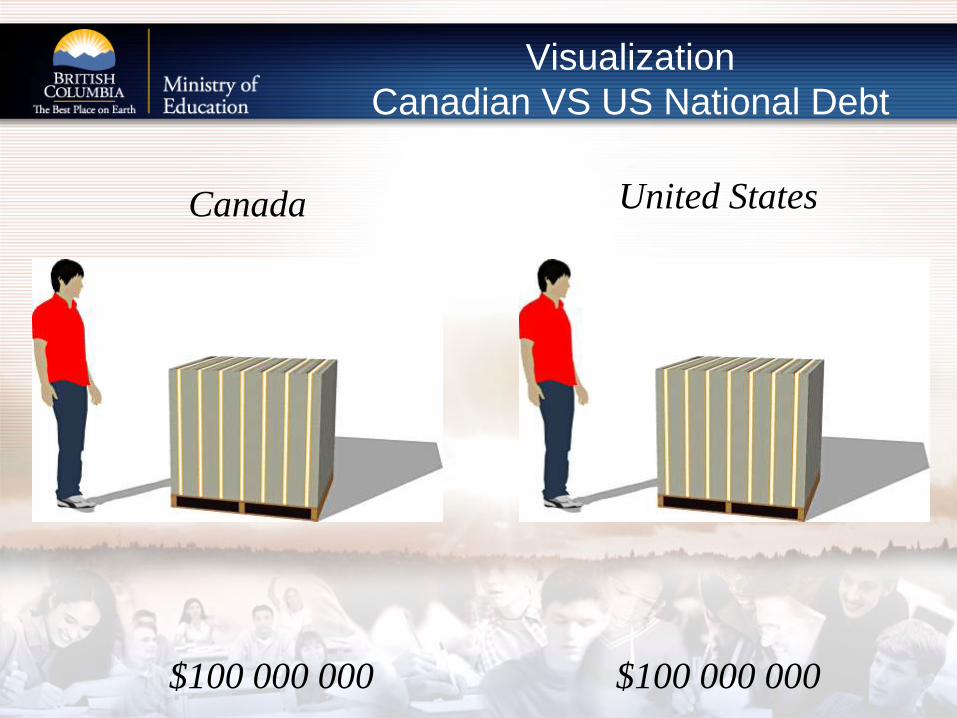
$100 000 000 $100 000 000

Visualization Canadian VS US National Debt
Canada United States
$1 000 000 000 $1 000 000 000

Visualization Canadian VS US National Debt
Canada United States
Total $600 000 000 000March 2009
$1 000 000 000Not there yet

Visualization Canadian VS US National Debt
Canada United States
Total $600 000 000 000March 2009
$10 000 000 000 000March 2009

Questions
Contact Information:
Richard V. DeMerchantCoordinatorEducation Standards UnitBritish Columbia Ministry of EducationEmail: [email protected]: (250) 387-3907
Please include your phone number and email.