UnbenaIncreasing Carpooling in Vermont: Opportunities and Obstaclesnnt
Upload
dorothy-thompsonCategory
view
229download
1
Commuting Connections: Carpooling and Cyberspace

Presented at the Association for Commuter Transportation TDM Summit, Halifax, October 21, 2008
by:Catherine HabelProgram Coordinator, Smart CommuteMetrolinx
Co-authors:Kalina SoltysMaster’s CandidateUniversity of Toronto at Mississauga
Ron BuliungProfessor, Department of GeographyUniversity of Toronto at Mississauga
Outline1. Background 2. Research Partnership3. Research Objectives4. Literature Review5. Methodology6. Findings 7. Conclusions

Background – Smart Commute

Background – Carpool Zone Online ridematching service Administered and paid for by Metrolinx Open and free of charge to the public Promoted by ten TMAs at GTHA employers


Research Partnership University of Toronto at Mississauga (UTM)
Department of Geography Since 2006 with Smart Commute Association, Smart
Commute Mississauga and Peel Region 2008 data-sharing agreement between Metrolinx & UTM Centre for excellence – commuting research in Canada

Research Partnership (cont.) Resources
in-kind time Assistant Professor, UTM
– Directing research– Coordinating funding proposals
Undergraduate/graduate student, UTM Program Coordinator, Smart Commute
– Conducting CPZ satisfaction survey– Compiling database– Reviewing draft reports
Data extraction capabilities, Pathway Intelligence

Research Partnership (cont.) Benefits:
Building capacity for TDM Practical application for student research In-depth analysis of data set New knowledge of carpool behaviour Canadian example Policy direction Smart Commute profiled during Geography Week Guest lecture at UTM

Research Objectives1. Model determinants in forming a successful
carpool2. Explore gender differences in carpooling
attitudes and behaviours3. Evaluate the performance of Carpool Zone and
provide recommendations for the refinement and extension of the program
4. Inform Smart Commute policies and programming

Research Objectives (cont.)
How do socio-demographic, economic, attitudinal, and spatial factors influence carpool formation and use?
How can we leverage the power and flexibility of other systems (e.g., Internet) to do a better job in the task of moving people?

Literature Review Existing thoughts about differences in levels of
mobility and commuting patterns Literature on gender and travel behaviour Literature on the use of ICT to improve urban
mobility

Methodology – Survey Yearly survey a component of SC monitoring and
evaluation framework, fall 2007 Individualized link e-mailed to all registered users Incentive provided – draw for iPod Touch Reminder (319 additional responses) Responses associated with profile information Excel database extracted, identifiers removed,
data provided to UTM Follow up questions and clarifications

Methodology – Questionnaire 22 questions, multiple choice or one answer Reasons for interest in carpooling Usage level (carpooling, waiting for better matches, etc.) Ratings of Carpool Zone features and services Ease of use and extent of feature usage Communication between users Follow up (testimonials and further input) Recommendation Open comment field

Methodology – Profile Information Home postal code Gender Age Household car ownership Commute mode Length of trip (time) Language Community characteristic urban/suburban and
median income by FSA (inferred)

Methodology – UTM Modelling Exploratory/descriptive analysis of motivations,
current commuting behaviour, and performance.
Logistic regression analysis of the likelihood of successfully forming and using a Carpool Zone- enabled carpool.

Methodology – Challenges Researchers would have preferred more
demographic information e.g.: Education level, individual and household income,
occupation SC does not ask these questions for privacy reasons
Destination information Weren’t able to provide this with the first data set,
however, trip information has since been extracted and provided to UTM – findings should be available by the end of this year

Findings – Descriptive Analysis 1,425 respondents (25% response rate) 89% of respondents are satisfied with the
service overall Of those who formed carpools through the
system, 84% were satisfied with the quality of the carpools.
87% of respondents would definitely or likely recommend Carpool Zone to their friends and colleagues.

41%
43%
16%
Male
Female
NA
Gender Distribution of Survey Respondents
Findings – Descriptive Analysis

0
2
4
6
8
10
12
14
16
18
20
under 20 20-24 25-29 30-34 35-39 40-44 45-49 50-54 55-59 60-64 65-69 70-74 75-79
age category
% r
esp
on
den
ts
Age Distribution of Survey Respondents
Findings – Descriptive Analysis

Overall Satisfaction with Carpool Zone
Res
po
nse
POOR
NOT VERY GOOD
SATISFACTORY
VERY GOOD
EXCELLENT
MALE (n=486) FEMALE (n=505)
U = 122,657.00, p > 0.10
Findings – Descriptive Analysis

Motivations for CarpoolingR
esp
on
se
DON’T DRIVE
CAR UNAVAILABLE
SAVE MONEY
ENVIRONMENT
HOV USE
OTHER
MALE (n=495) FEMALE (n=532)
x2 = 22.316, p < 0.001
Findings – Descriptive Analysis
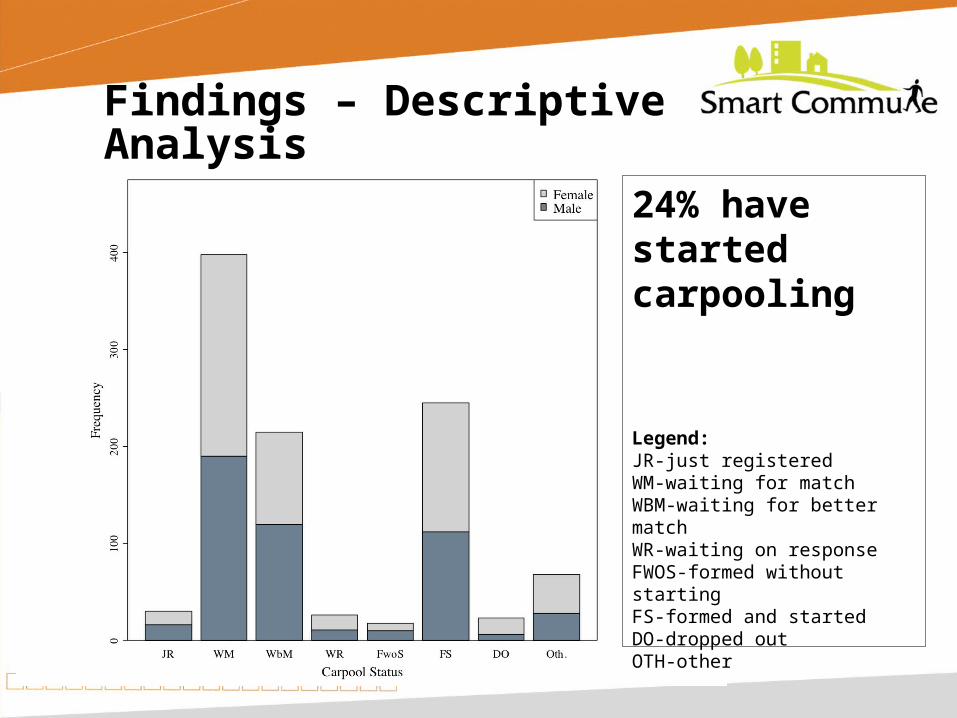
24% have started carpooling
Legend:JR-just registeredWM-waiting for matchWBM-waiting for better matchWR-waiting on responseFWOS-formed without startingFS-formed and startedDO-dropped outOTH-other
Findings – Descriptive Analysis

Current Commute MethodR
esp
on
se
PUBLIC TRANSIT
DRIVE ALONE
GET DROPPED OFF
DRIVE A CARPOOL
PASSENGER IN A CARPOOL
BICYCLEWALK
OTHER
MALE (n=535) FEMALE (n=557)
x2 = 39.243, p < 0.001
Findings – Descriptive Analysis


Findings – Predictive Model Regression analysis - independent variables:
1.Demographics2.Spatial3.Motivations4.Current commute mode

Findings – Demographic More females (13%) in carpools than males (11%) Gender has greatest explanatory effect:
female respondents are 1.3 times more likely to be carpooling
Age and inferred median income insignificant Demographic information “parsimonious”, further
research required

Findings – Spatial Matching potential close to home (significant within 1 km
buffer zone) Addition of one match within 1 km of residence
increases the odds of forming a carpool by 4-21% Increase of matches within broader market (> 3 km)
doesn’t appear to increase rate of carpooling Distance from carpool lot, urban v. suburban and place
of residence don’t appear to be significant More research being conducted to include trip-end
variables into analysis

Findings – Motivations Environment and cost had similar effects but
weren’t considered significant Desire to use an HOV lane was the only
significant motivational factor that explained carpool formation and use associated with saving time almost two times more likely to form a carpool than
concern for the environment

Findings – Current Commute Mode Transit commuters 40% less likely to form a
carpool than SOV commuters Passengers 1.8 times more likely to form a
carpool than SOV commuters Insufficient evidence with respect to active
commuters

Conclusions Utility in considering residential-based
marketing Urban density (home) = more carpools Accessibility to potential matches near the
home is associated with carpool formation Potentially important role of HOV lanes (even
more than carpool lots)

Conclusions (cont.) Making connections…:
with academic institutions and researchers keen to contribute knowledge to our field
with the next generation of TDM practitioners by looking at the Canadian context between the various factors that influence commuter
behaviour