COMMUTER RAIL SYSTEM RIDERSHIP TRENDS - … · Table 2 (pg. 12) presents reported rail line...
25
COMMUTER RAIL SYSTEM RIDERSHIP TRENDS June 2016 Prepared by the Division of Strategic Capital Planning August 2016
Transcript of COMMUTER RAIL SYSTEM RIDERSHIP TRENDS - … · Table 2 (pg. 12) presents reported rail line...
COMMUTER RAIL SYSTEM
RIDERSHIP TRENDS
June 2016
Prepared by the Division of Strategic Capital Planning
August 2016
COMMUTER RAIL SYSTEM RIDERSHIP TRENDS June 2016
I. OVERVIEW
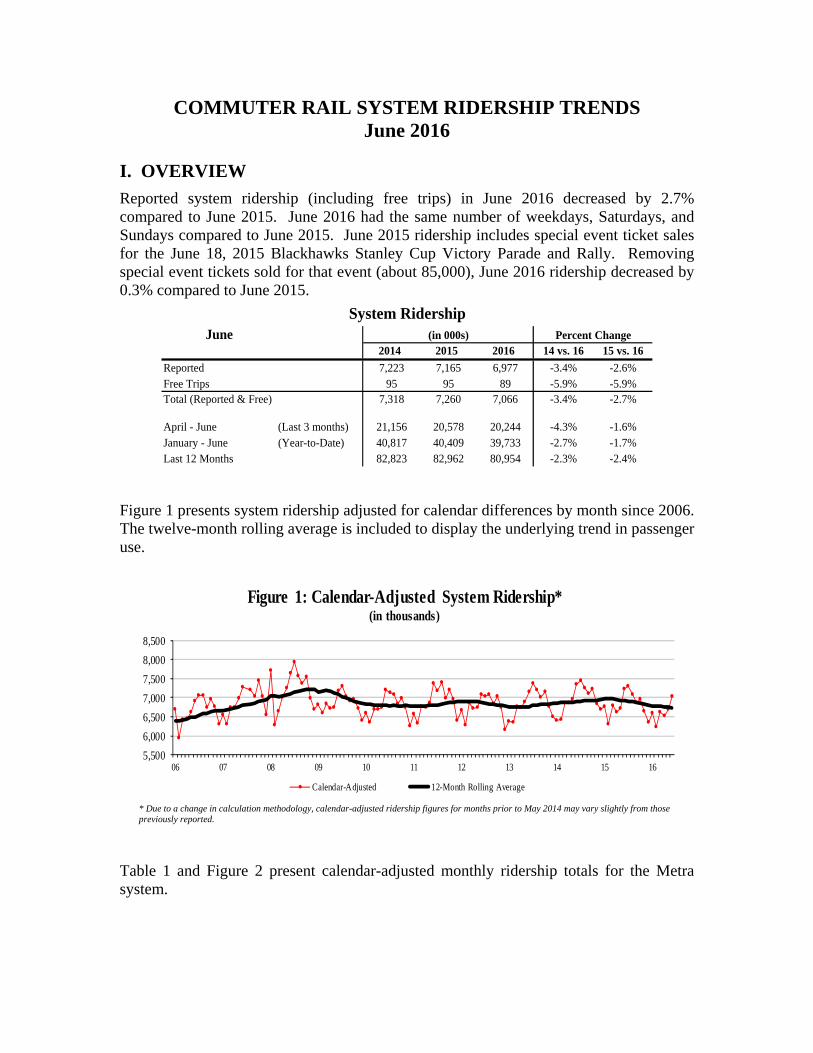
Reported system ridership (including free trips) in June 2016 decreased by 2.7% compared to June 2015. June 2016 had the same number of weekdays, Saturdays, and Sundays compared to June 2015. June 2015 ridership includes special event ticket sales for the June 18, 2015 Blackhawks Stanley Cup Victory Parade and Rally. Removing special event tickets sold for that event (about 85,000), June 2016 ridership decreased by 0.3% compared to June 2015.
System RidershipJune (in 000s) Percent Change
2014 2015 2016 14 vs. 16 15 vs. 16
Reported 7,223 7,165 6,977 -3.4% -2.6%Free Trips 95 95 89 -5.9% -5.9%Total (Reported & Free) 7,318 7,260 7,066 -3.4% -2.7%
April - June (Last 3 months) 21,156 20,578 20,244 -4.3% -1.6%January - June (Year-to-Date) 40,817 40,409 39,733 -2.7% -1.7%Last 12 Months 82,823 82,962 80,954 -2.3% -2.4%
Figure 1 presents system ridership adjusted for calendar differences by month since 2006. The twelve-month rolling average is included to display the underlying trend in passenger use.
5,500
6,000
6,500
7,000
7,500
8,000
8,500
06 07 08 09 10 11 12 13 14 15 16
Figure 1: Calendar-Adjusted System Ridership*(in thousands)
Calendar-Adjusted 12-Month Rolling Average
* Due to a change in calculation methodology, calendar-adjusted ridership figures for months prior to May 2014 may vary slightly from those previously reported.
Table 1 and Figure 2 present calendar-adjusted monthly ridership totals for the Metra system.
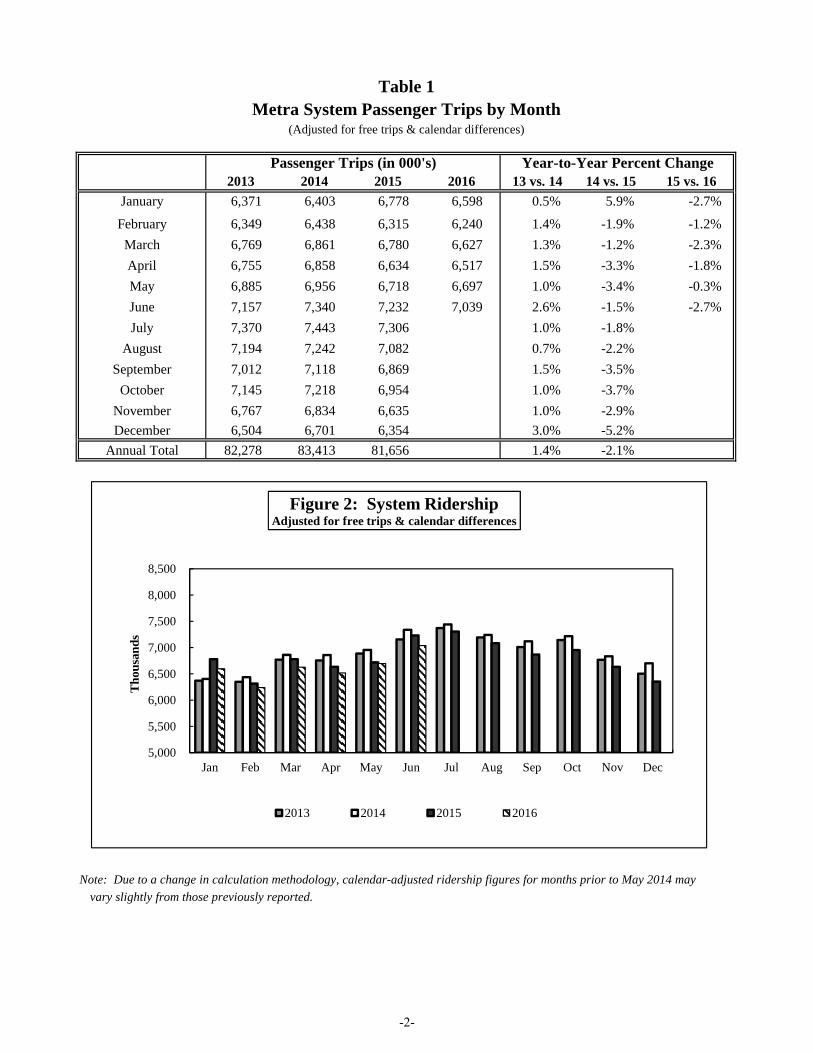
Passenger Trips (in 000's) Year-to-Year Percent Change2013 2014 2015 2016 13 vs. 14 14 vs. 15 15 vs. 16
January 6,371 6,403 6,778 6,598 0.5% 5.9% -2.7%
February 6,349 6,438 6,315 6,240 1.4% -1.9% -1.2%
March 6,769 6,861 6,780 6,627 1.3% -1.2% -2.3%
April 6,755 6,858 6,634 6,517 1.5% -3.3% -1.8%
May 6,885 6,956 6,718 6,697 1.0% -3.4% -0.3%
June 7,157 7,340 7,232 7,039 2.6% -1.5% -2.7%
July 7,370 7,443 7,306 0 1.0% -1.8%
August 7,194 7,242 7,082 0 0.7% -2.2%
September 7,012 7,118 6,869 0 1.5% -3.5%
October 7,145 7,218 6,954 0 1.0% -3.7%
November 6,767 6,834 6,635 0 1.0% -2.9%
December 6,504 6,701 6,354 0 3.0% -5.2%
Annual Total 82,278 83,413 81,656 0 1.4% -2.1%
Note: Due to a change in calculation methodology, calendar-adjusted ridership figures for months prior to May 2014 may
vary slightly from those previously reported.
Table 1Metra System Passenger Trips by Month
(Adjusted for free trips & calendar differences)
5,000
5,500
6,000
6,500
7,000
7,500
8,000
8,500
Jan Feb Mar Apr May Jun Jul Aug Sep Oct Nov Dec
Tho
usan
ds
Figure 2: System Ridership Adjusted for free trips & calendar differences
2013 2014 2015 2016
-2-
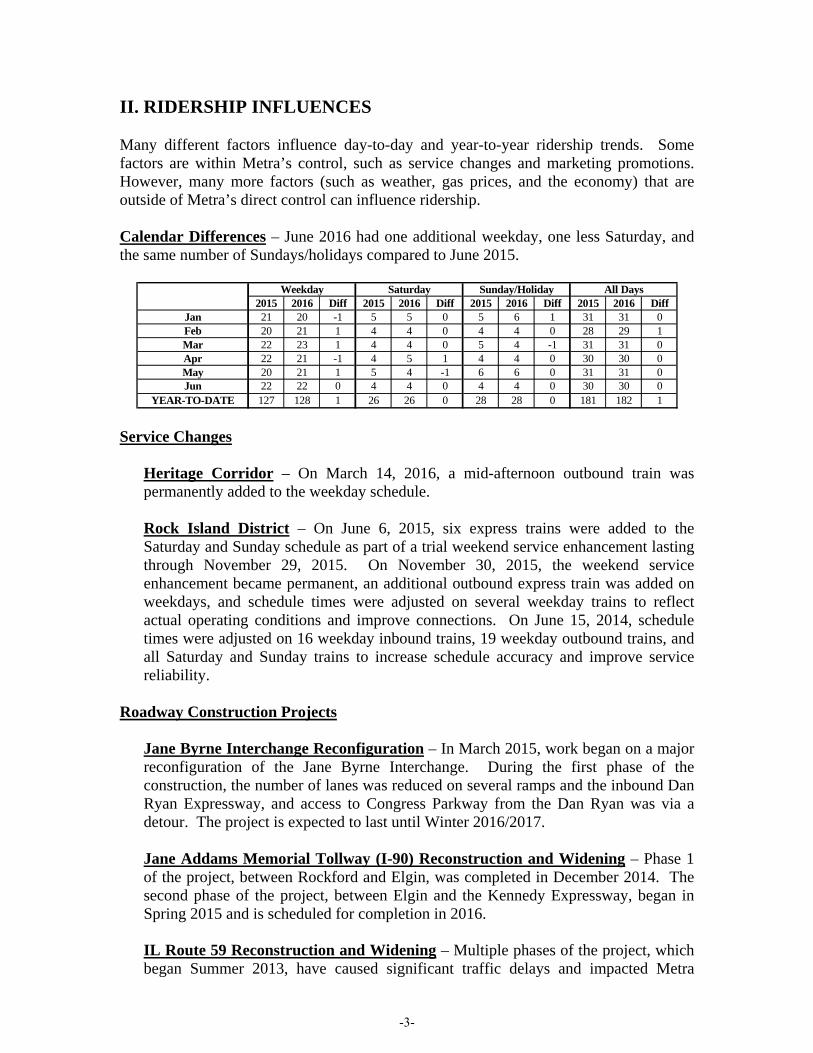
II. RIDERSHIP INFLUENCES Many different factors influence day-to-day and year-to-year ridership trends. Some factors are within Metra’s control, such as service changes and marketing promotions. However, many more factors (such as weather, gas prices, and the economy) that are outside of Metra’s direct control can influence ridership. Calendar Differences – June 2016 had one additional weekday, one less Saturday, and the same number of Sundays/holidays compared to June 2015.
Weekday Saturday Sunday/Holiday All Days2015 2016 Diff 2015 2016 Diff 2015 2016 Diff 2015 2016 Diff
Jan 21 20 -1 5 5 0 5 6 1 31 31 0Feb 20 21 1 4 4 0 4 4 0 28 29 1Mar 22 23 1 4 4 0 5 4 -1 31 31 0Apr 22 21 -1 4 5 1 4 4 0 30 30 0May 20 21 1 5 4 -1 6 6 0 31 31 0Jun 22 22 0 4 4 0 4 4 0 30 30 0
YEAR-TO-DATE 127 128 1 26 26 0 28 28 0 181 182 1 Service Changes
Heritage Corridor – On March 14, 2016, a mid-afternoon outbound train was permanently added to the weekday schedule. Rock Island District – On June 6, 2015, six express trains were added to the Saturday and Sunday schedule as part of a trial weekend service enhancement lasting through November 29, 2015. On November 30, 2015, the weekend service enhancement became permanent, an additional outbound express train was added on weekdays, and schedule times were adjusted on several weekday trains to reflect actual operating conditions and improve connections. On June 15, 2014, schedule times were adjusted on 16 weekday inbound trains, 19 weekday outbound trains, and all Saturday and Sunday trains to increase schedule accuracy and improve service reliability.
Roadway Construction Projects
Jane Byrne Interchange Reconfiguration – In March 2015, work began on a major reconfiguration of the Jane Byrne Interchange. During the first phase of the construction, the number of lanes was reduced on several ramps and the inbound Dan Ryan Expressway, and access to Congress Parkway from the Dan Ryan was via a detour. The project is expected to last until Winter 2016/2017. Jane Addams Memorial Tollway (I-90) Reconstruction and Widening – Phase 1 of the project, between Rockford and Elgin, was completed in December 2014. The second phase of the project, between Elgin and the Kennedy Expressway, began in Spring 2015 and is scheduled for completion in 2016. IL Route 59 Reconstruction and Widening – Multiple phases of the project, which began Summer 2013, have caused significant traffic delays and impacted Metra
-3-
commuters using the Route 59 Station on the BNSF Line. Construction was completed in late November 2015. Union Station Access – The Adams Street Bridge Reconstruction Project began in late January 2016 and is scheduled for completion in early 2017. Throughout 2016, this project will periodically restrict pedestrian access to Union Station via Adams Street. The Union Station Transit Center, a component of the Loop Link project, began construction in 2015. The center will consolidate CTA bus connections for Metra passengers at Union Station, and is scheduled for completion in early summer 2016.
Special Events – Special events often bring large crowds into Chicago during off-peak hours. No special event tickets were sold in June 2016. Metra added additional service on the BNSF and all three Union Pacific Lines for Blues Fest and Spring Awakening (June 10-11) and the Chicago Pride Parade (June 26). Family Fares are in effect seven days a week through Labor Day. Chicago hosted numerous conventions and trade shows in June at McCormick Place and other venues throughout the city. None arranged for special Metra Electric Zone A passes.
-4-
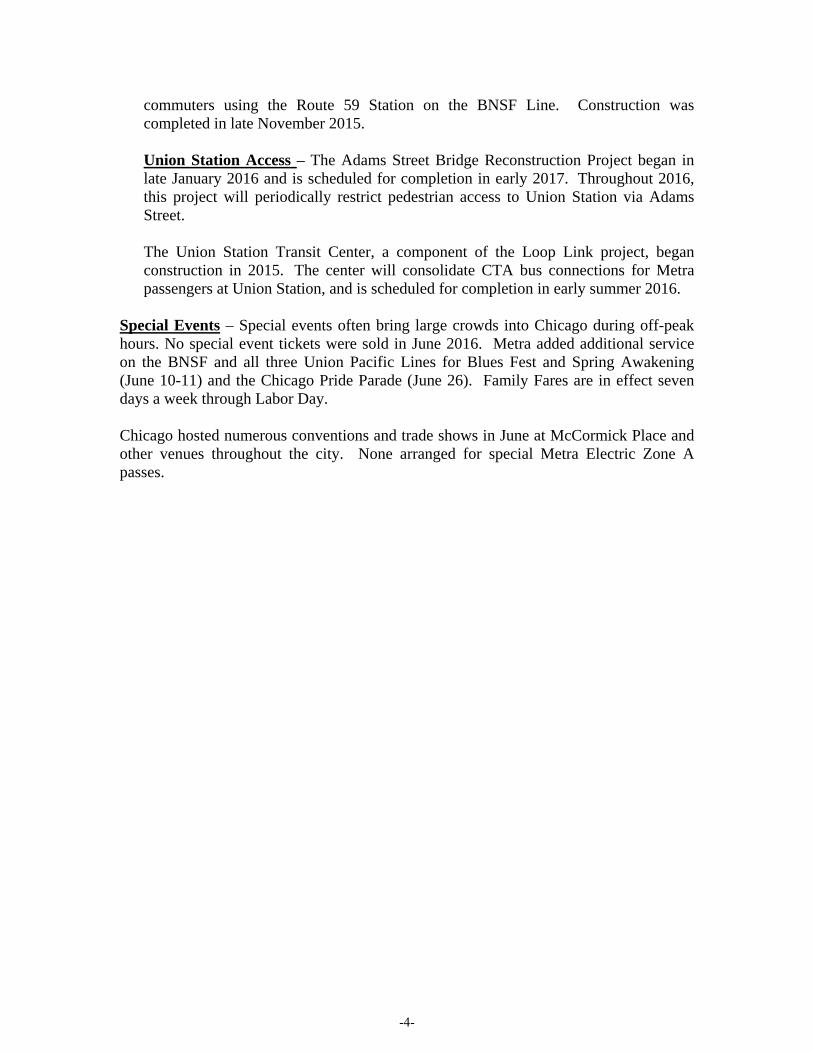
Gas Prices – The average price of a gallon of regular unleaded gas was $2.61 in June 2016, $0.51 lower than June 2015 and $0.21 higher than May 2016.
Chicago-Gary-Kenosha Region Average Gas PriceMonth 2012 2013 2014 2015 2016
Jan $3.56 $3.39 $3.45 $2.07 $1.89Feb $3.59 $3.85 $3.52 $2.36 $1.61Mar $4.17 $3.90 $3.83 $2.60 $2.00Apr $4.22 $3.90 $3.95 $2.67 $2.24May $4.11 $4.18 $3.86 $2.88 $2.40Jun $3.84 $4.23 $3.99 $3.12 $2.61Jul $3.69 $3.92 $3.71 $2.95
Aug $4.15 $3.79 $3.57 $3.04Sep $4.21 $3.74 $3.61 $2.64Oct $3.89 $3.54 $3.30 $2.56Nov $3.59 $3.34 $3.00 $2.23Dec $3.46 $3.30 $2.57 $2.03
YTD Average $3.92 $3.91 $3.77 $2.62 $2.12Annual Average $3.87 $3.76 $3.53 $2.60 $2.12
Source: Bureau of Labor Statistics
$1.00
$1.50
$2.00
$2.50
$3.00
$3.50
$4.00
$4.50
06 07 08 09 10 11 12 13 14 15 16
Pric
e pe
r Gal
lon
Gasoline Price 12-Month Rolling Avg (retrospective)
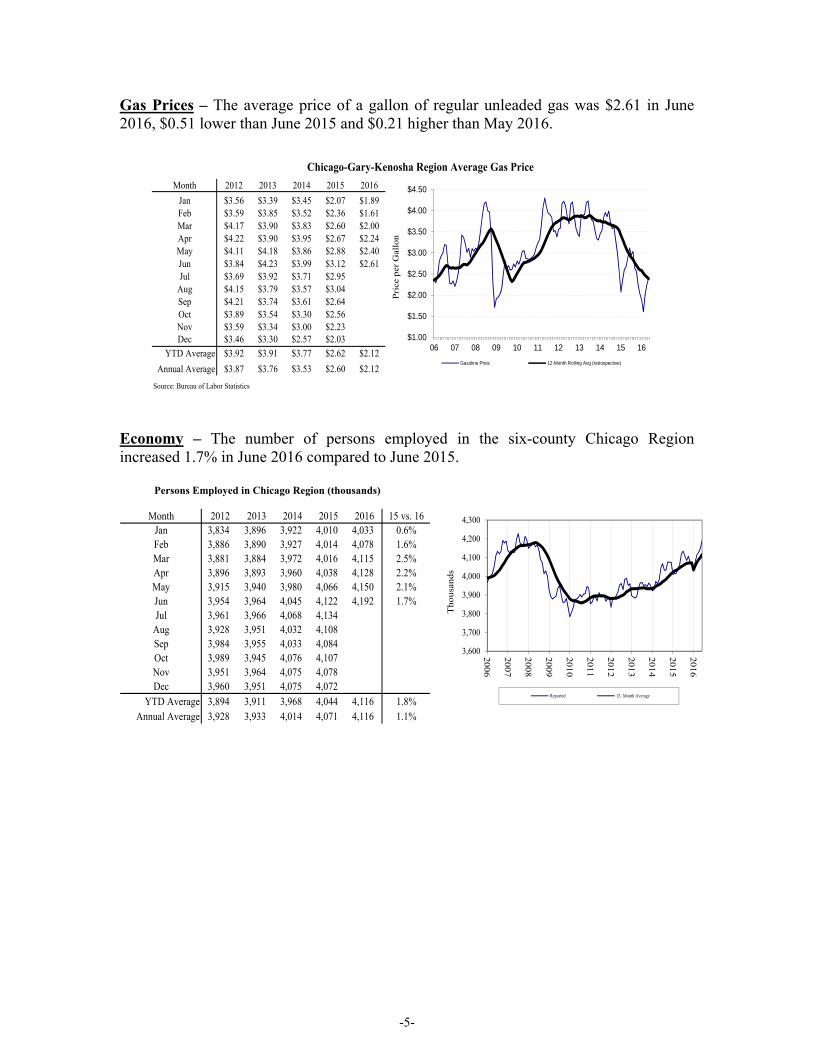
Economy – The number of persons employed in the six-county Chicago Region increased 1.7% in June 2016 compared to June 2015. Persons Employed in Chicago Region (thousands)
Month 2012 2013 2014 2015 2016 15 vs. 16Jan 3,834 3,896 3,922 4,010 4,033 0.6%Feb 3,886 3,890 3,927 4,014 4,078 1.6%Mar 3,881 3,884 3,972 4,016 4,115 2.5%Apr 3,896 3,893 3,960 4,038 4,128 2.2%May 3,915 3,940 3,980 4,066 4,150 2.1%Jun 3,954 3,964 4,045 4,122 4,192 1.7%Jul 3,961 3,966 4,068 4,134
Aug 3,928 3,951 4,032 4,108Sep 3,984 3,955 4,033 4,084Oct 3,989 3,945 4,076 4,107Nov 3,951 3,964 4,075 4,078Dec 3,960 3,951 4,075 4,072
YTD Average 3,894 3,911 3,968 4,044 4,116 1.8%Annual Average 3,928 3,933 4,014 4,071 4,116 1.1%
3,600
3,700
3,800
3,900
4,000
4,100
4,200
4,300
2006
2007
2008
2009
2010
2011
2012
2013
2014
2015
2016
Tho
usan
ds
Reported 12- Month Average
-5-
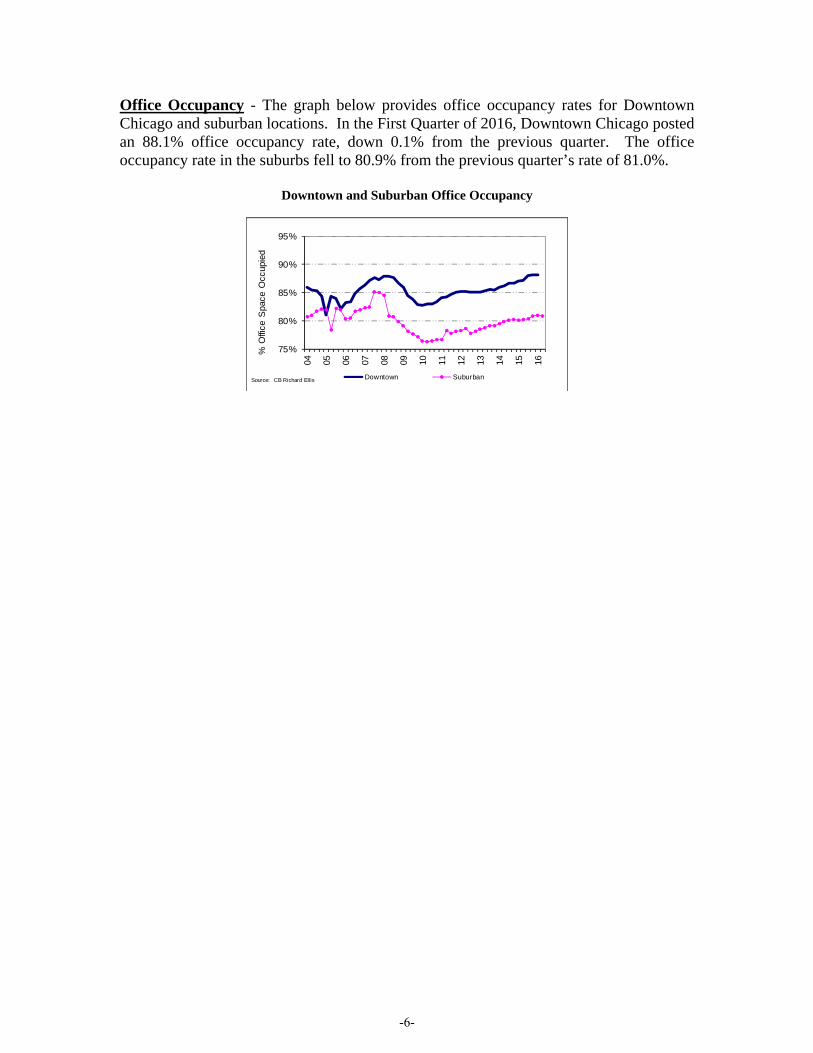
Office Occupancy - The graph below provides office occupancy rates for Downtown Chicago and suburban locations. In the First Quarter of 2016, Downtown Chicago posted an 88.1% office occupancy rate, down 0.1% from the previous quarter. The office occupancy rate in the suburbs fell to 80.9% from the previous quarter’s rate of 81.0%.
Downtown and Suburban Office Occupancy
75%
80%
85%
90%
95%
04 05 06 07 08 09 10 11 12 13 14 15 16
% O
ffice
Spa
ce O
ccup
ied
Downtown SuburbanSource: CB Richard Ellis
-6-
III. RIDERSHIP
Table 2 (pg. 12) presents reported rail line ridership for three time periods (current month, last three months, and last 12 months) for the last two years based on reported ticket sales. Estimated ridership on the North region lines (UP-N, MD-N, NCS, and UP-NW) was down 2.2%, lines serving the West region (MD-W, UP-W, and BNSF) were down 2.1%, and lines serving the South region (HC, RID, SWS, and MED) were down 4.2%. A system summary of ridership by fare zone for June 2016 and the April 2016 – June 2016 period is provided in Table 3 (p. 13). Figure 3 and Table 4 (p. 14) provide data on average passenger trip length.
Passenger load counts are taken by conductors before the first stop on outbound trains and after the last stop before entering the downtown on inbound trains. Table 5 presents average daily conductor load counts by service period for April 2016 – June 2016 (p. 15). Table 6 presents capacity utilization by service period for April 2016 – June 2016 (p. 15).
-7-
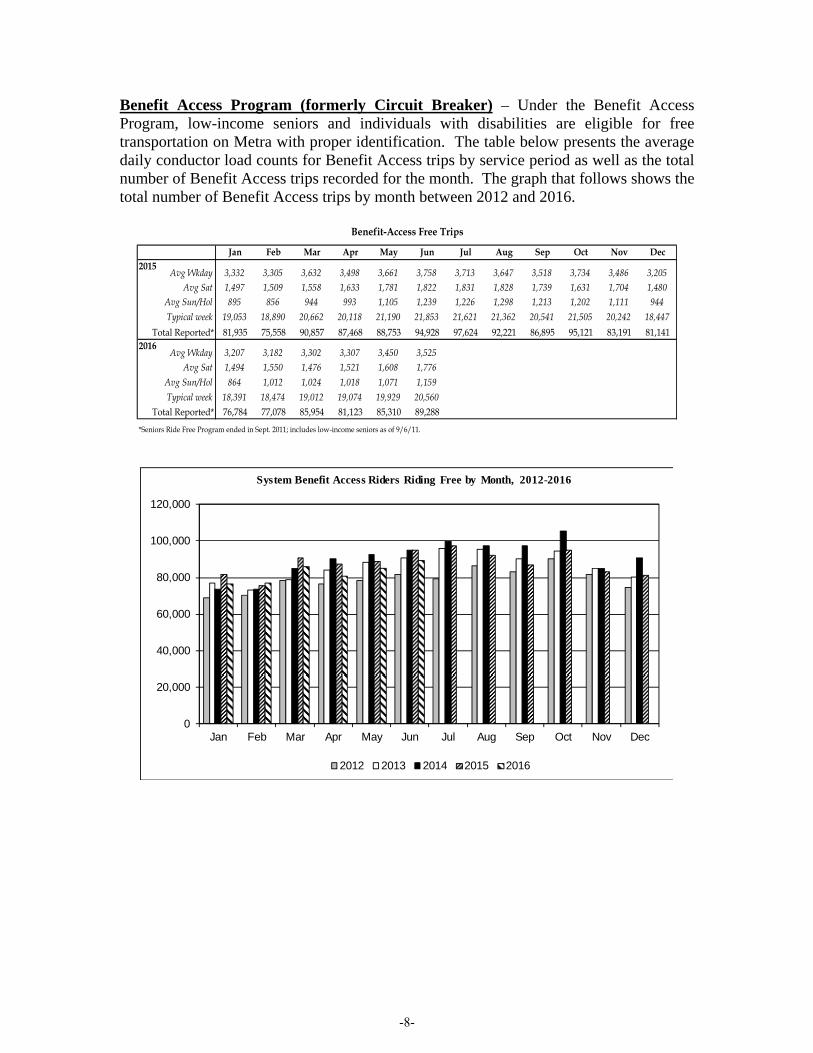
Benefit Access Program (formerly Circuit Breaker) – Under the Benefit Access Program, low-income seniors and individuals with disabilities are eligible for free transportation on Metra with proper identification. The table below presents the average daily conductor load counts for Benefit Access trips by service period as well as the total number of Benefit Access trips recorded for the month. The graph that follows shows the total number of Benefit Access trips by month between 2012 and 2016.
Benefit-Access Free Trips
Jan Feb Mar Apr May Jun Jul Aug Sep Oct Nov Dec2015
Avg Wkday 3,332 3,305 3,632 3,498 3,661 3,758 3,713 3,647 3,518 3,734 3,486 3,205Avg Sat 1,497 1,509 1,558 1,633 1,781 1,822 1,831 1,828 1,739 1,631 1,704 1,480
Avg Sun/Hol 895 856 944 993 1,105 1,239 1,226 1,298 1,213 1,202 1,111 944
Typical week 19,053 18,890 20,662 20,118 21,190 21,853 21,621 21,362 20,541 21,505 20,242 18,447
Total Reported* 81,935 75,558 90,857 87,468 88,753 94,928 97,624 92,221 86,895 95,121 83,191 81,1412016
Avg Wkday 3,207 3,182 3,302 3,307 3,450 3,525 #DIV/0! #DIV/0! #DIV/0! #DIV/0! #DIV/0! #DIV/0!Avg Sat 1,494 1,550 1,476 1,521 1,608 1,776 #DIV/0! #DIV/0! #DIV/0! #DIV/0! #DIV/0! #DIV/0!
Avg Sun/Hol 864 1,012 1,024 1,018 1,071 1,159 #DIV/0! #DIV/0! #DIV/0! #DIV/0! #DIV/0! #DIV/0!
Typical week 18,391 18,474 19,012 19,074 19,929 20,560 #DIV/0! #DIV/0! #DIV/0! #DIV/0! #DIV/0! #DIV/0!
Total Reported* 76,784 77,078 85,954 81,123 85,310 89,288 0 0 0 0 0 0
*Seniors Ride Free Program ended in Sept. 2011; includes low-income seniors as of 9/6/11.
0
20,000
40,000
60,000
80,000
100,000
120,000
Jan Feb Mar Apr May Jun Jul Aug Sep Oct Nov Dec
System Benefit Access Riders Riding Free by Month, 2012-2016
2012 2013 2014 2015 2016
-8-
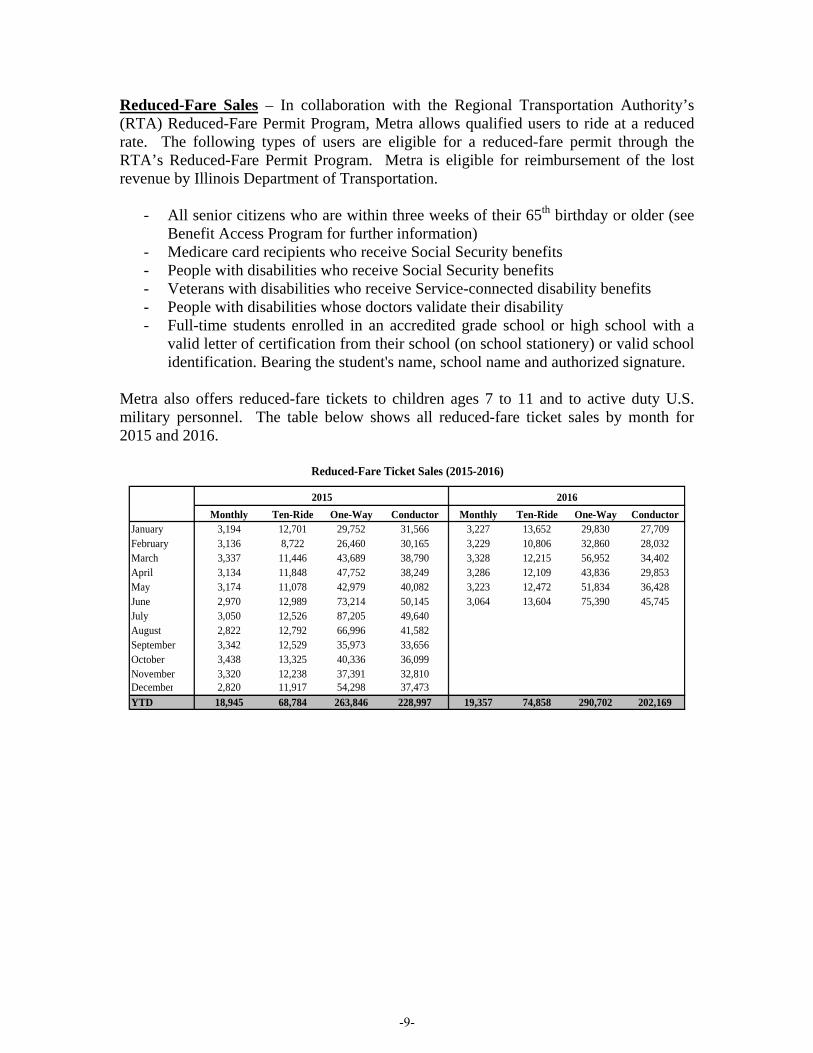
Reduced-Fare Sales – In collaboration with the Regional Transportation Authority’s (RTA) Reduced-Fare Permit Program, Metra allows qualified users to ride at a reduced rate. The following types of users are eligible for a reduced-fare permit through the RTA’s Reduced-Fare Permit Program. Metra is eligible for reimbursement of the lost revenue by Illinois Department of Transportation.
- All senior citizens who are within three weeks of their 65th birthday or older (see Benefit Access Program for further information)
- Medicare card recipients who receive Social Security benefits - People with disabilities who receive Social Security benefits - Veterans with disabilities who receive Service-connected disability benefits - People with disabilities whose doctors validate their disability - Full-time students enrolled in an accredited grade school or high school with a
valid letter of certification from their school (on school stationery) or valid school identification. Bearing the student's name, school name and authorized signature.
Metra also offers reduced-fare tickets to children ages 7 to 11 and to active duty U.S. military personnel. The table below shows all reduced-fare ticket sales by month for 2015 and 2016.
Reduced-Fare Ticket Sales (2015-2016)
2015 2016
Monthly Ten-Ride One-Way Conductor Monthly Ten-Ride One-Way ConductorJanuary 3,194 12,701 29,752 31,566 3,227 13,652 29,830 27,709February 3,136 8,722 26,460 30,165 3,229 10,806 32,860 28,032March 3,337 11,446 43,689 38,790 3,328 12,215 56,952 34,402April 3,134 11,848 47,752 38,249 3,286 12,109 43,836 29,853May 3,174 11,078 42,979 40,082 3,223 12,472 51,834 36,428June 2,970 12,989 73,214 50,145 3,064 13,604 75,390 45,745July 3,050 12,526 87,205 49,640 0 0 0 0August 2,822 12,792 66,996 41,582 0 0 0 0September 3,342 12,529 35,973 33,656 0 0 0 0October 3,438 13,325 40,336 36,099 0 0 0 0November 3,320 12,238 37,391 32,810 0 0 0 0December 2,820 11,917 54,298 37,473 0 0 0 0
YTD 18,945 68,784 263,846 228,997 19,357 74,858 290,702 202,169
-9-
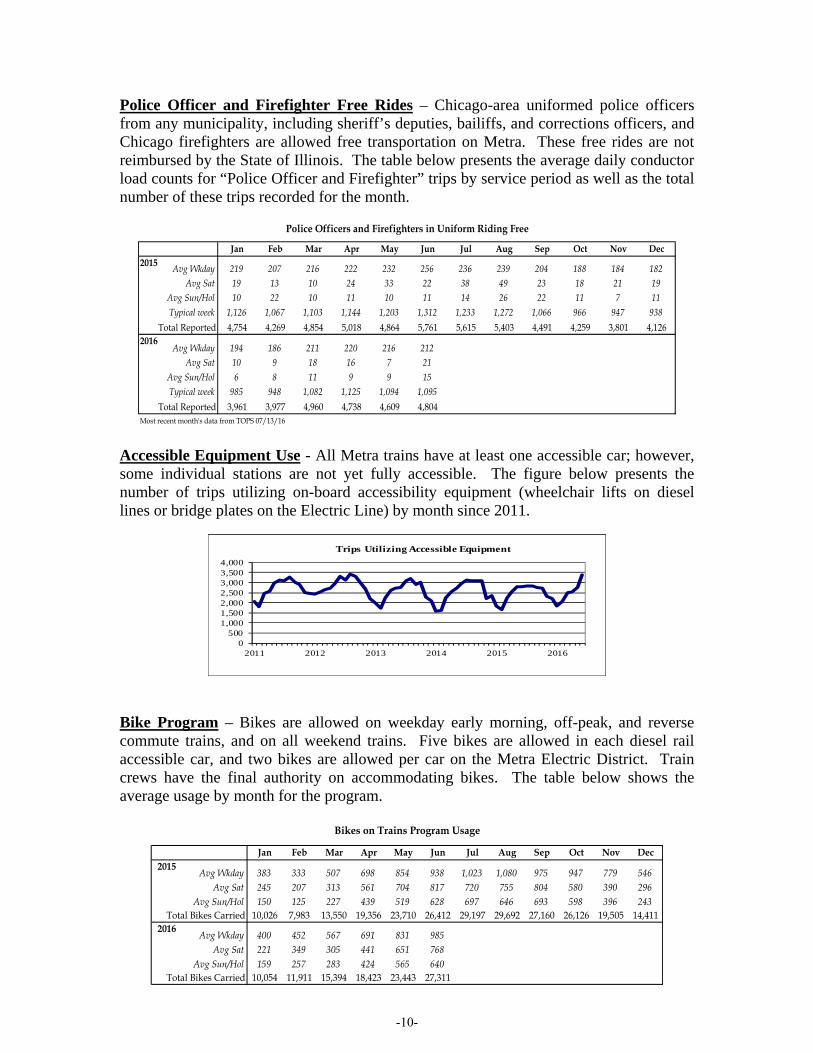
Police Officer and Firefighter Free Rides – Chicago-area uniformed police officers from any municipality, including sheriff’s deputies, bailiffs, and corrections officers, and Chicago firefighters are allowed free transportation on Metra. These free rides are not reimbursed by the State of Illinois. The table below presents the average daily conductor load counts for “Police Officer and Firefighter” trips by service period as well as the total number of these trips recorded for the month.
Police Officers and Firefighters in Uniform Riding Free
Jan Feb Mar Apr May Jun Jul Aug Sep Oct Nov Dec2015
Avg Wkday 219 207 216 222 232 256 236 239 204 188 184 182Avg Sat 19 13 10 24 33 22 38 49 23 18 21 19
Avg Sun/Hol 10 22 10 11 10 11 14 26 22 11 7 11
Typical week 1,126 1,067 1,103 1,144 1,203 1,312 1,233 1,272 1,066 966 947 938
Total Reported 4,754 4,269 4,854 5,018 4,864 5,761 5,615 5,403 4,491 4,259 3,801 4,1262016
Avg Wkday 194 186 211 220 216 212 Avg Sat 10 9 18 16 7 21
Avg Sun/Hol 6 8 11 9 9 15 Typical week 985 948 1,082 1,125 1,094 1,095
Total Reported 3,961 3,977 4,960 4,738 4,609 4,804Most recent month's data from TOPS 07/13/16
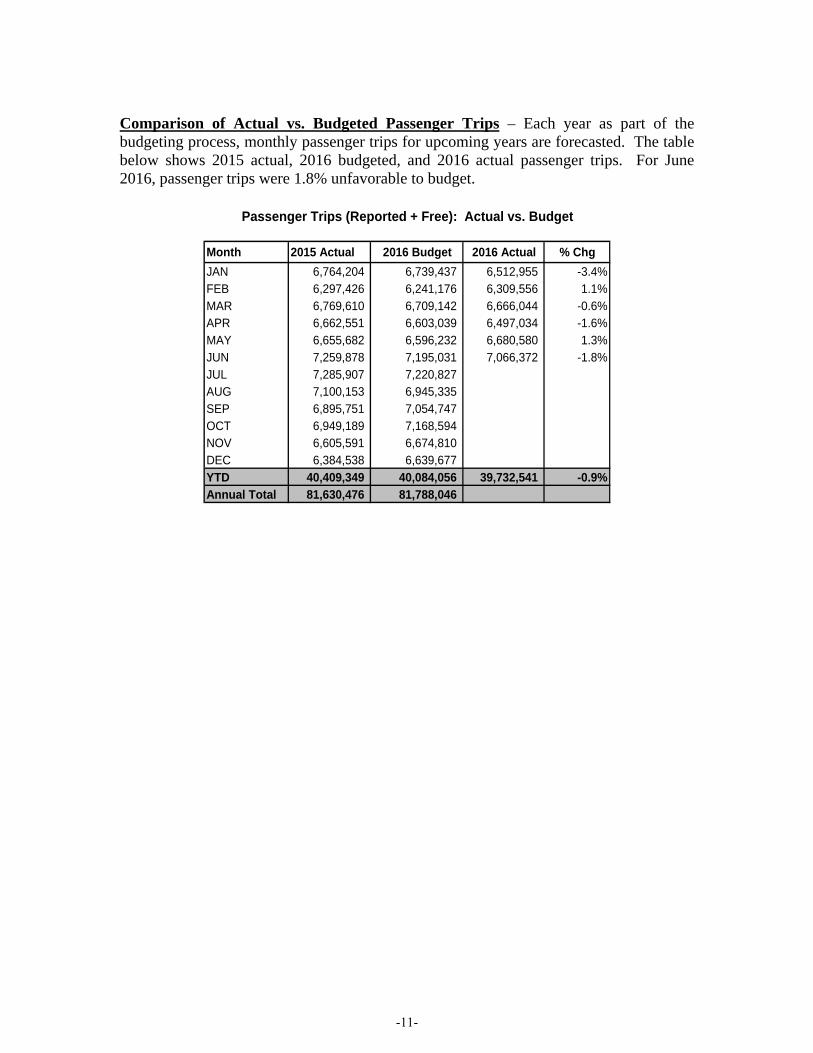
Accessible Equipment Use - All Metra trains have at least one accessible car; however, some individual stations are not yet fully accessible. The figure below presents the number of trips utilizing on-board accessibility equipment (wheelchair lifts on diesel lines or bridge plates on the Electric Line) by month since 2011.
0500
1,0001,5002,0002,5003,0003,5004,000
2011 2012 2013 2014 2015 2016
Trips Utilizing Accessible Equipment
Bike Program – Bikes are allowed on weekday early morning, off-peak, and reverse commute trains, and on all weekend trains. Five bikes are allowed in each diesel rail accessible car, and two bikes are allowed per car on the Metra Electric District. Train crews have the final authority on accommodating bikes. The table below shows the average usage by month for the program.
Bikes on Trains Program Usage
Jan Feb Mar Apr May Jun Jul Aug Sep Oct Nov Dec2015
Avg Wkday 383 333 507 698 854 938 1,023 1,080 975 947 779 546Avg Sat 245 207 313 561 704 817 720 755 804 580 390 296
Avg Sun/Hol 150 125 227 439 519 628 697 646 693 598 396 243Total Bikes Carried 10,026 7,983 13,550 19,356 23,710 26,412 29,197 29,692 27,160 26,126 19,505 14,411
2016Avg Wkday 400 452 567 691 831 985 ##### ##### ##### ##### ##### #####
Avg Sat 221 349 305 441 651 768 ##### ##### ##### ##### ##### #####Avg Sun/Hol 159 257 283 424 565 640 ##### ##### ##### ##### ##### #####
Total Bikes Carried 10,054 11,911 15,394 18,423 23,443 27,311 0 0 0 0 0 0
-10-
Comparison of Actual vs. Budgeted Passenger Trips – Each year as part of the budgeting process, monthly passenger trips for upcoming years are forecasted. The table below shows 2015 actual, 2016 budgeted, and 2016 actual passenger trips. For June 2016, passenger trips were 1.8% unfavorable to budget.
Passenger Trips (Reported + Free): Actual vs. Budget
Month 2015 Actual 2016 Budget 2016 Actual % Chg
JAN 6,764,204 6,739,437 6,512,955 -3.4%FEB 6,297,426 6,241,176 6,309,556 1.1%MAR 6,769,610 6,709,142 6,666,044 -0.6%APR 6,662,551 6,603,039 6,497,034 -1.6%MAY 6,655,682 6,596,232 6,680,580 1.3%JUN 7,259,878 7,195,031 7,066,372 -1.8%JUL 7,285,907 7,220,827 0 -100.0%AUG 7,100,153 6,945,335 0 -100.0%SEP 6,895,751 7,054,747 0 -100.0%OCT 6,949,189 7,168,594 0 -100.0%NOV 6,605,591 6,674,810 0 -100.0%DEC 6,384,538 6,639,677 0 -100.0%YTD 40,409,349 40,084,056 39,732,541 -0.9%Annual Total 81,630,476 81,788,046
-11-
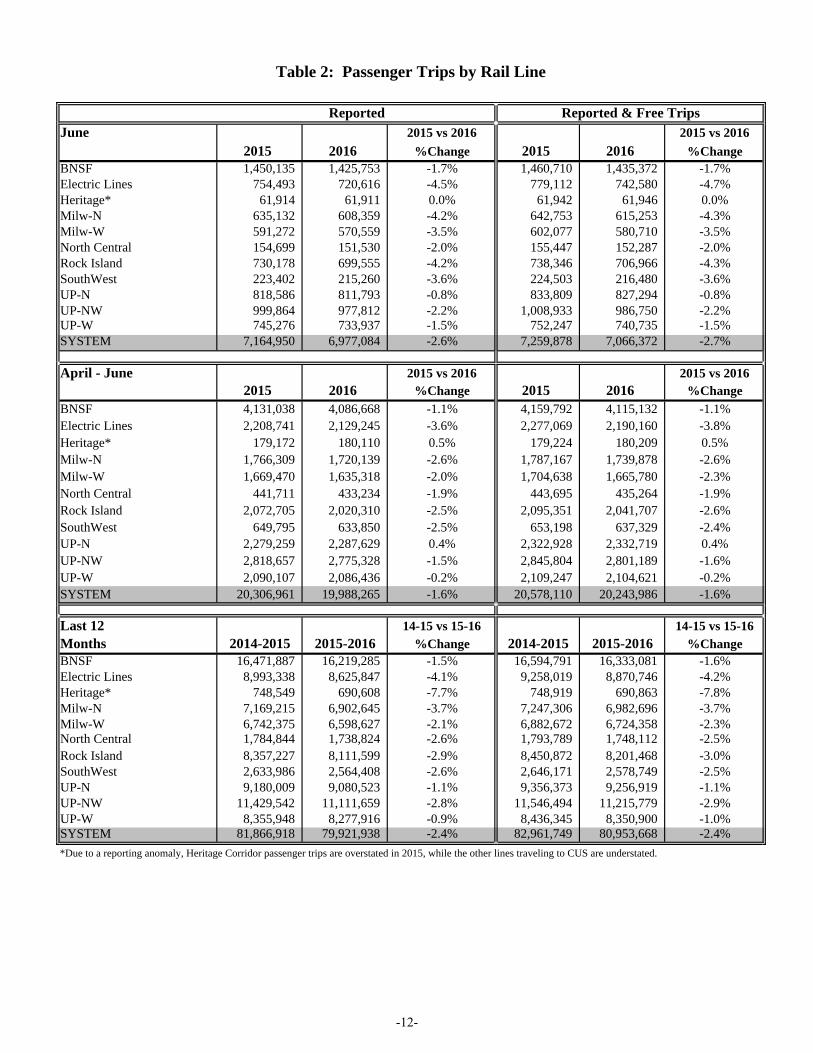
Table 2: Passenger Trips by Rail Line
Reported Reported & Free Trips
June 2015 vs 2016 2015 vs 2016
2015 2016 %Change 2015 2016 %ChangeBNSF 1,450,135 1,425,753 -1.7% 1,460,710 1,435,372 -1.7%Electric Lines 754,493 720,616 -4.5% 779,112 742,580 -4.7%Heritage* 61,914 61,911 0.0% 61,942 61,946 0.0%Milw-N 635,132 608,359 -4.2% 642,753 615,253 -4.3%Milw-W 591,272 570,559 -3.5% 602,077 580,710 -3.5%North Central 154,699 151,530 -2.0% 155,447 152,287 -2.0%Rock Island 730,178 699,555 -4.2% 738,346 706,966 -4.3%SouthWest 223,402 215,260 -3.6% 224,503 216,480 -3.6%UP-N 818,586 811,793 -0.8% 833,809 827,294 -0.8%UP-NW 999,864 977,812 -2.2% 1,008,933 986,750 -2.2%UP-W 745,276 733,937 -1.5% 752,247 740,735 -1.5%SYSTEM 7,164,950 6,977,084 -2.6% 7,259,878 7,066,372 -2.7%
April - June 2015 vs 2016 2015 vs 20162015 2016 %Change 2015 2016 %Change
BNSF 4,131,038 4,086,668 -1.1% 4,159,792 4,115,132 -1.1%Electric Lines 2,208,741 2,129,245 -3.6% 2,277,069 2,190,160 -3.8%Heritage* 179,172 180,110 0.5% 179,224 180,209 0.5%Milw-N 1,766,309 1,720,139 -2.6% 1,787,167 1,739,878 -2.6%Milw-W 1,669,470 1,635,318 -2.0% 1,704,638 1,665,780 -2.3%North Central 441,711 433,234 -1.9% 443,695 435,264 -1.9%Rock Island 2,072,705 2,020,310 -2.5% 2,095,351 2,041,707 -2.6%SouthWest 649,795 633,850 -2.5% 653,198 637,329 -2.4%UP-N 2,279,259 2,287,629 0.4% 2,322,928 2,332,719 0.4%UP-NW 2,818,657 2,775,328 -1.5% 2,845,804 2,801,189 -1.6%UP-W 2,090,107 2,086,436 -0.2% 2,109,247 2,104,621 -0.2%SYSTEM 20,306,961 19,988,265 -1.6% 20,578,110 20,243,986 -1.6%
Last 12 14-15 vs 15-16 14-15 vs 15-16Months 2014-2015 2015-2016 %Change 2014-2015 2015-2016 %ChangeBNSF 16,471,887 16,219,285 -1.5% 16,594,791 16,333,081 -1.6%Electric Lines 8,993,338 8,625,847 -4.1% 9,258,019 8,870,746 -4.2%Heritage* 748,549 690,608 -7.7% 748,919 690,863 -7.8%Milw-N 7,169,215 6,902,645 -3.7% 7,247,306 6,982,696 -3.7%Milw-W 6,742,375 6,598,627 -2.1% 6,882,672 6,724,358 -2.3%North Central 1,784,844 1,738,824 -2.6% 1,793,789 1,748,112 -2.5%Rock Island 8,357,227 8,111,599 -2.9% 8,450,872 8,201,468 -3.0%SouthWest 2,633,986 2,564,408 -2.6% 2,646,171 2,578,749 -2.5%UP-N 9,180,009 9,080,523 -1.1% 9,356,373 9,256,919 -1.1%UP-NW 11,429,542 11,111,659 -2.8% 11,546,494 11,215,779 -2.9%UP-W 8,355,948 8,277,916 -0.9% 8,436,345 8,350,900 -1.0%SYSTEM 81,866,918 79,921,938 -2.4% 82,961,749 80,953,668 -2.4%
*Due to a reporting anomaly, Heritage Corridor passenger trips are overstated in 2015, while the other lines traveling to CUS are understated.
-12-
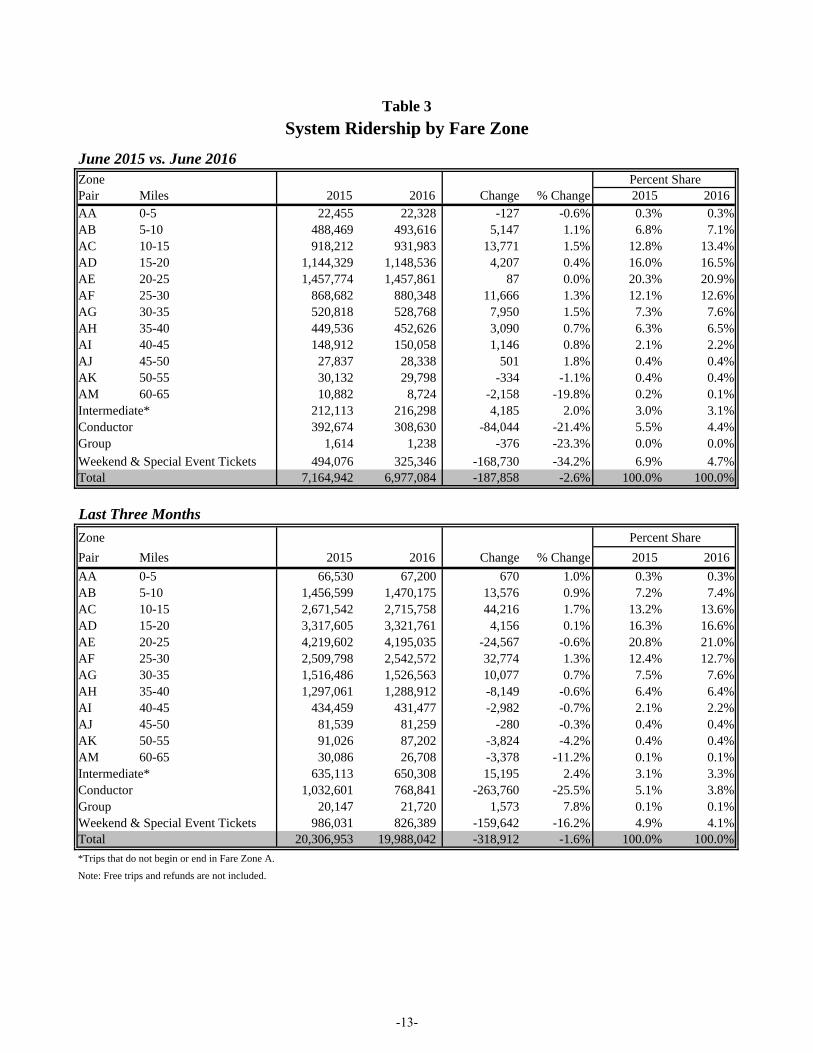
Table 3
System Ridership by Fare Zone
June 2015 vs. June 2016Zone Percent SharePair Miles 2015 2016 Change % Change 2015 2016AA 0-5 22,455 22,328 -127 -0.6% 0.3% 0.3%AB 5-10 488,469 493,616 5,147 1.1% 6.8% 7.1%AC 10-15 918,212 931,983 13,771 1.5% 12.8% 13.4%AD 15-20 1,144,329 1,148,536 4,207 0.4% 16.0% 16.5%AE 20-25 1,457,774 1,457,861 87 0.0% 20.3% 20.9%AF 25-30 868,682 880,348 11,666 1.3% 12.1% 12.6%AG 30-35 520,818 528,768 7,950 1.5% 7.3% 7.6%AH 35-40 449,536 452,626 3,090 0.7% 6.3% 6.5%AI 40-45 148,912 150,058 1,146 0.8% 2.1% 2.2%AJ 45-50 27,837 28,338 501 1.8% 0.4% 0.4%AK 50-55 30,132 29,798 -334 -1.1% 0.4% 0.4%AM 60-65 10,882 8,724 -2,158 -19.8% 0.2% 0.1%Intermediate* 212,113 216,298 4,185 2.0% 3.0% 3.1%Conductor 392,674 308,630 -84,044 -21.4% 5.5% 4.4%Group 1,614 1,238 -376 -23.3% 0.0% 0.0%
Weekend & Special Event Tickets 494,076 325,346 -168,730 -34.2% 6.9% 4.7%Total 7,164,942 6,977,084 -187,858 -2.6% 100.0% 100.0%
Last Three Months
Zone Percent Share
Pair Miles 2015 2016 Change % Change 2015 2016
AA 0-5 66,530 67,200 670 1.0% 0.3% 0.3%AB 5-10 1,456,599 1,470,175 13,576 0.9% 7.2% 7.4%AC 10-15 2,671,542 2,715,758 44,216 1.7% 13.2% 13.6%AD 15-20 3,317,605 3,321,761 4,156 0.1% 16.3% 16.6%AE 20-25 4,219,602 4,195,035 -24,567 -0.6% 20.8% 21.0%AF 25-30 2,509,798 2,542,572 32,774 1.3% 12.4% 12.7%AG 30-35 1,516,486 1,526,563 10,077 0.7% 7.5% 7.6%AH 35-40 1,297,061 1,288,912 -8,149 -0.6% 6.4% 6.4%AI 40-45 434,459 431,477 -2,982 -0.7% 2.1% 2.2%AJ 45-50 81,539 81,259 -280 -0.3% 0.4% 0.4%AK 50-55 91,026 87,202 -3,824 -4.2% 0.4% 0.4%AM 60-65 30,086 26,708 -3,378 -11.2% 0.1% 0.1%Intermediate* 635,113 650,308 15,195 2.4% 3.1% 3.3%Conductor 1,032,601 768,841 -263,760 -25.5% 5.1% 3.8%Group 20,147 21,720 1,573 7.8% 0.1% 0.1%Weekend & Special Event Tickets 986,031 826,389 -159,642 -16.2% 4.9% 4.1%Total 20,306,953 19,988,042 -318,912 -1.6% 100.0% 100.0%
*Trips that do not begin or end in Fare Zone A.
Note: Free trips and refunds are not included.
-13-
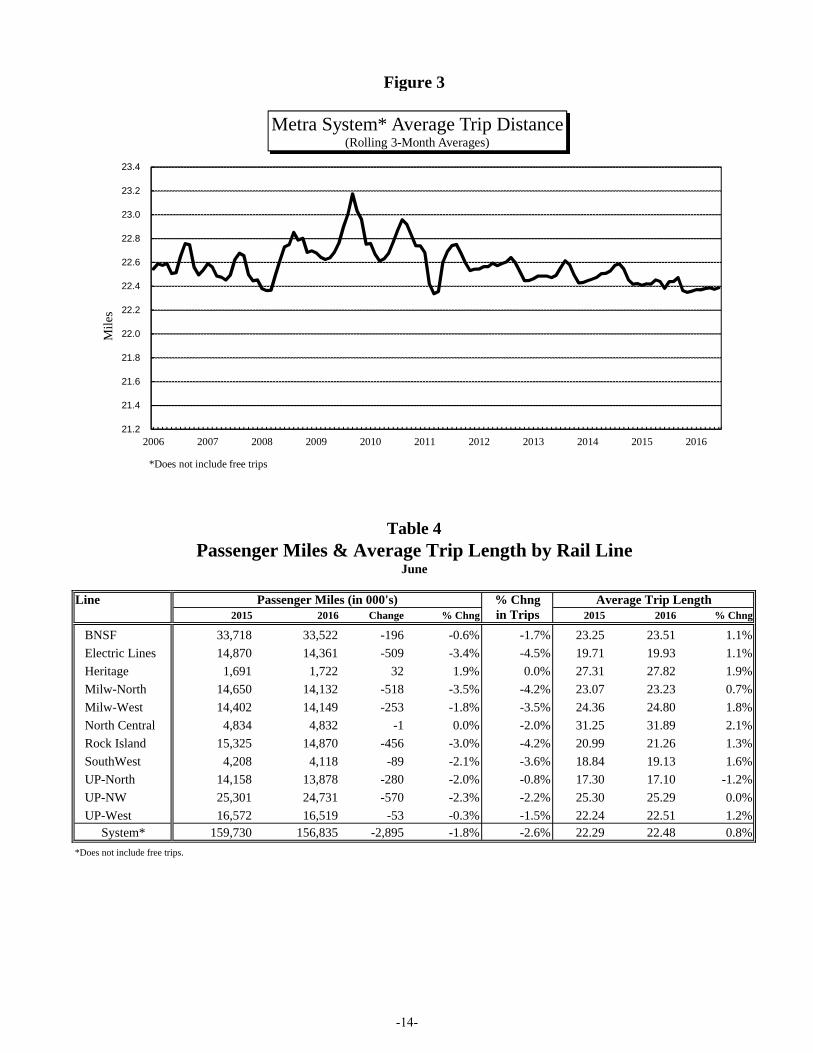
Table 4Passenger Miles & Average Trip Length by Rail Line
June
Line Passenger Miles (in 000's) % Chng Average Trip Length2015 2016 Change % Chng in Trips 2015 2016 % Chng
BNSF 33,718 33,522 -196 -0.6% -1.7% 23.25 23.51 1.1%
Electric Lines 14,870 14,361 -509 -3.4% -4.5% 19.71 19.93 1.1%
Heritage 1,691 1,722 32 1.9% 0.0% 27.31 27.82 1.9%
Milw-North 14,650 14,132 -518 -3.5% -4.2% 23.07 23.23 0.7%
Milw-West 14,402 14,149 -253 -1.8% -3.5% 24.36 24.80 1.8%
North Central 4,834 4,832 -1 0.0% -2.0% 31.25 31.89 2.1%
Rock Island 15,325 14,870 -456 -3.0% -4.2% 20.99 21.26 1.3%
SouthWest 4,208 4,118 -89 -2.1% -3.6% 18.84 19.13 1.6%
UP-North 14,158 13,878 -280 -2.0% -0.8% 17.30 17.10 -1.2%
UP-NW 25,301 24,731 -570 -2.3% -2.2% 25.30 25.29 0.0%
UP-West 16,572 16,519 -53 -0.3% -1.5% 22.24 22.51 1.2%System* 159,730 156,835 -2,895 -1.8% -2.6% 22.29 22.48 0.8%
*Does not include free trips.
Figure 3
21.2
21.4
21.6
21.8
22.0
22.2
22.4
22.6
22.8
23.0
23.2
23.4
2006 2007 2008 2009 2010 2011 2012 2013 2014 2015 2016
Mile
s
Metra System* Average Trip Distance(Rolling 3-Month Averages)
*Does not include free trips
-14-
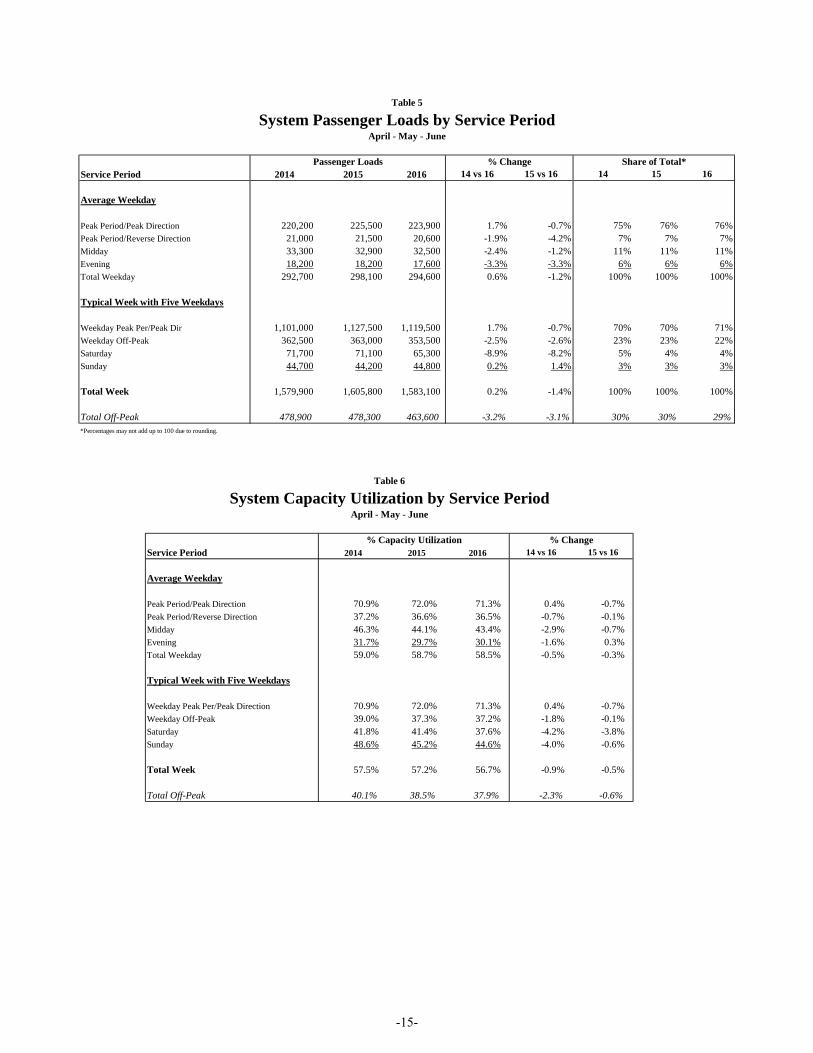
Table 5
System Passenger Loads by Service PeriodApril - May - June
Passenger Loads % Change Share of Total*Service Period 2014 2015 2016 14 vs 16 15 vs 16 14 15 16
Average Weekday
Peak Period/Peak Direction 220,200 225,500 223,900 1.7% -0.7% 75% 76% 76%Peak Period/Reverse Direction 21,000 21,500 20,600 -1.9% -4.2% 7% 7% 7%Midday 33,300 32,900 32,500 -2.4% -1.2% 11% 11% 11%Evening 18,200 18,200 17,600 -3.3% -3.3% 6% 6% 6%Total Weekday 292,700 298,100 294,600 0.6% -1.2% 100% 100% 100%
Typical Week with Five Weekdays
Weekday Peak Per/Peak Dir 1,101,000 1,127,500 1,119,500 1.7% -0.7% 70% 70% 71%Weekday Off-Peak 362,500 363,000 353,500 -2.5% -2.6% 23% 23% 22%Saturday 71,700 71,100 65,300 -8.9% -8.2% 5% 4% 4%Sunday 44,700 44,200 44,800 0.2% 1.4% 3% 3% 3%
Total Week 1,579,900 1,605,800 1,583,100 0.2% -1.4% 100% 100% 100%
Total Off-Peak 478,900 478,300 463,600 -3.2% -3.1% 30% 30% 29%*Percentages may not add up to 100 due to rounding.
System Capacity Utilization by Service PeriodApril - May - June
% Capacity Utilization % ChangeService Period 2014 2015 2016 14 vs 16 15 vs 16
Average Weekday
Peak Period/Peak Direction 70.9% 72.0% 71.3% 0.4% -0.7%Peak Period/Reverse Direction 37.2% 36.6% 36.5% -0.7% -0.1%Midday 46.3% 44.1% 43.4% -2.9% -0.7%Evening 31.7% 29.7% 30.1% -1.6% 0.3%Total Weekday 59.0% 58.7% 58.5% -0.5% -0.3%
Typical Week with Five Weekdays
Weekday Peak Per/Peak Direction 70.9% 72.0% 71.3% 0.4% -0.7%Weekday Off-Peak 39.0% 37.3% 37.2% -1.8% -0.1%Saturday 41.8% 41.4% 37.6% -4.2% -3.8%Sunday 48.6% 45.2% 44.6% -4.0% -0.6%
Total Week 57.5% 57.2% 56.7% -0.9% -0.5%
Total Off-Peak 40.1% 38.5% 37.9% -2.3% -0.6%
Table 6
-15-
IV. TICKET SALES Table 7 (p. 20) provides a breakdown by rail line of June sales by ticket type for 2015 and 2016. Estimated ridership and revenue data by ticket type is shown on Table 8 (p. 21). Table 9 (p. 21) breaks down the June ticket sales by method of purchase, which includes station (agents and vending machines), Ventra Mobile App, Ticket-by-Mail, Ticket-by-Internet, conductor sales, and Commuter Benefit. February 2016 Fare Increase – Effective February 1, 2016, Metra fares rose by an average of 2.0%. One-way ticket prices rose by $0.25, ten-ride ticket prices rose by $1.75, and monthly ticket prices rose by $2.50. Reduced fare ten-ride ticket prices rose by $0.75, and reduced fare monthly ticet prices rose by $1.25. February 2015 Fare Increase – Effective February 1, 2015, Metra fares rose by an average of 10.8%. Part of the fare (and policy) changes was to restore the price of ten-ride tickets to nine times the price of one-way tickets, reversing a change made in February 2013. Despite the restoration of the discount, most ten-ride tickets increased in price. For the February 2015-January 2016 period monthly ticket sales fell by 5.9% and ten-ride ticket sales rose by 14.0% compared to the same period in 2014-2015. The shift from monthly tickets to ten-ride tickets was gradual and continued throughout 2015. As such, the effects of this shift in ticket preference will continue to be evident in the month to month comparisons through most of 2016. As the year progresses, these effects are anticipated to become less pronounced.
-16-
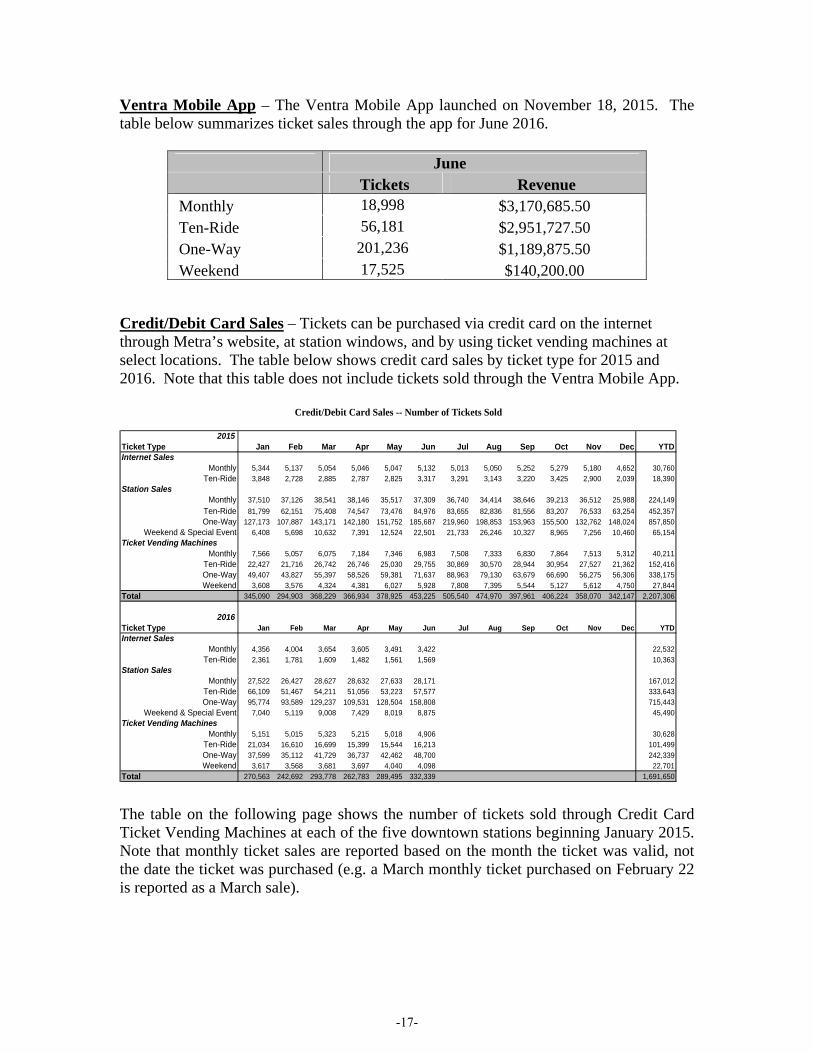
Ventra Mobile App – The Ventra Mobile App launched on November 18, 2015. The table below summarizes ticket sales through the app for June 2016.
June Tickets Revenue Monthly 18,998 $3,170,685.50 Ten-Ride 56,181 $2,951,727.50 One-Way 201,236 $1,189,875.50 Weekend 17,525 $140,200.00
Credit/Debit Card Sales – Tickets can be purchased via credit card on the internet through Metra’s website, at station windows, and by using ticket vending machines at select locations. The table below shows credit card sales by ticket type for 2015 and 2016. Note that this table does not include tickets sold through the Ventra Mobile App.
Credit/Debit Card Sales -- Number of Tickets Sold
2015Ticket Type Jan Feb Mar Apr May Jun Jul Aug Sep Oct Nov Dec YTDInternet Sales
Monthly 5,344 5,137 5,054 5,046 5,047 5,132 5,013 5,050 5,252 5,279 5,180 4,652 30,760
Ten-Ride 3,848 2,728 2,885 2,787 2,825 3,317 3,291 3,143 3,220 3,425 2,900 2,039 18,390Station Sales
Monthly 37,510 37,126 38,541 38,146 35,517 37,309 36,740 34,414 38,646 39,213 36,512 25,988 224,149
Ten-Ride 81,799 62,151 75,408 74,547 73,476 84,976 83,655 82,836 81,556 83,207 76,533 63,254 452,357One-Way 127,173 107,887 143,171 142,180 151,752 185,687 219,960 198,853 153,963 155,500 132,762 148,024 857,850
Weekend & Special Event 6,408 5,698 10,632 7,391 12,524 22,501 21,733 26,246 10,327 8,965 7,256 10,460 65,154Ticket Vending Machines
Monthly 7,566 5,057 6,075 7,184 7,346 6,983 7,508 7,333 6,830 7,864 7,513 5,312 40,211
Ten-Ride 22,427 21,716 26,742 26,746 25,030 29,755 30,869 30,570 28,944 30,954 27,527 21,362 152,416
One-Way 49,407 43,827 55,397 58,526 59,381 71,637 88,963 79,130 63,679 66,690 56,275 56,306 338,175
Weekend 3,608 3,576 4,324 4,381 6,027 5,928 7,808 7,395 5,544 5,127 5,612 4,750 27,844
Total 345,090 294,903 368,229 366,934 378,925 453,225 505,540 474,970 397,961 406,224 358,070 342,147 2,207,306
2016Ticket Type Jan Feb Mar Apr May Jun Jul Aug Sep Oct Nov Dec YTDInternet Sales
Monthly 4,356 4,004 3,654 3,605 3,491 3,422 0 0 0 0 0 0 22,532Ten-Ride 2,361 1,781 1,609 1,482 1,561 1,569 0 0 0 0 0 0 10,363
Station SalesMonthly 27,522 26,427 28,627 28,632 27,633 28,171 0 0 0 0 0 0 167,012
Ten-Ride 66,109 51,467 54,211 51,056 53,223 57,577 0 0 0 0 0 0 333,643
One-Way 95,774 93,589 129,237 109,531 128,504 158,808 0 0 0 0 0 0 715,443
Weekend & Special Event 7,040 5,119 9,008 7,429 8,019 8,875 0 0 0 0 0 0 45,490Ticket Vending Machines
Monthly 5,151 5,015 5,323 5,215 5,018 4,906 0 0 0 0 0 0 30,628Ten-Ride 21,034 16,610 16,699 15,399 15,544 16,213 0 0 0 0 0 0 101,499One-Way 37,599 35,112 41,729 36,737 42,462 48,700 0 0 0 0 0 0 242,339Weekend 3,617 3,568 3,681 3,697 4,040 4,098 0 0 0 0 0 0 22,701
Total 270,563 242,692 293,778 262,783 289,495 332,339 0 0 0 0 0 0 1,691,650
The table on the following page shows the number of tickets sold through Credit Card Ticket Vending Machines at each of the five downtown stations beginning January 2015. Note that monthly ticket sales are reported based on the month the ticket was valid, not the date the ticket was purchased (e.g. a March monthly ticket purchased on February 22 is reported as a March sale).
-17-
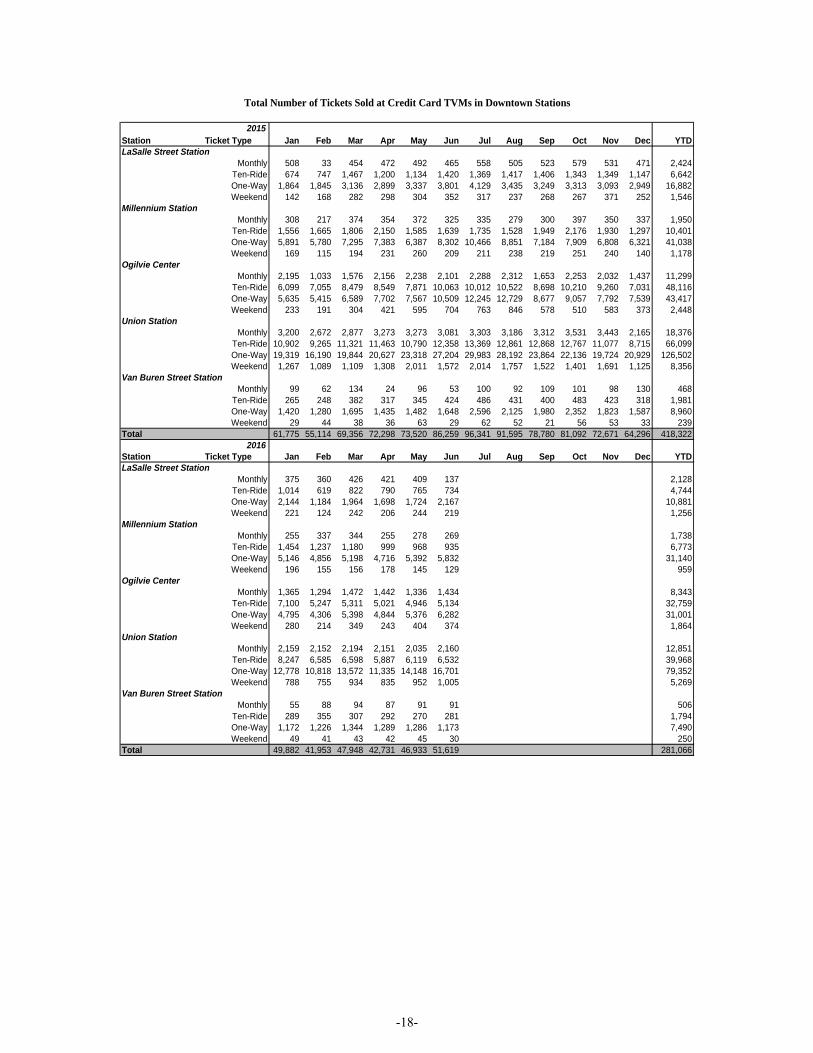
Total Number of Tickets Sold at Credit Card TVMs in Downtown Stations
2015Station Ticket Type Jan Feb Mar Apr May Jun Jul Aug Sep Oct Nov Dec YTDLaSalle Street Station
Monthly 508 33 454 472 492 465 558 505 523 579 531 471 2,424Ten-Ride 674 747 1,467 1,200 1,134 1,420 1,369 1,417 1,406 1,343 1,349 1,147 6,642One-Way 1,864 1,845 3,136 2,899 3,337 3,801 4,129 3,435 3,249 3,313 3,093 2,949 16,882Weekend 142 168 282 298 304 352 317 237 268 267 371 252 1,546
Millennium StationMonthly 308 217 374 354 372 325 335 279 300 397 350 337 1,950
Ten-Ride 1,556 1,665 1,806 2,150 1,585 1,639 1,735 1,528 1,949 2,176 1,930 1,297 10,401One-Way 5,891 5,780 7,295 7,383 6,387 8,302 10,466 8,851 7,184 7,909 6,808 6,321 41,038Weekend 169 115 194 231 260 209 211 238 219 251 240 140 1,178
Ogilvie CenterMonthly 2,195 1,033 1,576 2,156 2,238 2,101 2,288 2,312 1,653 2,253 2,032 1,437 11,299
Ten-Ride 6,099 7,055 8,479 8,549 7,871 10,063 10,012 10,522 8,698 10,210 9,260 7,031 48,116One-Way 5,635 5,415 6,589 7,702 7,567 10,509 12,245 12,729 8,677 9,057 7,792 7,539 43,417Weekend 233 191 304 421 595 704 763 846 578 510 583 373 2,448
Union StationMonthly 3,200 2,672 2,877 3,273 3,273 3,081 3,303 3,186 3,312 3,531 3,443 2,165 18,376
Ten-Ride 10,902 9,265 11,321 11,463 10,790 12,358 13,369 12,861 12,868 12,767 11,077 8,715 66,099One-Way 19,319 16,190 19,844 20,627 23,318 27,204 29,983 28,192 23,864 22,136 19,724 20,929 126,502Weekend 1,267 1,089 1,109 1,308 2,011 1,572 2,014 1,757 1,522 1,401 1,691 1,125 8,356
Van Buren Street StationMonthly 99 62 134 24 96 53 100 92 109 101 98 130 468
Ten-Ride 265 248 382 317 345 424 486 431 400 483 423 318 1,981One-Way 1,420 1,280 1,695 1,435 1,482 1,648 2,596 2,125 1,980 2,352 1,823 1,587 8,960Weekend 29 44 38 36 63 29 62 52 21 56 53 33 239
Total 61,775 55,114 69,356 72,298 73,520 86,259 96,341 91,595 78,780 81,092 72,671 64,296 418,3222016
Station Ticket Type Jan Feb Mar Apr May Jun Jul Aug Sep Oct Nov Dec YTDLaSalle Street Station
Monthly 375 360 426 421 409 137 0 0 0 0 0 0 2,128Ten-Ride 1,014 619 822 790 765 734 0 0 0 0 0 0 4,744One-Way 2,144 1,184 1,964 1,698 1,724 2,167 0 0 0 0 0 0 10,881Weekend 221 124 242 206 244 219 0 0 0 0 0 0 1,256
Millennium StationMonthly 255 337 344 255 278 269 0 0 0 0 0 0 1,738
Ten-Ride 1,454 1,237 1,180 999 968 935 0 0 0 0 0 0 6,773One-Way 5,146 4,856 5,198 4,716 5,392 5,832 0 0 0 0 0 0 31,140Weekend 196 155 156 178 145 129 0 0 0 0 0 0 959
Ogilvie CenterMonthly 1,365 1,294 1,472 1,442 1,336 1,434 0 0 0 0 0 0 8,343
Ten-Ride 7,100 5,247 5,311 5,021 4,946 5,134 0 0 0 0 0 0 32,759One-Way 4,795 4,306 5,398 4,844 5,376 6,282 0 0 0 0 0 0 31,001Weekend 280 214 349 243 404 374 0 0 0 0 0 0 1,864
Union StationMonthly 2,159 2,152 2,194 2,151 2,035 2,160 0 0 0 0 0 0 12,851
Ten-Ride 8,247 6,585 6,598 5,887 6,119 6,532 0 0 0 0 0 0 39,968One-Way 12,778 10,818 13,572 11,335 14,148 16,701 0 0 0 0 0 0 79,352Weekend 788 755 934 835 952 1,005 0 0 0 0 0 0 5,269
Van Buren Street StationMonthly 55 88 94 87 91 91 0 0 0 0 0 0 506
Ten-Ride 289 355 307 292 270 281 0 0 0 0 0 0 1,794One-Way 1,172 1,226 1,344 1,289 1,286 1,173 0 0 0 0 0 0 7,490Weekend 49 41 43 42 45 30 0 0 0 0 0 0 250
Total 49,882 41,953 47,948 42,731 46,933 51,619 0 0 0 0 0 0 281,066
-18-
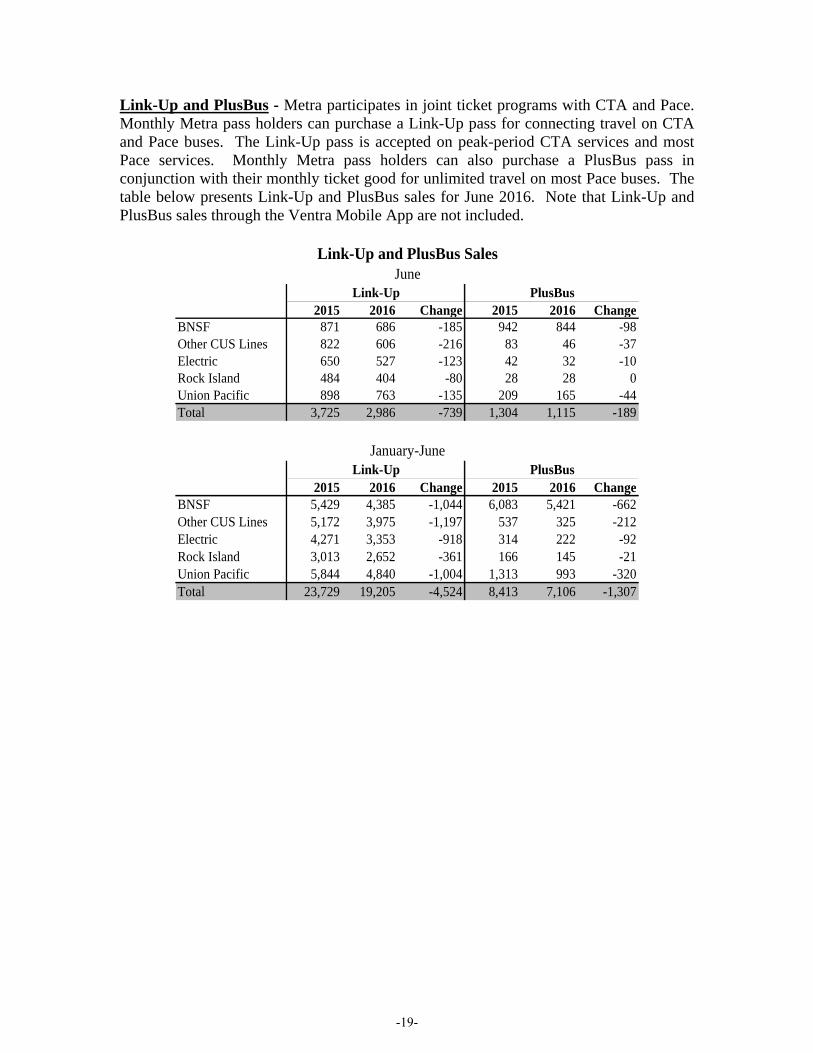
Link-Up and PlusBus - Metra participates in joint ticket programs with CTA and Pace. Monthly Metra pass holders can purchase a Link-Up pass for connecting travel on CTA and Pace buses. The Link-Up pass is accepted on peak-period CTA services and most Pace services. Monthly Metra pass holders can also purchase a PlusBus pass in conjunction with their monthly ticket good for unlimited travel on most Pace buses. The table below presents Link-Up and PlusBus sales for June 2016. Note that Link-Up and PlusBus sales through the Ventra Mobile App are not included.
Link-Up and PlusBus SalesJune
Link-Up PlusBus2015 2016 Change 2015 2016 Change
BNSF 871 686 -185 942 844 -98Other CUS Lines 822 606 -216 83 46 -37Electric 650 527 -123 42 32 -10Rock Island 484 404 -80 28 28 0Union Pacific 898 763 -135 209 165 -44Total 3,725 2,986 -739 1,304 1,115 -189
January-June
Link-Up PlusBus2015 2016 Change 2015 2016 Change
BNSF 5,429 4,385 -1,044 6,083 5,421 -662Other CUS Lines 5,172 3,975 -1,197 537 325 -212Electric 4,271 3,353 -918 314 222 -92Rock Island 3,013 2,652 -361 166 145 -21Union Pacific 5,844 4,840 -1,004 1,313 993 -320Total 23,729 19,205 -4,524 8,413 7,106 -1,307
-19-
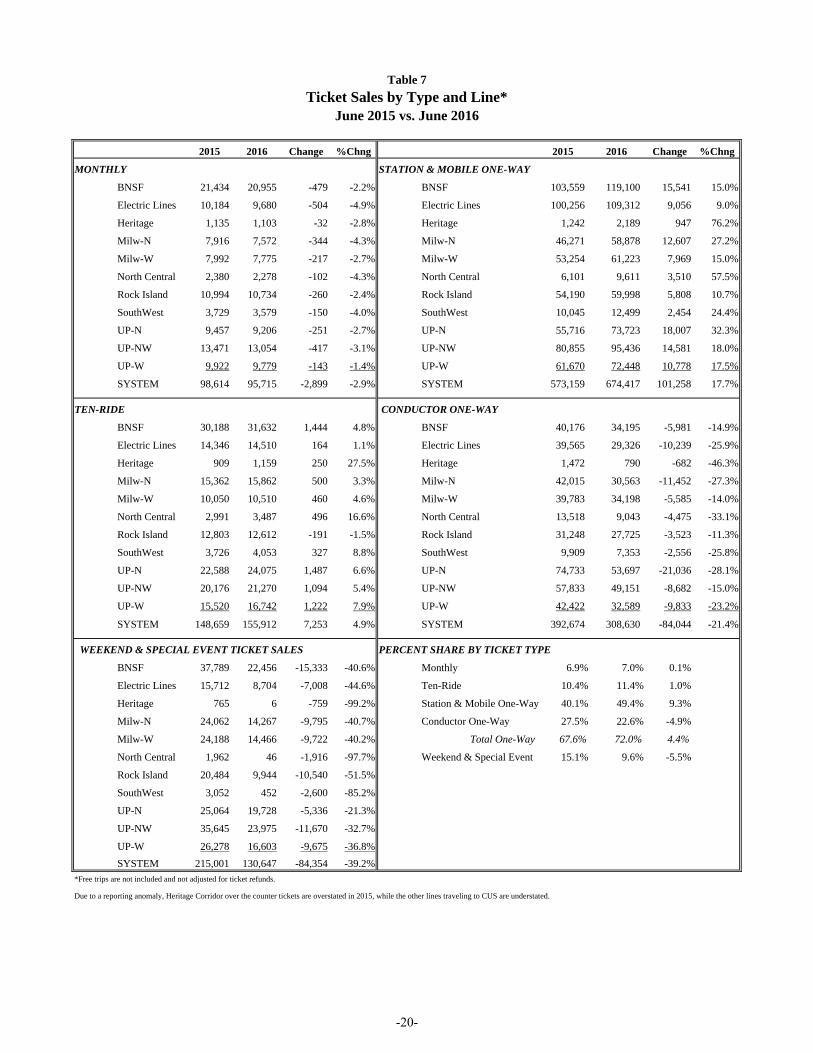
Table 7
Ticket Sales by Type and Line*June 2015 vs. June 2016
2015 2016 Change %Chng 2015 2016 Change %Chng
MONTHLY STATION & MOBILE ONE-WAY
BNSF 21,434 20,955 -479 -2.2% BNSF 103,559 119,100 15,541 15.0%
Electric Lines 10,184 9,680 -504 -4.9% Electric Lines 100,256 109,312 9,056 9.0%
Heritage 1,135 1,103 -32 -2.8% Heritage 1,242 2,189 947 76.2%
Milw-N 7,916 7,572 -344 -4.3% Milw-N 46,271 58,878 12,607 27.2%
Milw-W 7,992 7,775 -217 -2.7% Milw-W 53,254 61,223 7,969 15.0%
North Central 2,380 2,278 -102 -4.3% North Central 6,101 9,611 3,510 57.5%
Rock Island 10,994 10,734 -260 -2.4% Rock Island 54,190 59,998 5,808 10.7%
SouthWest 3,729 3,579 -150 -4.0% SouthWest 10,045 12,499 2,454 24.4%
UP-N 9,457 9,206 -251 -2.7% UP-N 55,716 73,723 18,007 32.3%
UP-NW 13,471 13,054 -417 -3.1% UP-NW 80,855 95,436 14,581 18.0%
UP-W 9,922 9,779 -143 -1.4% UP-W 61,670 72,448 10,778 17.5%
SYSTEM 98,614 95,715 -2,899 -2.9% SYSTEM 573,159 674,417 101,258 17.7%
TEN-RIDE CONDUCTOR ONE-WAY
BNSF 30,188 31,632 1,444 4.8% BNSF 40,176 34,195 -5,981 -14.9%
Electric Lines 14,346 14,510 164 1.1% Electric Lines 39,565 29,326 -10,239 -25.9%
Heritage 909 1,159 250 27.5% Heritage 1,472 790 -682 -46.3%
Milw-N 15,362 15,862 500 3.3% Milw-N 42,015 30,563 -11,452 -27.3%
Milw-W 10,050 10,510 460 4.6% Milw-W 39,783 34,198 -5,585 -14.0%
North Central 2,991 3,487 496 16.6% North Central 13,518 9,043 -4,475 -33.1%
Rock Island 12,803 12,612 -191 -1.5% Rock Island 31,248 27,725 -3,523 -11.3%
SouthWest 3,726 4,053 327 8.8% SouthWest 9,909 7,353 -2,556 -25.8%
UP-N 22,588 24,075 1,487 6.6% UP-N 74,733 53,697 -21,036 -28.1%
UP-NW 20,176 21,270 1,094 5.4% UP-NW 57,833 49,151 -8,682 -15.0%
UP-W 15,520 16,742 1,222 7.9% UP-W 42,422 32,589 -9,833 -23.2%
SYSTEM 148,659 155,912 7,253 4.9% SYSTEM 392,674 308,630 -84,044 -21.4%
WEEKEND & SPECIAL EVENT TICKET SALES PERCENT SHARE BY TICKET TYPE
BNSF 37,789 22,456 -15,333 -40.6% Monthly 6.9% 7.0% 0.1%
Electric Lines 15,712 8,704 -7,008 -44.6% Ten-Ride 10.4% 11.4% 1.0%
Heritage 765 6 -759 -99.2% Station & Mobile One-Way 40.1% 49.4% 9.3%
Milw-N 24,062 14,267 -9,795 -40.7% Conductor One-Way 27.5% 22.6% -4.9%
Milw-W 24,188 14,466 -9,722 -40.2% Total One-Way 67.6% 72.0% 4.4%
North Central 1,962 46 -1,916 -97.7% Weekend & Special Event 15.1% 9.6% -5.5%
Rock Island 20,484 9,944 -10,540 -51.5%
SouthWest 3,052 452 -2,600 -85.2%
UP-N 25,064 19,728 -5,336 -21.3%
UP-NW 35,645 23,975 -11,670 -32.7%
UP-W 26,278 16,603 -9,675 -36.8%
SYSTEM 215,001 130,647 -84,354 -39.2%
*Free trips are not included and not adjusted for ticket refunds.
Due to a reporting anomaly, Heritage Corridor over the counter tickets are overstated in 2015, while the other lines traveling to CUS are understated.
-20-
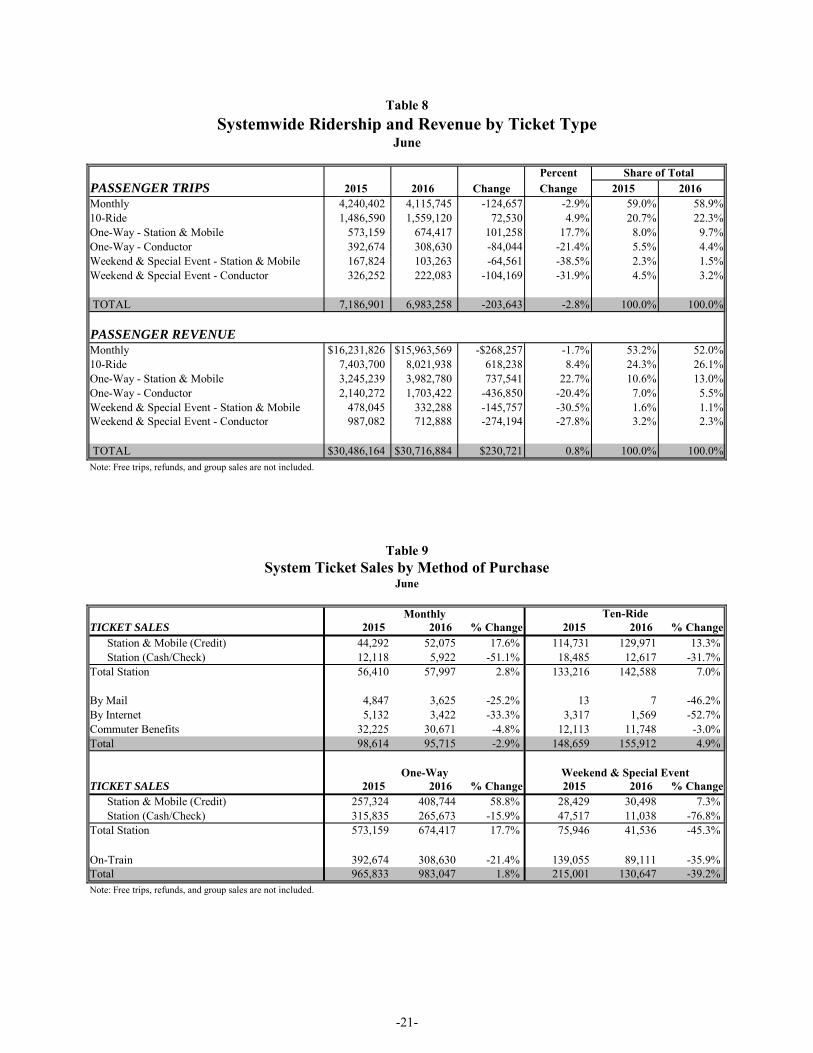
Table 8Systemwide Ridership and Revenue by Ticket Type
June
Percent Share of TotalPASSENGER TRIPS 2015 2016 Change Change 2015 2016Monthly 4,240,402 4,115,745 -124,657 -2.9% 59.0% 58.9%10-Ride 1,486,590 1,559,120 72,530 4.9% 20.7% 22.3%One-Way - Station & Mobile 573,159 674,417 101,258 17.7% 8.0% 9.7%One-Way - Conductor 392,674 308,630 -84,044 -21.4% 5.5% 4.4%Weekend & Special Event - Station & Mobile 167,824 103,263 -64,561 -38.5% 2.3% 1.5%Weekend & Special Event - Conductor 326,252 222,083 -104,169 -31.9% 4.5% 3.2%
TOTAL 7,186,901 6,983,258 -203,643 -2.8% 100.0% 100.0%
PASSENGER REVENUEMonthly $16,231,826 $15,963,569 -$268,257 -1.7% 53.2% 52.0%10-Ride 7,403,700 8,021,938 618,238 8.4% 24.3% 26.1%One-Way - Station & Mobile 3,245,239 3,982,780 737,541 22.7% 10.6% 13.0%One-Way - Conductor 2,140,272 1,703,422 -436,850 -20.4% 7.0% 5.5%Weekend & Special Event - Station & Mobile 478,045 332,288 -145,757 -30.5% 1.6% 1.1%Weekend & Special Event - Conductor 987,082 712,888 -274,194 -27.8% 3.2% 2.3%
TOTAL $30,486,164 $30,716,884 $230,721 0.8% 100.0% 100.0%Note: Free trips, refunds, and group sales are not included.
Table 9System Ticket Sales by Method of Purchase
June
Monthly Ten-RideTICKET SALES 2015 2016 % Change 2015 2016 % Change
Station & Mobile (Credit) 44,292 52,075 17.6% 114,731 129,971 13.3% Station (Cash/Check) 12,118 5,922 -51.1% 18,485 12,617 -31.7%
Total Station 56,410 57,997 2.8% 133,216 142,588 7.0%
By Mail 4,847 3,625 -25.2% 13 7 -46.2% By Internet 5,132 3,422 -33.3% 3,317 1,569 -52.7% Commuter Benefits 32,225 30,671 -4.8% 12,113 11,748 -3.0% Total 98,614 95,715 -2.9% 148,659 155,912 4.9%
One-Way Weekend & Special EventTICKET SALES 2015 2016 % Change 2015 2016 % Change
Station & Mobile (Credit) 257,324 408,744 58.8% 28,429 30,498 7.3% Station (Cash/Check) 315,835 265,673 -15.9% 47,517 11,038 -76.8%
Total Station 573,159 674,417 17.7% 75,946 41,536 -45.3%
On-Train 392,674 308,630 -21.4% 139,055 89,111 -35.9% Total 965,833 983,047 1.8% 215,001 130,647 -39.2% Note: Free trips, refunds, and group sales are not included.
-21-
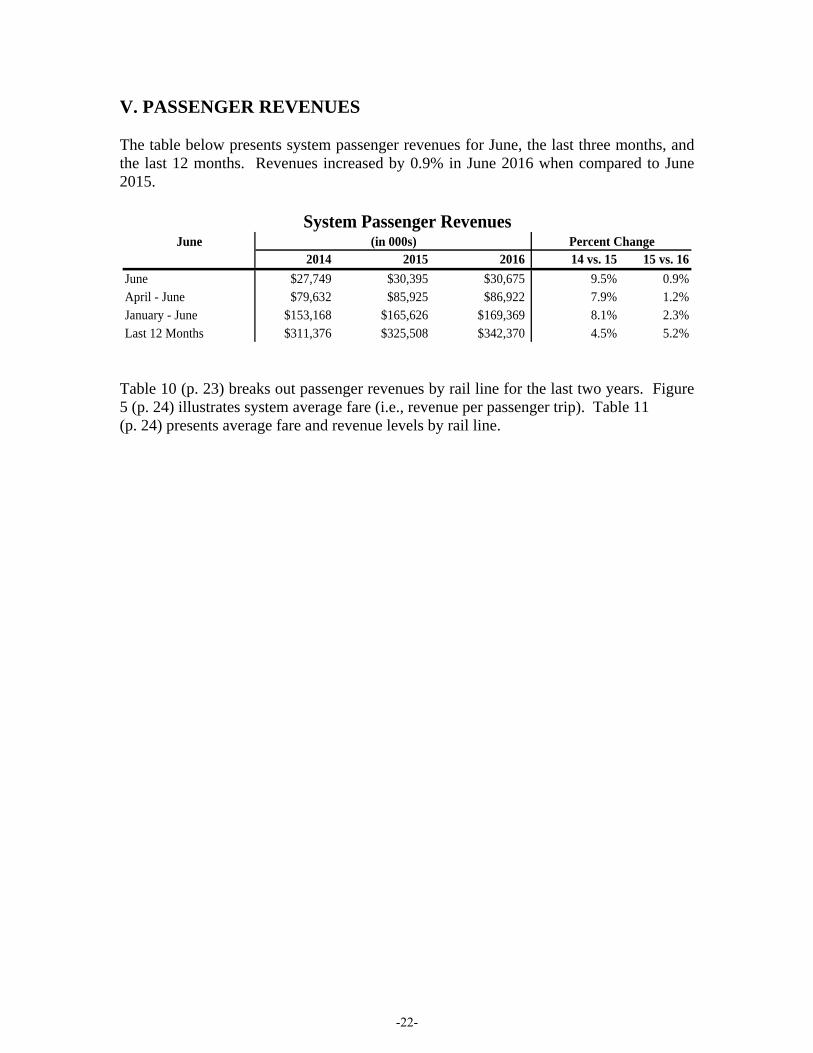
V. PASSENGER REVENUES The table below presents system passenger revenues for June, the last three months, and the last 12 months. Revenues increased by 0.9% in June 2016 when compared to June 2015.
System Passenger RevenuesJune (in 000s) Percent Change
2014 2015 2016 14 vs. 15 15 vs. 16
June $27,749 $30,395 $30,675 9.5% 0.9%April - June $79,632 $85,925 $86,922 7.9% 1.2%January - June $153,168 $165,626 $169,369 8.1% 2.3%Last 12 Months $311,376 $325,508 $342,370 4.5% 5.2%
Table 10 (p. 23) breaks out passenger revenues by rail line for the last two years. Figure 5 (p. 24) illustrates system average fare (i.e., revenue per passenger trip). Table 11 (p. 24) presents average fare and revenue levels by rail line.
-22-
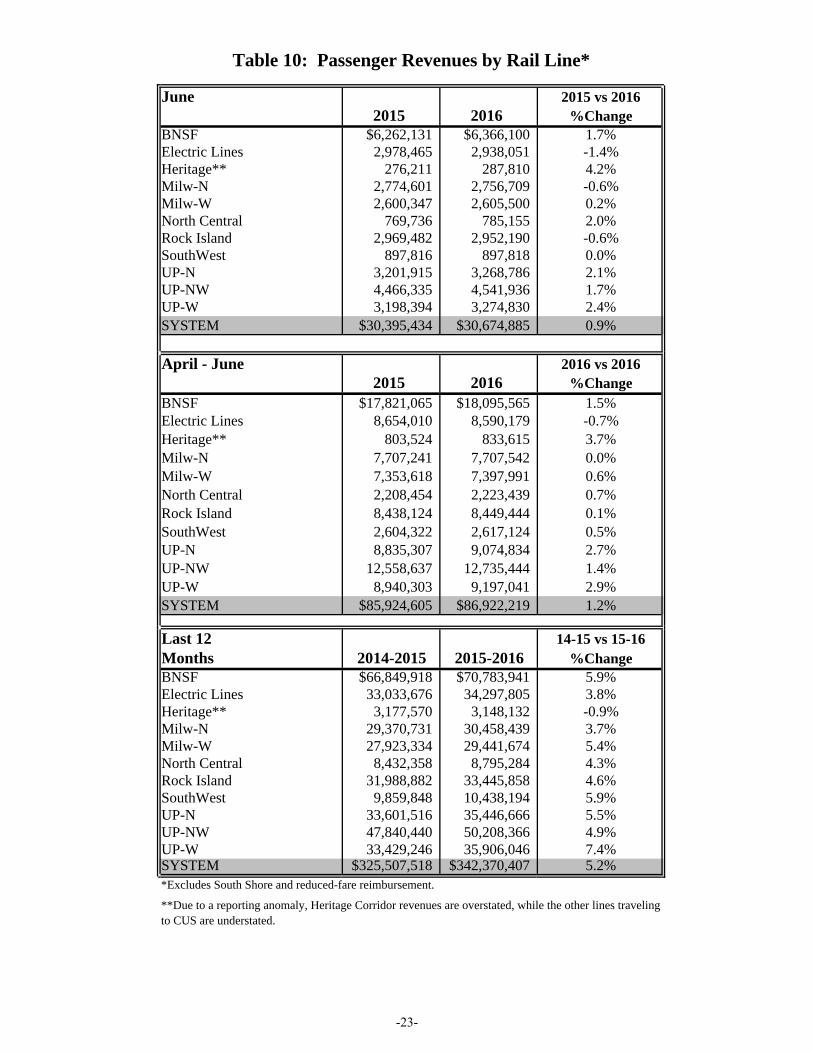
Table 10: Passenger Revenues by Rail Line*
June 2015 vs 20162015 2016 %Change
BNSF $6,262,131 $6,366,100 1.7%Electric Lines 2,978,465 2,938,051 -1.4%Heritage** 276,211 287,810 4.2%Milw-N 2,774,601 2,756,709 -0.6%Milw-W 2,600,347 2,605,500 0.2%North Central 769,736 785,155 2.0%Rock Island 2,969,482 2,952,190 -0.6%SouthWest 897,816 897,818 0.0%UP-N 3,201,915 3,268,786 2.1%UP-NW 4,466,335 4,541,936 1.7%UP-W 3,198,394 3,274,830 2.4%SYSTEM $30,395,434 $30,674,885 0.9%
April - June 2016 vs 20162015 2016 %Change
BNSF $17,821,065 $18,095,565 1.5%Electric Lines 8,654,010 8,590,179 -0.7%Heritage** 803,524 833,615 3.7%Milw-N 7,707,241 7,707,542 0.0%Milw-W 7,353,618 7,397,991 0.6%North Central 2,208,454 2,223,439 0.7%Rock Island 8,438,124 8,449,444 0.1%SouthWest 2,604,322 2,617,124 0.5%UP-N 8,835,307 9,074,834 2.7%UP-NW 12,558,637 12,735,444 1.4%UP-W 8,940,303 9,197,041 2.9%SYSTEM $85,924,605 $86,922,219 1.2%
Last 12 14-15 vs 15-16Months 2014-2015 2015-2016 %ChangeBNSF $66,849,918 $70,783,941 5.9%Electric Lines 33,033,676 34,297,805 3.8%Heritage** 3,177,570 3,148,132 -0.9%Milw-N 29,370,731 30,458,439 3.7%Milw-W 27,923,334 29,441,674 5.4%North Central 8,432,358 8,795,284 4.3%Rock Island 31,988,882 33,445,858 4.6%SouthWest 9,859,848 10,438,194 5.9%UP-N 33,601,516 35,446,666 5.5%UP-NW 47,840,440 50,208,366 4.9%UP-W 33,429,246 35,906,046 7.4%SYSTEM $325,507,518 $342,370,407 5.2%*Excludes South Shore and reduced-fare reimbursement.
**Due to a reporting anomaly, Heritage Corridor revenues are overstated, while the other lines traveling to CUS are understated.
-23-
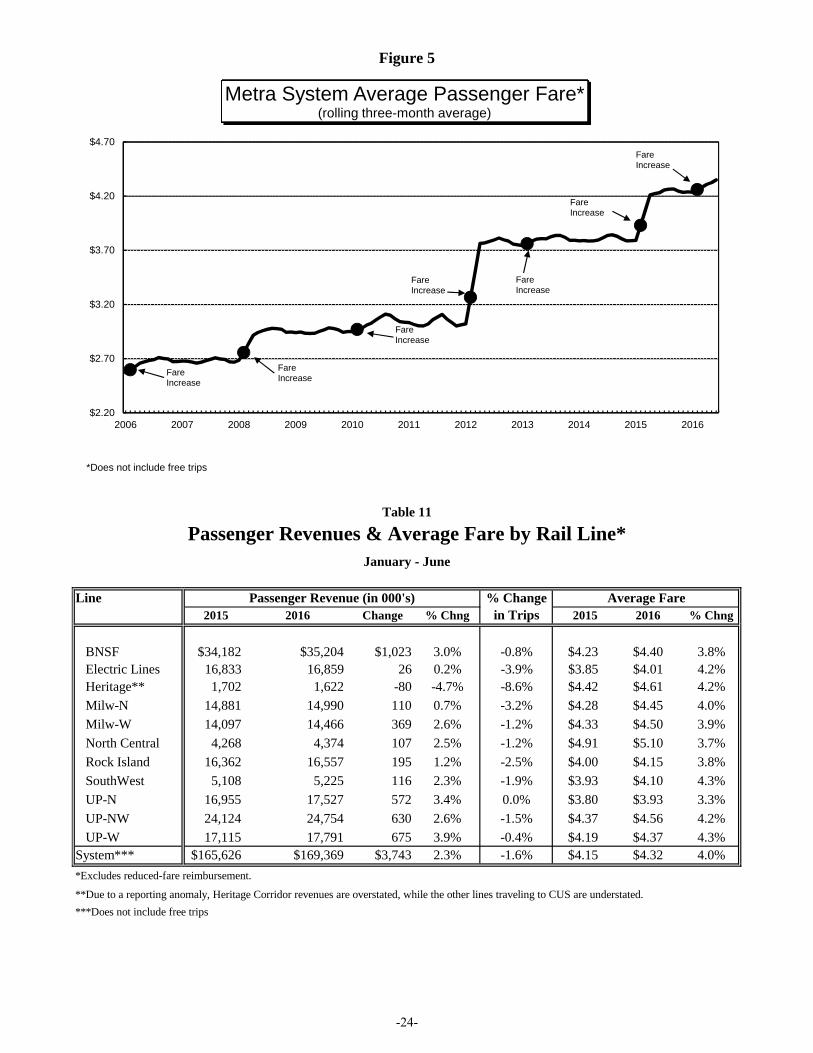
Figure 5
Table 11
Passenger Revenues & Average Fare by Rail Line*January - June
Line Passenger Revenue (in 000's) % Change Average Fare2015 2016 Change % Chng in Trips 2015 2016 % Chng
BNSF $34,182 $35,204 $1,023 3.0% -0.8% $4.23 $4.40 3.8% Electric Lines 16,833 16,859 26 0.2% -3.9% $3.85 $4.01 4.2% Heritage** 1,702 1,622 -80 -4.7% -8.6% $4.42 $4.61 4.2%
Milw-N 14,881 14,990 110 0.7% -3.2% $4.28 $4.45 4.0%
Milw-W 14,097 14,466 369 2.6% -1.2% $4.33 $4.50 3.9%
North Central 4,268 4,374 107 2.5% -1.2% $4.91 $5.10 3.7%
Rock Island 16,362 16,557 195 1.2% -2.5% $4.00 $4.15 3.8%
SouthWest 5,108 5,225 116 2.3% -1.9% $3.93 $4.10 4.3%
UP-N 16,955 17,527 572 3.4% 0.0% $3.80 $3.93 3.3%
UP-NW 24,124 24,754 630 2.6% -1.5% $4.37 $4.56 4.2%
UP-W 17,115 17,791 675 3.9% -0.4% $4.19 $4.37 4.3%System*** $165,626 $169,369 $3,743 2.3% -1.6% $4.15 $4.32 4.0%
*Excludes reduced-fare reimbursement.
**Due to a reporting anomaly, Heritage Corridor revenues are overstated, while the other lines traveling to CUS are understated.
***Does not include free trips
$2.20
$2.70
$3.20
$3.70
$4.20
$4.70
2006 2007 2008 2009 2010 2011 2012 2013 2014 2015 2016
Metra System Average Passenger Fare*(rolling three-month average)
Fare Increase
Fare Increase
Fare Increase
Fare Increase
Fare Increase
Fare Increase
Fare Increase
*Does not include free trips
-24-