Community Structure in Large Social and Information Networks Michael W. Mahoney Stanford University...
40
Community Structure in Large Community Structure in Large Social and Information Networks Social and Information Networks Michael W. Mahoney Stanford University (Joint work with Kevin Lang and Anirban Dasgupta of Yahoo, (Joint work with Kevin Lang and Anirban Dasgupta of Yahoo, and also Jure Leskovec of CMU.) and also Jure Leskovec of CMU.) (For more info, see: http://cs.stanford.edu/people/mmahoney)
-
date post
20-Dec-2015 -
Category
Documents
-
view
214 -
download
1
Transcript of Community Structure in Large Social and Information Networks Michael W. Mahoney Stanford University...

Community Structure in Large Community Structure in Large Social and Information NetworksSocial and Information Networks
Michael W. Mahoney
Stanford University
(Joint work with Kevin Lang and Anirban Dasgupta of Yahoo, (Joint work with Kevin Lang and Anirban Dasgupta of Yahoo, and also Jure Leskovec of CMU.)and also Jure Leskovec of CMU.)
(For more info, see: http://cs.stanford.edu/people/mmahoney)

Lots and lots of large data!
• DNA micro-array data and DNA SNP data
• High energy physics experimental data
• Hyper-spectral medical and astronomical image data
• Term-document data
• Medical literature analysis data
• Collaboration and citation networks
• Internet networks and web graph data
• Advertiser-bidded phrase data
• Static and dynamic social network data

Networks and networked data
Interaction graph model of networks: • Nodes represent “entities”• Edges represent “interaction” between pairs of entities
Lots of “networked” data!!• technological networks
– AS, power-grid, road networks
• biological networks– food-web, protein networks
• social networks– collaboration networks, friendships
• information networks– co-citation, blog cross-postings, advertiser-bidded phrase graphs...
• language networks– semantic networks...
• ...

Sponsored (“paid”) SearchText-based ads driven by user query

Sponsored Search Problems
Keyword-advertiser graph: – provide new ads– maximize CTR, RPS, advertiser ROI
“Community-related” problems:• Marketplace depth broadening:
find new advertisers for a particular query/submarket
• Query recommender system: suggest to advertisers new queries that have high probability of
clicks
• Contextual query broadening: broaden the user's query using other context information

Micro-markets in sponsored search
10 million keywords
1.4
Mill
ion
Adv
ertis
ers
Gambling
Sports
Sports Gambling
Movies Media
Sport videos
What is the CTR and advertiser ROI of sports gambling
keywords?
Goal: Find isolated markets/clusters with sufficient money/clicks with sufficient coherence. Ques: Is this even possible?

What do these networks “look” like?

Questions of interest ...
What are degree distributions, clustering coefficients, diameters, etc.?
Heavy-tailed, small-world, expander, geometry+rewiring, local-global decompositions, ...
Are there natural clusters, communities, partitions, etc.?
Concept-based clusters, link-based clusters, density-based clusters, ...
(e.g., isolated micro-markets with sufficient money/clicks with sufficient coherence)
How do networks grow, evolve, respond to perturbations, etc.?
Preferential attachment, copying, HOT, shrinking diameters, ...
How do dynamic processes - search, diffusion, etc. - behave on networks?
Decentralized search, undirected diffusion, cascading epidemics, ...
How best to do learning, e.g., classification, regression, ranking, etc.?
Information retrieval, machine learning, ...
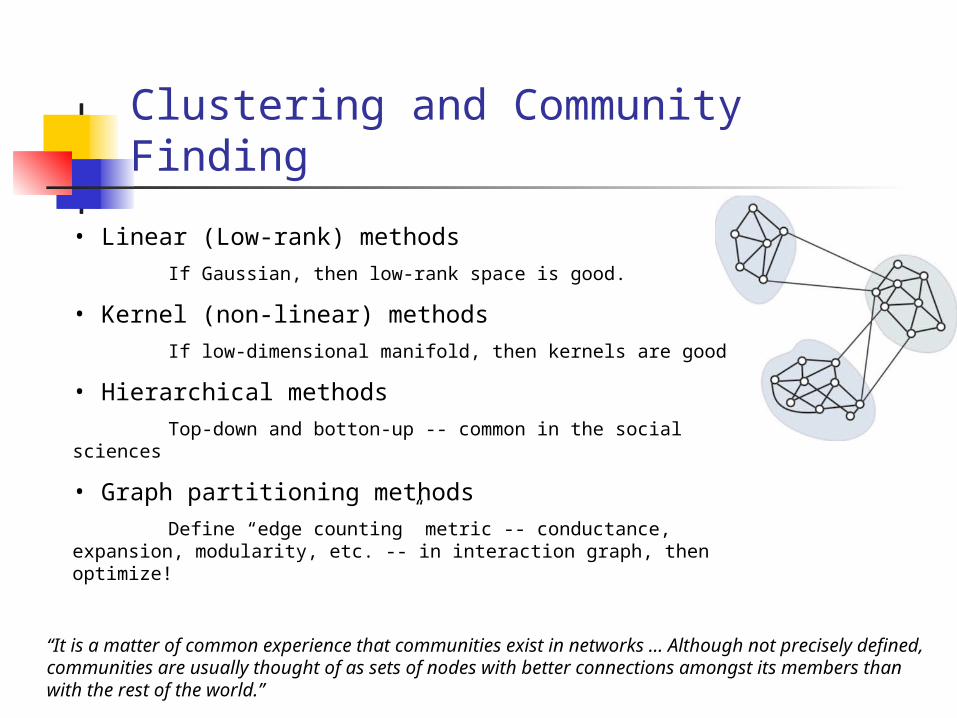
Clustering and Community Finding
• Linear (Low-rank) methods
If Gaussian, then low-rank space is good.
• Kernel (non-linear) methods
If low-dimensional manifold, then kernels are good
• Hierarchical methods
Top-down and botton-up -- common in the social sciences
• Graph partitioning methods
Define “edge counting” metric -- conductance, expansion, modularity, etc. -- in interaction graph, then optimize!
“It is a matter of common experience that communities exist in networks ... Although not precisely defined, communities are usually thought of as sets of nodes with better connections amongst its members than with the rest of the world.”
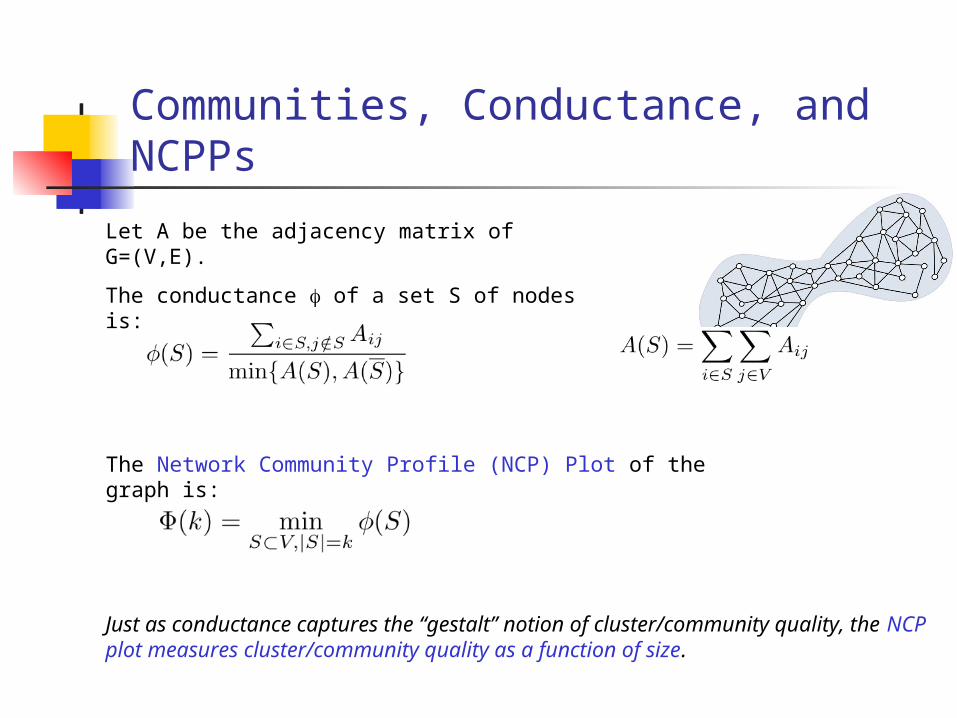
Communities, Conductance, and NCPPs
Let A be the adjacency matrix of G=(V,E).
The conductance of a set S of nodes is:
The Network Community Profile (NCP) Plot of the graph is:
Just as conductance captures the “gestalt” notion of cluster/community quality, the NCP plot measures cluster/community quality as a function of size.

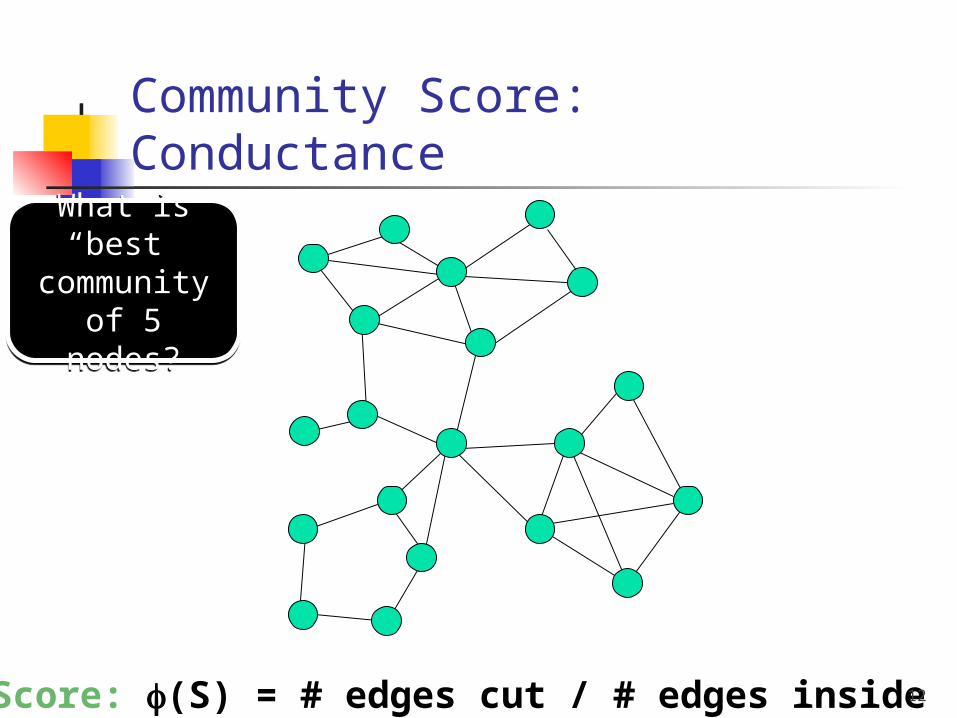
Community Score: ConductanceS
S’
11
How community like is a set of nodes?
Need a natural intuitive measure:
Conductance (normalized cut)
(S) = # edges cut / # edges inside
Small (S) corresponds to more community-like sets of nodes
Community Score: Conductance
Score: (S) = # edges cut / # edges inside
What is “best”
community of 5 nodes?
What is “best”
community of 5 nodes?
12

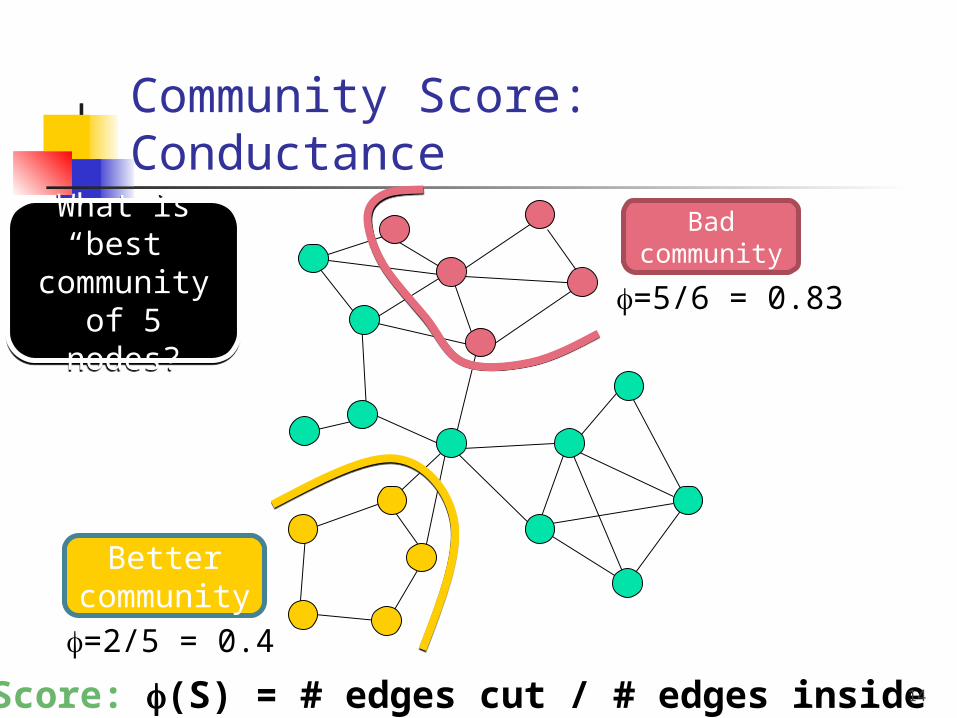
Community Score: Conductance
Score: (S) = # edges cut / # edges inside
Bad communit
y=5/6 = 0.83
What is “best”
community of 5 nodes?
What is “best”
community of 5 nodes?
13
Community Score: Conductance
Score: (S) = # edges cut / # edges inside
Better communit
y
=5/6 = 0.83
Bad communit
y
=2/5 = 0.4
What is “best”
community of 5 nodes?
What is “best”
community of 5 nodes?
14

Community Score: Conductance
Score: (S) = # edges cut / # edges inside
Better communit
y
=5/6 = 0.83
Bad communit
y
=2/5 = 0.4
Best communit
y=2/8 = 0.25
What is “best”
community of 5 nodes?
What is “best”
community of 5 nodes?
15

Network Community Profile Plot We define:
Network community profile (NCP) plotPlot the score of best community of size k
• Search over all subsets of size k and find best: (k=5) = 0.25
• NCP plot is intractable to compute• Use approximation algorithms
16
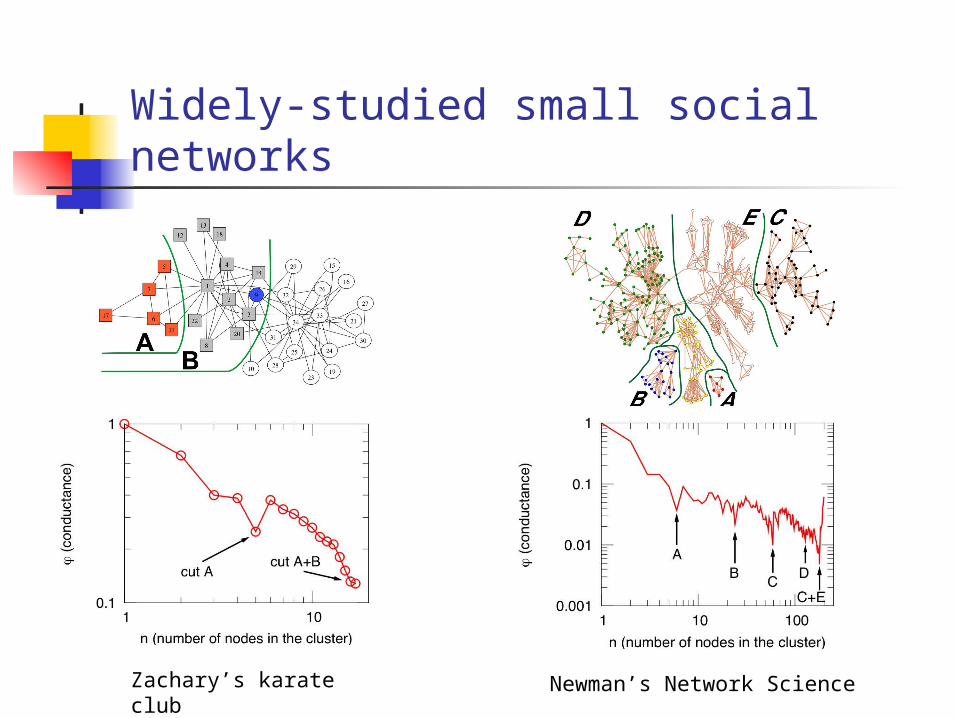
Widely-studied small social networks
Zachary’s karate club Newman’s Network Science
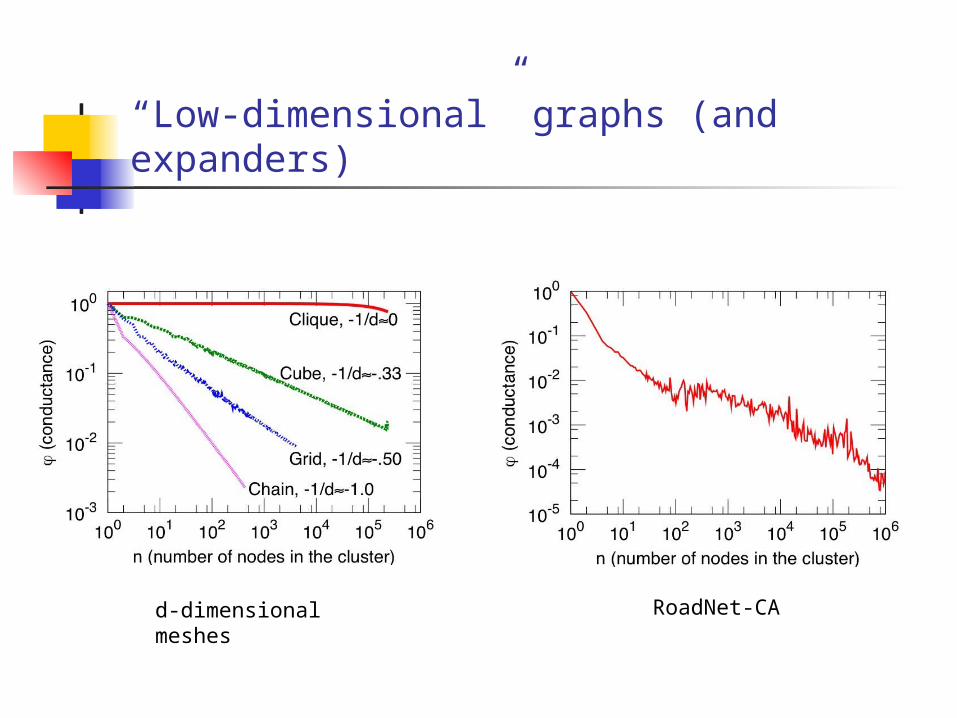
“Low-dimensional” graphs (and expanders)
d-dimensional meshes RoadNet-CA

What do large networks look like?
Downward sloping NCPP
small social networks (validation)
“low-dimensional” networks (intuition)
hierarchical networks (model building)
Natural interpretation in terms of isoperimetry
implicit in modeling with low-dimensional spaces, manifolds, k-means, etc.
Large social/information networks are very very different
We examined more than 70 large social and information networks
We developed principled methods to interrogate large networks
Previous community work: on small social networks (hundreds, thousands)
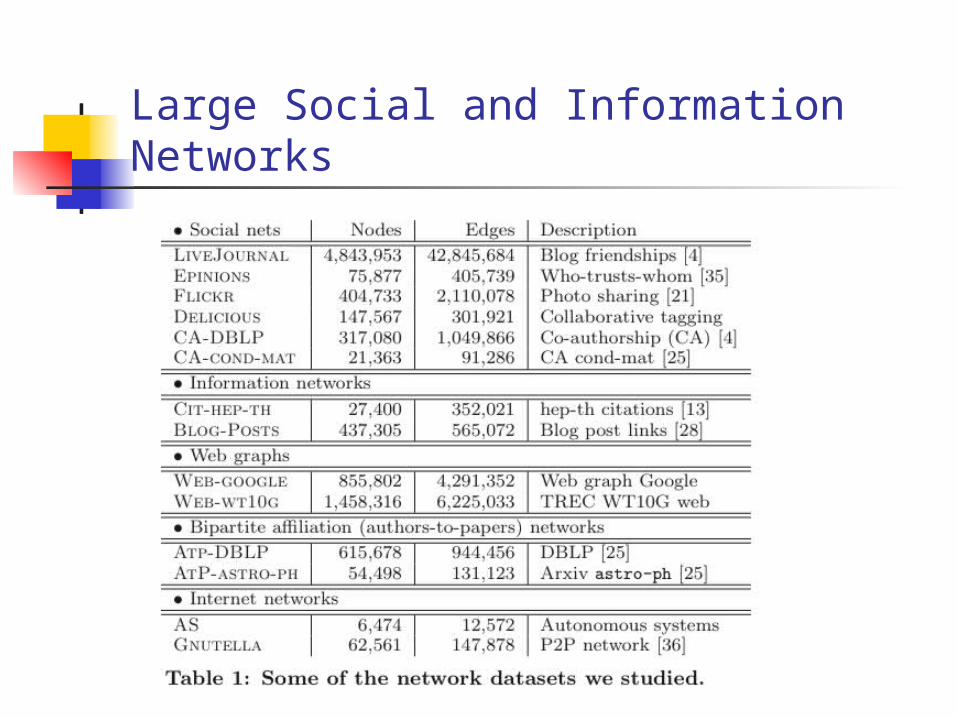
Large Social and Information Networks

Probing Large Networks with Approximation Algorithms
Idea: Use approximation algorithms for NP-hard graph partitioning problems as experimental probes of network structure.
Spectral - (quadratic approx) - confuses “long paths” with “deep cuts”
Multi-commodity flow - (log(n) approx) - difficulty with expanders
SDP - (sqrt(log(n)) approx) - best in theory
Metis - (multi-resolution for mesh-like graphs) - common in practice
X+MQI - post-processing step on, e.g., Spectral of Metis
Metis+MQI - best conductance (empirically)
Local Spectral - connected and tighter sets (empirically, regularized communities!)
We are not interested in partitions per se, but in probing network structure.
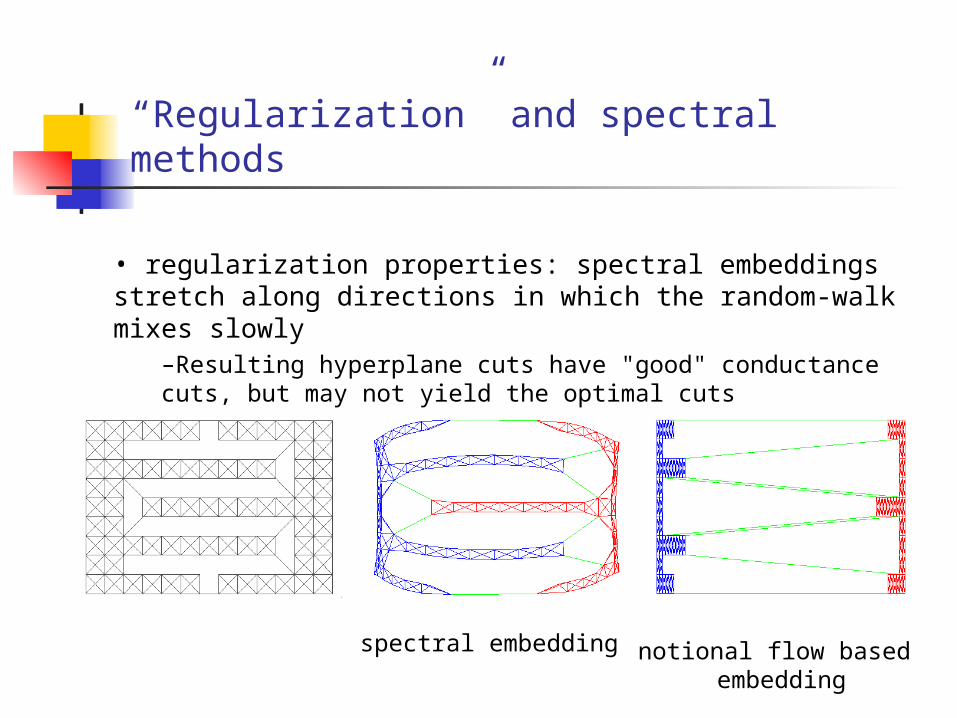
“Regularization” and spectral methods
• regularization properties: spectral embeddings stretch along directions in which the random-walk mixes slowly
–Resulting hyperplane cuts have "good" conductance cuts, but may not yield the optimal cuts
spectral embedding notional flow based embedding

Typical example of our findingsGeneral relativity collaboration network
(4,158 nodes, 13,422 edges)
23Community size
Com
munit
y s
core

Large Social and Information Networks
LiveJournal Epinions
Focus on the red curves (local spectral algorithm) - blue (Metis+Flow), green (Bag of whiskers), and black (randomly rewired network) for consistency and cross-validation.

More large networks
Cit-Hep-Th Web-Google
AtP-DBLP Gnutella

NCPP: LiveJournal (N=5M, E=43M)C
om
mu
nit
y s
core
Community size
Better and better
communitiesBest communities get
worse and worse
Best community has ≈100
nodes
26
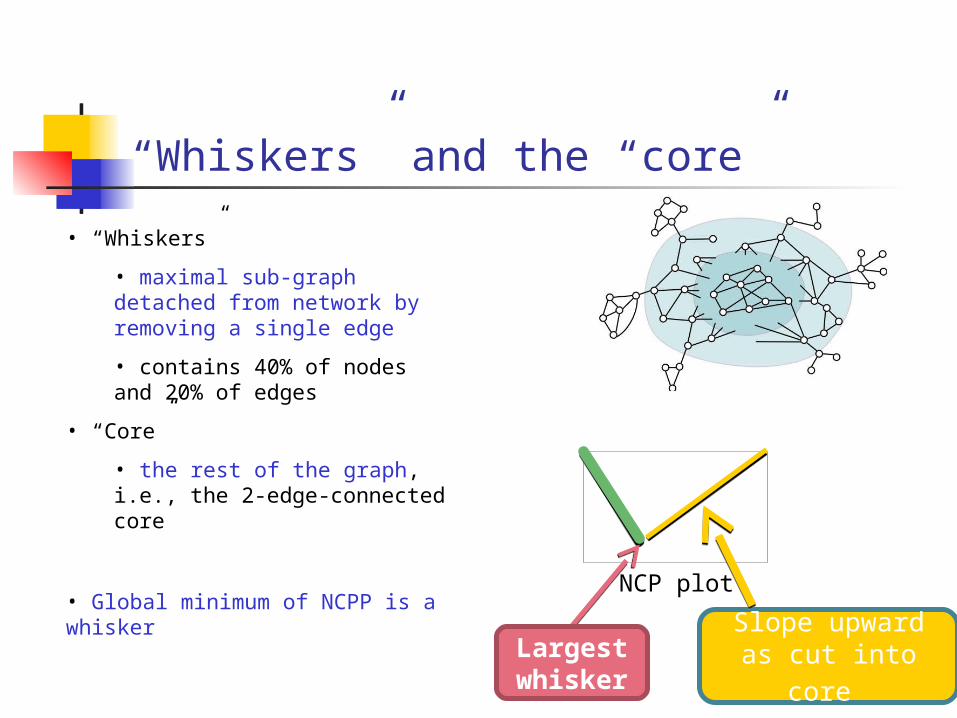
“Whiskers” and the “core”
• “Whiskers”
• maximal sub-graph detached from network by removing a single edge
• contains 40% of nodes and 20% of edges
• “Core”
• the rest of the graph, i.e., the 2-edge-connected core
• Global minimum of NCPP is a whisker
NCP plot
Largest whisker
Slope upward as cut into core

Examples of whiskers
Ten largest “whiskers” from CA-cond-mat.

What if the “whiskers” are removed?
LiveJournal Epinions
Then the lowest conductance sets - the “best” communities - are “2-whiskers.”
(So, the “core” peels apart like an onion.)
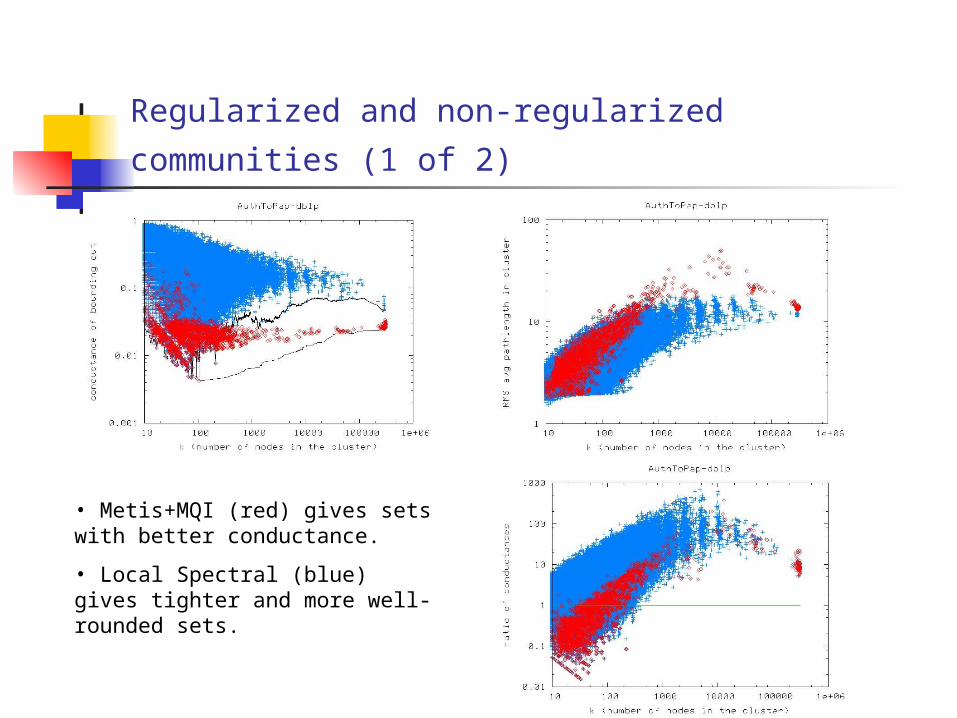
Regularized and non-regularized communities (1
of 2)
• Metis+MQI (red) gives sets with better conductance.
• Local Spectral (blue) gives tighter and more well-rounded sets.
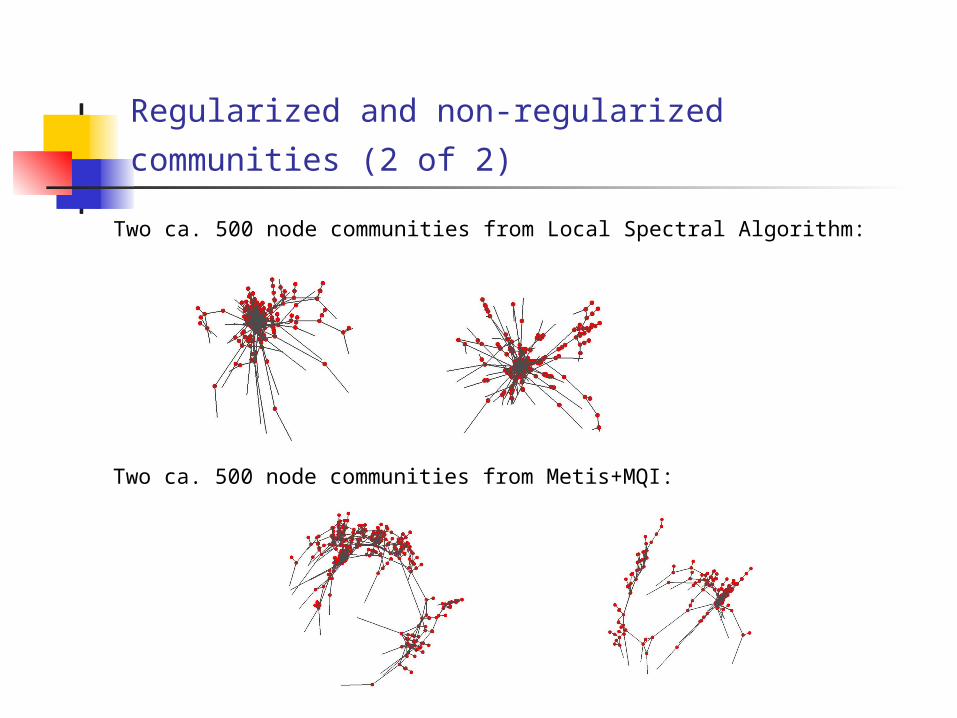
Regularized and non-regularized communities (2
of 2)
Two ca. 500 node communities from Local Spectral Algorithm:
Two ca. 500 node communities from Metis+MQI:
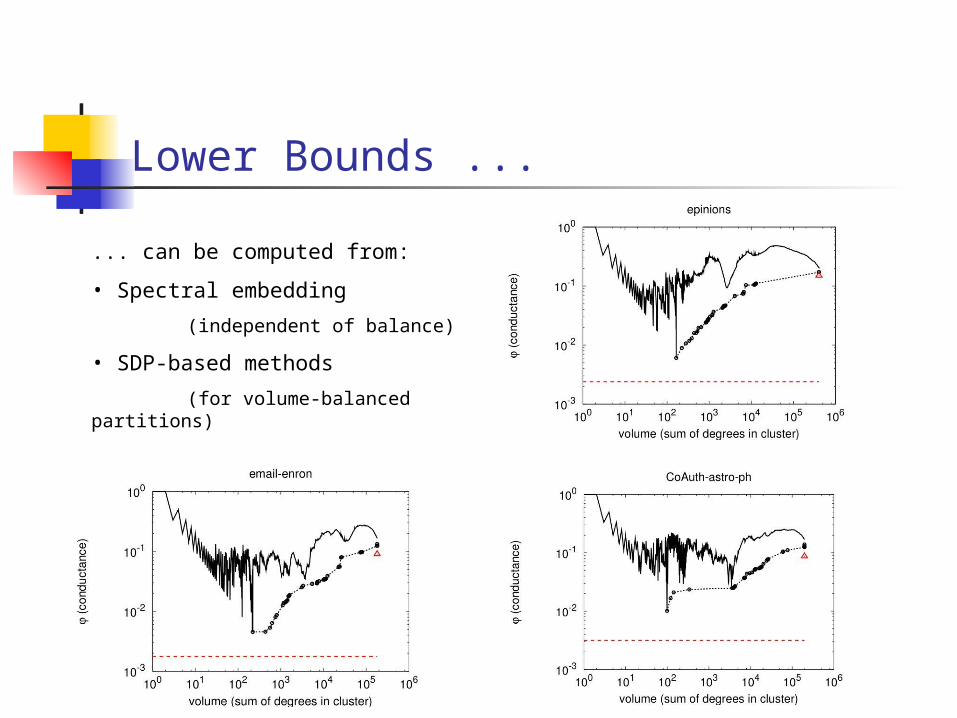
Lower Bounds ...
... can be computed from:
• Spectral embedding
(independent of balance)
• SDP-based methods
(for volume-balanced partitions)

Lots of Generative Models
• Preferential attachment - add edges to high-degree nodes(Albert and Barabasi 99, etc.)
• Copying model - add edges to neighbors of a seed node(Kumar et al. 00, etc.)
• Hierarchical methods - add edges based on distance in hierarchy(Ravasz and Barabasi 02, etc.)
• Geometric PA and Small worlds - add edges to geometric scaffolding(Flaxman et al. 04; Watts and Strogatz 98; etc.)
• Random/configuration models - add edges randomly(Molloy and Reed 98; Chung and Lu 06; etc.)
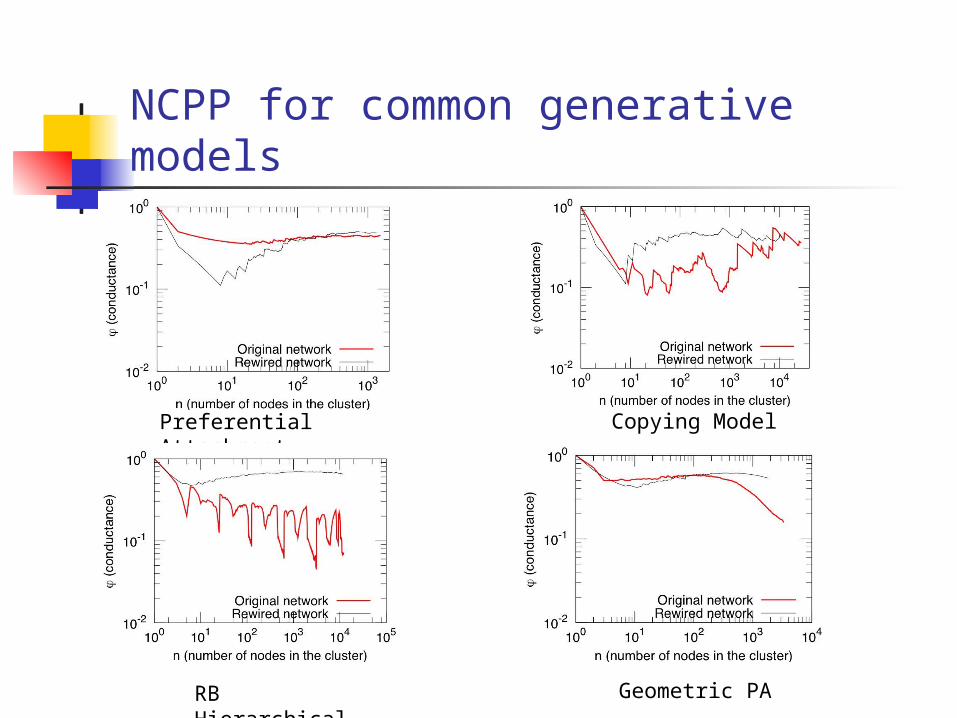
NCPP for common generative models
Preferential Attachment Copying Model
RB Hierarchical Geometric PA
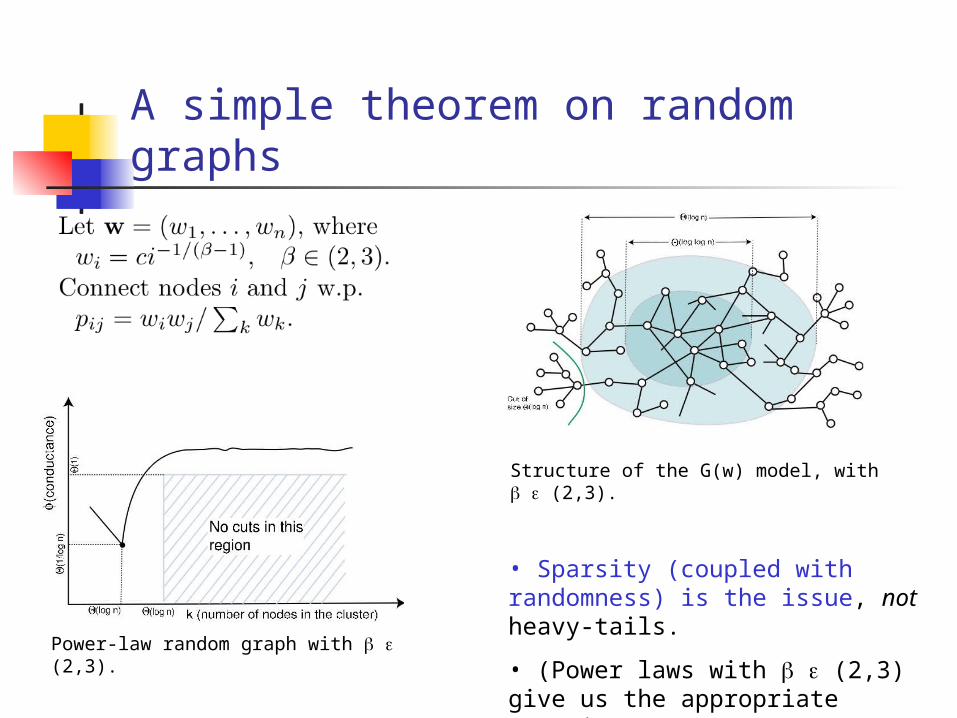
A simple theorem on random graphs
Power-law random graph with (2,3).
Structure of the G(w) model, with (2,3).
• Sparsity (coupled with randomness) is the issue, not heavy-tails.
• (Power laws with (2,3) give us the appropriate sparsity.)
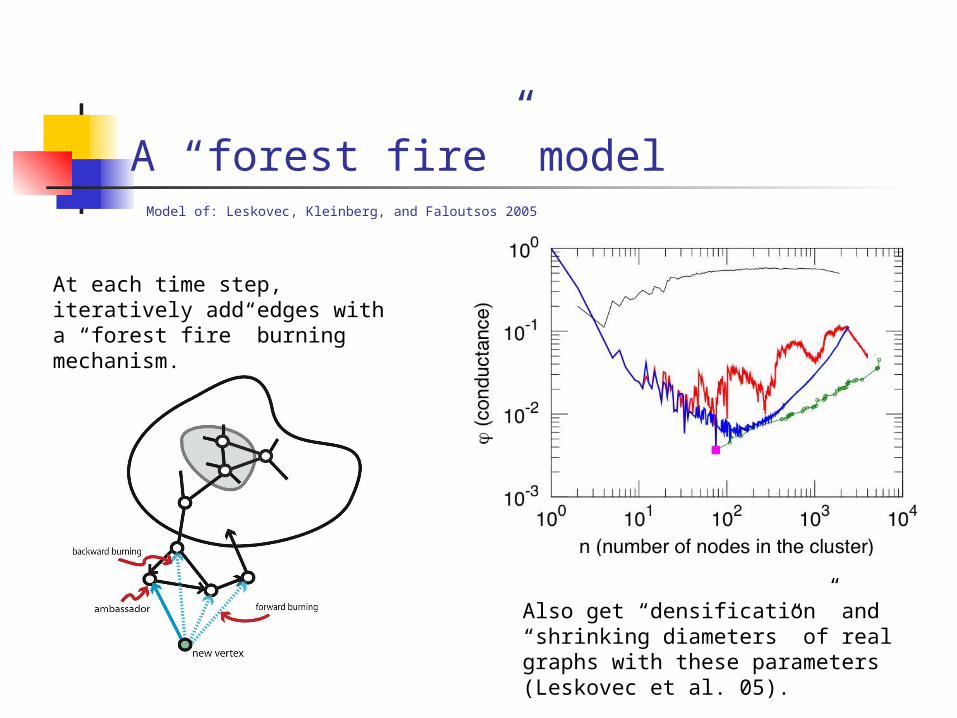
A “forest fire” model
At each time step, iteratively add edges with a “forest fire” burning mechanism.
Model of: Leskovec, Kleinberg, and Faloutsos 2005
Also get “densification” and “shrinking diameters” of real graphs with these parameters (Leskovec et al. 05).

Comparison with “Ground truth” (1 of 2)
Networks with “ground truth” communities:
• LiveJournal12: • users create and explicitly join on-line groups
• CA-DBLP: • publication venues can be viewed as communities
• AmazonAllProd: • each item belongs to one or more hierarchically organized categories, as defined by Amazon
• AtM-IMDB: • countries of production and languages may be viewed as communities (thus every movie belongs to exactly one community and actors belongs to all communities to which movies in which they appeared belong)
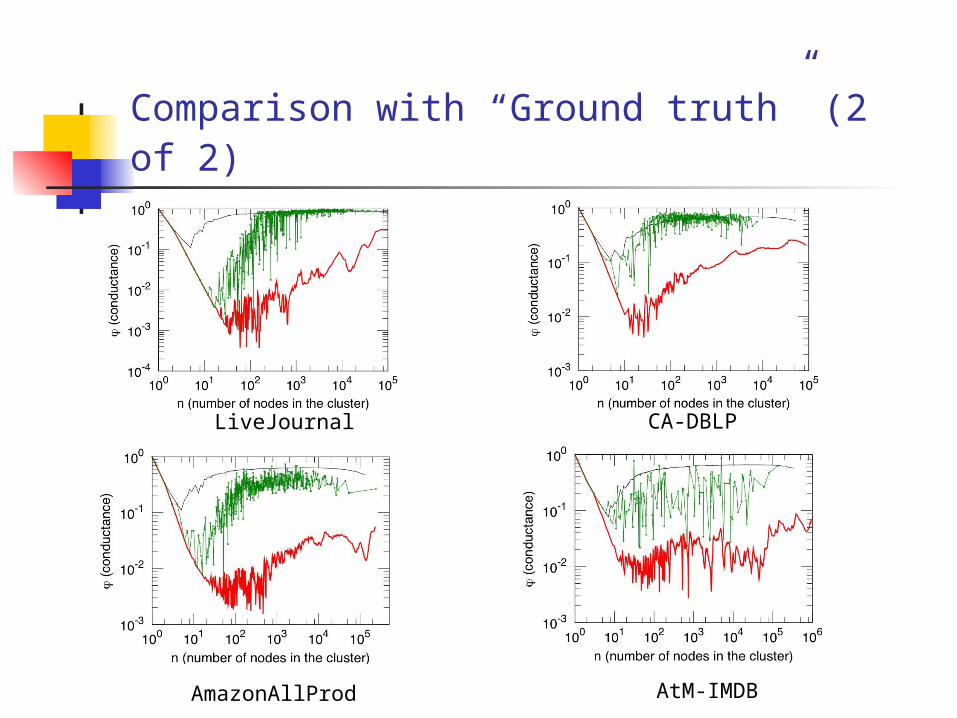
Comparison with “Ground truth” (2 of 2)
LiveJournal CA-DBLP
AmazonAllProd AtM-IMDB
Miscellaneous thoughts ...
Sociological work on community size (Dunbar and Allen)• 150 individuals is maximum community size• Military companies, on-line communities, divisions of corporations all ≤ 150
Common bond vs. common identity theory• Common bond - people are attached to individual community members• Common identity - people are attached to the group as a whole
What edges “mean” and community identification • social networks - reasons an individual adds a link to a friend very diverse• citation networks - links are more “expensive” and semantically uniform.
Conclusions
Approximation algorithms as experimental probes!
• Hard-to-cut onion-like core with more structure than random
• Small well-isolated communities gradually blend into the core
Community structure in large networks is qualitatively different!
• Agree with previous results on small networks
• Agree with sociological interpretation (Dunbar’s 150 and bond vs. identity)!
Common generative models don’t capture community phenomenon!
• Graph locality - important for realistic network generation
• Local regularization - important due to sparsity