Community structure and composition in response to climate ...
14
Community structure and composition in response to climate change in a temperate steppe HAIJUN YANG * w , MINGYU WU *, WEIXING LIU *, ZHE ZHANG * w , NAILI ZHANG * and SHIQIANG WAN * z *State Key Laboratory of Vegetation Environmental Change, Institute of Botany, Chinese Academy of Sciences, Xiangshan, Beijing 100093, China, w Graduate School of Chinese Academy of Sciences, Yuquanlu, Beijing 100049, China, z Key Laboratory of Plant Stress Biology, College of Life Sciences, Henan University, Kaifeng, Henan 475004, China Abstract Climate change would have profound influences on community structure and composition, and subsequently has impacts on ecosystem functioning and feedback to climate change. A field experiment with increased temperature and precipitation was conducted to examine effects of experimental warming, increased precipitation and their interactions on community structure and composition in a temperate steppe in northern China since April 2005. Increased precipitation significantly stimulated species richness and coverage of plant community. In contrast, experimental warming markedly reduced species richness of grasses and community coverage. Species richness was positively dependent upon soil moisture (SM) across all treatments and years. Redundancy analysis (RDA) illustrated that SM dominated the response of community composition to climate change at the individual level, suggesting indirect effects of climate change on plant community composition via altering water availability. In addition, species interaction also mediated the responses of functional group coverage to increased precipitation and temperature. Our observations revealed that both abiotic (soil water availability) and biotic (interspecific interactions) factors play important roles in regulating plant community structure and composition in response to climate change in the semiarid steppe. Therefore these factors should be incorporated in model predicting terrestrial vegetation dynamics under climate change. Keywords: diversity, grassland, plant functional group, temperature, water availability Received 12 January 2010; revised version received 11 April 2010 and accepted 5 May 2010 Introduction Global climate warming resulting from anthropogenic activities has been observed, particularly in recent dec- ades (IPCC, 2007). It is predicted that there will be concomitant shift in precipitation regimes at the global and regional scales with increasing occurrences of ex- treme rainfall events (Dore, 2005; IPCC, 2007). Given that both temperature and water availability are im- portant abiotic factors to affect plant growth, climate change influences plant growth, alters interspecific re- lationships (Klanderud & Totland, 2005, 2007; Niu & Wan, 2008), and subsequently impacts plant community structure and composition (Harte & Shaw, 1995; Knapp et al., 2002; Klein et al., 2004). Changes in community structure and composition are likely to have consequent influences on ecosystem functioning (Hooper & Vitou- sek, 1997; Tilman et al., 1997) and potential feedback to climate change (Liston et al., 2002; Chapin et al., 2005). Thus, better understanding of plant community struc- ture and composition in response to climate change is crucial for projection of the impacts of climate change on terrestrial ecosystems. A growing body of evidence from model projections (Thuiller et al., 2005; Botkin et al., 2007), long-term observations (Chapin et al., 1995), natural gradients (Pen ˜ uelas et al., 2007), meta-analyses (Walker et al., 2006) and manipulative experiments (Chapin et al., 1995; Klein et al., 2004; Keryn & Mark, 2009) has demonstrated that climate warming has the potential to alter plant community structure and composition. Warming effects may vary with plant species (Bates et al., 2005; Prieto et al., 2009), functional groups, com- munities and sites (Walker et al., 2006; Jagerbrand et al., 2009) with general enhancement of shrubs and grasses (GR) and decrease in cryptogam coverage (Chapin et al., 1995; Walker et al., 2006). The different responses of plant species and/or functional groups can alter species competitive interactions and dominance hierarchies (Harte & Shaw, 1995; Klanderud & Totland, 2005; Niu & Wan, 2008), leading to increasing extinction risk of some plant species. In fact, rapid losses of plant species under climate warming have widely been observed in Correspondence: Shiqiang Wan, tel. 1 86 10 6283 6512, fax 1 86 10 8259 6146, e-mail: [email protected] Global Change Biology (2011) 17, 452–465, doi: 10.1111/j.1365-2486.2010.02253.x 452 r 2010 Blackwell Publishing Ltd
Transcript of Community structure and composition in response to climate ...
Community structure and composition in response toclimate change in a temperate steppeH A I J U N YA N G * w , M I N G Y U W U *, W E I X I N G L I U *, Z H E Z H A N G * w , N A I L I Z H A N G * and
S H I Q I A N G WA N * z
*State Key Laboratory of Vegetation Environmental Change, Institute of Botany, Chinese Academy of Sciences, Xiangshan, Beijing
100093, China, wGraduate School of Chinese Academy of Sciences, Yuquanlu, Beijing 100049, China, zKey Laboratory of Plant Stress
Biology, College of Life Sciences, Henan University, Kaifeng, Henan 475004, China
Abstract
Climate change would have profound influences on community structure and composition, and subsequently has
impacts on ecosystem functioning and feedback to climate change. A field experiment with increased temperature
and precipitation was conducted to examine effects of experimental warming, increased precipitation and their
interactions on community structure and composition in a temperate steppe in northern China since April 2005.
Increased precipitation significantly stimulated species richness and coverage of plant community. In contrast,
experimental warming markedly reduced species richness of grasses and community coverage. Species richness was
positively dependent upon soil moisture (SM) across all treatments and years. Redundancy analysis (RDA) illustrated
that SM dominated the response of community composition to climate change at the individual level, suggesting
indirect effects of climate change on plant community composition via altering water availability. In addition, species
interaction also mediated the responses of functional group coverage to increased precipitation and temperature. Our
observations revealed that both abiotic (soil water availability) and biotic (interspecific interactions) factors play
important roles in regulating plant community structure and composition in response to climate change in the
semiarid steppe. Therefore these factors should be incorporated in model predicting terrestrial vegetation dynamics
under climate change.
Keywords: diversity, grassland, plant functional group, temperature, water availability
Received 12 January 2010; revised version received 11 April 2010 and accepted 5 May 2010
Introduction
Global climate warming resulting from anthropogenic
activities has been observed, particularly in recent dec-
ades (IPCC, 2007). It is predicted that there will be
concomitant shift in precipitation regimes at the global
and regional scales with increasing occurrences of ex-
treme rainfall events (Dore, 2005; IPCC, 2007). Given
that both temperature and water availability are im-
portant abiotic factors to affect plant growth, climate
change influences plant growth, alters interspecific re-
lationships (Klanderud & Totland, 2005, 2007; Niu &
Wan, 2008), and subsequently impacts plant community
structure and composition (Harte & Shaw, 1995; Knapp
et al., 2002; Klein et al., 2004). Changes in community
structure and composition are likely to have consequent
influences on ecosystem functioning (Hooper & Vitou-
sek, 1997; Tilman et al., 1997) and potential feedback to
climate change (Liston et al., 2002; Chapin et al., 2005).
Thus, better understanding of plant community struc-
ture and composition in response to climate change is
crucial for projection of the impacts of climate change
on terrestrial ecosystems.
A growing body of evidence from model projections
(Thuiller et al., 2005; Botkin et al., 2007), long-term
observations (Chapin et al., 1995), natural gradients
(Penuelas et al., 2007), meta-analyses (Walker et al.,
2006) and manipulative experiments (Chapin et al.,
1995; Klein et al., 2004; Keryn & Mark, 2009) has
demonstrated that climate warming has the potential
to alter plant community structure and composition.
Warming effects may vary with plant species (Bates
et al., 2005; Prieto et al., 2009), functional groups, com-
munities and sites (Walker et al., 2006; Jagerbrand et al.,
2009) with general enhancement of shrubs and grasses
(GR) and decrease in cryptogam coverage (Chapin et al.,
1995; Walker et al., 2006). The different responses of
plant species and/or functional groups can alter species
competitive interactions and dominance hierarchies
(Harte & Shaw, 1995; Klanderud & Totland, 2005; Niu
& Wan, 2008), leading to increasing extinction risk of
some plant species. In fact, rapid losses of plant species
under climate warming have widely been observed inCorrespondence: Shiqiang Wan, tel. 1 86 10 6283 6512, fax 1 86 10
8259 6146, e-mail: [email protected]
Global Change Biology (2011) 17, 452–465, doi: 10.1111/j.1365-2486.2010.02253.x
452 r 2010 Blackwell Publishing Ltd
the Tibetan Plateau (Klein et al., 2004), salt marshes
(Keryn & Mark, 2009) and Mediterranean shrubland
(Prieto et al., 2009). Reduced species richness in high
elevation ecosystem has been mainly ascribed to litter
accumulation and suppression of plant growth due to
heat stress (Klein et al., 2004). On the other hand,
elevated temperature can indirectly impact plant com-
munity via altering species interactions (Niu & Wan,
2008) and belowground resources, such as water avail-
ability. For example, climate change indirectly affects
subdominant species via altering competitive interac-
tions with the dominant species (Engel et al., 2009;
Kardol et al., 2010). In addition, warming can decrease
soil water content and suppress plant growth by stimu-
lating evapotranspiration (Niu et al., 2008) and impact-
ing energy balance at the soil surface. Manipulative
experiments have demonstrated water availability
plays an important role in regulating the response of
community composition to warming (Sternberg et al.,
1999; Walker et al., 2006). Hence, elucidating the direct
and indirect effects of warming on community will
facilitate the mechanistic understanding of plant com-
munity structure and composition in response to cli-
mate warming, especially in semiarid region where
water is limited.
Alteration of precipitation regimes in concurrent with
climate warming could also have profound influences
on plant community structure and composition (Stern-
berg et al., 1999). Across a geographic gradient, plant
species richness is positively dependent upon precipi-
tation (Adler & Levine, 2007). Compositional change of
plant community through time also increases with
precipitation in Serengeti grasslands (Anderson, 2008).
Manipulative experiments have shown that increased
precipitation stimulates vegetation coverage and spe-
cies richness in a calcareous grassland (Sternberg et al.,
1999) and enhances diversity in an annual grassland
(Zavaleta et al., 2003). Given the species-specific water
sensitivity of plant growth, water availability may in-
directly affect plant community structure and composi-
tion through changing interspecific relationships, which
could regulate the response of plant community to
climate change (Klanderud & Totland, 2007). In addi-
tion, species interactions among different trophic
groups can also strongly impact the response of plant
community to changing climate, overturning direct
effects of changing climate on grassland within 5 years
(Suttle et al., 2007). However, little attention has been
paid to species interactions in both experimental studies
and model projections (Klanderud & Totland, 2005).
Distinguishing between the effects of abiotic and biotic
factors on plant community would help us seek for the
underlying mechanism for terrestrial vegetation in re-
sponse to changing precipitation regimes. Moreover,
concurrent changes in global temperature and precipi-
tation regimes may have potentially interactive effects
on plant community. A modeling study has revealed
strong dependence of species loss and turnover upon
temperature and moisture conditions (Thuiller et al.,
2005). The possible interaction between climate warm-
ing and changing precipitation regimes in regulating
plant community structure and composition (Bates
et al., 2005) may pose great challenges to simulation
and projection of future dynamics of terrestrial bio-
sphere under climate change.
Located in the eastern part of the Eurasian grassland
biome, the semiarid steppe in northern China with an
area of 313 million hm2 accounts for 78% of the total
grassland area in China, and plays an important role in
supporting diverse species of plants and animals and
serving the ecological environment and the develop-
ment of socio-economics of the region (Kang et al.,
2007). In addition, substantial changes in temperature
and precipitation in this region have occurred (Zhai
et al., 1999), and this ecosystem is sensitive to climate
change (Christensen et al., 2004; Niu et al., 2008;
Liu et al., 2009). In order to examine the potential effects
of climate warming and increased precipitation on
plant community structure and composition, a field
experiment with increased temperature and precipita-
tion has been conducted since April 2005. The specific
questions addressed were: (1) How does climate change
affect plant community structure and composition in
the semiarid grassland? (2) Whether and how will
abiotic [e.g., soil moisture (SM)] and biotic factors
(interspecific interactions) mediate the response of
plant community to climate warming and increased
precipitation?
Materials and methods
Study site
This study was conducted in a semiarid temperate steppe in
Duolun County (421020N, 1161170E, 1324 m a.s.l.), Inner Mon-
golia, China, which belongs to monsoon climate of moderate
temperature zone. Long-term mean annual precipitation
(MAP) and mean annual temperature (MAT) is approximately
383 mm and 2.1 1C, respectively. Ninety percent of the total
precipitation is distributed from May to October and monthly
mean temperature ranges from �17.5 1C in January to 18.9 1C
in July. The soil in this area is classified as chestnut according
to Chinese classification or Haplic Calcisols according to
the FAO classification. The dominant plant species in this
temperature steppe with relatively low primary productivity
(approx. 100–200 g m�2 yr�1) were perennial herbs, including
Stipa krylovii, Artimesia frigida, Potentilla acaulis, Cleistogenes
squarrosa, Allium bidentatum and Agropyron cristattum.
S T E P P E C O M M U N I T Y R E S P O N S E S T O C L I M AT E C H A N G E 453
r 2010 Blackwell Publishing Ltd, Global Change Biology, 17, 452–465
Experimental design
This experiment used a paired, nested design with four treat-
ments (Niu et al., 2008; Liu et al., 2009). Precipitation was the
primary factor and warming was nested with the precipitation
treatment. There were three blocks with an area 44� 28 m for
each block. There was a pair of 10� 15 m plots in each block, in
which one plot was assigned as the increased precipitation
treatment and the other one as the ambient precipitation
treatment. Four 3� 4 m plots were established in each
10� 15 m plot with 1 m distance between the plots. The four
plots were randomly assigned to warming and unwarmed
control treatments with two replicates. Thus, there were totally
24 plots with six replicates for each treatment [control (C),
warming (W), increased precipitation (P), and warming plus
increased precipitation (WP)].
There were six sprinklers arranged in two rows in each of
the precipitation treatment plot, with each sprinkler covering a
circular area with a diameter of 3 m. A total amount of 120 mm
precipitation was applied under the increased precipitation
treatment in July and August with approx.15 mm week�1.
Each warmed subplot was heated continuously by a
165� 15 cm MSR-2420 infrared radiators (Kalglo Electronics,
Bethlehem, PA, USA) suspended 2.5 m aboveground since
April 28, 2005 [the heaters were turned off over the winter
(November 16–March 15) since 2007]. One ‘dummy’ heater
with the same shape and size as the infrared radiator was used
to simulate the shading effect of the infrared radiator in the
unwarmed control subplot.
Soil temperature (ST) and moisture
ST at the depth of 10 cm was recorded using a CR1000
datalogger (Campbell Scientific, Logan, UT, USA) from June
4, 2005. SM (0–10 cm) was measured using a portable SM
device (Diviner2000, Sentek Pty Ltd, Balmain, Australia) twice
a month in 2005 and 2006 and four times a month in 2007, 2008
and 2009 during the growing seasons (from May to October).
Vegetation and soil sampling and measurements
Since the experiment was designed as a long-term manipula-
tive experiment, all vegetation sampling was performed non-
destructively. Vegetation sampling was carried out at the peak
plant biomass in August in 2005 for the first time and repeated
at the same time from 2006 to 2009. A visually estimated
method was used to measure the changes in the community
coverage. One permanent quadrat (1� 1 m) was established in
each subplot in June 2005. During the measurement, a 1� 1 m
frame with 100 equally distributed grids (10� 10 cm) was put
above the canopy in each quadrat. The coverage of each
species was visually estimated in all the grids and summed
as the species coverage in the quadrat. All the species coverage
was summed as the coverage of different plant functional
groups and the whole community. The species richness was
recorded as the occurrence of the number of plant species in
the quadrat. Canopy height of each species within a quadrat
was calculated as the average of at least five random measure-
ments of species’ natural height.
Plants were divided into different functional groups on the
basis of growth form: GR, legumes (LE), shrubs and semi-
shrubs (SS) and nongraminous forbs (NF). Species richness
(species number per quadrat), Shannon–Wiener index (H) and
Pielou index evenness (E) were used to describe the patterns of
plant community structure: H was calculated as: H 5�SPi ln Pi
and E was calculated as: E 5 (�SPi ln Pi)/ln S, where Pi is the
relative coverage of species i and S is species richness. In
addition, we defined ‘dominant’ and ‘subdominant’ species
according to the ‘50/20 rule’ (FICWD, 1989; Kardol et al., 2010).
A. frigida dominated the plot across all treatments and counted
for 450% of the total community coverage. S. krylovii,
A. cristattum, Heteropappus altaicus and Phlomis umbrosa were
defined as subdominant species.
Soil samples were collected from one cylindrical soil core
(15 cm in depth and 8 cm in diameter) in each subplot in
August from 2006 to 2009. After removing roots and stones
by sieving with 2 mm mesh, soil samples were stored in
iceboxes and subsequently transferred to the laboratory. The
fresh samples were divided into two subsamples. One sub-
sample was used to measure the microbial variables, and the
other subsample that was air-dried, finely ground and sieved
with mesh o250 mm was used to measure soil organic C and
total N and pH.
Statistical analysis
Four-way ANOVAs with a blocked nested design were per-
formed to test the main and interactive effects of block, year,
warming and increased precipitation on the vegetation vari-
ables, SM and ST. A General Linear Model (GLM) with a
Duncan test was used to examine the statistical difference in
the mean values of the treatments and specific comparisons
between different groups of treatments were performed using
LSMEANS statement of this procedure. Seasonal mean values
of SM and ST, which were calculated from the monthly mean
values, were used. Three-way ANOVAs with a blocked nested
design were carried out to test the effects of block, warming,
and elevated precipitation on the variables in each year owing
to the interactions between year and manipulated treatments
(warming or increased precipitation) on measured variables.
Effects of block were tested together with the treatments in all
the above analyses, but they were not discussed in this study.
Stepwise multiple linear regressions with Po0.05 for inclusion
in the mixed model were conducted to investigate which
variable has the greatest effect on species richness and vegeta-
tion coverage, with SM, ST, soil organic C, total N and pH as
the independent variables. Before regressions, collinearity was
detected by calculating the variance inflation factor for each
explanatory variable and VIFo5 for each independent vari-
able, suggesting autocorrelation did not occur (Dobson, 2002).
All the data were tested for normal distribution before statis-
tical analyses, which were performed with SAS v.8.1 software
(SAS Institute Inc., Cary, NC, USA).
We used the constrained linear ordination technique redun-
dancy analysis (RDA) to analyze the response of community
454 H . YA N G et al.
r 2010 Blackwell Publishing Ltd, Global Change Biology, 17, 452–465
composition to treatments in 2009 (Teyssonneyre et al., 2002).
In this analysis, species occurred infrequently in the plots were
removed from the species data before ordination, which left 30
species for ordination, because rare species may have an
unduly impact on the result of the analysis. The treatments
(C, W, P and WP) were used as the environmental variables
and block as the covariable (i.e. concomitant variable whose
effect must be partialed out before estimating the effects of the
treatment variables) within the model. The model was then
tested using a restricted Monte Carlo permutation test (9999
random permutations) to test the null hypothesis that the
treatments had no influences on the community plant compo-
sition. RDA and Monte Carlo permutation test were per-
formed with the CANOCO 4.5 software. Furthermore, we
conducted stepwise multiple linear regressions with Axes 1
and 2 scores as dependent variables and SM, ST, soil organic C,
total N and pH as the independent variables to determine
which variable has the greatest effect on community composi-
tion (Belote et al., 2004).
Results
Changes in soil microclimate
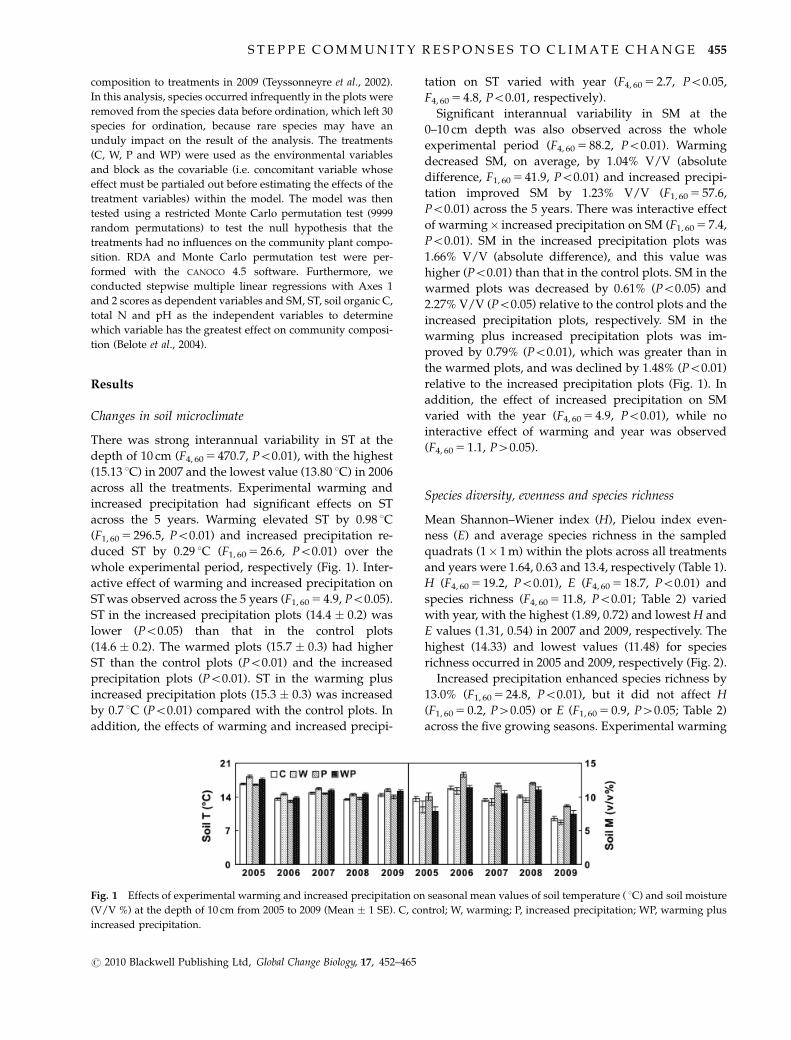
There was strong interannual variability in ST at the
depth of 10 cm (F4, 60 5 470.7, Po0.01), with the highest
(15.13 1C) in 2007 and the lowest value (13.80 1C) in 2006
across all the treatments. Experimental warming and
increased precipitation had significant effects on ST
across the 5 years. Warming elevated ST by 0.98 1C
(F1, 60 5 296.5, Po0.01) and increased precipitation re-
duced ST by 0.29 1C (F1, 60 5 26.6, Po0.01) over the
whole experimental period, respectively (Fig. 1). Inter-
active effect of warming and increased precipitation on
ST was observed across the 5 years (F1, 60 5 4.9, Po0.05).
ST in the increased precipitation plots (14.4 � 0.2) was
lower (Po0.05) than that in the control plots
(14.6 � 0.2). The warmed plots (15.7 � 0.3) had higher
ST than the control plots (Po0.01) and the increased
precipitation plots (Po0.01). ST in the warming plus
increased precipitation plots (15.3 � 0.3) was increased
by 0.7 1C (Po0.01) compared with the control plots. In
addition, the effects of warming and increased precipi-
tation on ST varied with year (F4, 60 5 2.7, Po0.05,
F4, 60 5 4.8, Po0.01, respectively).
Significant interannual variability in SM at the
0–10 cm depth was also observed across the whole
experimental period (F4, 60 5 88.2, Po0.01). Warming
decreased SM, on average, by 1.04% V/V (absolute
difference, F1, 60 5 41.9, Po0.01) and increased precipi-
tation improved SM by 1.23% V/V (F1, 60 5 57.6,
Po0.01) across the 5 years. There was interactive effect
of warming� increased precipitation on SM (F1, 60 5 7.4,
Po0.01). SM in the increased precipitation plots was
1.66% V/V (absolute difference), and this value was
higher (Po0.01) than that in the control plots. SM in the
warmed plots was decreased by 0.61% (Po0.05) and
2.27% V/V (Po0.05) relative to the control plots and the
increased precipitation plots, respectively. SM in the
warming plus increased precipitation plots was im-
proved by 0.79% (Po0.01), which was greater than in
the warmed plots, and was declined by 1.48% (Po0.01)
relative to the increased precipitation plots (Fig. 1). In
addition, the effect of increased precipitation on SM
varied with the year (F4, 60 5 4.9, Po0.01), while no
interactive effect of warming and year was observed
(F4, 60 5 1.1, P40.05).
Species diversity, evenness and species richness
Mean Shannon–Wiener index (H), Pielou index even-
ness (E) and average species richness in the sampled
quadrats (1� 1 m) within the plots across all treatments
and years were 1.64, 0.63 and 13.4, respectively (Table 1).
H (F4, 60 5 19.2, Po0.01), E (F4, 60 5 18.7, Po0.01) and
species richness (F4, 60 5 11.8, Po0.01; Table 2) varied
with year, with the highest (1.89, 0.72) and lowest H and
E values (1.31, 0.54) in 2007 and 2009, respectively. The
highest (14.33) and lowest values (11.48) for species
richness occurred in 2005 and 2009, respectively (Fig. 2).
Increased precipitation enhanced species richness by
13.0% (F1, 60 5 24.8, Po0.01), but it did not affect H
(F1, 60 5 0.2, P40.05) or E (F1, 60 5 0.9, P40.05; Table 2)
across the five growing seasons. Experimental warming
Fig. 1 Effects of experimental warming and increased precipitation on seasonal mean values of soil temperature ( 1C) and soil moisture
(V/V %) at the depth of 10 cm from 2005 to 2009 (Mean � 1 SE). C, control; W, warming; P, increased precipitation; WP, warming plus
increased precipitation.
S T E P P E C O M M U N I T Y R E S P O N S E S T O C L I M AT E C H A N G E 455
r 2010 Blackwell Publishing Ltd, Global Change Biology, 17, 452–465
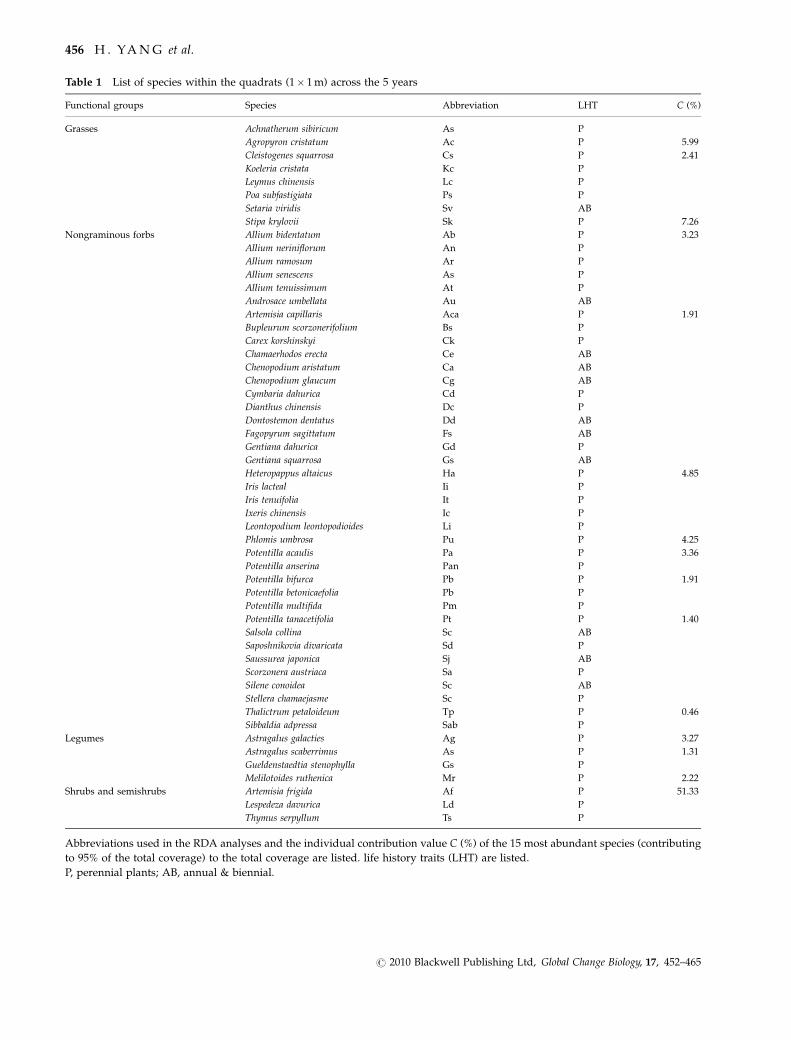
Table 1 List of species within the quadrats (1� 1 m) across the 5 years
Functional groups Species Abbreviation LHT C (%)
Grasses Achnatherum sibiricum As P
Agropyron cristatum Ac P 5.99
Cleistogenes squarrosa Cs P 2.41
Koeleria cristata Kc P
Leymus chinensis Lc P
Poa subfastigiata Ps P
Setaria viridis Sv AB
Stipa krylovii Sk P 7.26
Nongraminous forbs Allium bidentatum Ab P 3.23
Allium neriniflorum An P
Allium ramosum Ar P
Allium senescens As P
Allium tenuissimum At P
Androsace umbellata Au AB
Artemisia capillaris Aca P 1.91
Bupleurum scorzonerifolium Bs P
Carex korshinskyi Ck P
Chamaerhodos erecta Ce AB
Chenopodium aristatum Ca AB
Chenopodium glaucum Cg AB
Cymbaria dahurica Cd P
Dianthus chinensis Dc P
Dontostemon dentatus Dd AB
Fagopyrum sagittatum Fs AB
Gentiana dahurica Gd P
Gentiana squarrosa Gs AB
Heteropappus altaicus Ha P 4.85
Iris lacteal Ii P
Iris tenuifolia It P
Ixeris chinensis Ic P
Leontopodium leontopodioides Li P
Phlomis umbrosa Pu P 4.25
Potentilla acaulis Pa P 3.36
Potentilla anserina Pan P
Potentilla bifurca Pb P 1.91
Potentilla betonicaefolia Pb P
Potentilla multifida Pm P
Potentilla tanacetifolia Pt P 1.40
Salsola collina Sc AB
Saposhnikovia divaricata Sd P
Saussurea japonica Sj AB
Scorzonera austriaca Sa P
Silene conoidea Sc AB
Stellera chamaejasme Sc P
Thalictrum petaloideum Tp P 0.46
Sibbaldia adpressa Sab P
Legumes Astragalus galacties Ag P 3.27
Astragalus scaberrimus As P 1.31
Gueldenstaedtia stenophylla Gs P
Melilotoides ruthenica Mr P 2.22
Shrubs and semishrubs Artemisia frigida Af P 51.33
Lespedeza davurica Ld P
Thymus serpyllum Ts P
Abbreviations used in the RDA analyses and the individual contribution value C (%) of the 15 most abundant species (contributing
to 95% of the total coverage) to the total coverage are listed. life history traits (LHT) are listed.
P, perennial plants; AB, annual & biennial.
456 H . YA N G et al.
r 2010 Blackwell Publishing Ltd, Global Change Biology, 17, 452–465
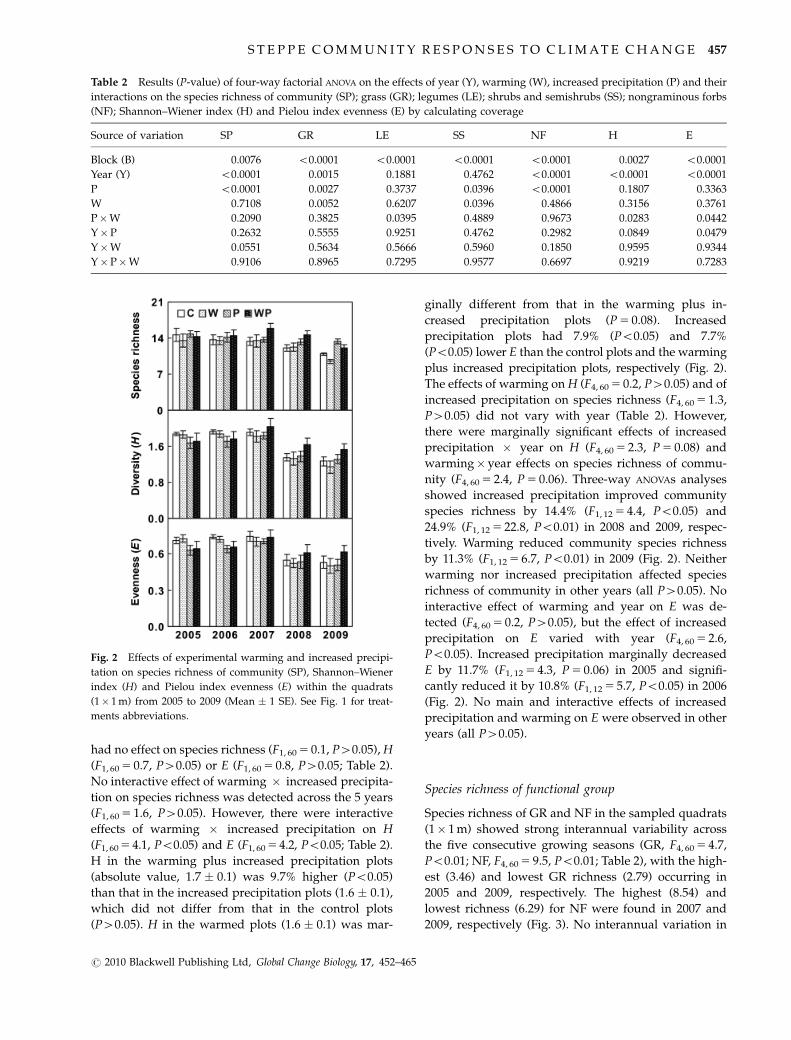
had no effect on species richness (F1, 60 5 0.1, P40.05), H
(F1, 60 5 0.7, P40.05) or E (F1, 60 5 0.8, P40.05; Table 2).
No interactive effect of warming � increased precipita-
tion on species richness was detected across the 5 years
(F1, 60 5 1.6, P40.05). However, there were interactive
effects of warming � increased precipitation on H
(F1, 60 5 4.1, Po0.05) and E (F1, 60 5 4.2, Po0.05; Table 2).
H in the warming plus increased precipitation plots
(absolute value, 1.7 � 0.1) was 9.7% higher (Po0.05)
than that in the increased precipitation plots (1.6 � 0.1),
which did not differ from that in the control plots
(P40.05). H in the warmed plots (1.6 � 0.1) was mar-
ginally different from that in the warming plus in-
creased precipitation plots (P 5 0.08). Increased
precipitation plots had 7.9% (Po0.05) and 7.7%
(Po0.05) lower E than the control plots and the warming
plus increased precipitation plots, respectively (Fig. 2).
The effects of warming on H (F4, 60 5 0.2, P40.05) and of
increased precipitation on species richness (F4, 60 5 1.3,
P40.05) did not vary with year (Table 2). However,
there were marginally significant effects of increased
precipitation � year on H (F4, 60 5 2.3, P 5 0.08) and
warming�year effects on species richness of commu-
nity (F4, 60 5 2.4, P 5 0.06). Three-way ANOVAs analyses
showed increased precipitation improved community
species richness by 14.4% (F1, 12 5 4.4, Po0.05) and
24.9% (F1, 12 5 22.8, Po0.01) in 2008 and 2009, respec-
tively. Warming reduced community species richness
by 11.3% (F1, 12 5 6.7, Po0.01) in 2009 (Fig. 2). Neither
warming nor increased precipitation affected species
richness of community in other years (all P40.05). No
interactive effect of warming and year on E was de-
tected (F4, 60 5 0.2, P40.05), but the effect of increased
precipitation on E varied with year (F4, 60 5 2.6,
Po0.05). Increased precipitation marginally decreased
E by 11.7% (F1, 12 5 4.3, P 5 0.06) in 2005 and signifi-
cantly reduced it by 10.8% (F1, 12 5 5.7, Po0.05) in 2006
(Fig. 2). No main and interactive effects of increased
precipitation and warming on E were observed in other
years (all P40.05).
Species richness of functional group
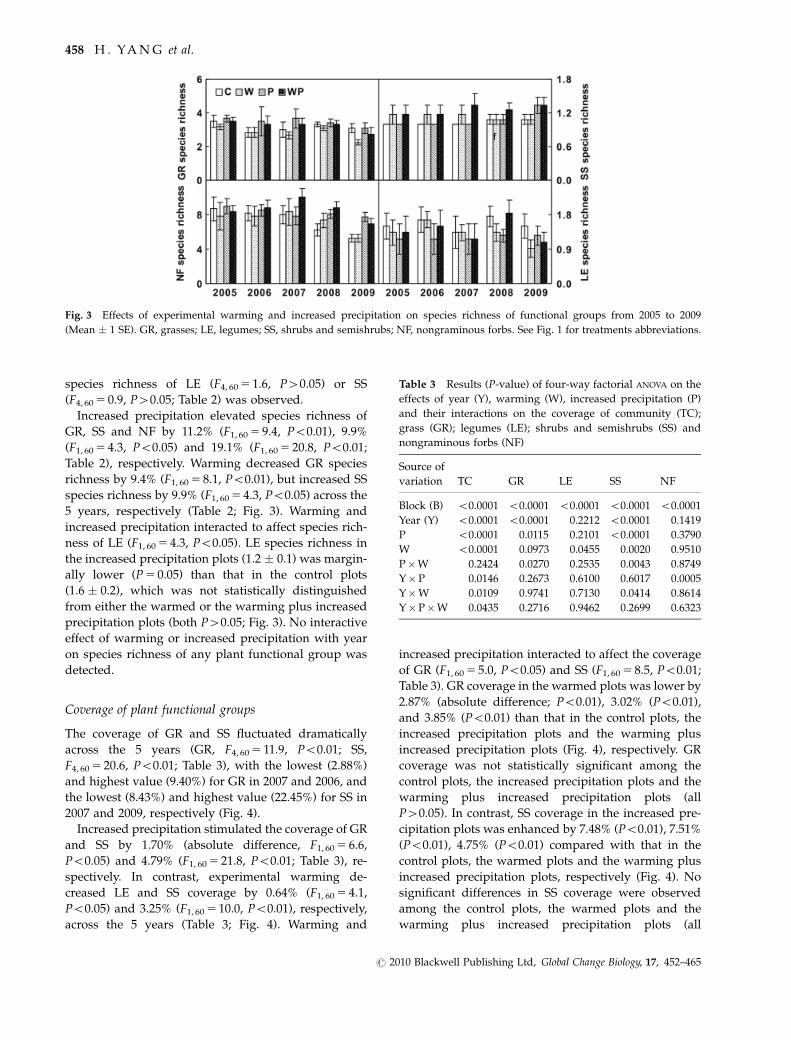
Species richness of GR and NF in the sampled quadrats
(1� 1 m) showed strong interannual variability across
the five consecutive growing seasons (GR, F4, 60 5 4.7,
Po0.01; NF, F4, 60 5 9.5, Po0.01; Table 2), with the high-
est (3.46) and lowest GR richness (2.79) occurring in
2005 and 2009, respectively. The highest (8.54) and
lowest richness (6.29) for NF were found in 2007 and
2009, respectively (Fig. 3). No interannual variation in
Table 2 Results (P-value) of four-way factorial ANOVA on the effects of year (Y), warming (W), increased precipitation (P) and their
interactions on the species richness of community (SP); grass (GR); legumes (LE); shrubs and semishrubs (SS); nongraminous forbs
(NF); Shannon–Wiener index (H) and Pielou index evenness (E) by calculating coverage
Source of variation SP GR LE SS NF H E
Block (B) 0.0076 o0.0001 o0.0001 o0.0001 o0.0001 0.0027 o0.0001
Year (Y) o0.0001 0.0015 0.1881 0.4762 o0.0001 o0.0001 o0.0001
P o0.0001 0.0027 0.3737 0.0396 o0.0001 0.1807 0.3363
W 0.7108 0.0052 0.6207 0.0396 0.4866 0.3156 0.3761
P�W 0.2090 0.3825 0.0395 0.4889 0.9673 0.0283 0.0442
Y�P 0.2632 0.5555 0.9251 0.4762 0.2982 0.0849 0.0479
Y�W 0.0551 0.5634 0.5666 0.5960 0.1850 0.9595 0.9344
Y�P�W 0.9106 0.8965 0.7295 0.9577 0.6697 0.9219 0.7283
Fig. 2 Effects of experimental warming and increased precipi-
tation on species richness of community (SP), Shannon–Wiener
index (H) and Pielou index evenness (E) within the quadrats
(1� 1 m) from 2005 to 2009 (Mean � 1 SE). See Fig. 1 for treat-
ments abbreviations.
S T E P P E C O M M U N I T Y R E S P O N S E S T O C L I M AT E C H A N G E 457
r 2010 Blackwell Publishing Ltd, Global Change Biology, 17, 452–465
species richness of LE (F4, 60 5 1.6, P40.05) or SS
(F4, 60 5 0.9, P40.05; Table 2) was observed.
Increased precipitation elevated species richness of
GR, SS and NF by 11.2% (F1, 60 5 9.4, Po0.01), 9.9%
(F1, 60 5 4.3, Po0.05) and 19.1% (F1, 60 5 20.8, Po0.01;
Table 2), respectively. Warming decreased GR species
richness by 9.4% (F1, 60 5 8.1, Po0.01), but increased SS
species richness by 9.9% (F1, 60 5 4.3, Po0.05) across the
5 years, respectively (Table 2; Fig. 3). Warming and
increased precipitation interacted to affect species rich-
ness of LE (F1, 60 5 4.3, Po0.05). LE species richness in
the increased precipitation plots (1.2 � 0.1) was margin-
ally lower (P 5 0.05) than that in the control plots
(1.6 � 0.2), which was not statistically distinguished
from either the warmed or the warming plus increased
precipitation plots (both P40.05; Fig. 3). No interactive
effect of warming or increased precipitation with year
on species richness of any plant functional group was
detected.
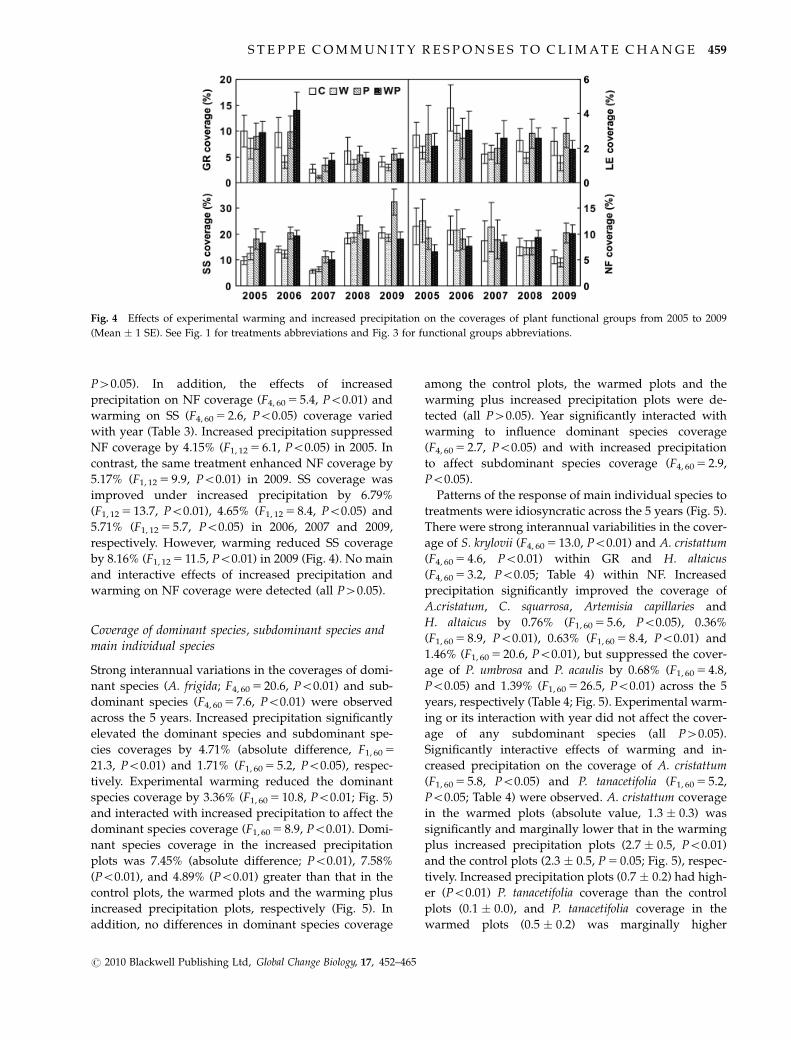
Coverage of plant functional groups
The coverage of GR and SS fluctuated dramatically
across the 5 years (GR, F4, 60 5 11.9, Po0.01; SS,
F4, 60 5 20.6, Po0.01; Table 3), with the lowest (2.88%)
and highest value (9.40%) for GR in 2007 and 2006, and
the lowest (8.43%) and highest value (22.45%) for SS in
2007 and 2009, respectively (Fig. 4).
Increased precipitation stimulated the coverage of GR
and SS by 1.70% (absolute difference, F1, 60 5 6.6,
Po0.05) and 4.79% (F1, 60 5 21.8, Po0.01; Table 3), re-
spectively. In contrast, experimental warming de-
creased LE and SS coverage by 0.64% (F1, 60 5 4.1,
Po0.05) and 3.25% (F1, 60 5 10.0, Po0.01), respectively,
across the 5 years (Table 3; Fig. 4). Warming and
increased precipitation interacted to affect the coverage
of GR (F1, 60 5 5.0, Po0.05) and SS (F1, 60 5 8.5, Po0.01;
Table 3). GR coverage in the warmed plots was lower by
2.87% (absolute difference; Po0.01), 3.02% (Po0.01),
and 3.85% (Po0.01) than that in the control plots, the
increased precipitation plots and the warming plus
increased precipitation plots (Fig. 4), respectively. GR
coverage was not statistically significant among the
control plots, the increased precipitation plots and the
warming plus increased precipitation plots (all
P40.05). In contrast, SS coverage in the increased pre-
cipitation plots was enhanced by 7.48% (Po0.01), 7.51%
(Po0.01), 4.75% (Po0.01) compared with that in the
control plots, the warmed plots and the warming plus
increased precipitation plots, respectively (Fig. 4). No
significant differences in SS coverage were observed
among the control plots, the warmed plots and the
warming plus increased precipitation plots (all
Fig. 3 Effects of experimental warming and increased precipitation on species richness of functional groups from 2005 to 2009
(Mean � 1 SE). GR, grasses; LE, legumes; SS, shrubs and semishrubs; NF, nongraminous forbs. See Fig. 1 for treatments abbreviations.
Table 3 Results (P-value) of four-way factorial ANOVA on the
effects of year (Y), warming (W), increased precipitation (P)
and their interactions on the coverage of community (TC);
grass (GR); legumes (LE); shrubs and semishrubs (SS) and
nongraminous forbs (NF)
Source of
variation TC GR LE SS NF
Block (B) o0.0001 o0.0001 o0.0001 o0.0001 o0.0001
Year (Y) o0.0001 o0.0001 0.2212 o0.0001 0.1419
P o0.0001 0.0115 0.2101 o0.0001 0.3790
W o0.0001 0.0973 0.0455 0.0020 0.9510
P�W 0.2424 0.0270 0.2535 0.0043 0.8749
Y�P 0.0146 0.2673 0.6100 0.6017 0.0005
Y�W 0.0109 0.9741 0.7130 0.0414 0.8614
Y�P�W 0.0435 0.2716 0.9462 0.2699 0.6323
458 H . YA N G et al.
r 2010 Blackwell Publishing Ltd, Global Change Biology, 17, 452–465
P40.05). In addition, the effects of increased
precipitation on NF coverage (F4, 60 5 5.4, Po0.01) and
warming on SS (F4, 60 5 2.6, Po0.05) coverage varied
with year (Table 3). Increased precipitation suppressed
NF coverage by 4.15% (F1, 12 5 6.1, Po0.05) in 2005. In
contrast, the same treatment enhanced NF coverage by
5.17% (F1, 12 5 9.9, Po0.01) in 2009. SS coverage was
improved under increased precipitation by 6.79%
(F1, 12 5 13.7, Po0.01), 4.65% (F1, 12 5 8.4, Po0.05) and
5.71% (F1, 12 5 5.7, Po0.05) in 2006, 2007 and 2009,
respectively. However, warming reduced SS coverage
by 8.16% (F1, 12 5 11.5, Po0.01) in 2009 (Fig. 4). No main
and interactive effects of increased precipitation and
warming on NF coverage were detected (all P40.05).
Coverage of dominant species, subdominant species andmain individual species
Strong interannual variations in the coverages of domi-
nant species (A. frigida; F4, 60 5 20.6, Po0.01) and sub-
dominant species (F4, 60 5 7.6, Po0.01) were observed
across the 5 years. Increased precipitation significantly
elevated the dominant species and subdominant spe-
cies coverages by 4.71% (absolute difference, F1, 60 5
21.3, Po0.01) and 1.71% (F1, 60 5 5.2, Po0.05), respec-
tively. Experimental warming reduced the dominant
species coverage by 3.36% (F1, 60 5 10.8, Po0.01; Fig. 5)
and interacted with increased precipitation to affect the
dominant species coverage (F1, 60 5 8.9, Po0.01). Domi-
nant species coverage in the increased precipitation
plots was 7.45% (absolute difference; Po0.01), 7.58%
(Po0.01), and 4.89% (Po0.01) greater than that in the
control plots, the warmed plots and the warming plus
increased precipitation plots, respectively (Fig. 5). In
addition, no differences in dominant species coverage
among the control plots, the warmed plots and the
warming plus increased precipitation plots were de-
tected (all P40.05). Year significantly interacted with
warming to influence dominant species coverage
(F4, 60 5 2.7, Po0.05) and with increased precipitation
to affect subdominant species coverage (F4, 60 5 2.9,
Po0.05).
Patterns of the response of main individual species to
treatments were idiosyncratic across the 5 years (Fig. 5).
There were strong interannual variabilities in the cover-
age of S. krylovii (F4, 60 5 13.0, Po0.01) and A. cristattum
(F4, 60 5 4.6, Po0.01) within GR and H. altaicus
(F4, 60 5 3.2, Po0.05; Table 4) within NF. Increased
precipitation significantly improved the coverage of
A.cristatum, C. squarrosa, Artemisia capillaries and
H. altaicus by 0.76% (F1, 60 5 5.6, Po0.05), 0.36%
(F1, 60 5 8.9, Po0.01), 0.63% (F1, 60 5 8.4, Po0.01) and
1.46% (F1, 60 5 20.6, Po0.01), but suppressed the cover-
age of P. umbrosa and P. acaulis by 0.68% (F1, 60 5 4.8,
Po0.05) and 1.39% (F1, 60 5 26.5, Po0.01) across the 5
years, respectively (Table 4; Fig. 5). Experimental warm-
ing or its interaction with year did not affect the cover-
age of any subdominant species (all P40.05).
Significantly interactive effects of warming and in-
creased precipitation on the coverage of A. cristattum
(F1, 60 5 5.8, Po0.05) and P. tanacetifolia (F1, 60 5 5.2,
Po0.05; Table 4) were observed. A. cristattum coverage
in the warmed plots (absolute value, 1.3 � 0.3) was
significantly and marginally lower that in the warming
plus increased precipitation plots (2.7 � 0.5, Po0.01)
and the control plots (2.3 � 0.5, P 5 0.05; Fig. 5), respec-
tively. Increased precipitation plots (0.7 � 0.2) had high-
er (Po0.01) P. tanacetifolia coverage than the control
plots (0.1 � 0.0), and P. tanacetifolia coverage in the
warmed plots (0.5 � 0.2) was marginally higher
Fig. 4 Effects of experimental warming and increased precipitation on the coverages of plant functional groups from 2005 to 2009
(Mean � 1 SE). See Fig. 1 for treatments abbreviations and Fig. 3 for functional groups abbreviations.
S T E P P E C O M M U N I T Y R E S P O N S E S T O C L I M AT E C H A N G E 459
r 2010 Blackwell Publishing Ltd, Global Change Biology, 17, 452–465
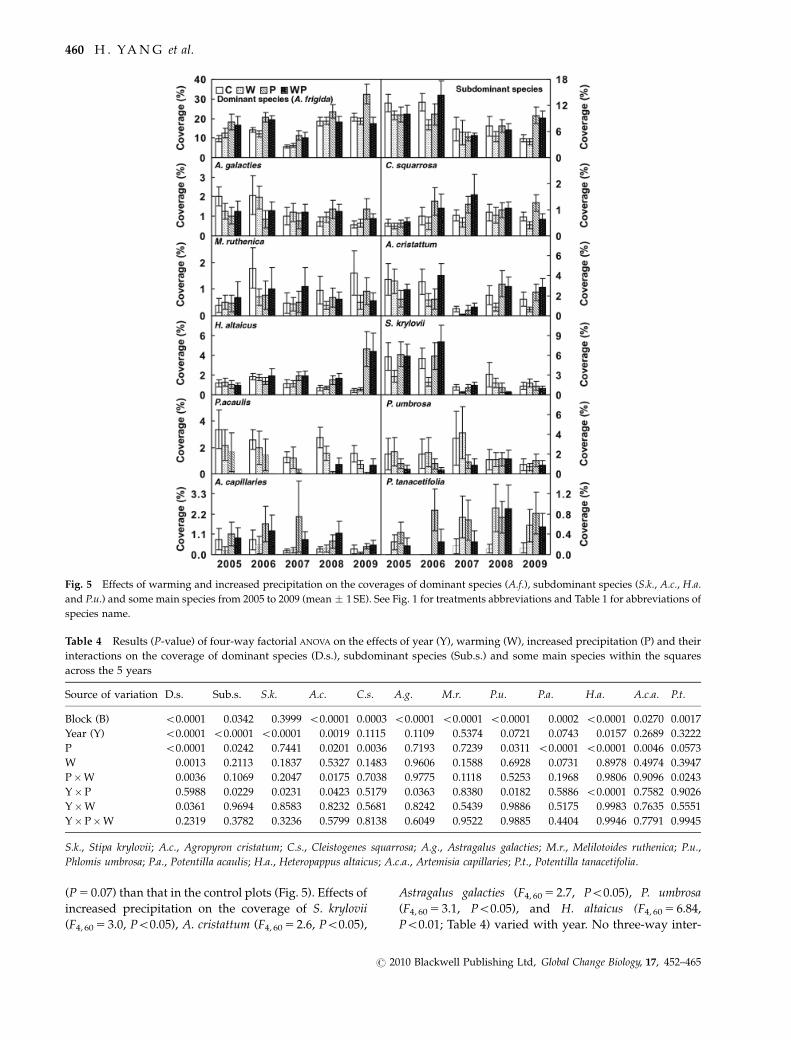
(P 5 0.07) than that in the control plots (Fig. 5). Effects of
increased precipitation on the coverage of S. krylovii
(F4, 60 5 3.0, Po0.05), A. cristattum (F4, 60 5 2.6, Po0.05),
Astragalus galacties (F4, 60 5 2.7, Po0.05), P. umbrosa
(F4, 60 5 3.1, Po0.05), and H. altaicus (F4, 60 5 6.84,
Po0.01; Table 4) varied with year. No three-way inter-
Fig. 5 Effects of warming and increased precipitation on the coverages of dominant species (A.f.), subdominant species (S.k., A.c., H.a.
and P.u.) and some main species from 2005 to 2009 (mean � 1 SE). See Fig. 1 for treatments abbreviations and Table 1 for abbreviations of
species name.
Table 4 Results (P-value) of four-way factorial ANOVA on the effects of year (Y), warming (W), increased precipitation (P) and their
interactions on the coverage of dominant species (D.s.), subdominant species (Sub.s.) and some main species within the squares
across the 5 years
Source of variation D.s. Sub.s. S.k. A.c. C.s. A.g. M.r. P.u. P.a. H.a. A.c.a. P.t.
Block (B) o0.0001 0.0342 0.3999 o0.0001 0.0003 o0.0001 o0.0001 o0.0001 0.0002 o0.0001 0.0270 0.0017
Year (Y) o0.0001 o0.0001 o0.0001 0.0019 0.1115 0.1109 0.5374 0.0721 0.0743 0.0157 0.2689 0.3222
P o0.0001 0.0242 0.7441 0.0201 0.0036 0.7193 0.7239 0.0311 o0.0001 o0.0001 0.0046 0.0573
W 0.0013 0.2113 0.1837 0.5327 0.1483 0.9606 0.1588 0.6928 0.0731 0.8978 0.4974 0.3947
P�W 0.0036 0.1069 0.2047 0.0175 0.7038 0.9775 0.1118 0.5253 0.1968 0.9806 0.9096 0.0243
Y�P 0.5988 0.0229 0.0231 0.0423 0.5179 0.0363 0.8380 0.0182 0.5886 o0.0001 0.7582 0.9026
Y�W 0.0361 0.9694 0.8583 0.8232 0.5681 0.8242 0.5439 0.9886 0.5175 0.9983 0.7635 0.5551
Y�P�W 0.2319 0.3782 0.3236 0.5799 0.8138 0.6049 0.9522 0.9885 0.4404 0.9946 0.7791 0.9945
S.k., Stipa krylovii; A.c., Agropyron cristatum; C.s., Cleistogenes squarrosa; A.g., Astragalus galacties; M.r., Melilotoides ruthenica; P.u.,
Phlomis umbrosa; P.a., Potentilla acaulis; H.a., Heteropappus altaicus; A.c.a., Artemisia capillaries; P.t., Potentilla tanacetifolia.
460 H . YA N G et al.
r 2010 Blackwell Publishing Ltd, Global Change Biology, 17, 452–465
active effects on the coverage of the main species were
detected across the 5 years.
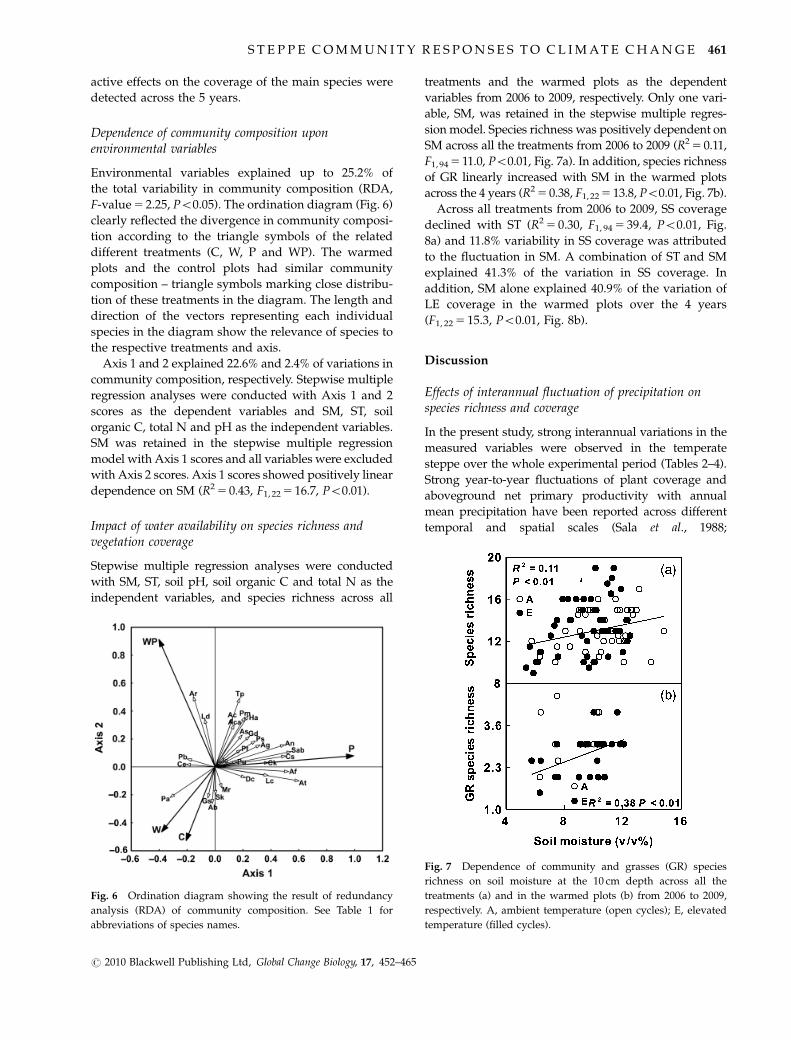
Dependence of community composition uponenvironmental variables
Environmental variables explained up to 25.2% of
the total variability in community composition (RDA,
F-value 5 2.25, Po0.05). The ordination diagram (Fig. 6)
clearly reflected the divergence in community composi-
tion according to the triangle symbols of the related
different treatments (C, W, P and WP). The warmed
plots and the control plots had similar community
composition – triangle symbols marking close distribu-
tion of these treatments in the diagram. The length and
direction of the vectors representing each individual
species in the diagram show the relevance of species to
the respective treatments and axis.
Axis 1 and 2 explained 22.6% and 2.4% of variations in
community composition, respectively. Stepwise multiple
regression analyses were conducted with Axis 1 and 2
scores as the dependent variables and SM, ST, soil
organic C, total N and pH as the independent variables.
SM was retained in the stepwise multiple regression
model with Axis 1 scores and all variables were excluded
with Axis 2 scores. Axis 1 scores showed positively linear
dependence on SM (R2 5 0.43, F1, 22 5 16.7, Po0.01).
Impact of water availability on species richness andvegetation coverage
Stepwise multiple regression analyses were conducted
with SM, ST, soil pH, soil organic C and total N as the
independent variables, and species richness across all
treatments and the warmed plots as the dependent
variables from 2006 to 2009, respectively. Only one vari-
able, SM, was retained in the stepwise multiple regres-
sion model. Species richness was positively dependent on
SM across all the treatments from 2006 to 2009 (R2 5 0.11,
F1, 94 5 11.0, Po0.01, Fig. 7a). In addition, species richness
of GR linearly increased with SM in the warmed plots
across the 4 years (R2 5 0.38, F1, 22 5 13.8, Po0.01, Fig. 7b).
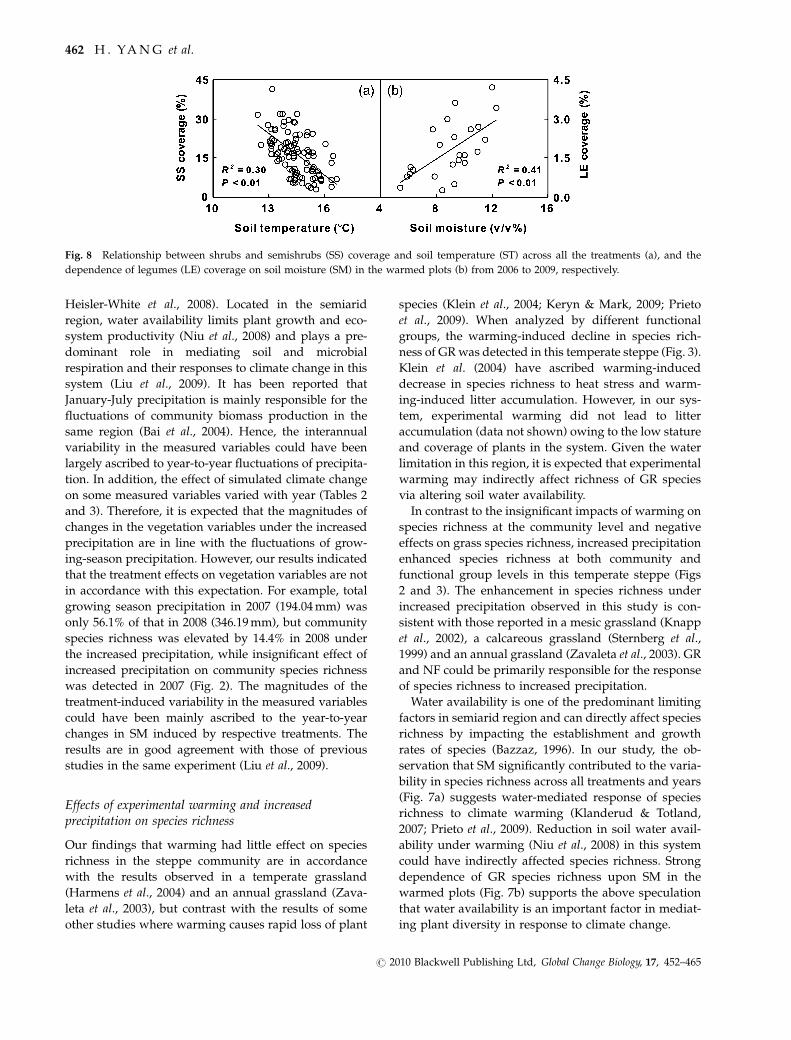
Across all treatments from 2006 to 2009, SS coverage
declined with ST (R2 5 0.30, F1, 94 5 39.4, Po0.01, Fig.
8a) and 11.8% variability in SS coverage was attributed
to the fluctuation in SM. A combination of ST and SM
explained 41.3% of the variation in SS coverage. In
addition, SM alone explained 40.9% of the variation of
LE coverage in the warmed plots over the 4 years
(F1, 22 5 15.3, Po0.01, Fig. 8b).
Discussion
Effects of interannual fluctuation of precipitation onspecies richness and coverage
In the present study, strong interannual variations in the
measured variables were observed in the temperate
steppe over the whole experimental period (Tables 2–4).
Strong year-to-year fluctuations of plant coverage and
aboveground net primary productivity with annual
mean precipitation have been reported across different
temporal and spatial scales (Sala et al., 1988;
Fig. 6 Ordination diagram showing the result of redundancy
analysis (RDA) of community composition. See Table 1 for
abbreviations of species names.
Fig. 7 Dependence of community and grasses (GR) species
richness on soil moisture at the 10 cm depth across all the
treatments (a) and in the warmed plots (b) from 2006 to 2009,
respectively. A, ambient temperature (open cycles); E, elevated
temperature (filled cycles).
S T E P P E C O M M U N I T Y R E S P O N S E S T O C L I M AT E C H A N G E 461
r 2010 Blackwell Publishing Ltd, Global Change Biology, 17, 452–465
Heisler-White et al., 2008). Located in the semiarid
region, water availability limits plant growth and eco-
system productivity (Niu et al., 2008) and plays a pre-
dominant role in mediating soil and microbial
respiration and their responses to climate change in this
system (Liu et al., 2009). It has been reported that
January-July precipitation is mainly responsible for the
fluctuations of community biomass production in the
same region (Bai et al., 2004). Hence, the interannual
variability in the measured variables could have been
largely ascribed to year-to-year fluctuations of precipita-
tion. In addition, the effect of simulated climate change
on some measured variables varied with year (Tables 2
and 3). Therefore, it is expected that the magnitudes of
changes in the vegetation variables under the increased
precipitation are in line with the fluctuations of grow-
ing-season precipitation. However, our results indicated
that the treatment effects on vegetation variables are not
in accordance with this expectation. For example, total
growing season precipitation in 2007 (194.04 mm) was
only 56.1% of that in 2008 (346.19 mm), but community
species richness was elevated by 14.4% in 2008 under
the increased precipitation, while insignificant effect of
increased precipitation on community species richness
was detected in 2007 (Fig. 2). The magnitudes of the
treatment-induced variability in the measured variables
could have been mainly ascribed to the year-to-year
changes in SM induced by respective treatments. The
results are in good agreement with those of previous
studies in the same experiment (Liu et al., 2009).
Effects of experimental warming and increasedprecipitation on species richness
Our findings that warming had little effect on species
richness in the steppe community are in accordance
with the results observed in a temperate grassland
(Harmens et al., 2004) and an annual grassland (Zava-
leta et al., 2003), but contrast with the results of some
other studies where warming causes rapid loss of plant
species (Klein et al., 2004; Keryn & Mark, 2009; Prieto
et al., 2009). When analyzed by different functional
groups, the warming-induced decline in species rich-
ness of GR was detected in this temperate steppe (Fig. 3).
Klein et al. (2004) have ascribed warming-induced
decrease in species richness to heat stress and warm-
ing-induced litter accumulation. However, in our sys-
tem, experimental warming did not lead to litter
accumulation (data not shown) owing to the low stature
and coverage of plants in the system. Given the water
limitation in this region, it is expected that experimental
warming may indirectly affect richness of GR species
via altering soil water availability.
In contrast to the insignificant impacts of warming on
species richness at the community level and negative
effects on grass species richness, increased precipitation
enhanced species richness at both community and
functional group levels in this temperate steppe (Figs
2 and 3). The enhancement in species richness under
increased precipitation observed in this study is con-
sistent with those reported in a mesic grassland (Knapp
et al., 2002), a calcareous grassland (Sternberg et al.,
1999) and an annual grassland (Zavaleta et al., 2003). GR
and NF could be primarily responsible for the response
of species richness to increased precipitation.
Water availability is one of the predominant limiting
factors in semiarid region and can directly affect species
richness by impacting the establishment and growth
rates of species (Bazzaz, 1996). In our study, the ob-
servation that SM significantly contributed to the varia-
bility in species richness across all treatments and years
(Fig. 7a) suggests water-mediated response of species
richness to climate warming (Klanderud & Totland,
2007; Prieto et al., 2009). Reduction in soil water avail-
ability under warming (Niu et al., 2008) in this system
could have indirectly affected species richness. Strong
dependence of GR species richness upon SM in the
warmed plots (Fig. 7b) supports the above speculation
that water availability is an important factor in mediat-
ing plant diversity in response to climate change.
Fig. 8 Relationship between shrubs and semishrubs (SS) coverage and soil temperature (ST) across all the treatments (a), and the
dependence of legumes (LE) coverage on soil moisture (SM) in the warmed plots (b) from 2006 to 2009, respectively.
462 H . YA N G et al.
r 2010 Blackwell Publishing Ltd, Global Change Biology, 17, 452–465

Effect of experimental warming on communitycomposition
Significant change in community composition induced
by experimental warming is detected in semiarid
steppe. Our observations are inconsistent with the
results of some studies in arctic and subarctic sites
(Wahren et al., 2005; Grime et al., 2008), a temperate
grassland (Harmens et al., 2004) and bryophytes com-
munity of a limestone grassland (Bates et al., 2005)
where no changes in community composition have
been detected. Changes in community composition
have been ascribed to alterations in competitive hier-
archies and relative dominance of different plant spe-
cies under warming (Chapin et al., 1995; Harte & Shaw,
1995; Klanderud & Totland, 2005; Niu & Wan, 2008; Post
& Pedersen, 2008). Generally, warming directly en-
hances plant growth via stimulating metabolism and
improving photosynthetic rates. The positive effects of
warming on vegetation coverage (Harte & Shaw, 1995;
Jagerbrand et al., 2009) have been reported in various
ecosystems, especially in the arctic and alpine regions
(Chapin et al., 1995; Walker et al., 2006; Post & Pedersen,
2008).
On the other hand, changes in resources induced by
warming can mediate or even offset the positive warm-
ing effects. Reduced soil water content under warming
(Harte & Shaw, 1995; Niu et al., 2008) would exacerbate
water limitation for plant growth, thus resulting in little
or negative response of plant growth to elevated tem-
perature, especially in semiarid region. In fact, negative
warming effects on SS and LE coverage (Fig. 4) were
observed in this system. Our results are in accordance
with a study that reported reduced GR coverage in the
warmed plots due to lower SM (Harte & Shaw, 1995).
Moreover, negative dependence of SS coverage on ST
across all treatments (Fig. 8a) and positive correlation of
LE coverage with SM in the warmed plots (Fig. 8b)
provide further experimental evidence in support of
that there are indirect effects of warming on vegetation
coverage via altering soil water availability. Reduced
plant photosynthesis and gross ecosystem productivity
(Niu et al., 2008) as well as soil respiration (Liu et al.,
2009) due to exacerbated water limitation under warm-
ing have also been revealed in the same experiment.
The observations indicate that soil water availability is
an important factor in regulating plant community in
arid and semiarid regions in response to climate
warming.
Changes in interspecific relationships under warming
(Klanderud & Totland, 2007; Niu & Wan, 2008) can also
mediate the response of plant community. Because of
their intrinsic thermal sensitivity, plant species and
functional groups can show different responses to
warming, contributing to the shifts in the competitive
ability and relative dominance of among species and
functional groups (Chapin et al., 1995; Harte & Shaw,
1995; Walker et al., 2006; Post & Pedersen, 2008). For
example, dramatic decline in coverage of the dominant
species under warming was observed in our system,
whilst warming had no effect on subdominant species
coverage. These results may be partly ascribed to the
reduced interspecific competition (i.e., lower dominant
species coverage). This explanation is in accordance
with a study conducted in the old-field ecosystem that
climate change indirectly affects subdominant species
via dominant species effects on subdominant species
(Engel et al., 2009; Kardol et al., 2010). In addition,
alterations in interspecific relationship among other
species were detected and could mediate the responses
of plant community to climate change. For example, the
negative relationships between the GR species (C. squar-
rosa) and several main nongraminous species (Support-
ing information, Table S1) suggest that these two
functional groups may show opposite directions in
response to climate warming. The observations in this
study highlight the importance of incorporation of
species interactions into the projection of plant commu-
nity response to climate warming.
Effect of increased precipitation on communitycomposition
The significant effect of increased precipitation on plant
community composition across the 5 years is in accor-
dance with the observations in a calcareous grassland
(Sternberg et al., 1999), a California grassland (Harpole
et al., 2007) and a Serengeti grassland (Anderson, 2008).
The responses of different functional groups appeared
to be driven by the dominant and subsdominant species
and species interactions mediate their responses to
increased precipitation. The enhanced coverage of spe-
cies A. cristattum and C. squarrosa resulted in the in-
crease in GR coverage (Fig. 5) irrespective of little
changes in another subdominant GR species (S. krylo-
vii). No changes in the coverage of two main LE species
A. galacties and M. ruthenica were observed under the
elevated precipitation (Fig. 5). This might be attributa-
ble to competitive interactions with the other species
and their intrinsically low competitive abilities because
the two main LE species have low stature and produc-
tivity. The negative relationships between the two main
LE species coverages and the nongraminous species
coverage (Table S2) suggest that the nongraminous
species with higher stature suppress the response of
LE to increased precipitation. The positive responses of
SS to increased precipitation mainly result from the
growth of species A. frigida, whose coverage increased
S T E P P E C O M M U N I T Y R E S P O N S E S T O C L I M AT E C H A N G E 463
r 2010 Blackwell Publishing Ltd, Global Change Biology, 17, 452–465

by 4.71% under the elevated precipitation across the 5
years (Fig. 5). Generally, forbs are highly diverse with
respect to taxonomic point and cannot be considered as
one plant functional group. The idiosyncratic, even
contrasting responses of the main species in nongrami-
nous functional group counteract with each other, lead-
ing to the insignificant response of this functional group
to increased precipitation. For example, we found po-
sitive responses of A. capillaries and P. tanacetifolia cover-
age and negative responses of P. umbrosa and P. acaulis
coverage (Fig. 5). The mean height of species A. capil-
laries, P. tanacetifolia, P. umbrosa and P. acaulis was 14.1,
8.6, 4.21 and 1.27 cm across all the treatments and years,
respectively. Probably, higher plants capture more light
per unit area and tend to benefit more from the in-
creased precipitation and consequently suppress the
growth of the low-stature plants via shading the lower
canopy. The above observations suggest that species
interactions play an important role in regulating plant
community response to the increased precipitation.
Conclusions and implications
A previous modeling study (Ni & Zhang, 2000) has
shown that MAP and MAT are projected to increase by
30–100 mm and 3 1C, respectively, in this century in the
Inner Mongolia steppe. Our results showed that plant
community structure in the temperate steppe has been
altered under simulated climate change. Generally,
species richness and vegetation coverage had contrast-
ing responses to increased precipitation and warming.
However, the amplitude of the response to increased
precipitation was stronger than that to warming. Our
findings are in concert with those in an old field grass in
the United States where changes in precipitation domi-
nated plant responses when compared with elevated
temperature (Engel et al., 2009; Kardol et al., 2010).
Therefore, the diversity and coverage in this steppe
ecosystem will be enhanced in the future climate
change scenarios with the predicted concurrent in-
creases in precipitation and temperature. Alterations
in temperate steppe community composition and di-
versity induced by climate change would facilitate the
maintenance of diversity, ecosystem functioning and
the development of the socio-economics, and better
serve the ecological environment of the region.
This study revealed that both soil water availability
and species interactions play important roles in regulat-
ing plant community in response to climate change. The
conclusion in this study is in well agreement with those
in previous studies in the same experiment which have
demonstrated mediation of water availability and spe-
cies interactions in the responses of ecosystem C cycling
to changing climate (Niu et al., 2008, 2009; Liu et al.,
2009). These findings highlight the importance of in-
corporation of abiotic and biotic mediations in the
model projection of climate change effects on biodiver-
sity and terrestrial ecosystems (Shaver et al., 2000;
Botkin et al., 2007). However, care should be taken when
extrapolating from our findings to grassland ecosys-
tems worldwide. The semiarid arid steppe in northern
China where water is the predominant limiting factor
may show different responses from grasslands in other
regions where other factors rather than precipitation/
water availability are the primary limitation. In addi-
tion, short-term response of plant community to climate
change may differ from the long-term response (Holl-
ister et al., 2005) and the 5-year experimental period in
this study is relatively short. Previous studies in the
same experiment have demonstrated regulation of spe-
cies composition change on ecosystem C cycling in
response to atmospheric and climatic change (Niu
et al., 2009, 2010). Therefore, understanding of the
long-term effects of climate change on the diversity
and community composition of semiarid temperate
steppe of northern China will facilitate projection of
C sequestration potential and its feedbacks to future
climate warming.
Acknowledgements
This study was conducted as part of a comprehensive researchproject (Global Change Multi-factor Experiment – Duolun)sponsored by Institute of Botany, Chinese Academy of Sciences.The authors thank Jianyang Xia, Shuli Niu, Changhui Wang,Hongjun Wang and Xin Zhang for their helpful discussions andvaluable advice on the manuscript. Special thanks give toWenhua Xu and Zhuwen Xu for their help in data analysis andidentifying plant species, respectively. Thanks two anonymousreferees for their thoughtful and helpful comments to the earlierversion of this manuscript. This study was financially supportedby the Ministry of Science and Technology of China (2007CB106803), the National Natural Science Foundation of China(30821062, 30925009) and State Key Laboratory of Vegetation andEnvironmental Change.
References
Adler PB, Levine JM (2007) Contrasting relationships between precipitation and
species richness in space and time. Oikos, 116, 221–232.
Anderson TM (2008) Plant compositional change over time increases with rainfall in
Serengeti grasslands. Oikos, 117, 675–682.
Bai YF, Han XG, Wu JG et al. (2004) Ecosystem stability and compensatory effects in the
Inner Mongolia grassland. Nature, 431, 181–184.
Bates JW, Thompson K, Grime JP (2005) Effects of simulated long-term climatic change
on the bryophytes of a limestone grassland community. Global Change Biology, 11,
757–769.
Bazzaz FA (1996) Plants in Changing Environments: Linking Physiological, Population and
Community Ecology. Cambridge University Press, Cambridge.
Belote RT, Weltzin JF, Norby RJ (2004) Response of an understory plant community to
elevated [CO2] depends on differential responses of dominant invasive species and
is mediated by soil water availability. New Phytologist, 161, 827–835.
464 H . YA N G et al.
r 2010 Blackwell Publishing Ltd, Global Change Biology, 17, 452–465

Botkin DB, Saxe H, Araujo MB et al. (2007) Forecasting the effects of global warming on
biodiversity. Bioscience, 57, 227–236.
Chapin FS, Shaver GR, Giblin AE et al. (1995) Responses of arctic tundra to experi-
mental and observed changes in climate. Ecology, 76, 694–711.
Chapin FS, Sturm M, Serreze MC et al. (2005) Role of land-surface changes in Arctic
summer warming. Science, 310, 657–660.
Christensen L, Coughenour MB, Ellis JE et al. (2004) Vulnerability of the Asian typical
steppe to grazing and climate change. Climatic Change, 63, 351–368.
Dobson AJ (2002) An introduction to generalized linear models. In: Model Selection, 2
edn, pp. 91–92. A CRC Press Company, Boca Raton.
Dore MHI (2005) Climatic change and changes in global precipitation patterns: what
do we know? Environment International, 31, 1167–1181.
Engel EC, Weltzin JF, Norby RJ et al. (2009) Responses of an old-field plant community
to interacting factors of elevated [CO2], warming, and soil moisture. Journal of Plant
Ecology-UK, 2, 1–11.
Federal Interagency Committee for Wetland Delineation (FICWD) (1989) Federal Manual
for Identifying and Delineating Jurisdictional Wetlands, Cooperative Technical Publication.
U.S. Army Corps of Engineers, U.S. Environmental Protection Agency, U.S. Fish and
Wildlife Service, and USDA Soil Conservation Service, Washington, DC.
Grime JP, Fridley JD, Askew AP et al. (2008) Long-term resistance to simulated climate
change in an infertile grassland. Proceedings of the National Academy of Sciences of the
United States of America, 105, 10028–10032.
Harmens H, Williams PD, Peters SL et al. (2004) Impacts of elevated atmospheric CO2
and temperature on plant community structure of a temperate grassland are
modulated by cutting frequency. Grass and Forage Science, 59, 144–156.
Harpole WS, Potts DL, Suding KN (2007) Ecosystem responses to water and nitrogen
amendment in a California grassland. Global Change Biology, 13, 2341–2348.
Harte J, Shaw R (1995) Shifting dominance within a montane vegetation community-
results of a climate-warming experiment. Science, 267, 876–880.
Heisler-White JL, Knapp AK, Kelly EF (2008) Increasing precipitation event size
increases aboveground net primary productivity in a semi-arid grassland. Oecolo-
gia, 158, 129–140.
Hollister RD, Webber PJ, Tweedie CE (2005) The response of Alaskan arctic tundra to
experimental warming: differences between short- and long-term responses. Global
Change Biology, 11, 525–536.
Hooper DU, Vitousek PM (1997) The effects of plant composition and diversity on
ecosystem processes. Science, 277, 1302–1305.
IPCC (2007) Climatic Change 2007: the physical science basis: Summary for policymakers.
IPCC WGI Fourth Assessment Report.
Jagerbrand AK, Alatalo JM, Chrimes D et al. (2009) Plant community responses to 5
years of simulated climate change in meadow and heath ecosystems at a subarctic-
alpine site. Oecologia, 161, 601–610.
Kang L, Han XG, Zhang ZB et al. (2007) Grassland ecosystems in China: review of
current knowledge and research advancement. Philosophical Transactions of the Royal
Society B-Biological Sciences, 362, 997–1008.
Kardol P, Campany CE, Souza L et al. (2010) Climate change effects on plant biomass
alter dominance patterns and community evenness in an experimental old-field
ecosystem. Global Change Biology, doi: 10.1111/j.1365-2486.2010.02162.x.
Keryn BG, Mark DB (2009) Experimental warming causes rapid loss of plant diversity
in New England salt marshes. Ecology Letters, 12, 842–848.
Klanderud K, Totland O (2005) Simulated climate change altered dominance hierar-
chies and diversity of an alpine biodiversity hotspot. Ecology, 86, 2047–2054.
Klanderud K, Totland O (2007) The relative role of dispersal and local interactions for
alpine plant community diversity under simulated climate warming. Oikos, 116,
1279–1288.
Klein JA, Harte J, Zhao XQ (2004) Experimental warming causes large and rapid
species loss, dampened by simulated grazing, on the Tibetan Plateau. Ecology
Letters, 7, 1170–1179.
Knapp AK, Fay PA, Blair JM et al. (2002) Rainfall variability, carbon cycling, and plant
species diversity in a mesic grassland. Science, 298, 2202–2205.
Liston GE, Mcfadden JP, Sturm M et al. (2002) Modelled changes in arctic tundra snow,
energy and moisture fluxes due to increased shrubs. Global Change Biology, 8, 17–32.
Liu WX, Zhang Z, Wan SQ (2009) Predominant role of water in regulating soil and
microbial respiration and their responses to climate change in a semiarid grassland.
Global Change Biology, 15, 184–195.
Ni J, Zhang XS (2000) Climate variability, ecological gradient and the Northeast China
Transect (NECT). Journal of Arid Environments, 46, 313–325.
Niu SL, Wan SQ (2008) Warming changes plant competitive hierarchy in a temperate
steppe in northern China. Journal of Plant Ecology-UK, 1, 103–110.
Niu SL, Wu MY, Han Y et al. (2008) Water-mediated responses of ecosystem carbon
fluxes to climatic change in a temperate steppe. New Phytologist, 177, 209–219.
Niu SL, Wu MY, Han Y et al. (2010) Nitrogen effects on net ecosystem carbon exchange
in a temperate steppe. Global Change Biology, 16, 144–155.
Niu SL, Yang HJ, Zhang Z et al. (2009) Non-additive effects of water and nitrogen
addition on ecosystem carbon exchange in a temperate steppe. Ecosystems, 12,
915–926.
Penuelas J, Prieto P, Beier C et al. (2007) Response of plant species richness and primary
productivity in shrublands along a north–south gradient in Europe to seven years
of experimental warming and drought: reductions in primary productivity in the
heat and drought year of 2003. Global Change Biology, 13, 2563–2581.
Post E, Pedersen C (2008) Opposing plant community responses to warming with and
without herbivores. Proceedings of the National Academy of Sciences of the United States
of America, 105, 12353–12358.
Prieto P, Penuelas J, Lloret F et al. (2009) Experimental drought and warming decrease
diversity and slow down post-fire succession in a Mediterranean shrubland.
Ecography, 32, 623–636.
Sala O, Parton W, Joyce L et al. (1988) Primary production of the central grassland
region of the United States. Ecology, 69, 40–45.
Shaver GR, Canadell J, Chapin FS et al. (2000) Global warming and
terrestrial ecosystems: a conceptual framework for analysis. BioScience, 50, 871–882.
Sternberg M, Brown VK, Masters GJ et al. (1999) Plant community dynamics in a
calcareous grassland under climate change manipulations. Plant Ecology, 143, 29–37.
Suttle KB, Thomsen MA, Power ME (2007) Species interactions reverse grassland
responses to changing climate. Science, 315, 640–642.
Teyssonneyre F, Catherine PC, Robert F et al. (2002) Effects of elevated CO2 and cutting
frequency on plant community structure in a temperate grassland. Global Change
Biology, 8, 1034–1046.
Thuiller W, Lavorel S, Araujo MB et al. (2005) Climate change threats to plant diversity
in Europe. Proceedings of the National Academy of Sciences of the United States of
America, 102, 8245–8250.
Tilman D, Knops J, Wedin D et al. (1997) The influence of functional diversity and
composition on ecosystem processes. Science, 277, 1300–1302.
Wahren CHA, Walker MD, Bret-Harte MS (2005) Vegetation responses in Alaskan
arctic tundra after 8 years of a summer warming and winter snow manipulation
experiment. Global Change Biology, 11, 537–552.
Walker MD, Wahren CH, Hollister RD et al. (2006) Plant community responses to
experimental warming across the tundra biome. Proceedings of the National Academy
of Sciences of the United States of America, 103, 1342–1346.
Zavaleta ES, Shaw MR, Chiariello NR et al. (2003) Additive effects of simulated
climate changes, elevated CO2, and nitrogen deposition on grassland diversity.
Proceedings of the National Academy of Sciences of the United States of America, 100,
7650–7654.
Zhai PM, Sun AJ, Ren FM et al. (1999) Chances of climate extremes in China. Climatic
Change, 42, 203–218.
Supporting Information
Additional Supporting Information may be found in the
online version of this article:
Table S1. Species correlation matrix of the warmed plots
across the 5 years. For each species pair, the upper number is
Spearman’s rank correlation coefficient (r), and the lower
number is P value. All the correlation coefficients and the P
value (Po0.05) are showed.
Table S2. Species correlation matrix of the increased pre-
cipitation plots across the 5 years. For each species pair, the
upper number is Spearman’s rank correlation coefficient (r),
and the lower number is P value. All the correlation coeffi-
cients and the P value (Po0.05) are showed.
Please note: Wiley-Blackwell are not responsible for the con-
tent or functionality of any supporting materials supplied by
the authors. Any queries (other than missing material) should
be directed to the corresponding author for the article.
S T E P P E C O M M U N I T Y R E S P O N S E S T O C L I M AT E C H A N G E 465
r 2010 Blackwell Publishing Ltd, Global Change Biology, 17, 452–465