COMMUNITY REINVESTMENT ACT PERFORMANCE EVALUATION · Family Trust; a holding company, Maham...
27
NEW YORK STATE DEPARTMENT OF FINANCIAL SERVICES FINANCIAL FRAUDS AND CONSUMER PROTECTION DIVISION One State Street New York, NY 10004 PUBLIC SUMMARY COMMUNITY REINVESTMENT ACT PERFORMANCE EVALUATION Date of Evaluation: March 31, 2016 Institution: Habib American Bank 99 Madison Ave New York, 10016 Note: This evaluation is not an assessment of the financial condition of this institution. The rating assigned does not represent an analysis, conclusion or opinion of the New York State Department of Financial Services concerning the safety and soundness of this financial institution.
Transcript of COMMUNITY REINVESTMENT ACT PERFORMANCE EVALUATION · Family Trust; a holding company, Maham...
NEW YORK STATE
DEPARTMENT OF FINANCIAL SERVICES FINANCIAL FRAUDS AND CONSUMER PROTECTION DIVISION
One State Street
New York, NY 10004
PUBLIC SUMMARY
COMMUNITY REINVESTMENT ACT PERFORMANCE EVALUATION
Date of Evaluation: March 31, 2016
Institution: Habib American Bank 99 Madison Ave New York, 10016
Note: This evaluation is not an assessment of the financial condition of this institution. The rating assigned does not represent an analysis, conclusion or opinion of the New York State Department of Financial Services concerning the safety and soundness of this financial institution.
i
TABLE OF CONTENTS
Section
General Information ......................................................................... 1
Overview of Institution’s Performance .............................................. 2
Performance Context ........................................................................ 3
Institution Profile
Assessment Area
Demographic & Economic Data
Community Information
Performance Standards and Assessment Factors .......................... 4
Lending Test:
Loan-to-Deposit Ratio and Other Lending-Related Activities
Assessment Area Concentration
Distribution by Borrower Characteristics
Geographic Distribution of Loans
Action Taken in Response to Written Complaints with Respect
to CRA
Community Development Test:
Community Development Loans
Community Development Investments
Community Development Services
Additional Factors
Glossary ........................................................................................... 5

1 - 1
GENERAL INFORMATION This document is an evaluation of the Community Reinvestment Act (“CRA”) performance of Habib American Bank (“HAB”) prepared by the New York State Department of Financial Services (“DFS” or the “Department”). This evaluation represents the Department’s current assessment and rating of the institution’s CRA performance based on an evaluation conducted as of March 31, 2016. Section 28-b of the New York Banking Law, as amended, requires that when evaluating certain applications, the Superintendent of Financial Services shall assess a banking institution’s record of helping to meet the credit needs of its entire community, including low- and moderate-income (“LMI”) areas, consistent with safe and sound operations. Part 76 of the General Regulations of the Superintendent implements Section 28-b and further requires that the Department assess the CRA performance records of regulated financial institutions. Part 76 establishes the framework and criteria by which the Department will evaluate the performance. Section 76.5 further provides that the Department will prepare a written report summarizing the results of such assessment and will assign to each institution a numerical CRA rating based on a 1 to 4 scoring system. The numerical scores represent an assessment of CRA performance as follows:
(1) Outstanding record of meeting community credit needs;
(2) Satisfactory record of meeting community credit needs;
(3) Needs to improve in meeting community credit needs; and
(4) Substantial noncompliance in meeting community credit needs. Section 76.5 further requires that the CRA rating and the written summary (“Evaluation”) be made available to the public. Evaluations of banking institutions are primarily based on a review of performance tests and standards described in Section 76.7 and detailed in Sections 76.8 through 76.13. The tests and standards incorporate the 12 assessment factors contained in Section 28-b of the New York Banking Law. For an explanation of technical terms used in this report, please consult the GLOSSARY at the back of this document.
2 - 1
OVERVIEW OF INSTITUTION’S PERFORMANCE The Department evaluated HAB under the intermediate small banking institution performance standards in accordance with Parts 76.7 and 76.12 of the General Regulations of the Superintendent (“GRS”). The Department evaluated HAB’s performance under the lending test in calendar years 2011 through 2015, and its performance under the community development test from January 1, 2011 through March 31, 2016. HAB is rated “Satisfactory” or “2.” This rating means HAB has a satisfactory record of meeting community credit needs. The rating is based on the following factors: Lending Test: “Satisfactory” Loan-to-Deposit Ratio and Other Lending-Related Activities: “Satisfactory”
HAB’s average loan-to-deposit (“LTD”) ratio was reasonable considering its size, business strategy, financial condition and peer group activity. HAB had an average LTD ratio of 66.3% for the evaluation period. While this was below its peer group’s ratio of 77.5%, it was an improvement over HAB’s average LTD ratio of 64.8% for the prior evaluation period.
Assessment Area Concentration: “Satisfactory”
During the evaluation period, HAB originated 84.6% by number and 79.2% by dollar value of its small business loans and letters of credit (“LCs”) within its assessment area. This majority of lending inside of HAB’s assessment area reflects a reasonable concentration of lending within the assessment area.
Distribution by Borrower Characteristics: “Satisfactory”
HAB’s small business lending and LCs demonstrated a reasonable distribution of loans among businesses of different revenue sizes, considering HAB’s lending performance, business strategy and mitigating factors.
Geographic Distribution of Loans: “Satisfactory”
HAB’s origination of small business loans and LCs in census tracts of varying income levels demonstrated a reasonable distribution of lending, considering HAB’s lending performance, business strategy and mitigating factors. Action Taken in Response to Written Complaints with Respect to CRA: “Not
Rated”
Neither DFS nor HAB received any written complaints during the evaluation period
2 - 2
regarding HAB’s CRA performance.
Community Development Test: “Satisfactory” HAB’s community development performance demonstrated a reasonable level of responsiveness to the community development needs of its assessment area through community development loans, investments and services, considering HAB’s capacity and the need and availability of such opportunities for community development in its assessment area. Community Development Lending: “Outstanding” During the evaluation period, HAB originated $19.6 million in new community development loans within its assessment area and $8.5 million outside its assessment area. HAB also had $6.9 million in outstanding community development loans within its assessment area and $8.2 million in outstanding community development loans outside its assessment area. This demonstrated an excellent level of community development lending. Community Development Investments: “Satisfactory” During the evaluation period, HAB made $1.8 million in new qualified community development investments. HAB had no outstanding balances from prior evaluation periods. In addition, HAB made $0.2 million in community development grants during the evaluation period. This demonstrated a reasonable level of community development investments. Community Development Services: “Satisfactory” HAB demonstrated a reasonable level of community development services over the course of the evaluation period. This evaluation was conducted based on a review of the 12 assessment factors set forth in Section 28-b of the New York Banking Law and GRS Part 76.

3 - 1
PERFORMANCE CONTEXT Institution Profile Chartered in 1983, HAB is a privately-held, multistate full-service commercial bank headquartered at 99 Madison Avenue, New York, NY. HAB operates seven branches in three states as follows: one branch in New Jersey, two branches in California and four branches in New York. HAB is majority owned (approximately 75%) by the Habib Family Trust; a holding company, Maham Beteiligungsgesellschaft AG, Zurich Switzerland, owns approximately 25% of HAB. HAB’s loan portfolio consists largely of commercial mortgage loans. However, HAB also specializes in international trade finance by providing trade financing to small and mid-sized businesses, which are mostly family-owned and employ two to fifteen employees. These businesses are located in the United States and they export or import goods from countries including Pakistan, India, Sri Lanka, Bangladesh, Nepal and Kenya. HAB also operates an International Banking Facility that provides correspondent services to international banks. HAB also offers traditional banking services that include direct deposit, mobile banking, online-banking, 24-hour telephone banking, safe-deposit boxes and remote-deposit capture. HAB offers deposit and lending products such as personal and business deposit accounts, Visa debit and credit cards, asset-based loans, residential real estate loans, commercial mortgages and small business loans. Per the Consolidated Report of Condition (“Call Report”) as of March 31, 2016, filed with the Federal Deposit Insurance Corporation (“FDIC”), HAB reported total assets of $1.1 billion, of which $613.2 million were net loans and lease financing receivables. It also reported total deposits of $940.4 million, resulting in a loan-to-deposit ratio of 65.2%. According to the latest available comparative deposit data as of June 30, 2015, HAB had a market share of 0.04%, or $417.0 million in a market of $1.0 trillion, ranking it 58th among 112 deposit-taking institutions in the assessment area. The following is a summary of HAB’s loan portfolio, based on Schedule RC-C of the bank’s December 31, 2013, 2014, 2015 and March 31, 2016 Call Reports:
$000's % $000's % $000's % $000's %1-4 Family Residential Mortgage Loans 41,215 9.2 42,332 8.6 63,714 10.9 53,458 9.1Commercial & Industrial Loans 60,832 13.6 66,833 13.5 60,534 10.3 64,251 11.0Multifamily ( 5 or more) 0 0.0 0 0.0 0 0.0 26,107 4.5Commercial Mortgage Loans 318,654 71.1 356,290 72.2 442,291 75.6 440,328 75.2Consumer Loans 11,738 2.6 12,358 2.5 6,840 1.2 6,575 1.1Construction Loans 1,548 0.3 1,477 0.3 1,052 0.2 1,042 0.2Loans to Banks in Foreign Countries 14,015 3.1 14,024 2.8 10,753 1.8 11,725 2.0Total Gross Loans 448,002 493,314 585,184 603,486
TOTAL GROSS LOANS OUTSTANDING2015
Loan Type2013 2014 3/31/2016

3 - 2
As illustrated in the above table, HAB is primarily a commercial lender, with 75.2% and 11.0% of its loan portfolio in commercial mortgages and commercial and industrial loans, respectively, as of March 31, 2016. HAB operates four branches in New York. They are in Manhattan (1), Queens (2), and Hicksville, Nassau County (1). The branch offices are supplemented by an automated teller machine (“ATM”) network consisting of deposit-taking ATMs at each branch office. Branch hours are 9:00 am to 3:30 or 4:00 pm, Monday through Friday. In addition, all branches except the main branch offer Saturday hours. The main branch is in an upper-income census tract in Manhattan. Examiners did not find evidence of financial or legal impediments that had an adverse impact on HAB’s ability to meet the credit needs of its community. Assessment Area HAB’s assessment area is comprised of the following partial counties: New York, Queens and Nassau. There are 505 census tracts in the area, of which 18 are low-income, 140 are moderate-income, 233 are middle-income, 96 are upper-income and 18 tracts have no income indicated.
County N/A Low Mod Middle Upper Total LMI %New York* 4 2 4 6 47 63 9.5Nassau* 0 2 3 34 14 53 9.4Queens* 14 14 133 193 35 389 37.8Total 18 18 140 233 96 505 31.3
Assessment Area Census Tracts by Income Level
* Partial county
Demographic & Economic Data The assessment area had a population of 1,846,088 during the evaluation period. About 11.9% of the population were over the age of 65 and 16.8% were under the age of sixteen. Of the 408,049 families in the assessment area, 24.6% were low-income, 18.2% were moderate-income, 19.6% were middle-income, and 37.6% were upper-income. There were 688,791 households in the assessment area, of which 11.6% had income below the poverty level and 2.2% were on public assistance. The weighted average of median family income in the assessment area was $76,146.
3 - 3
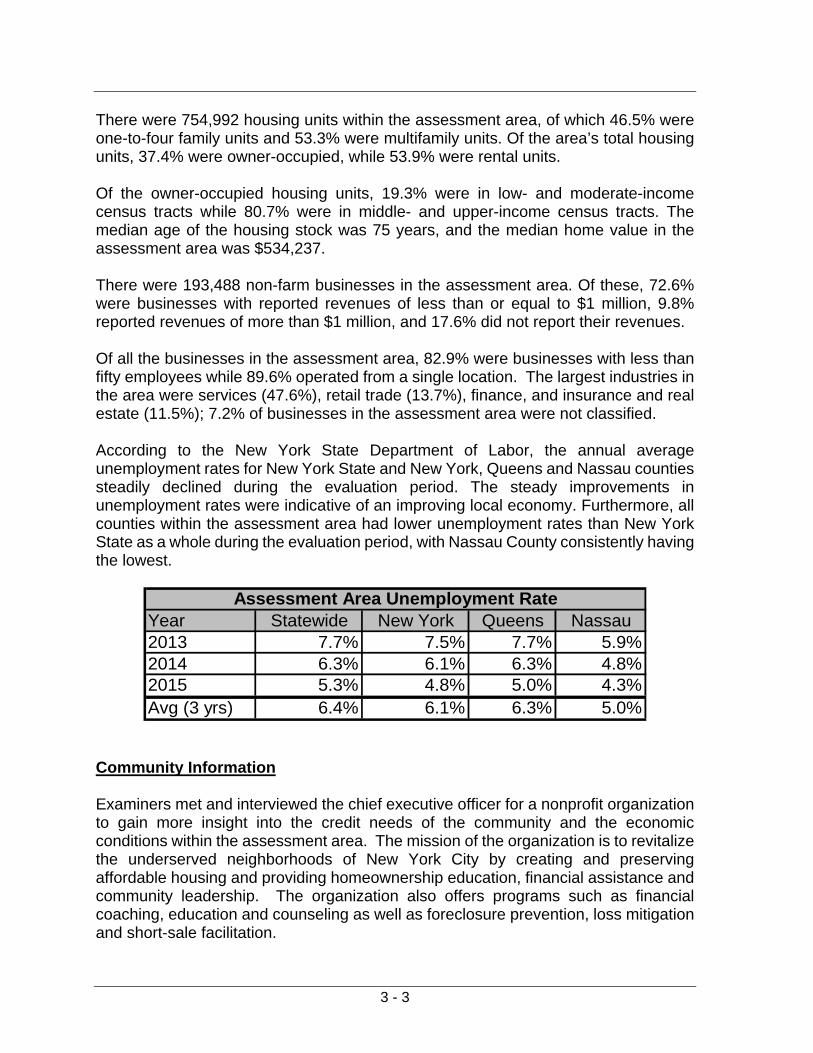
There were 754,992 housing units within the assessment area, of which 46.5% were one-to-four family units and 53.3% were multifamily units. Of the area’s total housing units, 37.4% were owner-occupied, while 53.9% were rental units. Of the owner-occupied housing units, 19.3% were in low- and moderate-income census tracts while 80.7% were in middle- and upper-income census tracts. The median age of the housing stock was 75 years, and the median home value in the assessment area was $534,237. There were 193,488 non-farm businesses in the assessment area. Of these, 72.6% were businesses with reported revenues of less than or equal to $1 million, 9.8% reported revenues of more than $1 million, and 17.6% did not report their revenues. Of all the businesses in the assessment area, 82.9% were businesses with less than fifty employees while 89.6% operated from a single location. The largest industries in the area were services (47.6%), retail trade (13.7%), finance, and insurance and real estate (11.5%); 7.2% of businesses in the assessment area were not classified. According to the New York State Department of Labor, the annual average unemployment rates for New York State and New York, Queens and Nassau counties steadily declined during the evaluation period. The steady improvements in unemployment rates were indicative of an improving local economy. Furthermore, all counties within the assessment area had lower unemployment rates than New York State as a whole during the evaluation period, with Nassau County consistently having the lowest.
Year Statewide New York Queens Nassau2013 7.7% 7.5% 7.7% 5.9%2014 6.3% 6.1% 6.3% 4.8%2015 5.3% 4.8% 5.0% 4.3%Avg (3 yrs) 6.4% 6.1% 6.3% 5.0%
Assessment Area Unemployment Rate
Community Information Examiners met and interviewed the chief executive officer for a nonprofit organization to gain more insight into the credit needs of the community and the economic conditions within the assessment area. The mission of the organization is to revitalize the underserved neighborhoods of New York City by creating and preserving affordable housing and providing homeownership education, financial assistance and community leadership. The organization also offers programs such as financial coaching, education and counseling as well as foreclosure prevention, loss mitigation and short-sale facilitation.
3 - 4
The community contact noted the need for continued investment in affordable housing as well as the need for emergency repair funding for older housing stock in low- and moderate-income neighborhoods. The contact also commented on the growth in the senior population and the need for more community services and affordable housing as well as offering education to seniors regarding reverse mortgages and options. The contact pointed out home buying programs that provide down payment and closing cost assistance to low- and moderate-income borrowers. While these programs have helped many individuals, the contact cited the continued need for such support from both the private and public sectors to fund affordable housing programs and projects. HAB was mentioned in a positive context during the interview.
4 - 1
PERFORMANCE STANDARDS AND ASSESSMENT FACTORS
HAB was evaluated under the intermediate small banking institution performance standards in accordance with Parts 76.7 and 76.12 of the GRS, which consist of the lending test and the community development test. The lending test includes:
1. Loan-to-deposit ratio and other lending-related activities; 2. Assessment area concentration; 3. Distribution by borrower characteristics; 4. Geographic distribution of loans; and 5. Action taken in response to written complaints regarding CRA.
The community development test includes:
1. Community development lending; 2. Community development investments; 3. Community development services; and 4. Responsiveness to community development needs.
DFS also considered the following factors in assessing the bank’s record of performance:
1. The extent of participation by the board of directors or board of trustees in formulating CRA policies and reviewing CRA performance;
2. Any practices intended to discourage credit applications; 3. Evidence of prohibited discriminatory or other illegal credit practices; 4. Record of opening and closing offices and providing services at offices; and 5. Process factors, such as activities to ascertain credit needs and the extent of
marketing and special credit related programs. DFS derived statistics employed in this evaluation from various sources. HAB submitted bank-specific information both as part of the examination process and on its Call Reports submitted to the FDIC. DFS obtained aggregate lending data from the Federal Financial Institutions Examination Council (“FFIEC”) and deposit data from the FDIC. DFS calculated LTD ratios from information shown in the Bank’s Uniform Bank Performance Report, as submitted to the FDIC. DFS derived the demographic data referred to in this report from the 2010 U.S. Census and the FFIEC. DFS based business data on Dun & Bradstreet reports, which Dun & Bradstreet update annually. DFS obtained unemployment data from the New York State Department of Labor. Some non-specific bank data are only available on a county-wide basis, and DFS used this information even though the institution’s assessment area includes partial counties. The assessment period included calendar years 2013, 2014, 2015 for small business and letters of credit (“LCs”), while community development activities where evaluated through

4 - 2
the first quarter of 2016. HAB requested that examiners consider its LCs in addition to its small business loans in evaluating factors (2), (3), and (4) of the lending test described above. At its prior Performance Evaluation, as of December 31, 2012, DFS assigned HAB a rating of “2,” or “Satisfactory,” meaning HAB had a satisfactory record of meeting community credit needs. Current CRA Rating: “Satisfactory” Lending Test: “Satisfactory” HAB’s small business lending and letters of credit activities were reasonable considering its size, business strategy and financial condition as well as peer group activity, demographic characteristics, and the credit needs of its assessment area. Loan-to-Deposit Ratio and other Lending-Related Activities: “Satisfactory” HAB’s average LTD ratio was reasonable considering its size, business strategy, financial condition and peer group activity. HAB had an average LTD ratio of 66.3% for the evaluation period. While this was below its peer group’s ratio of 77.5%, it was an improvement over HAB’s average LTD ratio of 64.8% during the prior evaluation period. HAB’s average LTD ratio was lower than its peer group due mainly to HAB holding large deposits for foreign banks as a part of its correspondent banking services for financial institutions worldwide. In addition, HAB has off-balance sheet credit activities, as it offers LCs to import/export businesses, which are not reflected in its LTD ratios. Considering these factors HAB’s average LTD ratio was deemed reasonable. The table below shows HAB’s LTD ratios in comparison with its peer group’s ratios for the 12 quarters since the prior evaluation.
2013 Q1
2013 Q2
2013Q3
2013Q4
2014Q1
2014Q2
2014Q3
2014Q4
2015 Q1
2015 Q2
2015 Q3
2015 Q4
Avg.
Bank 67.3 73.1 67.9 64.0 66.3 66.2 62.7 66.2 59.4 65.2 69.4 68.2 66.3
Peer 73.2 74.8 75.1 75.8 74.8 77.0 77.6 78.3 78.9 81.0 81.7 82.0 77.5
Loan-to-Deposit Ratios
4 - 3
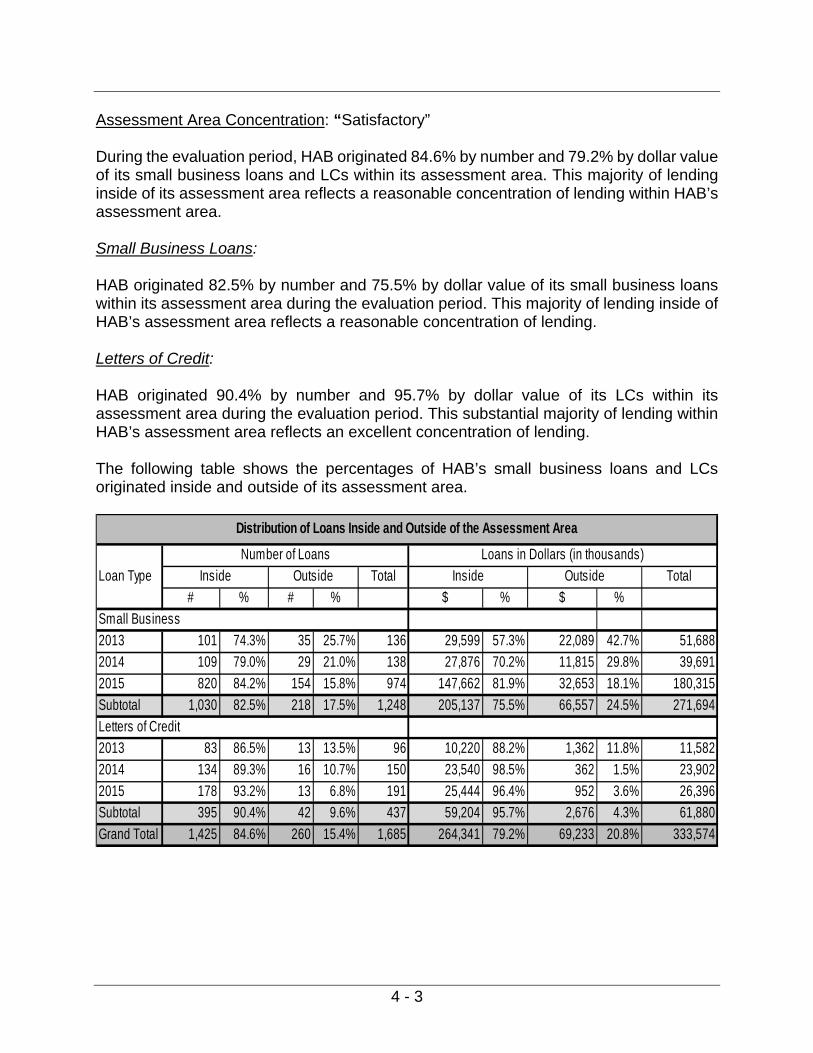
Assessment Area Concentration: “Satisfactory” During the evaluation period, HAB originated 84.6% by number and 79.2% by dollar value of its small business loans and LCs within its assessment area. This majority of lending inside of its assessment area reflects a reasonable concentration of lending within HAB’s assessment area. Small Business Loans: HAB originated 82.5% by number and 75.5% by dollar value of its small business loans within its assessment area during the evaluation period. This majority of lending inside of HAB’s assessment area reflects a reasonable concentration of lending. Letters of Credit: HAB originated 90.4% by number and 95.7% by dollar value of its LCs within its assessment area during the evaluation period. This substantial majority of lending within HAB’s assessment area reflects an excellent concentration of lending. The following table shows the percentages of HAB’s small business loans and LCs originated inside and outside of its assessment area.
Loan Type Total Total
# % # % $ % $ %
Small Business
2013 101 74.3% 35 25.7% 136 29,599 57.3% 22,089 42.7% 51,688
2014 109 79.0% 29 21.0% 138 27,876 70.2% 11,815 29.8% 39,691
2015 820 84.2% 154 15.8% 974 147,662 81.9% 32,653 18.1% 180,315
Subtotal 1,030 82.5% 218 17.5% 1,248 205,137 75.5% 66,557 24.5% 271,694
Letters of Credit
2013 83 86.5% 13 13.5% 96 10,220 88.2% 1,362 11.8% 11,582
2014 134 89.3% 16 10.7% 150 23,540 98.5% 362 1.5% 23,902
2015 178 93.2% 13 6.8% 191 25,444 96.4% 952 3.6% 26,396
Subtotal 395 90.4% 42 9.6% 437 59,204 95.7% 2,676 4.3% 61,880
Grand Total 1,425 84.6% 260 15.4% 1,685 264,341 79.2% 69,233 20.8% 333,574
Distribution of Loans Inside and Outside of the Assessment Area
Number of Loans Loans in Dollars (in thousands)
Inside Outside Inside Outside
4 - 4
Distribution by Borrower Characteristics: “Satisfactory” HAB’s small business lending and LCs demonstrated a reasonable distribution of loans among businesses of different revenue sizes, considering HAB’s lending performance, business strategy, and the mitigating factors noted. HAB’s lending rate by dollar value of loans to small businesses with revenue of $1 million or less was comparable with the aggregate’s rate and the business demographics for 2013. However, HAB’s rates of lending underperformed the aggregate and the business demographics by number and dollar value of loans for years 2014 and 2015. Thus, HAB’s average rates of lending for the evaluation period of 6.7% by number and 11.9% by dollar value of loans were well below the aggregate’s rates of 41.5% and 26.1%, respectively. While HAB’s lending to small businesses with revenue of $1 million or less was below the aggregate’s rates, examiners considered the type of businesses (import/export with few employees) to which HAB primarily lends. These businesses may have revenues greater than $1 million, but operate on thin profit margins with high transaction volumes. HAB also made 18.9% by number and 19.1% by dollar value of its small business loans and LCs to businesses with unknown revenue. This is the direct result of HAB’s policy of not using business revenue in the underwriting process if the loan is cash collateralized (usually by certificates of deposit). The high level of loans and LCs with unknown income skewed the lending by revenue analysis. Furthermore, HAB originated many of the small business loans and letters of credit to the same borrowers. For example, 466 loans or 37.3% of loans by number and $52.4 million or 19.3% by dollar value were made to eight borrowers, which also skewed the analysis. Many of the businesses HAB lends to are family-owned and have fewer than fifteen employees and would be considered small businesses under the U.S. Small Business Administration’s size standards if the number of employees were considered. Therefore, examiners also analyzed the size of the loans and letters of credit made to these businesses. The review revealed that 53.7% by number and 13.1% of by dollar value of loans and LCs were made in the amount of $100,000 or less. Furthermore, loans and LCs in the amount of $250,000 or less accounted for 79.3% by number and 34.3% by dollar value of HAB’s loans and LCs. The following table provides a summary of HAB’s small business lending distribution based on revenue size during the evaluation period:

4 - 5
Rev. Size Bus.Dem.# % $000's % # % $000's % %
Rev. < = $1MM 21 11.4% 11,237 28.2% 24,379 41.4% 687,272 29.0% 69.9%Rev. > $1MM 94 51.1% 13,418 33.7% 8.2%Rev. Unknown 69 37.5% 15,164 38.1% 21.8%
Total 184 39,819 58,886 2,373,040
Rev. Size Bus.Dem.# % $000's % # % $000's % %
Rev. < = $1MM 2 0.8% 626 1.2% 25,476 38.4% 646,265 26.1% 69.6%Rev. > $1MM 94 38.7% 23,138 45.0% 9.0%Rev. Unknown 147 60.5% 27,652 53.8% 21.4%
Total 243 51,416 66,394 2,472,598
Rev. Size Bus.Dem.# % $000's % # % $000's % %
Rev. < = $1MM 51 5.1% 12,841 7.4% 31,836 44.5% 565,935 23.3% 72.6%Rev. > $1MM 893 89.5% 152,606 88.2% 9.8%Rev. Unknown 54 5.4% 7,659 4.4% 17.6%
Total 998 173,106 71,496 2,433,056
Rev. Size Bus.Dem.# % $000's % # % $000's % %
Rev. < = $1MM 74 5.2% 24,704 9.3% 81,691 41.5% 1,899,472 26.1%Rev. > $1MM 1,081 75.9% 189,162 71.6% - Rev. Unknown 270 18.9% 50,475 19.1% 0
Total 1,425 264,341 196,776 7,278,694
Bank AggregateGRAND TOTAL
Bank Aggregate
Distribution of Small Business Lending and Letters of Credit by Revenue Size of Business
Bank Aggregate
2013
Bank Aggregate
2014
2015
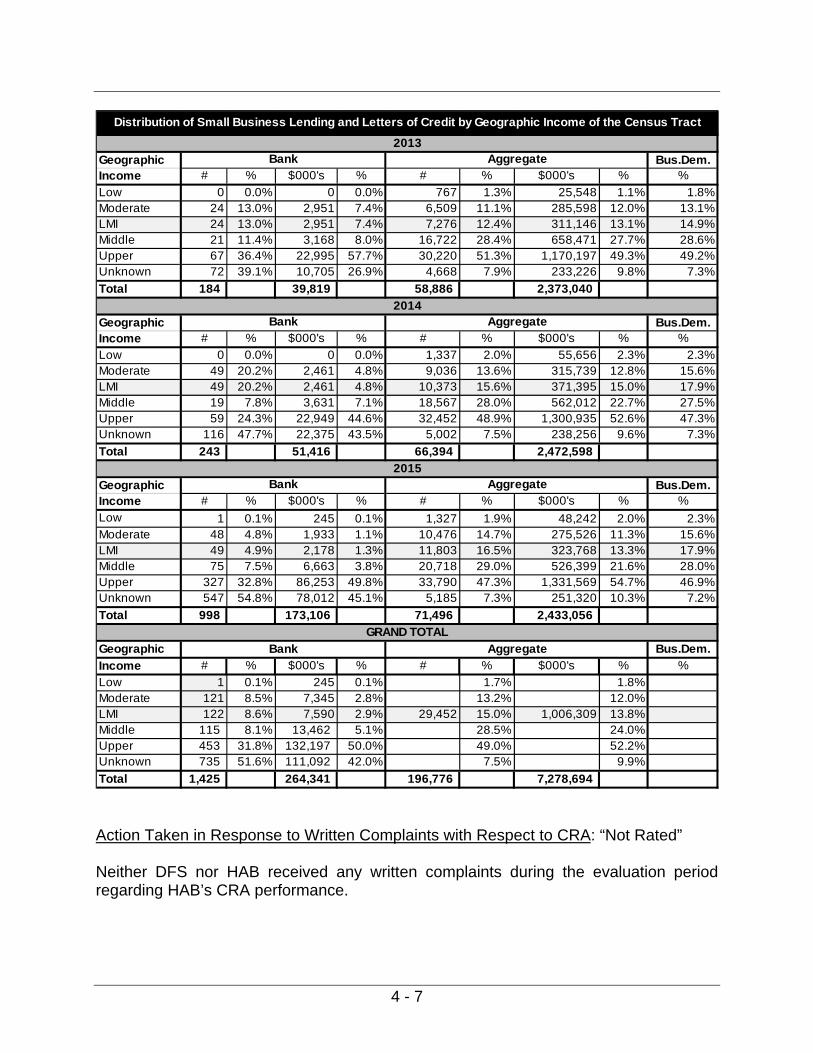
Geographic Distribution of Loans: “Satisfactory” HAB’s origination of small business loans and LCs in census tracts of varying income levels demonstrated a reasonable distribution of lending, considering HAB’s lending performance, business strategy, and the mitigating factors noted. HAB’s rates of lending in LMI geographies exceeded the aggregate’s rates by number of loans in 2013 and 2014, while it trailed the aggregate’s rates by dollar value of loans. In 2015, HAB trailed the aggregate’s rates by number and dollar value of loans in LMI geographies. HAB did not originate any loans or LCs in low-income census tracts in 2013 and 2014 and only one loan in a low-income census tract in 2015. As a result, HAB’s average rates

4 - 6
of lending of 0.1% by number and 0.1% by dollar value of loans in low-income census tracts for the evaluation period trailed the aggregate’s rates of 1.7% and 1.8%, respectively. HAB’s low rates of lending in low-income census tracts were due in part to the limited lending opportunities within its assessment area, which are highlighted by the following factors: the aggregate’s low lending rates, the low percentage (1.8%-2.3%) of small businesses (business demographic) located in low-income census tracts, and the small number of low-income census tracts (5), which make up only 3.6% of all the census tracts within its assessment area. HAB’s average rates of lending in moderate-income census tracts of 8.6% by number and 2.9% by dollar value of loans for the evaluation period trailed the aggregate’s rates of 15.0% and 13.8%, respectively. HAB’s rates of lending in moderate-income census tracts by number of loans exceeded the aggregate’s rates, as well as the business demographics in 2013 and 2014, but trailed the aggregate’s rates and the business demographics by dollar value of loans. In 2015, HAB’s rates of lending in moderate-income census tracts trailed the aggregate’s rates and the business demographics by number of loans and dollar value of loans. HAB’s annual loan volume significantly increased during the evaluation period from 184 loans in 2013, to 234 loans in 2014, to 998 loans in 2015. As HAB’s loan volume increased so did the number of loans in census tracts with unknown income. HAB originated 735, or 51.6%, of its loans during the evaluation period in census tracts with unknown income. HAB also originated many loans to the same borrowers. Examiners noted that 466 loans, (37.3% by number) for $52.4 million (19.8% by dollar value) were made to eight borrowers located in census tracts with unknown income. The significant number of loans in census tracts with unknown income combined with the large number of loans made to the same borrowers significantly skewed the geographic distribution analysis. The following table provides a summary of the distribution of HAB’s small business loans by income level of the geography where the business was located.
4 - 7
Geographic Bus.Dem.Income # % $000's % # % $000's % %
Low 0 0.0% 0 0.0% 767 1.3% 25,548 1.1% 1.8%Moderate 24 13.0% 2,951 7.4% 6,509 11.1% 285,598 12.0% 13.1%LMI 24 13.0% 2,951 7.4% 7,276 12.4% 311,146 13.1% 14.9%Middle 21 11.4% 3,168 8.0% 16,722 28.4% 658,471 27.7% 28.6%Upper 67 36.4% 22,995 57.7% 30,220 51.3% 1,170,197 49.3% 49.2%Unknown 72 39.1% 10,705 26.9% 4,668 7.9% 233,226 9.8% 7.3%
Total 184 39,819 58,886 2,373,040
Geographic Bus.Dem.Income # % $000's % # % $000's % %
Low 0 0.0% 0 0.0% 1,337 2.0% 55,656 2.3% 2.3%Moderate 49 20.2% 2,461 4.8% 9,036 13.6% 315,739 12.8% 15.6%LMI 49 20.2% 2,461 4.8% 10,373 15.6% 371,395 15.0% 17.9%Middle 19 7.8% 3,631 7.1% 18,567 28.0% 562,012 22.7% 27.5%Upper 59 24.3% 22,949 44.6% 32,452 48.9% 1,300,935 52.6% 47.3%Unknown 116 47.7% 22,375 43.5% 5,002 7.5% 238,256 9.6% 7.3%
Total 243 51,416 66,394 2,472,598
Geographic Bus.Dem.Income # % $000's % # % $000's % %
Low 1 0.1% 245 0.1% 1,327 1.9% 48,242 2.0% 2.3%Moderate 48 4.8% 1,933 1.1% 10,476 14.7% 275,526 11.3% 15.6%LMI 49 4.9% 2,178 1.3% 11,803 16.5% 323,768 13.3% 17.9%Middle 75 7.5% 6,663 3.8% 20,718 29.0% 526,399 21.6% 28.0%Upper 327 32.8% 86,253 49.8% 33,790 47.3% 1,331,569 54.7% 46.9%Unknown 547 54.8% 78,012 45.1% 5,185 7.3% 251,320 10.3% 7.2%
Total 998 173,106 71,496 2,433,056
Geographic Bus.Dem.
Income # % $000's % # % $000's % %
Low 1 0.1% 245 0.1% 3,431 1.7% 129,446 1.8%Moderate 121 8.5% 7,345 2.8% 26,021 13.2% 876,863 12.0%LMI 122 8.6% 7,590 2.9% 29,452 15.0% 1,006,309 13.8%Middle 115 8.1% 13,462 5.1% 56,007 28.5% 1,746,882 24.0%Upper 453 31.8% 132,197 50.0% 96,462 49.0% 3,802,701 52.2%Unknown 735 51.6% 111,092 42.0% 14,855 7.5% 722,802 9.9%
Total 1,425 264,341 196,776 7,278,694
Bank Aggregate
GRAND TOTAL
Bank Aggregate
Distribution of Small Business Lending and Letters of Credit by Geographic Income of the Census Tract
Bank Aggregate
2013
Bank Aggregate
2014
2015
Action Taken in Response to Written Complaints with Respect to CRA: “Not Rated” Neither DFS nor HAB received any written complaints during the evaluation period regarding HAB’s CRA performance.
4 - 8
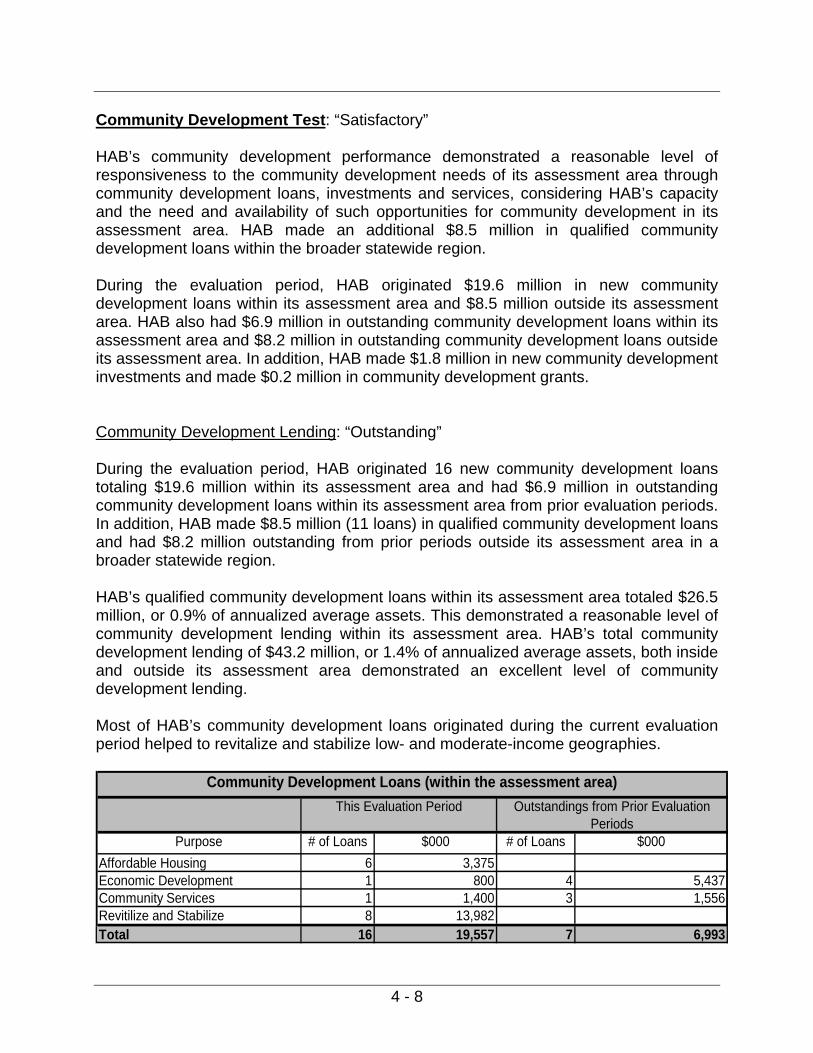
Community Development Test: “Satisfactory” HAB’s community development performance demonstrated a reasonable level of responsiveness to the community development needs of its assessment area through community development loans, investments and services, considering HAB’s capacity and the need and availability of such opportunities for community development in its assessment area. HAB made an additional $8.5 million in qualified community development loans within the broader statewide region. During the evaluation period, HAB originated $19.6 million in new community development loans within its assessment area and $8.5 million outside its assessment area. HAB also had $6.9 million in outstanding community development loans within its assessment area and $8.2 million in outstanding community development loans outside its assessment area. In addition, HAB made $1.8 million in new community development investments and made $0.2 million in community development grants. Community Development Lending: “Outstanding” During the evaluation period, HAB originated 16 new community development loans totaling $19.6 million within its assessment area and had $6.9 million in outstanding community development loans within its assessment area from prior evaluation periods. In addition, HAB made $8.5 million (11 loans) in qualified community development loans and had $8.2 million outstanding from prior periods outside its assessment area in a broader statewide region. HAB’s qualified community development loans within its assessment area totaled $26.5 million, or 0.9% of annualized average assets. This demonstrated a reasonable level of community development lending within its assessment area. HAB’s total community development lending of $43.2 million, or 1.4% of annualized average assets, both inside and outside its assessment area demonstrated an excellent level of community development lending. Most of HAB’s community development loans originated during the current evaluation period helped to revitalize and stabilize low- and moderate-income geographies.
Purpose # of Loans $000 # of Loans $000
Affordable Housing 6 3,375Economic Development 1 800 4 5,437Community Services 1 1,400 3 1,556Revitilize and Stabilize 8 13,982Total 16 19,557 7 6,993
Community Development Loans (within the assessment area)
This Evaluation Period Outstandings from Prior Evaluation Periods

4 - 9
Purpose # of Loans $000 # of Loans $000Affordable Housing 1 261Economic Development 1 2100 6 3460Community ServicesRevitilize and Stabilize 9 6,438 6 4,459Total 10 8,538 13 8,180
This Evaluation Period Outstandings from Prior Evaluation Periods
Community Development Loans (Statewide Region)
Below are highlights of HAB’s community development loans:
In 2014, HAB originated a $1.4 million loan to purchase a two-story retail/office building located in a moderate-income census tract in the Richmond Hill Section of Queens, NY. The property is leased to a state funded nonprofit child protective agency focusing on protecting children and youth at risk for abuse or neglect.
In 2015, HAB Bank refinanced a $4 million commercial mortgage for a one-story multi-retail shopping center. The center contains 28,000 square feet of rentable retail space and is in a moderate-income census tract in Nassau County, NY. The loan helped to stabilize the census tract by retaining jobs.
In 2015, HAB made a $780,000 commercial mortgage loan to refinance a multifamily apartment building in a moderate-income census tract in Corona, NY. The property contains six three-bedroom apartments with rents ranging from $1,325 to $1,725, all under the HUD fair market rental guidelines of $1,904 per month.
In 2015, HAB originated a $612,500 commercial mortgage for a two-story office building located in a moderate-income census tract in Astoria, NY. The property has a total of 4,500 square feet and consists of a warehouse on the first floor and offices on the second floor. The property is occupied by a construction business that has four employees.
In 2016, HAB refinanced a $1.4 million commercial mortgage loan for a one-story commercial property that contains two retail stores. The property is in a moderate-income census tract in Richmond Hill, NY.
Community Development Investments: “Satisfactory” During the evaluation period, HAB made $1.8 million in new qualified community development investments and had none outstanding from prior evaluation periods. In

4 - 10
addition, HAB made $216,900 in community development grants. This demonstrated a reasonable level of community development investments.
CD Investments # of Inv. $000 # of Inv. $000Affordable HousingEconomic DevelopmentCommunity Services 16 1,800 Other (Please Specify)Total 16 1,800 0 0
Community Development Investments and GrantsThis Evaluation Period Outstandings from Prior
Evaluation Periods
CD Grants # of Grants $000 Affordable Housing 6 86 Economic Development 16 68 Community Services 11 63 Other (Please Specify)Total 33 217
Not A
pplic
able
Below are highlights of HAB’s community development investments and grants: Investments HAB’s $1.8 million in investments consisted of deposits and renewal of deposits in various U.S Treasury Department Certified Community Development Financial Institutions. Grants
HAB donated $55,000 to a citywide, not-for-profit community organization that creates opportunities for low- and moderate-income people to live in affordable homes in safe and sustainable neighborhoods in New York City, and promotes self-reliance through resident-led community organizations.
HAB made various grants totaling $30,400 to the Federal Home Loan Bank of New
York’s (“FHLBNY”) Affordable Housing Program (“AHP”). Each year the FHLBNY sets aside 10% of its earnings to support the creation and preservation of housing for low-income families and individuals through its AHP. The $30,400 donated by HAB represented the bank’s earnings based on their membership shares in the FHLBNY.
HAB contributed $15,000 over a three-year period to an organization that supports
small business owners in communities with limited resources in New York City. The organization provides micro-loans, business development services, and networking opportunities.
HAB made various grants totaling $15,000 to an organization that assists
4 - 11
disadvantaged small businesses in low-income communities through technical assistance and access to capital. The organization, by supporting economic development and entrepreneurship, helps to stabilize and revitalize communities.
Community Development Services: “Satisfactory” HAB demonstrated an adequate level of community development services over the course of the evaluation period. Members of management and employees participated in financial education and literacy programs, and actively served on committees of local organizations. Below are examples of HAB’s community development services:
During the evaluation period, HAB participated in the “National Teach Children to Save Day” program sponsored by the American Bankers Association (“ABA”). Representatives from HAB taught the importance of saving money to students at a public school in Jackson Heights, New York. The majority of the students at the school were eligible for the free or reduced-price lunch program.
HAB employees participated in financial literacy education classes hosted by local
community service organizations.
A senior executive vice president of HAB serves on the advisory committee of a not-for-profit organization whose mission is to provide services to victims of domestic abuse and their children.
A senior executive vice president is a member of the Community and Economic Development Committee (“CEDC”) of the ABA. The CEDC serves as an advisory committee to the ABA and its member banks. It assists the banks in finding constructive methods to encourage and promote lending and investments in their communities. The CEDC also provides information on housing, small business lending, and financial education.
Responsiveness to Community Development Needs: HAB demonstrated an adequate level of responsiveness to credit and community development needs. Additional Factors The extent of participation by the banking institution’s Board of Directors or Board of Trustees in formulating the banking institution’s policies and reviewing its performance with respect to the purposes of the CRA.

4 - 12
The board of directors of HAB has appointed a CRA Officer to monitor the bank’s compliance with CRA. HAB has a CRA committee, whose members include the president and CEO, the senior credit officer, the CRA Officer, and other members of senior management. The committee meets on a quarterly basis. A third-party vendor annually conducts a CRA performance evaluation of HAB and the results are submitted to the board and the CRA committee for review. Discrimination and other illegal practices
- Any practices intended to discourage applications for types of credit set forth in the banking institution’s CRA Public File.
DFS did not note any practices by HAB intended to discourage applications for the types of credit offered by the institution.
- Evidence of prohibited discriminatory or other illegal credit practices.
DFS did not note any evidence of prohibited discriminatory or other illegal practices by HAB.
Record of opening and closing offices and providing services at offices HAB did not open or close any branch office during the evaluation period. HAB’s banking hours are from 9:00 am to either 3:30 pm or 4:00 pm Monday through Friday. All branches except for the main office, offer Saturday hours. In addition to offering a variety of deposit and lending products for both consumer and commercial customers, HAB also offers online banking services, online bill-pay, telephone banking, remote-deposit capture, and business online payroll services.
LMI and
N/A Low Moderate Middle Upper Total LMI Distressed or
# # # # # # % Underserved
Nassau* 1 1 100% 100%
New York* 1 1 0% 0%
Queens* 2 2 100% 100%
Total - - 3 - 1 4 75% 75%
Distribution of Branches within the Assessment Area
County
*Partial County
Process Factors - Activities conducted by the banking institution to ascertain the credit needs of its
community, including the extent of the banking institution’s efforts to communicate with members of its community regarding the credit services being provided by the

4 - 13
banking institution. HAB ascertains the credit needs of its community through community outreach efforts including regular client meetings, participation on advisory boards with a focus on community development issues, participation on the boards and committees of local and national nonprofit organizations, and attending and sponsoring local community events. In addition, HAB appointed a senior officer to coordinate business development between the client base of its various branches and develop new lending opportunities for the bank. - The extent of the banking institution’s marketing and special credit-related programs
to make members of the community aware of the credit services offered by the banking institution
HAB’s client base includes a niche of small businesses primarily owned and operated by members of the South Asian community. Bank employees actively participate in community events and social gatherings, providing them the opportunity to discuss the services and products offered by the bank. HAB also advertises its services and products in various Asian-American community-based publications. Other factors that in the judgment of the Superintendent bear upon the extent to which a banking institution is helping to meet the credit needs of its entire community None noted
5 - 1
GLOSSARY Aggregate Penetration Rate The number of loans originated and purchased by all reporting lenders in specified categories as a percentage of the aggregate number of loans originated and purchased by all reporting lenders in the assessment area. Community Development “Community development”: 1. Affordable housing (including multifamily housing) for low- or moderate-income (“LMI”)
individuals; 2. Community services targeted to LMI individuals; 3. Activities that promote economic development by financing business or farms that
meet the size eligibility standards of the United States Small Business Administration (“SBA”) Development Company or Small Business Investment Company programs, or have gross annual incomes of $1 million or less;
4. Activities that revitalize or stabilize LMI geographies; and 5. Activities that seek to prevent defaults and/or foreclosures in loans included in (1) and
(3) above. Community Development Loan A loan that has its primary purpose community development. This includes but is not limited to loans to: Borrowers for affordable housing rehabilitation and construction, including
construction and permanent financing for multifamily rental property serving low or moderate income (“LMI”) persons;
Nonprofit organizations serving primarily LMI or other community development needs; Borrowers to construct or rehabilitate community facilities that are located in LMI areas
or that primarily serve LMI individuals; Financial intermediaries including community development financial institutions,
community development corporations, minority- and women-owned financial institutions, community loan funds or pools, micro-finance institutions, and low-income or community development credit unions that primarily lend or facilitate lending to promote community development;
Local, state and tribal governments for community development activities; and Borrowers to finance environmental clean up or redevelopment of an industrial site as
part of an effort to revitalize the LMI community in which the property is located.

5 - 2
Community Development Service Service that has community development as its primary purpose, is related to the provision of financial services, and has not been considered in the evaluation of the banking institution's retail banking services. This includes but is not limited to:
Providing technical assistance on financial matters to nonprofit, tribal or government
organizations serving LMI housing or economic revitalization and development needs; Providing technical assistance on financial matters to small businesses or community
development organizations; Lending employees to provide financial services for organizations facilitating
affordable housing construction and rehabilitation or development of affordable housing;
Providing credit counseling, home buyers and home maintenance counseling, financial planning or other financial services education to promote community development and affordable housing;
Establishing school savings programs for LMI individuals; Providing seminars for LMI persons on banking and bank account record-keeping; Making ATM “Training Machines” available for extended periods at LMI community
sites or at community facilities that serve LMI individuals; and Technical assistance activities to community development organizations such as: Serving on a loan review committee; Developing loan application and underwriting standards; Developing loan processing systems; Developing secondary market vehicles or programs; Assisting in marketing financial services, including the development of advertising
and promotions, publications, workshops and conferences; Furnishing financial services training for staff and management; Contributing accounting/bookkeeping services; and Assisting in fund raising, including soliciting or arranging investments.
Geography A census tract delineated by the United States Bureau of the Census in the most recent decennial census Home Mortgage Disclosure Act (“HMDA”) The Home Mortgage Disclosure Act, enacted by Congress in 1975, and subsequently amended, requires institutions to annually report data about applications for residential (including multifamily) financing. Income Level

5 - 3
The income level for borrowers is based on household or family income. A geography’s income is categorized by median family income for the geography. In both cases, the income is compared to the MSA or statewide nonmetropolitan median income.
Income level of individual or geography % of the area median income Low-income Less than 50Moderate-income At least 50 and less than 80 Middle-income At least 80 and less than 120 Upper-income 120 or more
Small Business Loan A small business loan is a loan less than or equal to $1 million. Low or Moderate Income (“LMI”) Geographies Those census tracts or block numbering areas where, according to the 2000 U.S. Census, the median family income is less than 80% of the area median family income. In the case of tracted areas that are part of a Metropolitan Statistical Area (“MSA”) or Primary Metropolitan Statistical Area (“PMSA”), this would relate to the median family income for the MSA or PMSA in which the tracts are located. In the case of BNAs and tracted areas that are not part of a MSA or PMSA, the area median family income would be the statewide non-metropolitan median family income. LMI Borrowers Borrowers whose income, as reported on the loan application which the lender relied upon in making the credit decision, is less than 80% of the area median family income. In cases where the residential property is located in a MSA or PMSA, this would relate to the median family income for that MSA or PMSA. Otherwise, the area median family income would be the statewide non-metropolitan median family income. In all instances, the area median family incomes used to measure borrower income levels are updated annually by the U.S. Department of Housing and Urban Development (“HUD”). LMI Individuals/Persons Individuals or persons whose income is less than 80% of the area median family income. In the case where the individual resides in a MSA or PMSA, this would relate to the median family income for that MSA or PMSA. Otherwise, the area median family income would be the statewide non-metropolitan median family income. In all instances, the area median family incomes used to measure individual income levels are updated annually by HUD. LMI Penetration Rate

5 - 4
A number that represents the percentage of a bank’s total loans (for a particular product) that was extended to LMI geographies or borrowers. For example, an LMI penetration rate of 20% would indicate that the bank made 20 out of a total of 100 loans in LMI geographies or to LMI borrowers. Low-Income Housing Tax Credit (LIHTC) A dollar for dollar tax credit for affordable housing, created under the Tax Reform Act of 1986, that provides incentives to invest in projects for the utilization of private equity in the development of affordable housing aimed at low income Americans. It is also more commonly called Section 42 credits in reference to the applicable section of the IRC. The tax credits are more attractive than tax deductions as they provide a dollar for dollar reduction in a taxpayer’s federal income tax. It is more commonly attractive to corporations since the passive loss rules and similar tax changes greatly reduced the value of tax credits and deductions to individual taxpayers. New Markets Tax Credit (NMTC) The New Markets Tax Credits (NMTC) Program was established by Congress in December 2000 to stimulate economic and community development and job creation in low-income communities. It permits individual and corporate taxpayers to receive a credit against federal income taxes for making qualified equity investments in Community Development Entities (CDEs). The credit provided to the investor totals 39% of the cost of the investment and is claimed over a 7-year period. CDEs must use substantially all of the taxpayer’s investments to make qualified investments in low-income communities. The Fund is administered by the US Treasury Department’s Community Development Financial Institutions Fund (CDFI). Qualified Investment A lawful investment, deposit, membership share or grant that has community development as its primary purpose. This includes but is not limited to investments, deposits, membership shares or grants in or to: Financial intermediaries (including community development financial institutions,
community development corporations, minority- and women-owned financial institutions, community loan funds, micro-finance institutions and low-income or community development credit unions) that primarily lend or facilitate lending in LMI areas or to LMI individuals in order to promote community development;
Organizations engaged in affordable housing rehabilitation and construction; Organizations, including, for example, small business investment corporations that
promote economic development by financing small businesses; Facilities that promote community development in LMI areas or LMI individuals, such
as youth programs, homeless centers, soup kitchens, health care facilities, battered women’s centers, and alcohol and drug recovery centers;
Projects eligible for low-income housing tax credits;

5 - 5
State and municipal obligations, such as revenue bonds that specifically support affordable housing or other community development needs;
Organizations serving LMI housing or other community development needs, such as counseling for credit, home ownership, home maintenance, and other financial services education; and
Organizations supporting activities essential to the capacity of LMI individuals or geographies to utilize credit to sustain economic development, such as day care operations and job training programs that facilitate access to permanent jobs.