Community-Preserving Generalization of Social Networks
8
Community-Preserving Generalization of Social Networks Jordi Casas-Roma Universitat Oberta de Catalunya Barcelona, Spain Email: [email protected] Franc ¸ois Rousseau LIX, ´ Ecole Polytechnique Palaiseau, France Email: [email protected] Abstract—In this paper, we tackle the problem of graph generalization in the context of privacy-preserving social network mining. By grouping together nodes that are not only similar but that also belong to the same k-shells, we better preserve the community structure of the graph, its utility in case of clustering-related applications, while still achieving some privacy level through the concept of graph generalization. We conduct empirical evaluations of our approach on synthetic and real social network data, demonstrating its utility and practical application. I. I NTRODUCTION With the tremendous amount of social network data re- cently made publicly available, privacy-preserving graph min- ing has become an important research issue. Indeed, before releasing these data to third parties and to the research com- munity for subsequent analysis, it is necessary to protect the users’ privacy in the first place through network anonymization techniques. Backstrom et al. [2] pointed out that the simplest technique for anonymizing graphs, which consists of removing the identities of the vertices before publishing the actual graph, does not always guarantee privacy because of the untouched topology of the network than can help re-identify the nodes. Therefore, developing more complex network anonymization techniques has become an important issue these past few years. To anonymize a network, one can change its topology (e.g., by adding or deleting edges) while keeping the original nodes or one can propose a summary of the graph where nodes, and a fortiori edges, have been merged into super-nodes and super-edges, technique known as graph generalization or graph summarization. In this paper, we consider the second scenario and propose a novel approach to generalize a graph in order to preserve the user’s privacy while retaining as much data utility, specifically the community structure in the context of clustering-specific graph mining tasks. Additionally, graph generalization is also used for summarization and dimensionality reduction in order to represent networks in a small space, so that they can be used effectively for indexing and retrieval. Furthermore, compressed graphs can be used in a variety of applications in which it is desirable to use the summary behavior in order to estimate the approximate structural properties of the network. Therefore, while our method has been initially developed for privacy- Jordi Casas-Roma was partially supported by the Spanish MCYT and the FEDER funds under grants TIN2011-27076-C03 “CO-PRIVACY” and TIN2014-57364-C2-2-R “SMARTGLACIS”. preserving graph mining, it has many more applications where maintaining the community structure would be of interest. A. Our contributions We developed an approach to generalize undirected and unlabeled networks. Since these graphs have no attributes nor labels on the edges, information is contained only in the structure of the graph itself – its topology – and therefore, preserving the network’s structure is critical to reduce the information loss. We will present various methods to compute the similarity between vertices and define the partitions in which the vertices will be merged. The contributions of the proposed approach can be summarized as follows: • We define a novel approach to generalize a graph by capitalizing on the concept of graph degeneracy and on the similarity between vertices of the same k-shell. • We propose four different methods to compute the similarity between vertices. • We conduct an empirical evaluation of these methods on several synthetic and real networks, comparing information loss based on different graph properties and also on clustering-specific processes. • We demonstrate that our approach preserves data pri- vacy while simultaneously achieving better data utility through the generalization process. B. Outline The rest of the paper is organized as follows. Section II reviews the state-of-the-art on graph generalization methods. Section III defines the preliminary concepts related to our approach. Section IV introduces our proposed algorithm for generalizing a graph while preserving its community structure. Section V describes the experimental framework and discusses the results we obtained in terms of information loss and data utility. Finally, Section VI concludes our paper and mentions future work directions. II. RELATED WORK Generalization approaches, also known as clustering-based approaches, can be essentially regarded as grouping vertices and edges into partitions called super-vertices and super-edges. The details about individuals can be hidden properly, but the graph may be shrunk considerably after anonymization,
Transcript of Community-Preserving Generalization of Social Networks
Community-Preserving Generalizationof Social Networks
Jordi Casas-RomaUniversitat Oberta de Catalunya
Barcelona, SpainEmail: [email protected]
Francois RousseauLIX, Ecole Polytechnique
Palaiseau, FranceEmail: [email protected]
Abstract—In this paper, we tackle the problem of graphgeneralization in the context of privacy-preserving social networkmining. By grouping together nodes that are not only similarbut that also belong to the same k-shells, we better preservethe community structure of the graph, its utility in case ofclustering-related applications, while still achieving some privacylevel through the concept of graph generalization. We conductempirical evaluations of our approach on synthetic and real socialnetwork data, demonstrating its utility and practical application.
I. INTRODUCTION
With the tremendous amount of social network data re-cently made publicly available, privacy-preserving graph min-ing has become an important research issue. Indeed, beforereleasing these data to third parties and to the research com-munity for subsequent analysis, it is necessary to protect theusers’ privacy in the first place through network anonymizationtechniques. Backstrom et al. [2] pointed out that the simplesttechnique for anonymizing graphs, which consists of removingthe identities of the vertices before publishing the actual graph,does not always guarantee privacy because of the untouchedtopology of the network than can help re-identify the nodes.Therefore, developing more complex network anonymizationtechniques has become an important issue these past few years.To anonymize a network, one can change its topology (e. g.,by adding or deleting edges) while keeping the original nodesor one can propose a summary of the graph where nodes,and a fortiori edges, have been merged into super-nodes andsuper-edges, technique known as graph generalization or graphsummarization.
In this paper, we consider the second scenario and proposea novel approach to generalize a graph in order to preserve theuser’s privacy while retaining as much data utility, specificallythe community structure in the context of clustering-specificgraph mining tasks. Additionally, graph generalization is alsoused for summarization and dimensionality reduction in orderto represent networks in a small space, so that they can be usedeffectively for indexing and retrieval. Furthermore, compressedgraphs can be used in a variety of applications in which it isdesirable to use the summary behavior in order to estimate theapproximate structural properties of the network. Therefore,while our method has been initially developed for privacy-
Jordi Casas-Roma was partially supported by the Spanish MCYT andthe FEDER funds under grants TIN2011-27076-C03 “CO-PRIVACY” andTIN2014-57364-C2-2-R “SMARTGLACIS”.
preserving graph mining, it has many more applications wheremaintaining the community structure would be of interest.
A. Our contributions
We developed an approach to generalize undirected andunlabeled networks. Since these graphs have no attributesnor labels on the edges, information is contained only in thestructure of the graph itself – its topology – and therefore,preserving the network’s structure is critical to reduce theinformation loss. We will present various methods to computethe similarity between vertices and define the partitions inwhich the vertices will be merged. The contributions of theproposed approach can be summarized as follows:
• We define a novel approach to generalize a graph bycapitalizing on the concept of graph degeneracy andon the similarity between vertices of the same k-shell.
• We propose four different methods to compute thesimilarity between vertices.
• We conduct an empirical evaluation of these methodson several synthetic and real networks, comparinginformation loss based on different graph propertiesand also on clustering-specific processes.
• We demonstrate that our approach preserves data pri-vacy while simultaneously achieving better data utilitythrough the generalization process.
B. Outline
The rest of the paper is organized as follows. Section IIreviews the state-of-the-art on graph generalization methods.Section III defines the preliminary concepts related to ourapproach. Section IV introduces our proposed algorithm forgeneralizing a graph while preserving its community structure.Section V describes the experimental framework and discussesthe results we obtained in terms of information loss and datautility. Finally, Section VI concludes our paper and mentionsfuture work directions.
II. RELATED WORK
Generalization approaches, also known as clustering-basedapproaches, can be essentially regarded as grouping verticesand edges into partitions called super-vertices and super-edges.The details about individuals can be hidden properly, butthe graph may be shrunk considerably after anonymization,

3-shell2-shell
(a) Original graph
4-4
3-3
1-0
2-1
3-3
4-4
2
1 1
24
(b) Generalized graph
Fig. 1: Toy example generalization process.
which may not be desirable for analyzing local structures. Thegeneralized graph, which contains the link structures amongpartitions as well as the aggregate description of each partition,can still be used to study macro-properties of the originalgraph. Even if it holds the properties of the original graph,it does not have the same granularity. It is interesting tounderline that generalization approaches also preserve attributeand link disclosure, since two vertices from any cluster areindistinguishable based on either their relationships or theirattributes.
Figure 1a shows a toy example graph, consisting on 17 ver-tices and 25 edges distributed into 2 k-shells (see Section III-Afor definition). Node color indicates similar vertices, accordingto some arbitrary vertex similarity measure. A generalizedversion of the same graph, Figure 1b, contains 6 super-verticesand 5 super-edges. Each super-vertex incorporates the numberof intra-vertices (first digit) and intra-edges (second digit).
Hay et al. [17] applied structural generalization approachesusing the size of a partition to ensure vertex k-anonymity [28].Their method obtains a vertex k-anonymous super-graph byclustering vertices into super-vertices and edges into super-edges. Each super-vertex represents at least k nodes andeach super-edge represents all the edges between vertices intwo super-vertices. Zheleva and Getoor [30] focused on theproblem of preserving the privacy of sensitive relationships ingraph data. Nerggiz and Clifton [20] presented a methodicalapproach to evaluate clustering-based k-anonymity algorithmsusing different metrics and attempted to improve precision byignoring restrictions on generalization approaches.
Campan and Truta [9] worked on undirected networkswith labeled vertices and unlabeled edges. Vertices attributescontain identifiers, quasi-identifiers and sensitive attributes.The k-anonymity model is applied to quasi-identifiers inorder to achieve indistinguishable vertices from their attributesor relationships between attributes. The authors developed amethod, called SaNGreeA, designed to anonymize structuralinformation. Then, Ford et al. [15] introduced an extensionto k-anonymity model that adds the ability to protect againstattribute disclosure. They also presented a new algorithm,based on SaNGreeA, to enforce p-sensitive k-anonymity onsocial network data based on a greedy clustering approach.He et al. [18] utilized a similar anonymization method thatpartitions the network in a manner that preserves as much ofthe structure of the original social network as possible.
Bhagat et al. [5] assumed that adversaries know part ofthe links and nodes in the graph. The authors pointed out thatmerely grouping nodes into several classes cannot guaranteethe privacy. For instance, one can considers the case where thenodes within one class form a complete graph via a certaininteraction. Then, once the adversary knows the target is inthe class, he can be sure that the target must participate inthe interaction. The authors provided a safety condition toensure that the pattern of links between classes does not leakinformation.
More recently, Singh and Schramm [25] took the general-ization concept further and create a generalized trie structurethat contains information about network sub-graphs and neigh-borhoods. Cormode et al. [13] studied the anonymization prob-lem on bipartite networks. Their anonymization method canpreserve the graph structure exactly by masking the mappingfrom entities to nodes rather than masking or altering the graphstructure. Stokes and Torra [26] presented two methods forgraph partitioning using similarity measures to create clusterswhich group vertices into partitions of k or more elements.
Finally, Sihag [24] presented a method for k-anonymizationvia generalization on undirected and unlabeled graphs. Theauthor chose genetic algorithms to optimize this NP-hardproblem, but this method does not seem scalable for mediumor large networks.
III. PRELIMINARY CONCEPTS
Let G = (V,E) be a simple, undirected and unlabeledgraph, where V is the set of vertices and E the set of edgesin G. We define n = |V | to denote the number of vertices andm = |E| to denote the number of edges. We will use (i, j) torefer to an undirected edge from vertex vi to vj and deg(vi)to denote the degree of vertex vi, i. e. its number of neighbors.Finally, we will designate by G = (V,E) and G = (V , E)when referring to a pair of original and generalized graphsrespectively.
Our graph generalization approach relies on two mainconcepts related to graph structure and vertex similarity. Theformer corresponds to the concept of graph degeneracy, specif-ically the definition of a k-shell, and the latter involves thecomputation of the similarity between vertices on unlabelednetworks.
A. Graph degeneracy and k-shell
The idea of a k-degenerate graph comes from the work ofBollobas [7, page 222] that was further extended by Seidman[23] into the notion of a k-core, which explains the useof degeneracy as an alternative denomination for k-core inthe literature. Henceforth, we will be using the two termsinterchangeably.
Let k be an integer. A subgraph Hk = (V ′, E′), inducedby the subset of vertices V ′ ⊆ V (and a fortiori by the subsetof edges E′ ⊆ E), is called a k-core if and only if ∀vi ∈V ′, degHk
(vi) ≥ k and Hk is the maximal subgraph withthis property, i. e. it cannot be augmented without losing thisproperty. In other words, the k-core of a graph corresponds tothe set of maximal connected subgraphs whose vertices are atleast of degree k within the subgraph.

3-shell
2-shell
1-shell
B
C
D
EA
0-shell
F
Fig. 2: Illustration of a graph G and its decomposition indisjoint k-shells.
From the k-core, Carmi et al. [10] defined the notion ofk-shell, which corresponds to the subgraph induced by the setof vertices that belong to the k-core but not the (k + 1)-core,denoted by Sk such that Sk = {vi ∈ G, vi ∈ Hk∧vi /∈ Hk+1}
The core number of a vertex vi is the highest order of acore that contains this vertex, denoted by core(vi). It is alsoreferred as the shell index since the k-shell is exactly the partof the k-core that will not survive in the (k+1)-core. Basically,its value corresponds to how cohesive one’s neighborhood isand is a measure of user engagement in a network [19]. Indeed,to belong to a k-core, a node needs at least k neighbors alsomeeting the same requirements, thus forming a community of“close” nodes. Again, in the case of a social network, the corenumber of a node would correspond to the number of closefriends the user has, his inner circle that would collapse if hewere to leave (through the cascading effect implied by the k-core condition – see the impact of the removal of node D inthe 3-shell of Figure 2 for instance). Thanks to Batagelj andZaversnik [4], the shell index sequence of an unlabeled graphcan be efficiently computed in linear time (O(n + m)) andspace (O(n)).
Figure 2 illustrates the decomposition of a given graph Gof 34 vertices and 36 edges into disjoints shells and nestedcores of order 0, 1, 2 and 3. Node color indicates the shella vertex belongs to: white for the 0-shell, light gray for the1-shell, dark gray for the 2-shell and black for the 3-shell.
B. Vertex similarity measures
Since we are interested in grouping vertices into super-vertices, we have to define a measure of vertex similarity inorder to find and select a group of vertices that shares structuralproperties in the network. In particular, we considered Man-hattan and 2-path similarities for clustering of the neighborsets of the vertices of a graph.
The Manhattan similarity [27], based on the Manhattandistance, measures how many equal neighbors the two vertices
share but also how many non-neighbors they share. It iscomputed as follows:
SimManhattan(vi, vj) = 1− 1
n
n∑k=1
|(vi, vk)− (vj , vk)| (1)
where (vi, vk) = 1 if (vi, vk) ∈ E and (vi, vk) = 0 otherwise.
The 2-path similarity measures the number of paths oflength 2 between two vertices, as the following equationdepicts:
Sim2-path(vi, vj) =1
n
n∑k=1
(vi, vk)(vj , vk) (2)
where (vi, vk) = 1 if (vi, vk) ∈ E and (vi, vk) = 0 otherwise.
Both similarity measures score in the range [0, 1], where0 indicates no similarity at all and 1 the maximum similarityscore. As noted by Stokes and Torra [26], the Manhattan simi-larity measures the similarity between vertices with respect toboth neighbors and non-neighbors, while the 2-path similarityonly measures the similarity between vertices with respectto their neighbors, so that a common non-neighbor does notchange the similarity between two vertices.
IV. GRAPH GENERALIZATION ALGORITHM
In this section, we present our approach designed togeneralize a graph while preserving its community structure.As aforementioned, these methods can be useful for diversepurposes and we focused here on privacy-preserving datamining. Specifically, we are interested in preserving the users’privacy while keeping most of the data utility, in particular forclustering and community detection processes.
As stated previously, our approach relies on two definitions:graph degeneracy and vertex similarity. Firstly, we evaluatecommunities based on the concept of k-core as an efficientmean to evaluate their collaborative nature – a property notcaptured by the single-node metrics or by the establishedcommunity evaluation metrics. We considered the graph asa set of disjoint k-shells. Such a partition provides a way topreserve the graph’s clustering structure, while making the exe-cution of the similarity measure between vertices much fasterdue to the smaller size of the graph’s partitions. Secondly,we consider various vertex similarity metrics to compute thedistance between vertices. Due to the fact that generalizationimplies merging vertices into one super-vertex, defining asimilarity metric is a critical step to maintain the data utilityand reduce the information loss. Here, we evaluated twosimilarity metrics, the Manhattan and 2-path similarities, andwe also used two well-known clustering algorithms to providegroups of vertices.
Our approach is based on a three-step algorithm:
1) Information gathering – this step collects two typesof information for every vertex in the original graph.First, we decompose the graph and assign the shellindex to each vertex. Then, we utilize a similaritymetric to define groups of one or more vertices.Vertices in the same group share some structuralproperties depending on the similarity metric used.

2) Super-vertex definition – using the information col-lected in the previous step, we can define whichvertices will be merged into each super-vertex.
3) Generalized graph creation – once the super-verticesare defined, we (1) create an empty graph; (2) addthe super-vertices and also the information containedin them, i. e. the number of intra-vertices and intra-edges; and finally (3) add the inter-edges betweensuper-vertices in the generalized network.
A. Step 1 – Information gathering
The first step focuses on collecting the information neededin the next one to define the partition groups. Following theintuitions previously mentioned, we considered that a partitiongroup must contains vertices, which (1) belong to the same k-shell of the original graph, since it will preserve the graphdecomposition and also the clustering structure; and (2) sharesome properties regarding graph’s structure, thus similaritymetrics have to defined and evaluated to reduce the informationloss.
Obviously, there are many ways to define and compute thesimilarity between vertices in a network. We have chosen twowell-known vertex similarity metrics and also two graph clus-tering algorithms, which do not provide a similarity measurebut a group partition of the whole network.
Our similarity metrics are the Manhattan and 2-path sim-ilarity presented in Section III-B. As described, these metricsscore a mark between 0 and 1, where 0 means no similarityat all and 1 is the maximum similarity between two vertices.According to these scores, our approach selects the maximummark between two vertices or groups of vertices and mergesthem into the same group. This process is iterated until a stopcondition is reached – we have used the contraction percentage(p), defined as the number of partitions over the total numberof vertices. For instance, p = 0.5 implies creating, at least, n/2groups of vertices.
Due to the importance of the group partitions in ourapproach, we also wanted to test some clustering or communitydetection algorithms to define the vertices’ partitions. Theydo not provide a score, just a group partition over the wholegraph. Thus, it is possible to utilize any graph clustering orcommunity detection algorithm in this step. We have chosenthe Multilevel [6] and Fastgreedy [12] algorithms (see SectionV-A3 for further details).
B. Step 2 – Super-vertex definition
This second step focuses on defining the super-verticesaccording to the previously collected information for eachvertex. For each k-shell in the graph, we merge vertices be-longing to the same group partition into the same super-vertex.Additionally, we have defined a parameter to avoid mergingtoo many vertices into one super-vertex; if a max fusionparameter is reached, then we split the super-vertex onto twoindependent super-vertices. As a result of this step, a set ofsuper-vertices is defined and each vertex is assigned to one,and only one, super-vertex.
C. Step 3 – Generalized graph creation
Finally, the third step focuses on creating the new gen-eralized graph according to the super-vertices defined in theprevious step. We start by defining an empty, undirected,edge-labeled and vertex-labeled graph G = (V , E). Then,the process iterates by adding each previously defined super-vertex svi ∈ V . Each super-vertex contains information aboutthe number of vertices, which have merged into this super-vertex (IntraVertices) and also the number of edges betweenthe vertices contained in it (IntraEdges). Lastly, a super-edgebetween two super-vertices is created if there exists an edgebetween two vertices contained in each of the super-vertices,i. e. (svi, svj) ∈ E ↔ (vk, vp) ∈ E : vk ∈ svi ∧ vp ∈ svj .Super-edges contain a label indicating the number of edgesbetween all vertices from their endpoints (InterEdges).
V. EXPERIMENTS
In this section, we first describe the experimental frame-work we used to analyze and compare the information lossinduced by our generalization methods. We then present theresults we obtained on five network datasets.
A. Experimental framework
For each dataset, we compute the generalized graph pro-duced by Multilevel and Fastgreedy algorithms. As aforemen-tioned, the generalized graph is unique for each clusteringalgorithm. On the contrary, using our two similarity measures,we can adjust some parameters to control the granularityof the summarized graph. In these experiments, we set thecontraction percentage to 0.5, i. e. the number of super-verticesis half the number of vertices.
1) Tested networks: We used both synthetic and real net-works in our experiments. We used the igraph1 library togenerate two kinds of random graphs:
• ER-1000 – Erdos-Renyi Model [14] is a classicalrandom graph model. It defines a random graph asn vertices connected by m edges that are chosenrandomly from the n(n− 1)/2 possible edges. In ourexperiments, we set n to 1,000 and m to 5,000.
• BA-1000 – Barabasi-Albert Model [3], also calledscale-free model, is a network whose degree distri-bution follows a power law. That is, for degree d, itsprobability density function is P (d) = d−γ . In ourexperiments, we set the number of vertices to be 1,000and γ=1, i. e. linear preferential attachment.
Additionally, three different real networks have been usedin our experiments. Although all these sets are unlabeled, wehave selected these datasets because they have different graph’sproperties. They are the following ones:
• Karate – Zachary’s Karate Club [29] shows the rela-tionships among 34 members of a karate club.
• Polblogs – Political blogosphere data [1] compiles thedata on the links among US political blogs.
• URV email – the email communication network at theUniversity Rovira i Virgili in Tarragona (Spain) [16].
1Available at: http://igraph.org/
2) Generic information loss evaluation: We describe thecriteria that are used to quantify the information loss onsummarized graphs. It is important to underline that sincethe number of vertices, edges and some important graph’sstructures change during generalization process, some metricscannot be used to compare information between original andgeneralized graphs. For instance, centrality measures, likebetweenness or closeness centrality, have been proved tocorrectly assess information loss and data utility [11], butthey evaluate each vertex independently and consequently,score obtained on original and summarized graphs cannot becompared.
For each experiment, we provide information about thenumber of vertices and edges both in the original and summa-rized graphs. We also considered the degree distribution as animportant feature we must preserve. Additionally, some graph’sstructural metrics have been included in our experiments. Thefirst one is the average distance (dist), which is defined asthe average of the distances between each pair of vertices inthe graph. The diameter (d) is defined as the largest minimumdistance between two vertices in the graph, and harmonic meanof the shortest distance (h) is an evaluation of connectivity,similar to the average distance or average path length, andits inverse is also known as the global efficiency. Finally,transitivity (T ) is one type of clustering coefficient, whichmeasures and characterizes the presence of local loops neara vertex.
The above measures evaluate the entire graph as a uniquescore. We compute the error on these graph metrics as follows:
εm(G, G) = |m(G)−m(G)|, (3)
where m is one of the graph metrics defined above, G is theoriginal graph and G is the generalized graph.
3) Clustering-specific evaluation: Variations in the genericgraph properties is a good way to assess the information lossbut they have their limitations because they are just a proxyto the changes in data utility we actually want to measure. Wedefine the specific information loss measures as a task-specificmeasure for quantifying the data utility and the informationloss associated to a data publishing process. We focus onclustering-specific processes, since it is an important applica-tion for social and healthcare networks, among many others.Like generic graph measures, we compare the results obtainedboth by the original and the generalized graphs in order toquantify the level of noise introduced during the generalizationprocess. This measure is specific and application-dependent,but it is necessary to test the generalized data in real graph-mining processes.
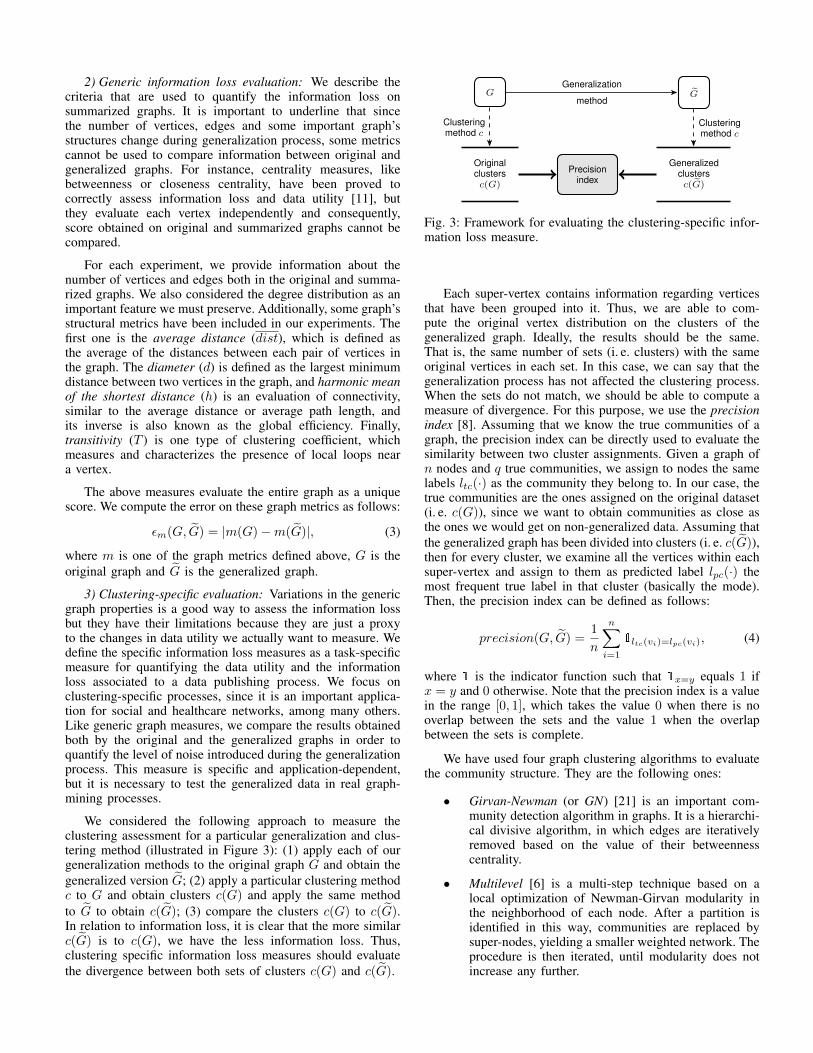
We considered the following approach to measure theclustering assessment for a particular generalization and clus-tering method (illustrated in Figure 3): (1) apply each of ourgeneralization methods to the original graph G and obtain thegeneralized version G; (2) apply a particular clustering methodc to G and obtain clusters c(G) and apply the same methodto G to obtain c(G); (3) compare the clusters c(G) to c(G).In relation to information loss, it is clear that the more similarc(G) is to c(G), we have the less information loss. Thus,clustering specific information loss measures should evaluatethe divergence between both sets of clusters c(G) and c(G).
G G
Originalclustersc(G)
Precisionindex
Generalizedclustersc(G)
Generalization
method
Clusteringmethod c
Clusteringmethod c
Fig. 3: Framework for evaluating the clustering-specific infor-mation loss measure.
Each super-vertex contains information regarding verticesthat have been grouped into it. Thus, we are able to com-pute the original vertex distribution on the clusters of thegeneralized graph. Ideally, the results should be the same.That is, the same number of sets (i. e. clusters) with the sameoriginal vertices in each set. In this case, we can say that thegeneralization process has not affected the clustering process.When the sets do not match, we should be able to compute ameasure of divergence. For this purpose, we use the precisionindex [8]. Assuming that we know the true communities of agraph, the precision index can be directly used to evaluate thesimilarity between two cluster assignments. Given a graph ofn nodes and q true communities, we assign to nodes the samelabels ltc(·) as the community they belong to. In our case, thetrue communities are the ones assigned on the original dataset(i. e. c(G)), since we want to obtain communities as close asthe ones we would get on non-generalized data. Assuming thatthe generalized graph has been divided into clusters (i. e. c(G)),then for every cluster, we examine all the vertices within eachsuper-vertex and assign to them as predicted label lpc(·) themost frequent true label in that cluster (basically the mode).Then, the precision index can be defined as follows:
precision(G, G) =1
n
n∑i=1
1ltc(vi)=lpc(vi), (4)
where 1 is the indicator function such that 1x=y equals 1 ifx = y and 0 otherwise. Note that the precision index is a valuein the range [0, 1], which takes the value 0 when there is nooverlap between the sets and the value 1 when the overlapbetween the sets is complete.
We have used four graph clustering algorithms to evaluatethe community structure. They are the following ones:
• Girvan-Newman (or GN) [21] is an important com-munity detection algorithm in graphs. It is a hierarchi-cal divisive algorithm, in which edges are iterativelyremoved based on the value of their betweennesscentrality.
• Multilevel [6] is a multi-step technique based on alocal optimization of Newman-Girvan modularity inthe neighborhood of each node. After a partition isidentified in this way, communities are replaced bysuper-nodes, yielding a smaller weighted network. Theprocedure is then iterated, until modularity does notincrease any further.
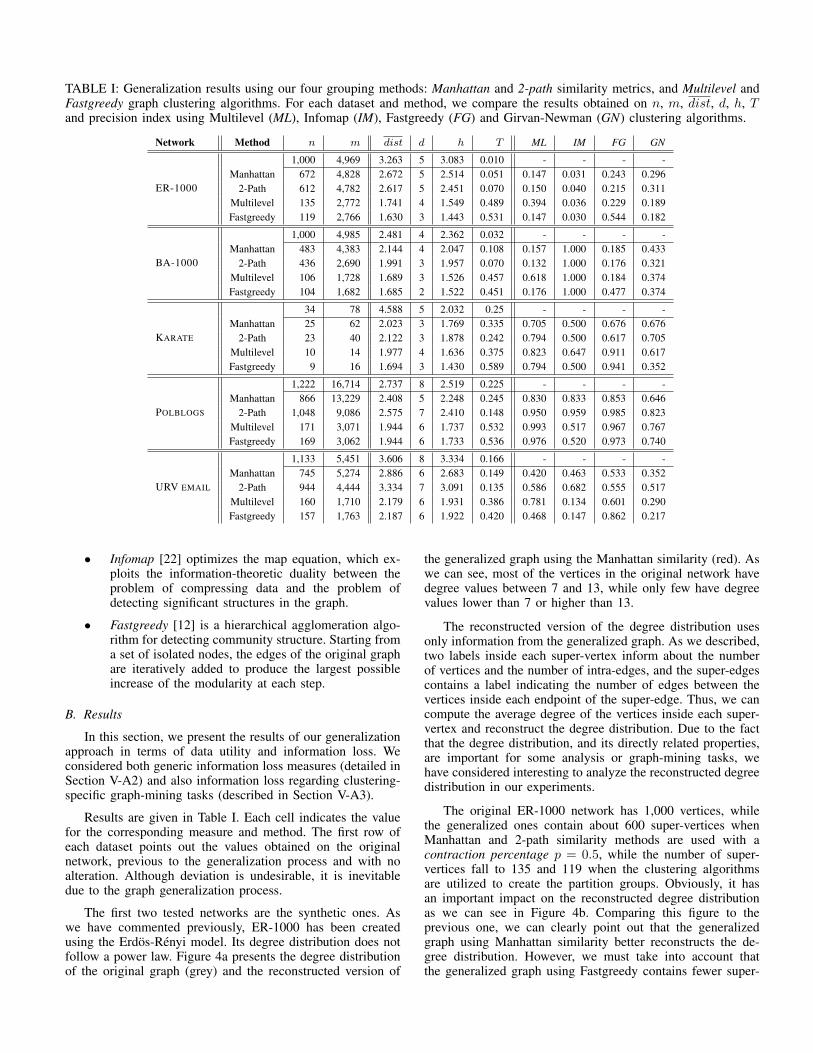
TABLE I: Generalization results using our four grouping methods: Manhattan and 2-path similarity metrics, and Multilevel andFastgreedy graph clustering algorithms. For each dataset and method, we compare the results obtained on n, m, dist, d, h, Tand precision index using Multilevel (ML), Infomap (IM), Fastgreedy (FG) and Girvan-Newman (GN) clustering algorithms.
Network Method n m dist d h T ML IM FG GN
ER-1000
1,000 4,969 3.263 5 3.083 0.010 - - - -Manhattan 672 4,828 2.672 5 2.514 0.051 0.147 0.031 0.243 0.296
2-Path 612 4,782 2.617 5 2.451 0.070 0.150 0.040 0.215 0.311Multilevel 135 2,772 1.741 4 1.549 0.489 0.394 0.036 0.229 0.189Fastgreedy 119 2,766 1.630 3 1.443 0.531 0.147 0.030 0.544 0.182
BA-1000
1,000 4,985 2.481 4 2.362 0.032 - - - -Manhattan 483 4,383 2.144 4 2.047 0.108 0.157 1.000 0.185 0.433
2-Path 436 2,690 1.991 3 1.957 0.070 0.132 1.000 0.176 0.321Multilevel 106 1,728 1.689 3 1.526 0.457 0.618 1.000 0.184 0.374Fastgreedy 104 1,682 1.685 2 1.522 0.451 0.176 1.000 0.477 0.374
KARATE
34 78 4.588 5 2.032 0.25 - - - -Manhattan 25 62 2.023 3 1.769 0.335 0.705 0.500 0.676 0.676
2-Path 23 40 2.122 3 1.878 0.242 0.794 0.500 0.617 0.705Multilevel 10 14 1.977 4 1.636 0.375 0.823 0.647 0.911 0.617Fastgreedy 9 16 1.694 3 1.430 0.589 0.794 0.500 0.941 0.352
POLBLOGS
1,222 16,714 2.737 8 2.519 0.225 - - - -Manhattan 866 13,229 2.408 5 2.248 0.245 0.830 0.833 0.853 0.646
2-Path 1,048 9,086 2.575 7 2.410 0.148 0.950 0.959 0.985 0.823Multilevel 171 3,071 1.944 6 1.737 0.532 0.993 0.517 0.967 0.767Fastgreedy 169 3,062 1.944 6 1.733 0.536 0.976 0.520 0.973 0.740
URV EMAIL
1,133 5,451 3.606 8 3.334 0.166 - - - -Manhattan 745 5,274 2.886 6 2.683 0.149 0.420 0.463 0.533 0.352
2-Path 944 4,444 3.334 7 3.091 0.135 0.586 0.682 0.555 0.517Multilevel 160 1,710 2.179 6 1.931 0.386 0.781 0.134 0.601 0.290Fastgreedy 157 1,763 2.187 6 1.922 0.420 0.468 0.147 0.862 0.217
• Infomap [22] optimizes the map equation, which ex-ploits the information-theoretic duality between theproblem of compressing data and the problem ofdetecting significant structures in the graph.
• Fastgreedy [12] is a hierarchical agglomeration algo-rithm for detecting community structure. Starting froma set of isolated nodes, the edges of the original graphare iteratively added to produce the largest possibleincrease of the modularity at each step.
B. Results
In this section, we present the results of our generalizationapproach in terms of data utility and information loss. Weconsidered both generic information loss measures (detailed inSection V-A2) and also information loss regarding clustering-specific graph-mining tasks (described in Section V-A3).
Results are given in Table I. Each cell indicates the valuefor the corresponding measure and method. The first row ofeach dataset points out the values obtained on the originalnetwork, previous to the generalization process and with noalteration. Although deviation is undesirable, it is inevitabledue to the graph generalization process.
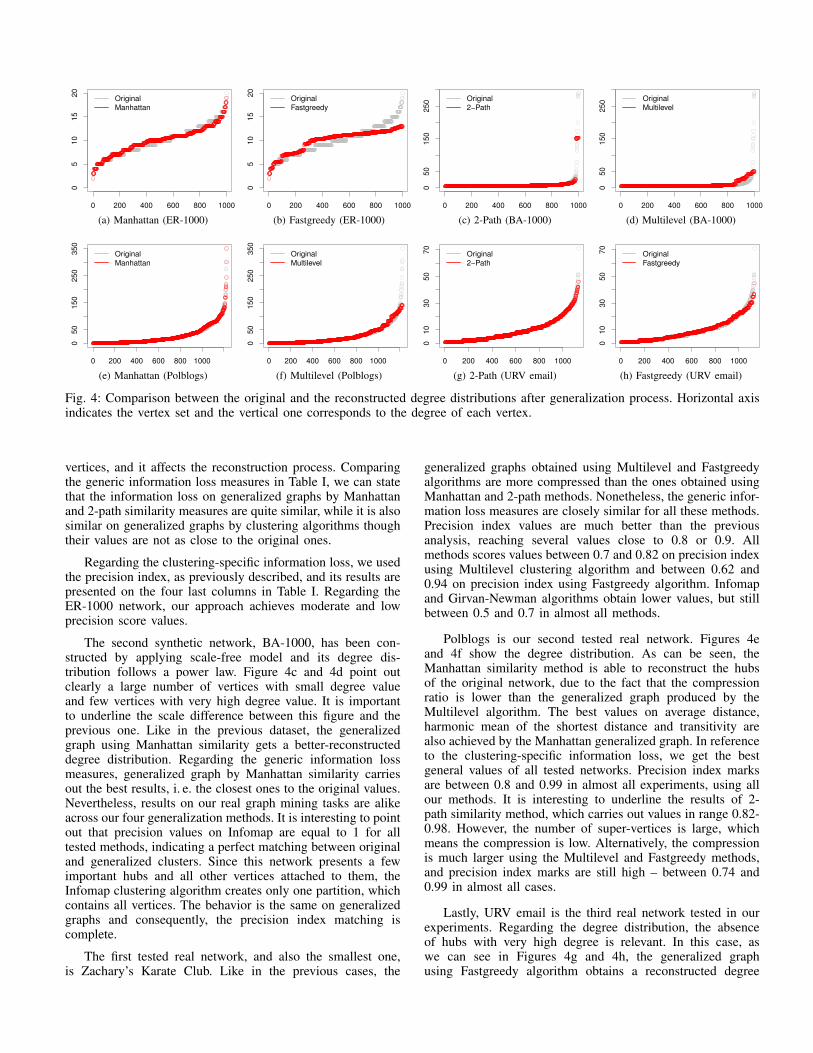
The first two tested networks are the synthetic ones. Aswe have commented previously, ER-1000 has been createdusing the Erdos-Renyi model. Its degree distribution does notfollow a power law. Figure 4a presents the degree distributionof the original graph (grey) and the reconstructed version of
the generalized graph using the Manhattan similarity (red). Aswe can see, most of the vertices in the original network havedegree values between 7 and 13, while only few have degreevalues lower than 7 or higher than 13.
The reconstructed version of the degree distribution usesonly information from the generalized graph. As we described,two labels inside each super-vertex inform about the numberof vertices and the number of intra-edges, and the super-edgescontains a label indicating the number of edges between thevertices inside each endpoint of the super-edge. Thus, we cancompute the average degree of the vertices inside each super-vertex and reconstruct the degree distribution. Due to the factthat the degree distribution, and its directly related properties,are important for some analysis or graph-mining tasks, wehave considered interesting to analyze the reconstructed degreedistribution in our experiments.
The original ER-1000 network has 1,000 vertices, whilethe generalized ones contain about 600 super-vertices whenManhattan and 2-path similarity methods are used with acontraction percentage p = 0.5, while the number of super-vertices fall to 135 and 119 when the clustering algorithmsare utilized to create the partition groups. Obviously, it hasan important impact on the reconstructed degree distributionas we can see in Figure 4b. Comparing this figure to theprevious one, we can clearly point out that the generalizedgraph using Manhattan similarity better reconstructs the de-gree distribution. However, we must take into account thatthe generalized graph using Fastgreedy contains fewer super-
0 200 400 600 800 1000
05
10
15
20
Original
Manhattan
(a) Manhattan (ER-1000)0 200 400 600 800 1000
05
10
15
20
Original
Fastgreedy
(b) Fastgreedy (ER-1000)0 200 400 600 800 1000
05
01
50
25
0 Original
2−Path
(c) 2-Path (BA-1000)0 200 400 600 800 1000
05
01
50
25
0 Original
Multilevel
(d) Multilevel (BA-1000)
0 200 400 600 800 1000
05
01
50
25
03
50
Original
Manhattan
(e) Manhattan (Polblogs)0 200 400 600 800 1000
05
01
50
25
03
50
Original
Multilevel
(f) Multilevel (Polblogs)0 200 400 600 800 1000
01
03
05
07
0
Original
2−Path
(g) 2-Path (URV email)0 200 400 600 800 1000
01
03
05
07
0
Original
Fastgreedy
(h) Fastgreedy (URV email)
Fig. 4: Comparison between the original and the reconstructed degree distributions after generalization process. Horizontal axisindicates the vertex set and the vertical one corresponds to the degree of each vertex.
vertices, and it affects the reconstruction process. Comparingthe generic information loss measures in Table I, we can statethat the information loss on generalized graphs by Manhattanand 2-path similarity measures are quite similar, while it is alsosimilar on generalized graphs by clustering algorithms thoughtheir values are not as close to the original ones.
Regarding the clustering-specific information loss, we usedthe precision index, as previously described, and its results arepresented on the four last columns in Table I. Regarding theER-1000 network, our approach achieves moderate and lowprecision score values.
The second synthetic network, BA-1000, has been con-structed by applying scale-free model and its degree dis-tribution follows a power law. Figure 4c and 4d point outclearly a large number of vertices with small degree valueand few vertices with very high degree value. It is importantto underline the scale difference between this figure and theprevious one. Like in the previous dataset, the generalizedgraph using Manhattan similarity gets a better-reconstructeddegree distribution. Regarding the generic information lossmeasures, generalized graph by Manhattan similarity carriesout the best results, i. e. the closest ones to the original values.Nevertheless, results on our real graph mining tasks are alikeacross our four generalization methods. It is interesting to pointout that precision values on Infomap are equal to 1 for alltested methods, indicating a perfect matching between originaland generalized clusters. Since this network presents a fewimportant hubs and all other vertices attached to them, theInfomap clustering algorithm creates only one partition, whichcontains all vertices. The behavior is the same on generalizedgraphs and consequently, the precision index matching iscomplete.
The first tested real network, and also the smallest one,is Zachary’s Karate Club. Like in the previous cases, the
generalized graphs obtained using Multilevel and Fastgreedyalgorithms are more compressed than the ones obtained usingManhattan and 2-path methods. Nonetheless, the generic infor-mation loss measures are closely similar for all these methods.Precision index values are much better than the previousanalysis, reaching several values close to 0.8 or 0.9. Allmethods scores values between 0.7 and 0.82 on precision indexusing Multilevel clustering algorithm and between 0.62 and0.94 on precision index using Fastgreedy algorithm. Infomapand Girvan-Newman algorithms obtain lower values, but stillbetween 0.5 and 0.7 in almost all methods.
Polblogs is our second tested real network. Figures 4eand 4f show the degree distribution. As can be seen, theManhattan similarity method is able to reconstruct the hubsof the original network, due to the fact that the compressionratio is lower than the generalized graph produced by theMultilevel algorithm. The best values on average distance,harmonic mean of the shortest distance and transitivity arealso achieved by the Manhattan generalized graph. In referenceto the clustering-specific information loss, we get the bestgeneral values of all tested networks. Precision index marksare between 0.8 and 0.99 in almost all experiments, using allour methods. It is interesting to underline the results of 2-path similarity method, which carries out values in range 0.82-0.98. However, the number of super-vertices is large, whichmeans the compression is low. Alternatively, the compressionis much larger using the Multilevel and Fastgreedy methods,and precision index marks are still high – between 0.74 and0.99 in almost all cases.
Lastly, URV email is the third real network tested in ourexperiments. Regarding the degree distribution, the absenceof hubs with very high degree is relevant. In this case, aswe can see in Figures 4g and 4h, the generalized graphusing Fastgreedy algorithm obtains a reconstructed degree

distribution close to the original one. Even though it is truethat the reconstructed degree distribution obtained by 2-pathsimilarity method is better, the former uses only 157 super-vertices while the later utilizes 944 super-vertices. Probablydue to this, the 2-path method achieves the closest results onaverage distance, diameter and harmonic mean of the shortestdistance. In reference to the clustering-specific informationloss, the results are moderate. 2-path method ranges from 0.52to 0.68, while Manhattan method gets values on range 0.35-0.53. The generalized graph using Multilevel algorithm scores0.78 when the same clustering algorithm is used to compute theprecision index. It is obvious that the matching will be higherif we use the same clustering algorithm to create vertex’spartitions and also to compute the precision index. Similarbehavior occurs when using Fastgreedy generalized graph.
VI. CONCLUSIONS
In this paper, we have presented an approach to generalizeor summarize a graph while preserving its communities. Thisapproach relies on two intuitions: first, the k-shells in the graphdecomposition are related to community structures, thus pre-serving the shells on generalization process would improve theclustering-specific graph-mining tasks; and second, a similaritymeasure have to be used to create partitions of vertices insideeach k-shell. We have introduced four methods to compute thesimilarity among vertices in a graph or a shell. An empiricalevaluation of these methods have been conducted on severalsynthetic and real networks, comparing information loss basedon different graph properties and also on clustering-specificinformation loss. We have demonstrated that our methodsare able to generalize a graph while preserving the mostimportant features and maintaining data utility on clustering-specific graph mining tasks. As we have seen throughoutour experimental framework, our four methods to define thevertex’s partitions keep data utility on community detectiontasks, but the underlying structure of the network is critical,and it has to be considered to find the best similarity measure.
Many interesting directions for future research have beenuncovered by this work. Firstly, a deeper analysis on howthe original graph’s structure affects the generalization processmust be conducted. Secondly, it would be thought-provoking toapply different similarity measures in each k-shell, accordingto the specific structure of the shell. Lastly, other informationloss measures based on real graph mining processes can beconsidered such as information flow.
REFERENCES
[1] L. A. Adamic, and N. Glance, “The political blogosphere and the 2004U.S. election” in LinkKDD ’05. ACM, 2005, pp. 36–43.
[2] L. Backstrom, C. Dwork, and J. Kleinberg, “Wherefore art thour3579x?: anonymized social networks, hidden patterns, and structuralsteganography” in WWW ’07. ACM, 2007, pp. 181–190.
[3] A.-L. Barabasi, and R. Albert, “Emergence of Scaling in RandomNetworks”. Science, vol. 286, no. 5439, pp. 509–512, 1999.
[4] V. Batagelj, and M. Zaversnik, “Fast algorithms for determining (gen-eralized) core groups in social networks”. Advances in Data Analysisand Classification, vol. 5, no. 2, pp. 129–145, 2011.
[5] S. Bhagat, G. Cormode, B. Krishnamurthy, and D. Srivastava, “Class-based graph anonymization for social network data” in VLDB ’09, vol.2, no. 1, pp. 766–777, 2009.
[6] V. D. Blondel, J.-L. Guillaume, R. Lambiotte, and E. Lefebvre, “Fastunfolding of communities in large networks”. Journal of StatisticalMechanics: Theory and Experiment, vol. 2008, no. 10, 2008.
[7] B. Bollobas, “Extremal Graph Theory”. Academic Press, London. 1978.[8] B.J. Cai, H.Y. Wang, H.R. Zheng, and H. Wang, “Evaluation repeated
random walks in community detection of social networks” in ICMLC’10. IEEE, 2010, pp. 1849–1854.
[9] A. Campan, and T. M. Truta, “A Clustering Approach for Data andStructural Anonymity in Social Networks” in PinKDD ’08. ACM, 2008,pp. 1–10.
[10] S. Carmi, S. Havlin, S. Kirkpatrick, Y. Shavitt, and E. Shir, E., “Amodel of Internet topology using k-shell decomposition”. PNAS, vol.104, no. 27, pp. 11150–11154, 2007.
[11] J. Casas-Roma, J. Herrera-Joancomartı, and V. Torra, “Anonymizinggraphs: measuring quality for clustering”. Knowledge and InformationSystems, pp. 1–22, 2014.
[12] A. Clauset, M. E. J. Newman, and C. Moore, “Finding communitystructure in very large networks”. Physical Review E, vol. 70, no. 6,pp. 1–6, 2004.
[13] G. Cormode, D. Srivastava, T. Yu, and Q. Zhang, “Anonymizingbipartite graph data using safe groupings”. The VLDB Journal, vol.19, no. 1, pp. 115–139, 2010.
[14] P. Erdos, and A. Renyi, “On Random Graphs I”. Publicationes Mathe-maticae, vol. 6, pp. 290–297, 1959.
[15] R. Ford, T. M. Truta, and A. Campan, “p-Sensitive k-Anonymity forSocial Networks” in DMIN ’09. CSREA Press, 2009, pp. 403–409.
[16] R. Guimera, L. Danon, A. Dıaz-Guilera, F. Giralt, and A. Arenas,“Self-similar community structure in a network of human interactions”.Physical Review E, vol. 68:065103, pp. 1–4, 2003.
[17] M. Hay, G. Miklau, D. Jensen, D. Towsley, and P. Weis, “Resistingstructural re-identification in anonymized social networks” in VLDB’08, vol. 1, no. 1, pp. 102–114, 2008.
[18] X. He, J. Vaidya, B. Shafiq, N. Adam, and V. Atluri, “PreservingPrivacy in Social Networks: A Structure-Aware Approach” in WI-IAT’09. IEEE, 2009, pp. 647–654.
[19] F. D. Malliaros, and M. Vazirgiannis, “To Stay or Not to Stay: ModelingEngagement Dynamics in Social Graphs”, in CIKM ’13. ACM, 2013,pp. 469–478.
[20] M. E. Nergiz, and C. Clifton, “Thoughts on k-anonymization”. Data &Knowledge Engineering, vol. 63, no. 3, pp. 622–645, 2007.
[21] M. E. J. Newman, and M. Girvan, “Finding and evaluating communitystructure in networks”. Physical Review E, vol. 69, no. 2, pp. 1–16,2003.
[22] M. Rosvall, and C. T. Bergstrom, “Maps of random walks on complexnetworks reveal community structure”. PNAS, vol. 105, no. 4, pp. 1118–1123, 2008.
[23] S. B. Seidman, “Network structure and minimum degree”. SocialNetworks, vol. 5, no. 3, pp. 269–287, 1983.
[24] V. K. Sihag, “A clustering approach for structural k-anonymity in socialnetworks using genetic algorithm” in CUBE ’12. ACM, 2012, pp. 701–706.
[25] L. Singh, and C. Schramm, “Identifying Similar Neighborhood Struc-tures in Private Social Networks” in ICDM ’10. IEEE, 2010, pp. 507–516).
[26] K. Stokes, and V. Torra, “On some clustering approaches for graphs”in FUZZ-IEEE ’11. IEEE, 2011, pp. 409–415.
[27] K. Stokes, and V. Torra, “Reidentification and k-anonymity: a modelfor disclosure risk in graphs”. Soft Computing, vol. 16, no. 10, pp.1657–1670, 2012.
[28] L. Sweeney, “k-anonymity: a model for protecting privacy”. Interna-tional Journal of Uncertainty, Fuzziness and Knowledge-Based Systems,vol. 10, no. 5, pp. 557–570, 2002.
[29] W. W. Zachary, “An information flow model for conflict and fission insmall groups”. Journal of Anthropological Research, vol. 33, no. 4, pp.452-473, 1977.
[30] E. Zheleva, and L. Getoor, “Preserving the Privacy of Sensitive Rela-tionships in Graph Data” in PinKDD ’07. Springer-Verlag, 2007, pp.153–171.