Community Mental Health Association of Michigan
15
1 Community Mental Health Association of Michigan Behavioral Health Provider/Supervisor Telehealth Survey Summary August 2021 Introduction Due to expanded Medicaid coverage for telehealth services and limited ability to provide face-to-face services during the coronavirus (COVID-19) pandemic, the use of telehealth has greatly increased. In response, the Community Mental Health Association of Michigan (CMHA) developed a Telehealth Resource Center to support provider use of telehealth and telehealth best practices. CMHA was interested in learning about the telehealth experience of behavioral health providers and clinical supervisors in order to improve the resource center and the programs it offers members and to inform CMHA policy and advocacy activities. To this end, CMHA engaged Public Sector Consultants (PSC) to conduct a telehealth survey with these providers. The 16-question online survey was distributed to CEOs of community mental health centers and private providers on May 17, 2021, with a request that they share it with their staff of behavioral health service providers and their clinical supervisors. One survey reminder was sent on June 1, and the survey was closed on June 8, 2021. There were 846 total completed survey responses. Key Findings Analysis of the survey provided several key findings. • Around two-thirds of those providing services to all adult populations and children with a serious emotional disturbance or substance use disorder were providing more than half of those services via telehealth in the 30 days prior to taking the survey. • About three-quarters of respondents plan to provide a mix of telehealth and face-to-face services after the COVID-19 pandemic. • The most-used telehealth methods were video conferencing and phone calls, with connectivity problems being the largest issue with both of these methods. • The perceived usefulness of telehealth via certain methods can vary by population and geography. • Overall, providers feel comfortable using telehealth, say they are knowledgeable about telehealth best practices, feel they can provide quality care via telehealth, and believe that telehealth is important to the success of their organization.
Transcript of Community Mental Health Association of Michigan

1
Community Mental Health Association of Michigan
Behavioral Health Provider/Supervisor Telehealth Survey Summary
August 2021
Introduction Due to expanded Medicaid coverage for telehealth services and limited ability to provide face-to-face
services during the coronavirus (COVID-19) pandemic, the use of telehealth has greatly increased. In
response, the Community Mental Health Association of Michigan (CMHA) developed a Telehealth
Resource Center to support provider use of telehealth and telehealth best practices. CMHA was interested
in learning about the telehealth experience of behavioral health providers and clinical supervisors in order
to improve the resource center and the programs it offers members and to inform CMHA policy and
advocacy activities. To this end, CMHA engaged Public Sector Consultants (PSC) to conduct a telehealth
survey with these providers.
The 16-question online survey was distributed to CEOs of community mental health centers and private
providers on May 17, 2021, with a request that they share it with their staff of behavioral health service
providers and their clinical supervisors. One survey reminder was sent on June 1, and the survey was
closed on June 8, 2021. There were 846 total completed survey responses.
Key Findings
Analysis of the survey provided several key findings.
• Around two-thirds of those providing services to all adult populations and children with a serious
emotional disturbance or substance use disorder were providing more than half of those services via
telehealth in the 30 days prior to taking the survey.
• About three-quarters of respondents plan to provide a mix of telehealth and face-to-face services after
the COVID-19 pandemic.
• The most-used telehealth methods were video conferencing and phone calls, with connectivity
problems being the largest issue with both of these methods.
• The perceived usefulness of telehealth via certain methods can vary by population and geography.
• Overall, providers feel comfortable using telehealth, say they are knowledgeable about telehealth best
practices, feel they can provide quality care via telehealth, and believe that telehealth is important to
the success of their organization.

2
Survey Respondents Survey respondents were primarily behavioral health service providers (76 percent), with the rest being
supervisors of those who provide these services (Exhibit 1). Respondents provide a variety of services;
however, over three-quarters provide either case management or support coordination (41 percent) or
provide psychotherapy (37 precent), shown in Exhibit 2. Around 5 percent each provide peer or family
support, nursing, psychiatry, and applied behavior analysis.
EXHIBIT 1. Respondent Type
N = 846.
EXHIBIT 2. Services Provided
N = 846. Note: Percentages do not total 100 due to rounding.
Additionally, respondents serve various populations, with nearly 60 percent serving adults with a mental
illness and 40 percent each serving adults with an intellectual and/or developmental disability and
children with a serious emotional disturbance (Exhibit 3). Nearly half (45 percent) serve only one
population and another quarter serve two populations (Exhibit 4). Five percent serve all six populations.
76%
24%
Provider
Supervisor
1%
2%
2%
4%
4%
5%
5%
37%
41%
0% 20% 40% 60%
Speech therapy
Occupational therapy
Psychiatric nursing orphysician assistant care
Applied behavior analysis
Psychiatry
Nursing
Peer or family support
Psychotherapy
Case management/supportscoordination

3
EXHIBIT 3. Percentage of Respondents Serving Each Patient Population
N = 846. Note: Percentages total more than 100 because respondents could select more than one response.
EXHIBIT 4. Percentage of Respondents by Number of Populations Served
N = 846. Note: Percentages do not total 100 due to rounding.
Respondents provide services in 73 of Michigan’s 83 counties, with two respondents (0.2 percent)
providing services statewide. More than 10 percent of respondents provide services in six counties—
Ingham, Macomb, Clinton, Eaton, Oakland, and Genesee—with between 0.1 and 7 percent providing
services in each of the remaining 67 counties (Exhibit 5).1 Nearly two-thirds (62 percent) provide services
in urban counties, with 38 percent serving rural counties (Exhibit 6).
1 See Appendix A for full list of counties.
59%
40%
33%
40%
33%
11%
0% 20% 40% 60%
Adults with a mental illness
Adults with an intellectualand/or developmental
disability
Adults with a substance usedisorder
Children with a seriousemotional disturbance
Children with an intellectualand/or developmental
disability
Children with a substanceuse disorder
45%
25%
14%
6%
4%
5%
0% 20% 40% 60%
One
Two
Three
Four
Five
Six
Nu
mb
er
of P
op
ula
tion
s S
erv
ed

4
EXHIBIT 5. Counties Where Respondents Provide Services
N = 1,430. Note: Number is greater than total number of respondents (846) because respondents could provide services in multiple counties.
EXHIBIT 6. Percentage of Urban Versus Rural Counties Where Respondents Provide Services
N = 1,430. Note: Number is greater than total number of respondents (846) because respondents could provide services in multiple counties. Source: PSC Survey; U.S. Census Bureau. 2010. County Rurality Level. Accessed July 29, 2021. http://www2.census.gov/geo/docs/reference/ua/County_Rural_Lookup.xlsx
Telehealth Use Around two-thirds of respondents who serve each of the adult populations provided more than half of
their behavioral health services via telehealth in the 30 days prior to taking the survey, with very few (5
percent or less) not providing any appointments via telehealth (Exhibit 7).
EXHIBIT 7. Portion of Appointments Provided via Telehealth by Adult Population
N varied by population. Note: Percentages do not total 100 due to rounding.
Urban62%
Rural38%
67%
62%
60%
29%
35%
35%
3%
2%
5%
0% 20% 40% 60% 80% 100%
Adults with a mental illness (N = 381)
Adults with a substance use disorder (N = 202)
Adults with an intellectual and/or developmental disability(N = 258)
More than half Half or less None

5
Similarly, two-thirds of respondents who serve children with a substance use disorder provided more than
half of their services via telehealth in the 30 days prior to taking the survey (Exhibit 8). Slightly fewer
provided that level of telehealth services to children with a serious emotional disturbance (58 percent)
and children with an intellectual and/or developmental disability (50 percent). Nearly 10 percent of
providers did not conduct any telehealth appointments with children with an intellectual and/or
developmental disability.
EXHIBIT 8. Portion of Appointments Provided via Telehealth by Child Population
N varied by population. Note: Percentages do not total 100 due to rounding.
Most (77 percent) of respondents have plans to integrate telehealth into their practice after the COVID-19
pandemic, with nearly all of those (74 percent) saying they plan to provide a mix of telehealth and face-to-
face services (Exhibit 9). Only 6 percent said they plan to provide only face-to-face services, while 16
percent were still unsure of their post-pandemic service plan.
EXHIBIT 9. Plans for Service Delivery Methods After COVID-19 Pandemic
N = 846. Note: Percentages do not total 100 due to rounding.
When analyzed by type of service provided, at least 60 percent of respondents said they plan to provide a
mix of telehealth and face-to-face services, with the exception of nursing providers (Exhibit 10). Just over
40 percent of this group of providers plans to provide a mix of service delivery types. The largest
percentage of respondents who said they plan to only provide face-to-face services were those providing
nursing services (28 percent) and speech therapy (25 percent).
58%
67%
50%
39%
25%
41%
4%
8%
9%
0% 20% 40% 60% 80% 100%
Children with a serious emotional disturbance (N = 251)
Children with a substance use disorder (N = 64)
Children with an intellectual and/or developmental disability(N = 199)
More than half Half or less None
74%
3%
6%
16%
0% 20% 40% 60% 80% 100%
I/my staff plan to provide a mix of telehealth and face-to-face services.
I/my staff plan to provide only telehealth services.
I/my staff plan to provide only face-to-face services.
I am unsure.

6
EXHIBIT 10. Plans for Service Delivery Methods After COVID-19 Pandemic by Service Provided
N varied by service provided. Note: Percentages do not total 100 due to rounding.
Telehealth Methods Most respondents regularly used video conferencing (90 percent) and phone calls (87 percent) to provide
services via telehealth in the year prior to taking the survey (Exhibit 11). Around 20 percent of
respondents also regularly provided telehealth via email, videoconferencing through their electronic
health record, or via text message.
EXHIBIT 11. Frequency of Telehealth Technologies Used to Provide Services in the Past Year
N = 845. Note: Percentages total more than 100 because providers could select more than one response.
75%
71%
71%
78%
82%
43%
60%
80%
74%
8%
8%
5%
4%
2%
25%
14%
11%
5%
28%
5%
4%
5%
14%
29%
11%
5%
23%
30%
12%
19%
0% 20% 40% 60% 80% 100%
Speech therapy (N = 8)
Psychiatric nursing or physician assistant care (N = 14)
Occupational therapy (N = 14)
Applied behavior analysis (N = 37)
Psychiatry (N = 38)
Nursing (N = 40)
Peer or family support (N = 43)
Psychotherapy (N = 309)
Case management/supports coordination (N = 343)
I/my staff plan to provide a mix of telehealth and face-to-face services.
I/my staff plan to provide only telehealth services.
I/my staff plan to provide only face-to-face services.
I am unsure.
1%
2%
20%
20%
22%
87%
90%
0% 20% 40% 60% 80% 100%
I do not/my staff does not provide telehealth
Other
Text message
Video conferencing through the electronic health record
Phone call
Video conferencing

7
One percent of respondents said that they or their staff do not provide telehealth (Exhibit 11). The reasons
for not providing telehealth included that telehealth either is not applicable to the service they provide or
it is not the preferred service delivery method. Respondents shared:
Mental health is not the place to provide telehealth, as many of the clients do not
have good access to have such appointments; therefore, it is impossible to provide
a good assessment. Hospitalizations have increased with telehealth through
COVID.
—
I am directed to be in the office at all times for services, as 98 percent of my
patients come to the office for services and have the entirety of the time. Patients
have no problems coming to the office and state they prefer it. I do not like audio
only or [telehealth] as patients are often distracted during the session by other
people, the television, pets, etc. Patients sometimes try to do services in a vehicle,
drive through, store, break from work, and even vacation!
Method Usefulness
Among respondents who work with adult populations, at least 60 percent found video conferencing and
video conferencing via electronic health record to be very useful telehealth methods (Exhibit 12). Email
was the least useful method of providing telehealth among these providers. All telehealth methods are
least useful among adults with an intellectual and/or developmental disability with a larger percentage of
respondents saying each method was somewhat or very useless with this population. For example, a
quarter of respondents said that text messages and emails were not useful with these adults.

8
EXHIBIT 12. Usefulness of Telehealth Methods with Adults by Population Served
N varied by response between 48 respondents serving adults with a substance use disorder via email and 448 respondents serving adults with a mental illness through phone calls. Note: Percentages do not total 100 due to rounding.
Respondents who serve children generally rated the usefulness of every telehealth method lower than
those who work with adults. Video conferencing and text messaging were the two telehealth methods
rated very useful by the largest percentage of respondents who work with children. For example, 61
percent of providers serving children with a serious emotional disturbance rated video conferencing as a
very useful telehealth method and 50 percent of those serving children with a substance use disorder
rated text messaging as very useful (Exhibit 13). Phone calls were seen as less useful by those serving
children than by those serving adults, with around one-quarter rating this method as either somewhat or
very useless with all three child populations. Email was considered the least useful method of telehealth
when serving children with a substance use disorder and children with an intellectual and/or
developmental disability.
74%
73%
54%
47%
32%
66%
70%
48%
47%
27%
62%
60%
41%
36%
34%
23%
23%
39%
42%
54%
28%
27%
40%
43%
48%
30%
31%
41%
39%
41%
1%
3%
5%
5%
8%
3%
7%
4%
15%
6%
6%
12%
13%
14%
2%
1%
3%
5%
6%
3%
3%
4%
6%
10%
3%
4%
5%
12%
11%
0% 20% 40% 60% 80% 100%
Video conferencing
Video conferencing through EHR
Phone call
Text message
Video conferencing
Video conferencing through EHR
Phone call
Text message
Video conferencing
Video conferencing through EHR
Phone call
Text message
Ad
ults
with
Me
nta
l Illn
ess
Ad
ults
with
a S
ub
sta
nce
Use
Dis
ord
er
Ad
ults
with
an
inte
llectu
al
an
d/o
r d
eve
lop
men
tal
dis
ab
ility
Very useful Somewhat useful Somewhat useless Very useless

9
EXHIBIT 13. Usefulness of Telehealth Methods with Children by Population Served
N varied by response between 14 respondents serving children with a substance use disorder via email and 307 respondents serving children with a serious emotional disturbance through video conferencing. Note: Percentages do not total 100 due to rounding.
Telehealth Issues and Concerns Between 64 and 81 percent of respondents said most telehealth issues and concerns were not a problem,
no matter which telehealth method they used, with the largest percentage reporting no concerns for
clients’ health record privacy and security (Exhibit 14). The exception was connectivity issues, of which
only one-third of respondents said it was not a problem, 57 percent said it was a problem when using
video conferencing, and 20 percent had connectivity issues with phone calls. Only a few respondents had
any issues or concerns when using text messages or email. The two methods with the largest percentage of
issues or concerns were also the two most commonly used methods: video conferencing and phone calls.
61%
47%
31%
56%
41%
58%
60%
35%
50%
36%
51%
43%
32%
44%
42%
30%
40%
44%
27%
38%
35%
35%
42%
33%
29%
34%
40%
40%
31%
28%
5%
9%
16%
10%
7%
7%
5%
16%
11%
14%
10%
12%
19%
8%
10%
4%
4%
9%
8%
15%
7%
6%
21%
5%
5%
9%
17%
20%
0% 20% 40% 60% 80% 100%
Video conferencing
Video conferencing through EHR
Phone call
Text message
Video conferencing
Video conferencing through EHR
Phone call
Text message
Video conferencing
Video conferencing through EHR
Phone call
Text message
Ch
ildre
n w
ith a
se
rio
us
em
otio
na
l dis
turb
an
ce
Ch
ildre
n w
ith a
su
bst
an
ce
use
dis
ord
er
Ch
ildre
n w
ith a
nin
telle
ctu
al a
nd
/or
deve
lop
men
tal d
isa
bili
ty
Very useful Somewhat useful Somewhat useless Very useless

10
EXHIBIT 14. Percentage of Respondents Who Experienced Issues or Concerns by Telehealth Method
N varied by issue or concern. Note: Percentages total more than 100 because providers could select more than one response. Percentages not labeled on the chart were between 1 and 3 percent of respondents.
Addressing Telehealth Issues and Concerns
Many respondents said that they would change their service delivery method to address certain telehealth
issues, including switching to audio only or offering in-person visits. Others would work with clients to
troubleshoot issues and/or provide education around how to use the technology. Other solutions included
changing meeting times when Internet bandwidth would be better, identifying locations with free Internet
and/or adequate privacy, and offering space at the agency for telehealth visits. In addition, some agencies
offered IT support to providers to troubleshoot issues.
Respondents also expressed that they sometimes had trouble with documentation when providing
services via telehealth. To address this concern, some created alternatives to obtaining consent, including
updating policies to include telehealth, documenting verbal consent, mailing consent forms, and using
electronic signatures. Furthermore, providers offered technology equipment and hotspots to those who
may not otherwise be able to access care through telehealth. A few also provided virtual-friendly
supplemental activities and resources.
Recommended Telehealth Tools by Population
Respondents recommended the use of particular telehealth tools with certain client populations,
including video-based technologies and phone calls, and some recommended telehealth generally for
specific populations. A few respondents said that in-person appointments were better for everyone and
that telehealth does not work for children or teens, those with an intellectual and/or developmental
disability, or those without Internet or technology.
Video-based Technologies
Video-based technologies were recommended by several respondents for all client populations, especially
for children and teens, when compared to audio-only phone calls. These technologies were also
recommended by several respondents for adults, those with an intellectual and/or developmental
disability or who are nonverbal, and for groups and families.
81%
77%
70%
64%
66%
32%
13%
16%
13%
22%
14%
57% 13%
10%
18%
23%
25%
27%
20%
0% 50% 100%
Concern for privacy and security of client’s protected health information (N = 788)
Difficulty receiving informed consent (N = 779)
Diagnostic challenges (N = 778)
Client satisfaction, engagement, and/or retention issues(N = 803)
Quality of care concerns (N = 785)
Connectivity problems (N = 805)
This was not an issue. Video conferencing Video conferencing through EHR Phone call Text message Email Other

11
Phone Calls
Phone calls were recommended specifically for those who lack Internet or technology equipment; older
adults or those who struggle with technology; those who require a low level of care; those with specific
diagnoses, such as social phobias or anxieties; and parents or caregivers.
Specific Populations
Others highlighted that telehealth is good for those in rural areas, those who lack transportation or have
mobility challenges, and adults and families. Others said it depends on the individual or specific
diagnoses.
Practicing Telehealth Nearly all respondents said they feel comfortable using telehealth (90 percent), are knowledgeable about
telehealth best practices (86 percent), want to continue using telehealth in the future (86 percent), and
can provide quality care via telehealth (83 percent), as shown in Exhibit 15.
EXHIBIT 15. Percentage Who Agree with Statements Regarding Telehealth Use
N varied between 842 and 845 per response.
Telehealth Benefits Around 80 percent of respondents agreed that telehealth is important to their organization’s success, is
effective in improving client outcomes, and allows them to reach new clients (Exhibit 16). Just under
three-quarters said that telehealth allows them to see more clients than face-to-face appointments and
reduces the number of missed appointments. Around two-thirds agreed that telehealth increases client
satisfaction, engagement, and retention and allows them to serve a larger geographic area.
83%
86%
86%
90%
10%
8%
11%
7%
7%
6%
3%
3%
0% 20% 40% 60% 80% 100%
I/my staff can provide quality care to my clients with telehealth.
I want to continue using telehealth in the future.
I am knowledgeable about telehealth best practices.
I feel comfortable using telehealth.
Agree Neutral Disagree

12
EXHIBIT 16. Percentage Who Agree with Statements Regarding Telehealth Benefits
N varied between 842 and 845 per response. Note: Percentages may not total 100 due to rounding.
Telehealth Training Regarding telehealth training needs, nearly three-quarters of respondents said that suicide prevention
and assessment (74 percent) and client satisfaction, engagement, and/or retention (72 percent) were high
priorities (Exhibit 17). Around half place high priority on training for privacy and security of personal
health information (56 percent), telehealth tips for a successful visit (55 percent), and substance use
disorder assessment and treatment (50 percent).
63%
68%
71%
73%
79%
79%
80%
25%
21%
16%
15%
14%
16%
14%
13%
11%
13%
12%
7%
5%
6%
0% 20% 40% 60% 80% 100%
Telehealth allows me/my staff to serve a larger geographicregion than I was serving previously.
Telehealth increases client satisfaction, engagement, and/orretention.
Telehealth reduces the number of appointments missed bymy/my staff's clients.
Telehealth allows me/my staff to see more clients than withface-to-face services.
Telehealth allows me/my staff to reach new clients.
Telehealth is effective in improving client outcomes.
Telehealth is important to the success of my organization.
Agree Neutral Disagree
13
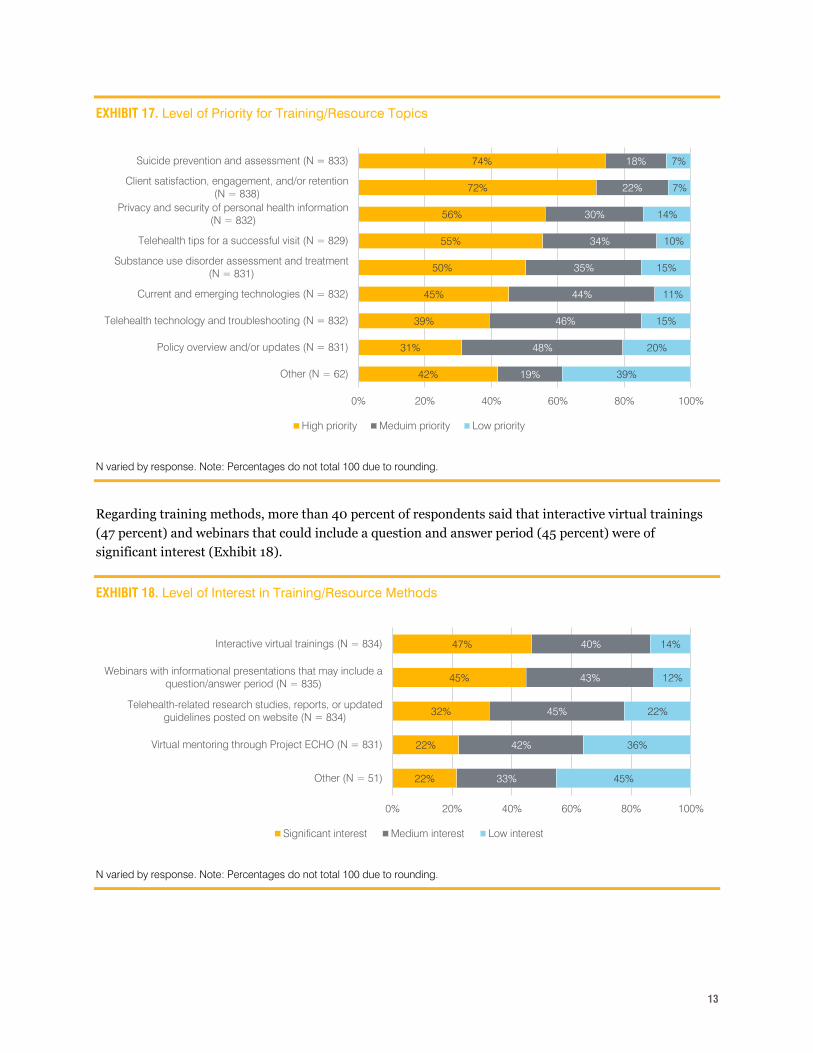
EXHIBIT 17. Level of Priority for Training/Resource Topics
N varied by response. Note: Percentages do not total 100 due to rounding.
Regarding training methods, more than 40 percent of respondents said that interactive virtual trainings
(47 percent) and webinars that could include a question and answer period (45 percent) were of
significant interest (Exhibit 18).
EXHIBIT 18. Level of Interest in Training/Resource Methods
N varied by response. Note: Percentages do not total 100 due to rounding.
42%
31%
39%
45%
50%
55%
56%
72%
74%
19%
48%
46%
44%
35%
34%
30%
22%
18%
39%
20%
15%
11%
15%
10%
14%
7%
7%
0% 20% 40% 60% 80% 100%
Other (N = 62)
Policy overview and/or updates (N = 831)
Telehealth technology and troubleshooting (N = 832)
Current and emerging technologies (N = 832)
Substance use disorder assessment and treatment(N = 831)
Telehealth tips for a successful visit (N = 829)
Privacy and security of personal health information(N = 832)
Client satisfaction, engagement, and/or retention(N = 838)
Suicide prevention and assessment (N = 833)
High priority Meduim priority Low priority
22%
22%
32%
45%
47%
33%
42%
45%
43%
40%
45%
36%
22%
12%
14%
0% 20% 40% 60% 80% 100%
Other (N = 51)
Virtual mentoring through Project ECHO (N = 831)
Telehealth-related research studies, reports, or updatedguidelines posted on website (N = 834)
Webinars with informational presentations that may include aquestion/answer period (N = 835)
Interactive virtual trainings (N = 834)
Significant interest Medium interest Low interest

14
Appendix A: Counties Where Respondents Provide Services
County Percentage of Respondents
Providing Services
Alcona 0.5%
Alger 0.7%
Allegan 1.1%
Alpena 0.8%
Antrim 1.7%
Arenac 0.5%
Baraga 0.9%
Barry 0.5%
Bay 0.6%
Benzie 0.1%
Berrien 0.9%
Branch 0.0%
Calhoun 0.4%
Cass 0.0%
Charlevoix 2.1%
Cheboygan 2.0%
Chippewa 3.8%
Clare 0.7%
Clinton 12.4%
Crawford 0.0%
Delta 0.4%
Dickinson 1.5%
Eaton 11.9%
Emmet 1.8%
Genesee 10.6%
Gladwin 0.7%
Gogebic 1.4%
Grand Traverse 0.0%
Gratiot 1.1%
Hillsdale 1.2%
Houghton 1.5%
Huron 1.9%
Ingham 14.3%
Ionia 0.2%
Iosco 1.1%
County Percentage of Respondents
Providing Services
Iron 1.4%
Isabella 0.9%
Jackson 1.9%
Kalamazoo 0.1%
Kalkaska 1.7%
Kent 2.6%
Keweenaw 1.3%
Lake 0.0%
Lapeer 0.4%
Leelanau 0.0%
Lenawee 0.1%
Livingston 0.4%
Luce 0.8%
Mackinac 2.1%
Macomb 14.1%
Manistee 0.0%
Marquette 1.5%
Mason 0.1%
Mecosta 1.9%
Menominee 1.3%
Midland 2.2%
Missaukee 0.0%
Monroe 0.1%
Montcalm 2.1%
Montmorency 0.5%
Muskegon 0.6%
Newaygo 0.7%
Oakland 11.1%
Oceana 0.1%
Ogemaw 1.3%
Ontonagon 0.7%
Osceola 0.9%
Oscoda 1.3%
Otsego 1.8%
Ottawa 4.8%

15
County Percentage of Respondents
Providing Services
Presque Isle 0.7%
Roscommon 0.0%
Saginaw 3.9%
Sanilac 0.5%
Schoolcraft 2.2%
Shiawassee 2.2%
St. Clair 6.3%
County Percentage of Respondents
Providing Services
St. Joseph 1.7%
Statewide 0.2%
Tuscola 3.4%
Van Buren 0.2%
Washtenaw 0.8%
Wayne 6.7%
Wexford 0.0%
N = 846. Note: Percentages total more than 100 because providers could select more than one response.