
Community Matters: Expanding Economic Opportunity for Local Residents and Businesses
34
Expanding Economic Opportunity for Local Residents and Business March 19, 2015 #caseychat
-
Upload
the-annie-e-casey-foundation -
Category
Government & Nonprofit
-
view
422 -
download
0
Transcript of Community Matters: Expanding Economic Opportunity for Local Residents and Businesses
Expanding Economic Opportunity for Local Residents and Business
March 19, 2015
#caseychat

2
I. IntroductionII. BackgroundIII. The Context for Economic Inclusion
Efforts in East BaltimoreIV. Closing the Skills Gap and
Strengthening Workforce PipelinesV. Economic Inclusion Policies and
ProgressVI. Recommendations
Webinar Overview
#caseychat
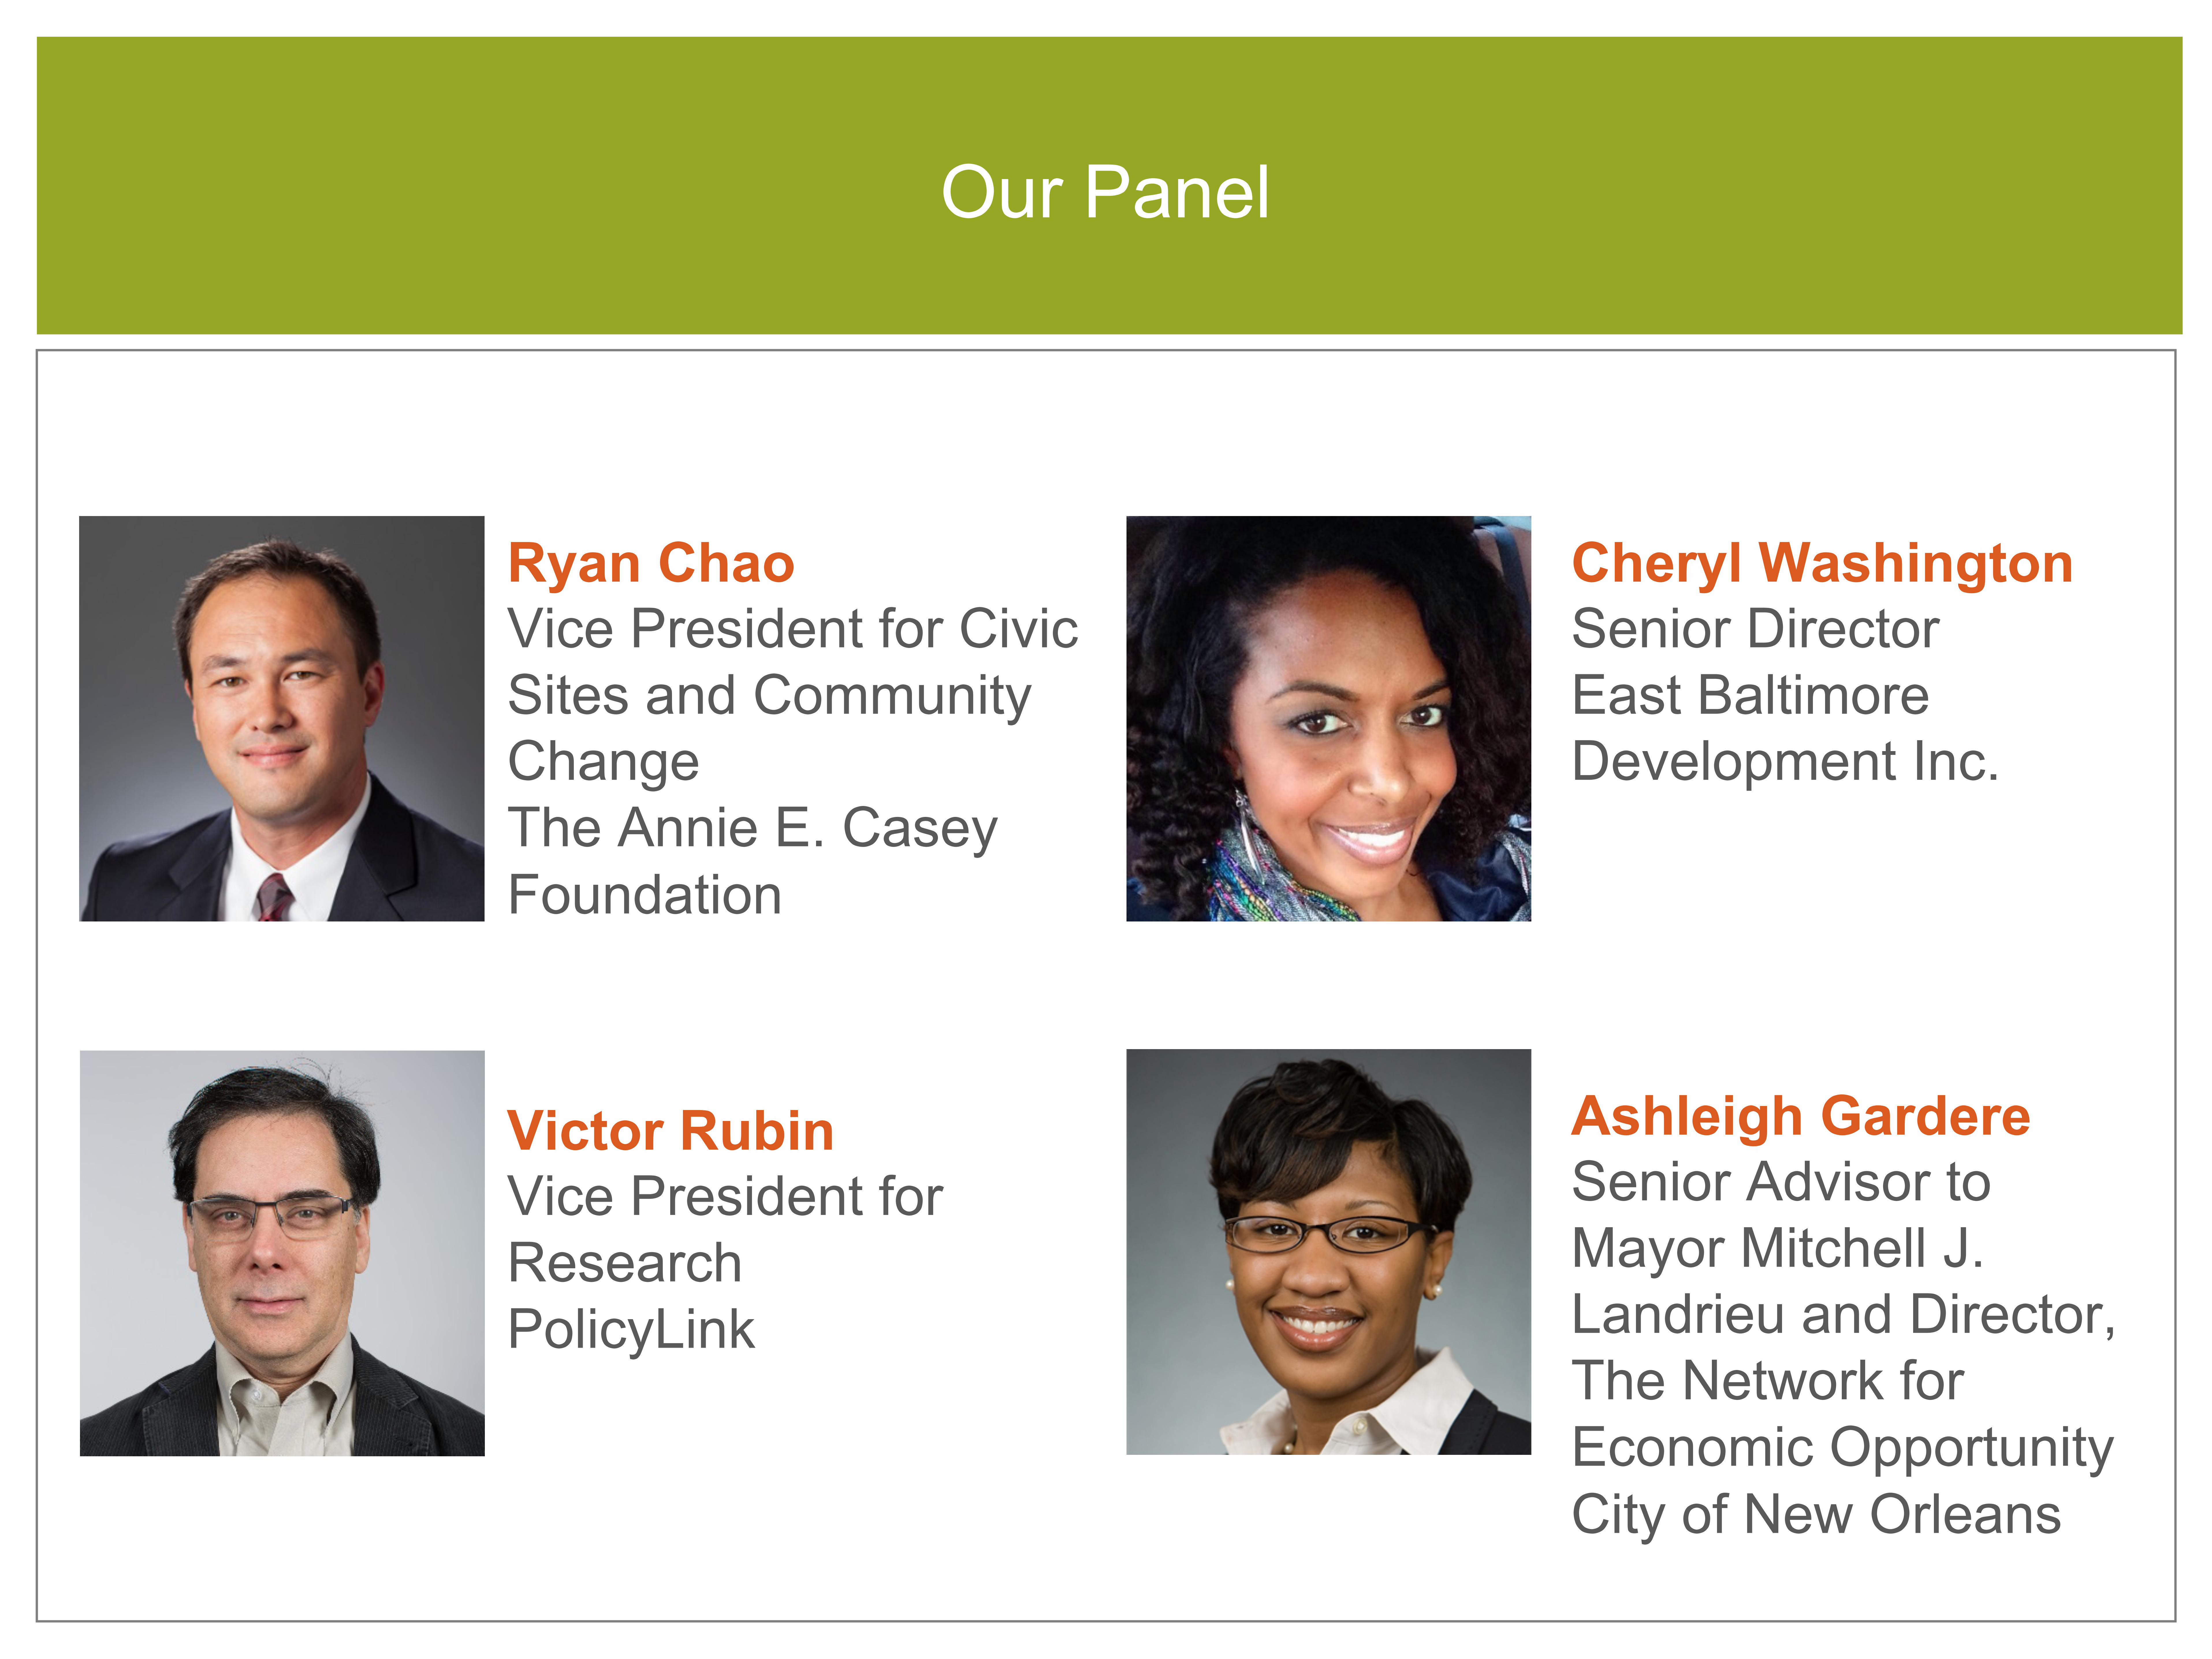
Our Panel
Ryan ChaoVice President for Civic Sites and Community ChangeThe Annie E. Casey Foundation
Victor RubinVice President for ResearchPolicyLink
Cheryl WashingtonSenior DirectorEast Baltimore Development Inc.
Ashleigh GardereSenior Advisor to Mayor Mitchell J. Landrieu and Director, The Network for Economic OpportunityCity of New Orleans

THE CONTEXT FOR ECONOMIC INCLUSION EFFORTS IN EAST BALTIMORE
5
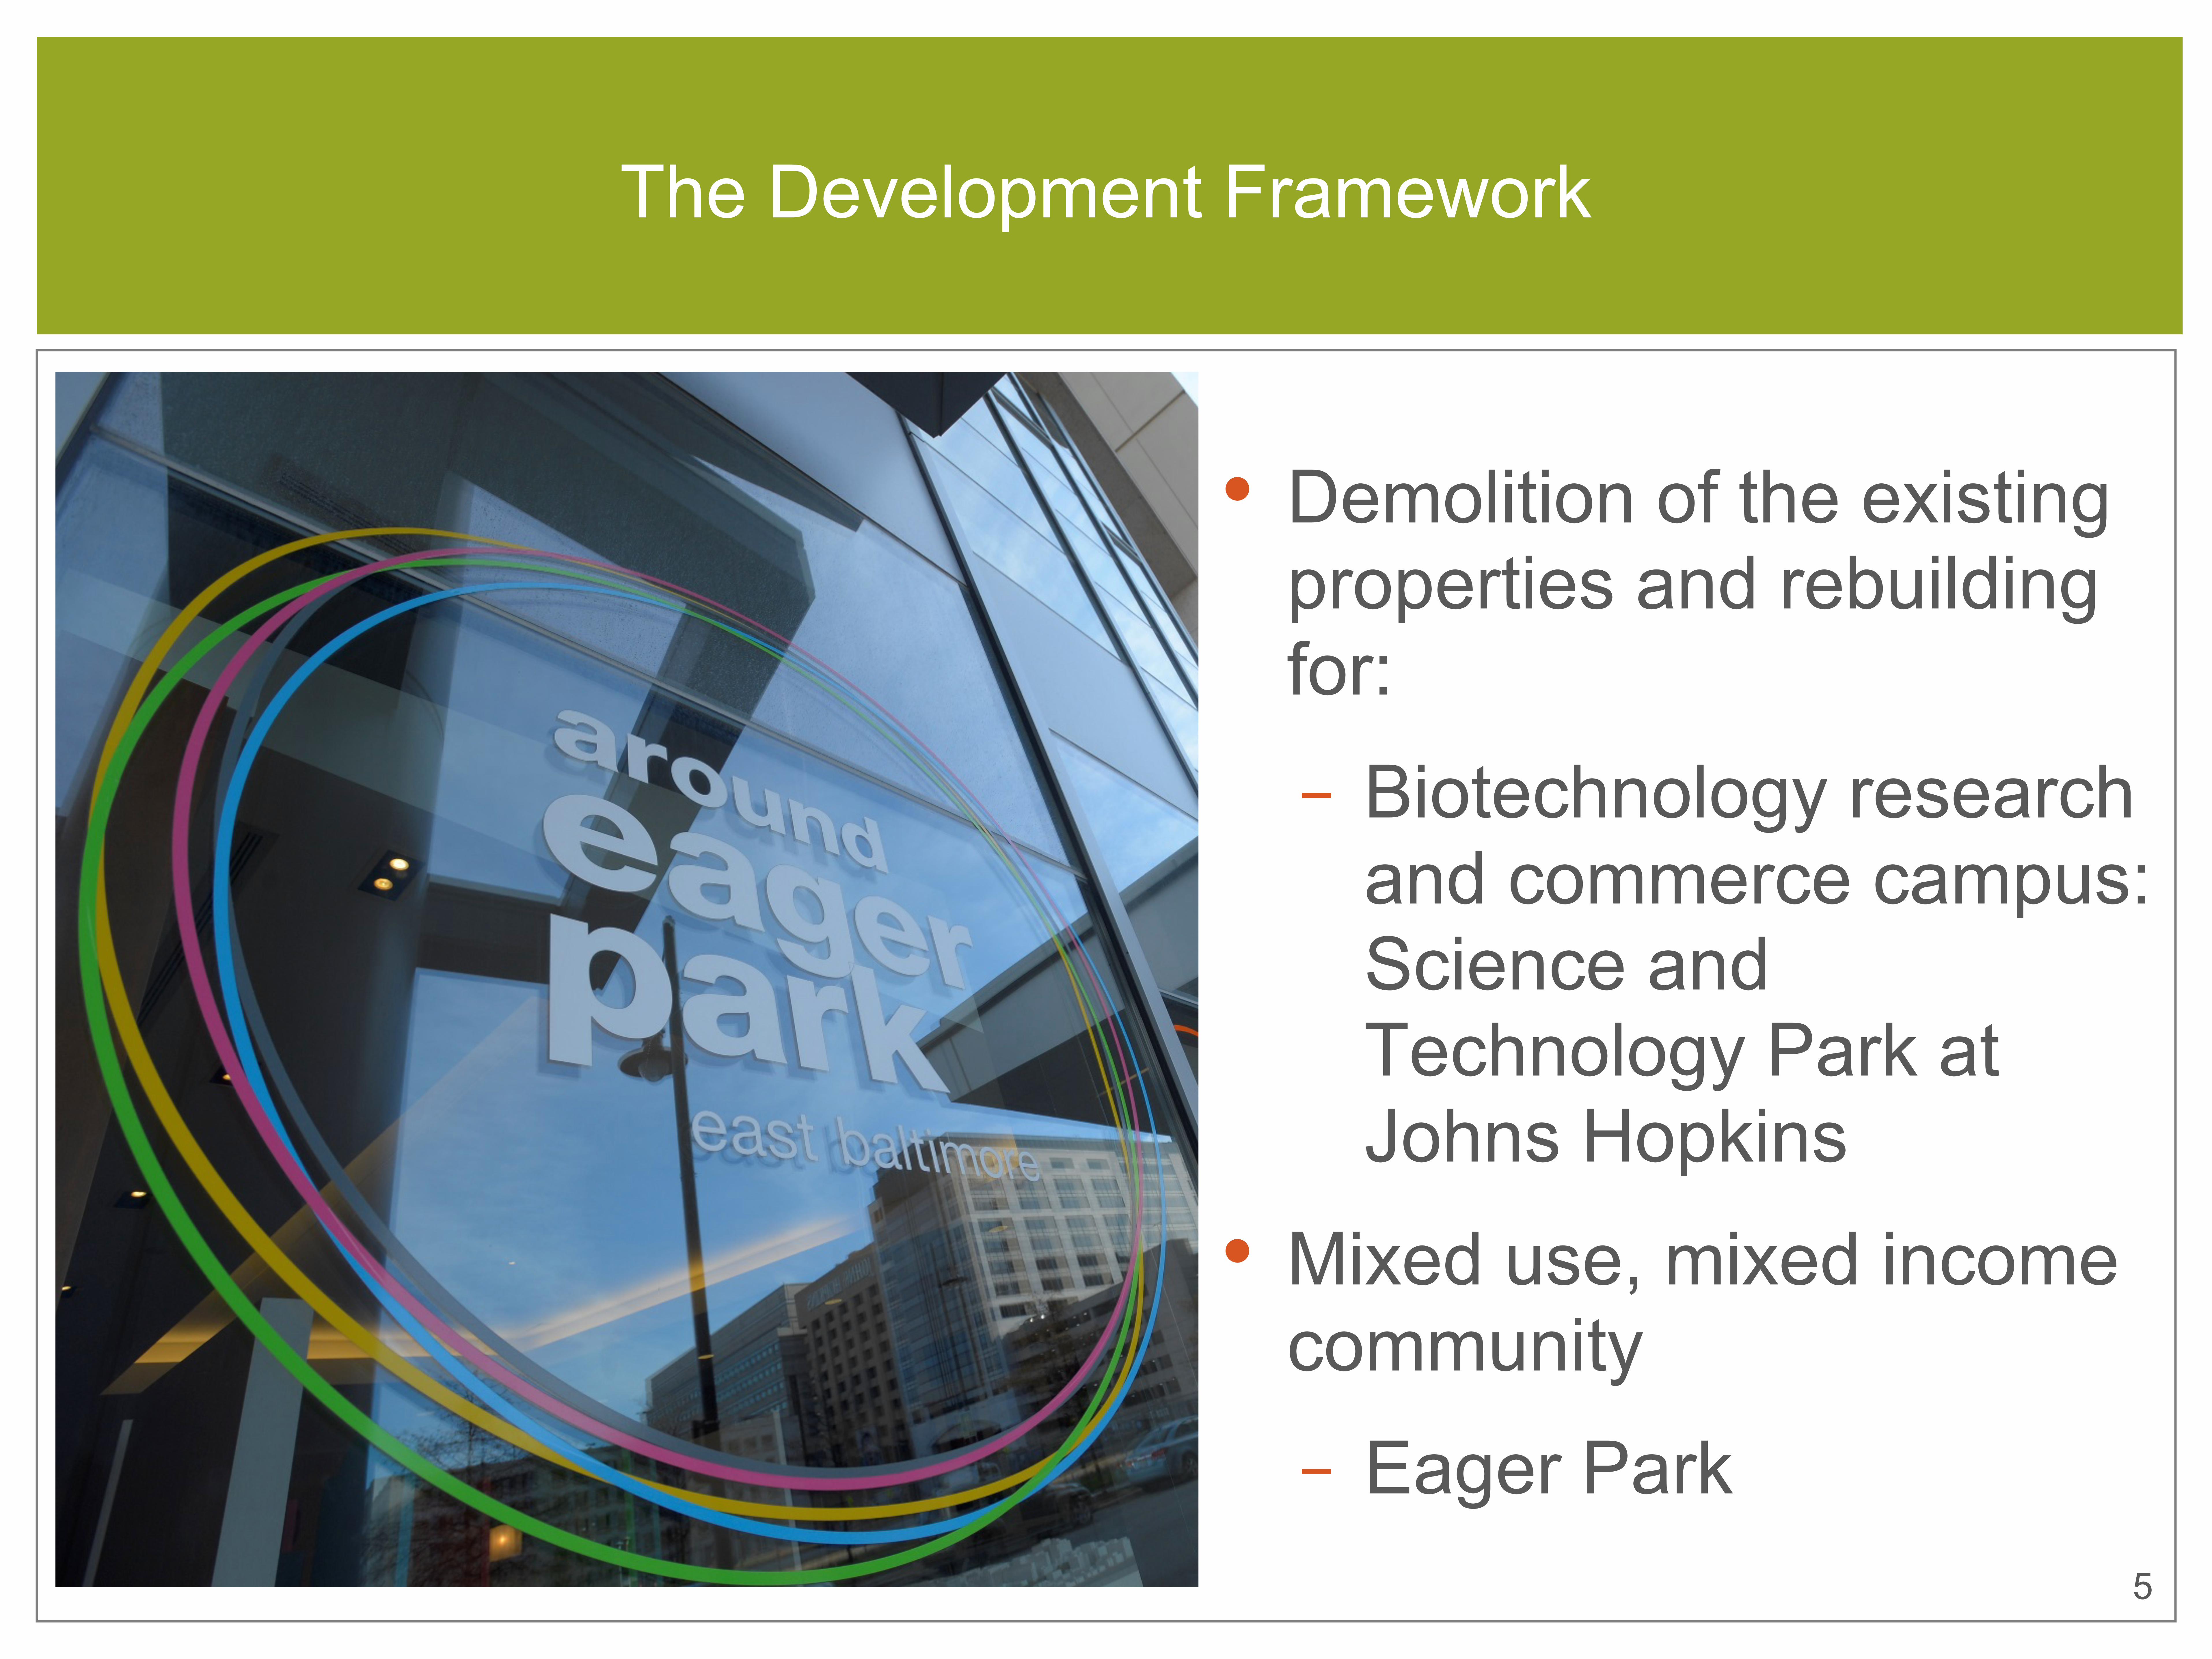
• Demolition of the existing properties and rebuilding for:– Biotechnology research and commerce campus: Science and Technology Park at Johns Hopkins
• Mixed use, mixed income community– Eager Park
The Development Framework

The Context for Economic Inclusion:Project Area 2006 Plan and 2011 Recommendations
Source: Forest City – New East Baltimore Partnership, 2012.
2006 2011 Recommendations
6

Planned and Built Development
Planned (original) Planned (revised) Built (Spring 2012)
Housing 1,683 new, 389 rehab 478 new, 68 rehab
Retail 268,000 sq.ft. 100,000 sq.ft. 18,000 sq.ft.
Commercial 2,805,000 sq.ft. 1,800,000 sq.ft. 280,000 sq.ft.
Hotel 80,000 sq.ft. 160,000 sq.ft. 0
Source: Planned (original) data from Clinch, 2009. Planned (revised) and Built (Spring 2012) are from Forest City – New East Baltimore Partnership, 2012. 7

8
• Projected jobs to be created: – 12,000 construction (2006-2012) and
– 3,000 permanent (by 2013)• Number of people hired: – 4,692 construction (2006-2014) – 950 permanent
• 641 local hires on construction;; 270 of these people came from pipeline
Project Job Creation and Hiring
Photo credit: Baltimore Integration Partnership.
9
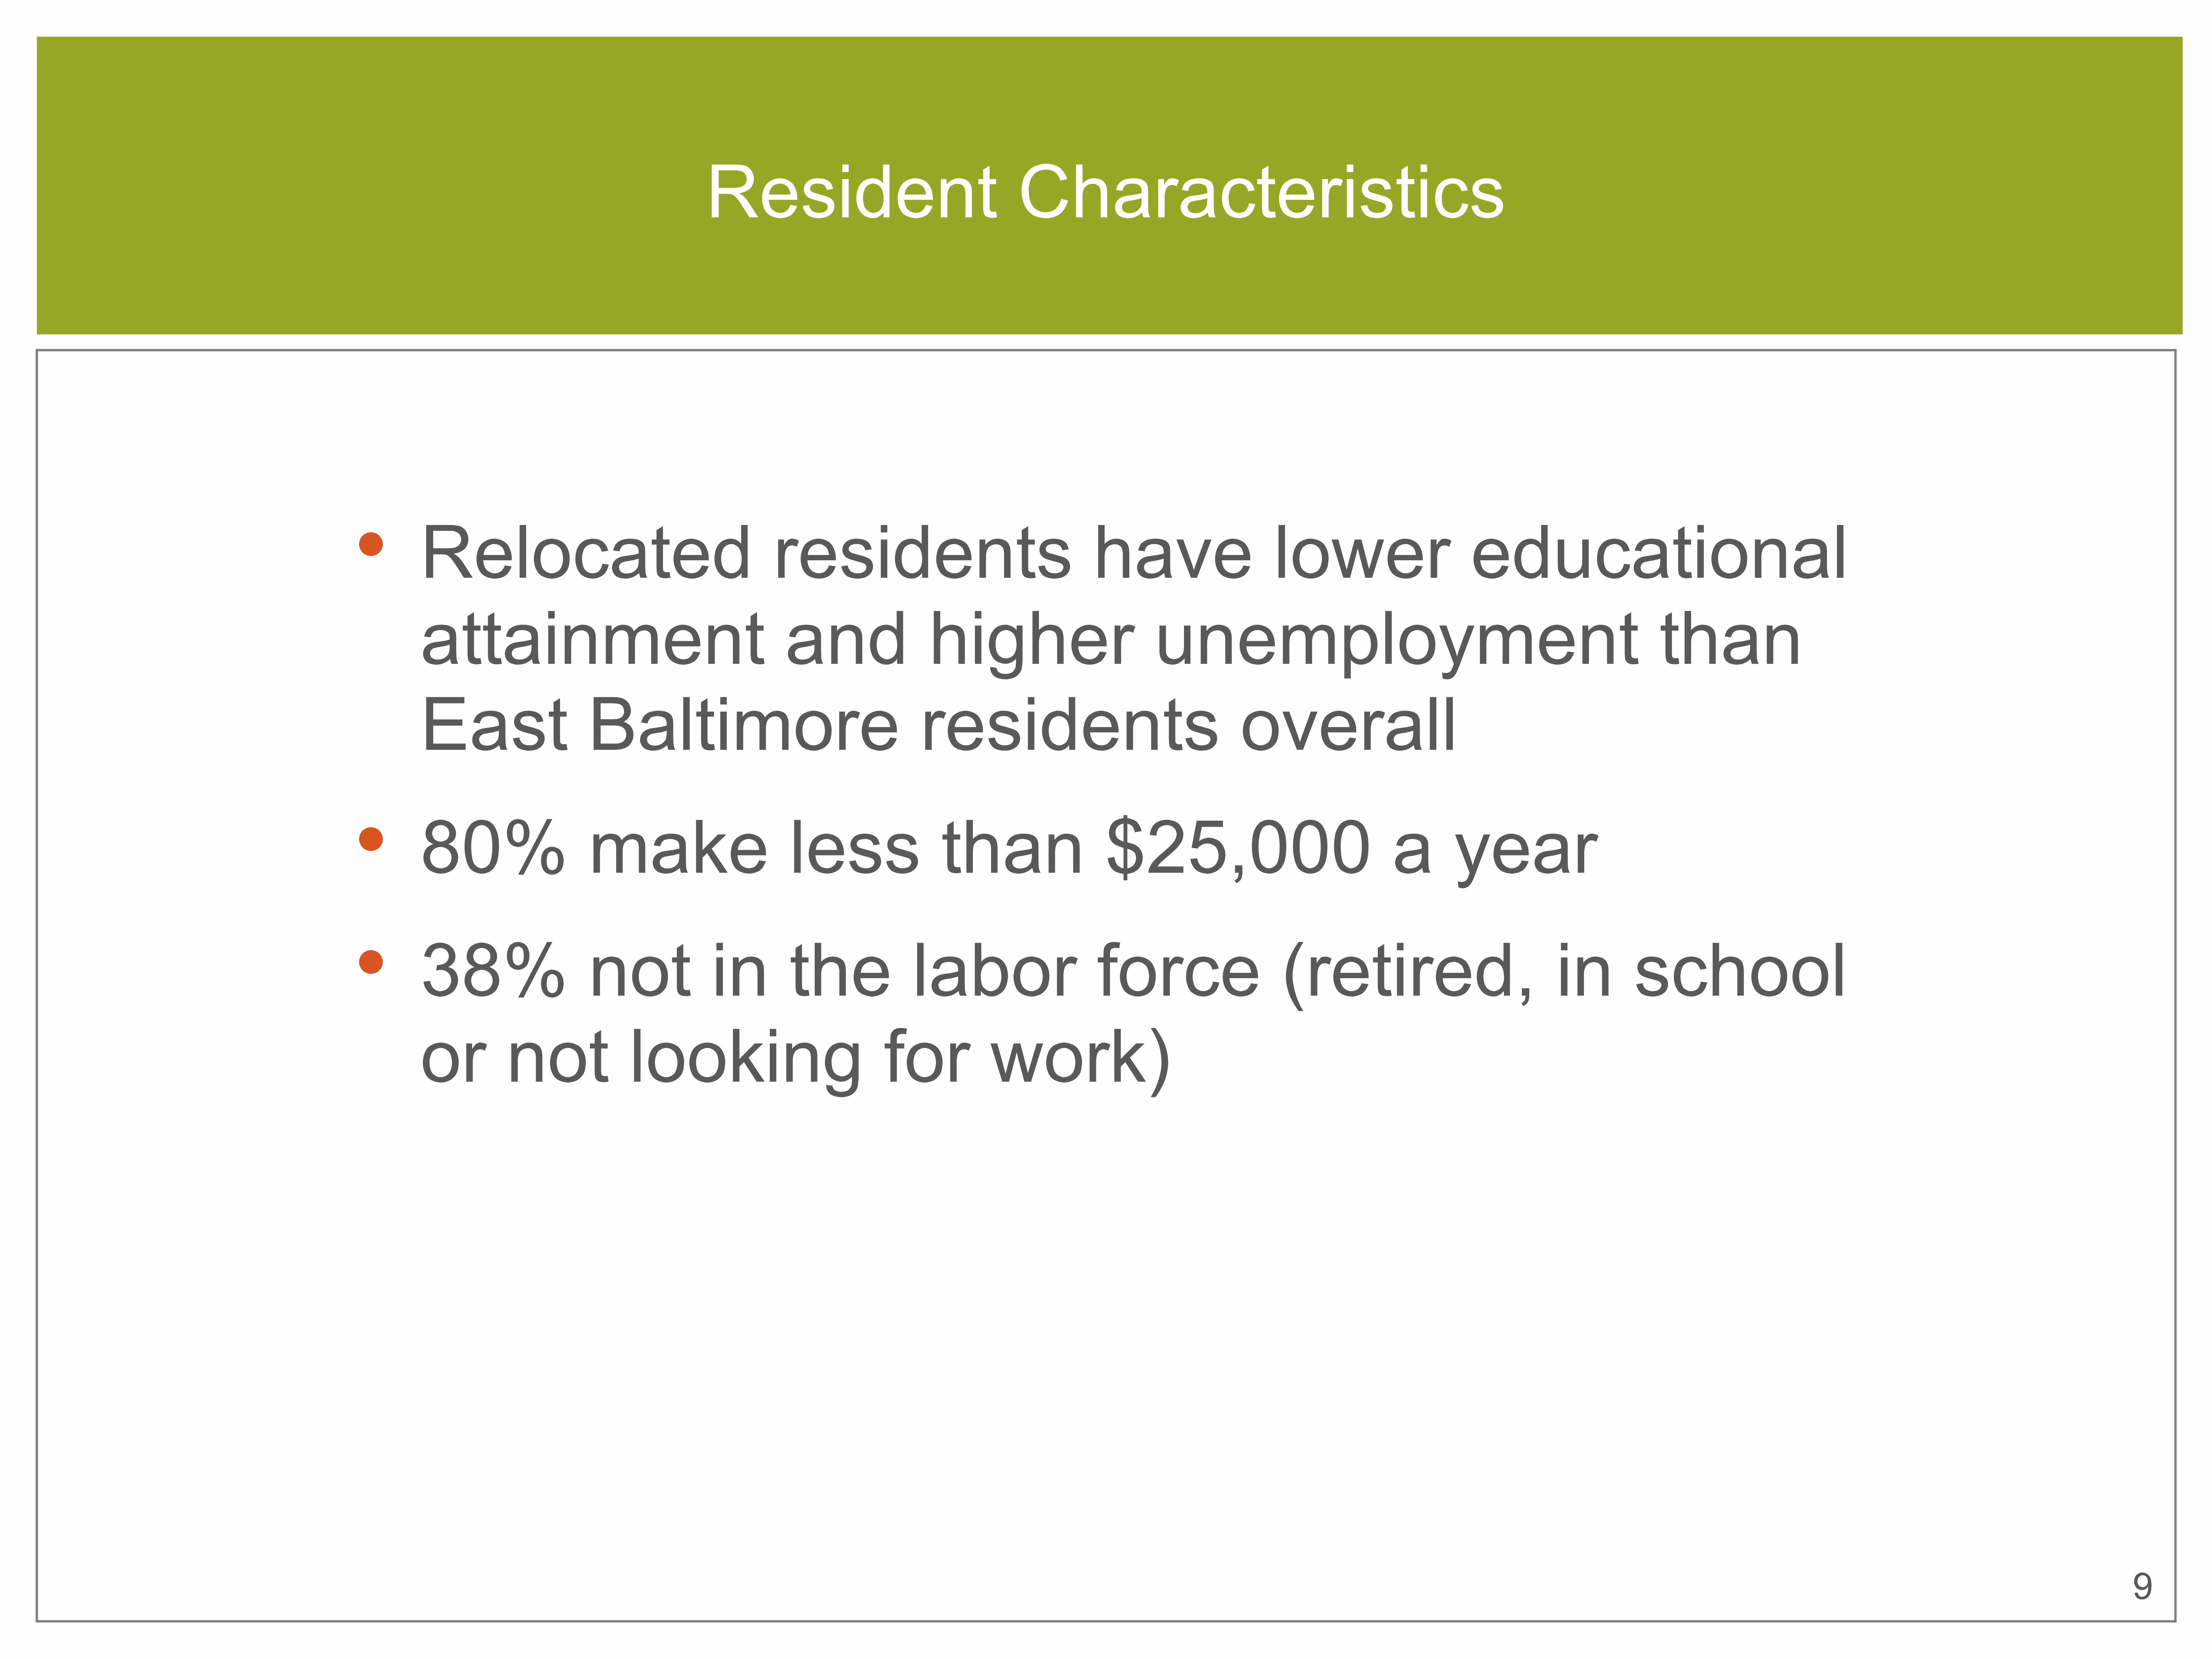
• Relocated residents have lower educational attainment and higher unemployment than East Baltimore residents overall• 80% make less than $25,000 a year• 38% not in the labor force (retired, in school or not looking for work)
Resident Characteristics

CLOSING THE SKILLS GAP AND STRENGTHENING WORKFORCE PIPELINES
Photo credit: Baltimore Integration Partnership.

11
• Minimal education• Basic education• Advanced education
Workforce Development Strategies for Diverse Populations

Minimal Education
• Significantly less than high school• Strategies– Supported employment– Social enterprises– Alternative staffing organizations
12

Basic Education
• High school diploma• Strategies– Linked learning– Paid experience– Bridge programs to career and technical education
13

Advanced Education
• Some college or vocational• Strategies– Biotechnical training– Transferable skills– Incumbent worker development
Photo credit: BioTechnical Institute of Maryland Inc. 14

15
• Expanding and sustaining a network– One-stop centers– Dual-customer approach
• Attracting high road employers• Increasing regional access to jobs– Baltimore Integration Partnership– Baltimore Opportunity Collaborative
Strengthening Workforce Pipelines

ECONOMIC INCLUSION POLICIES AND PROGRESS
Photo credit: Baltimore Integration Partnership.
17
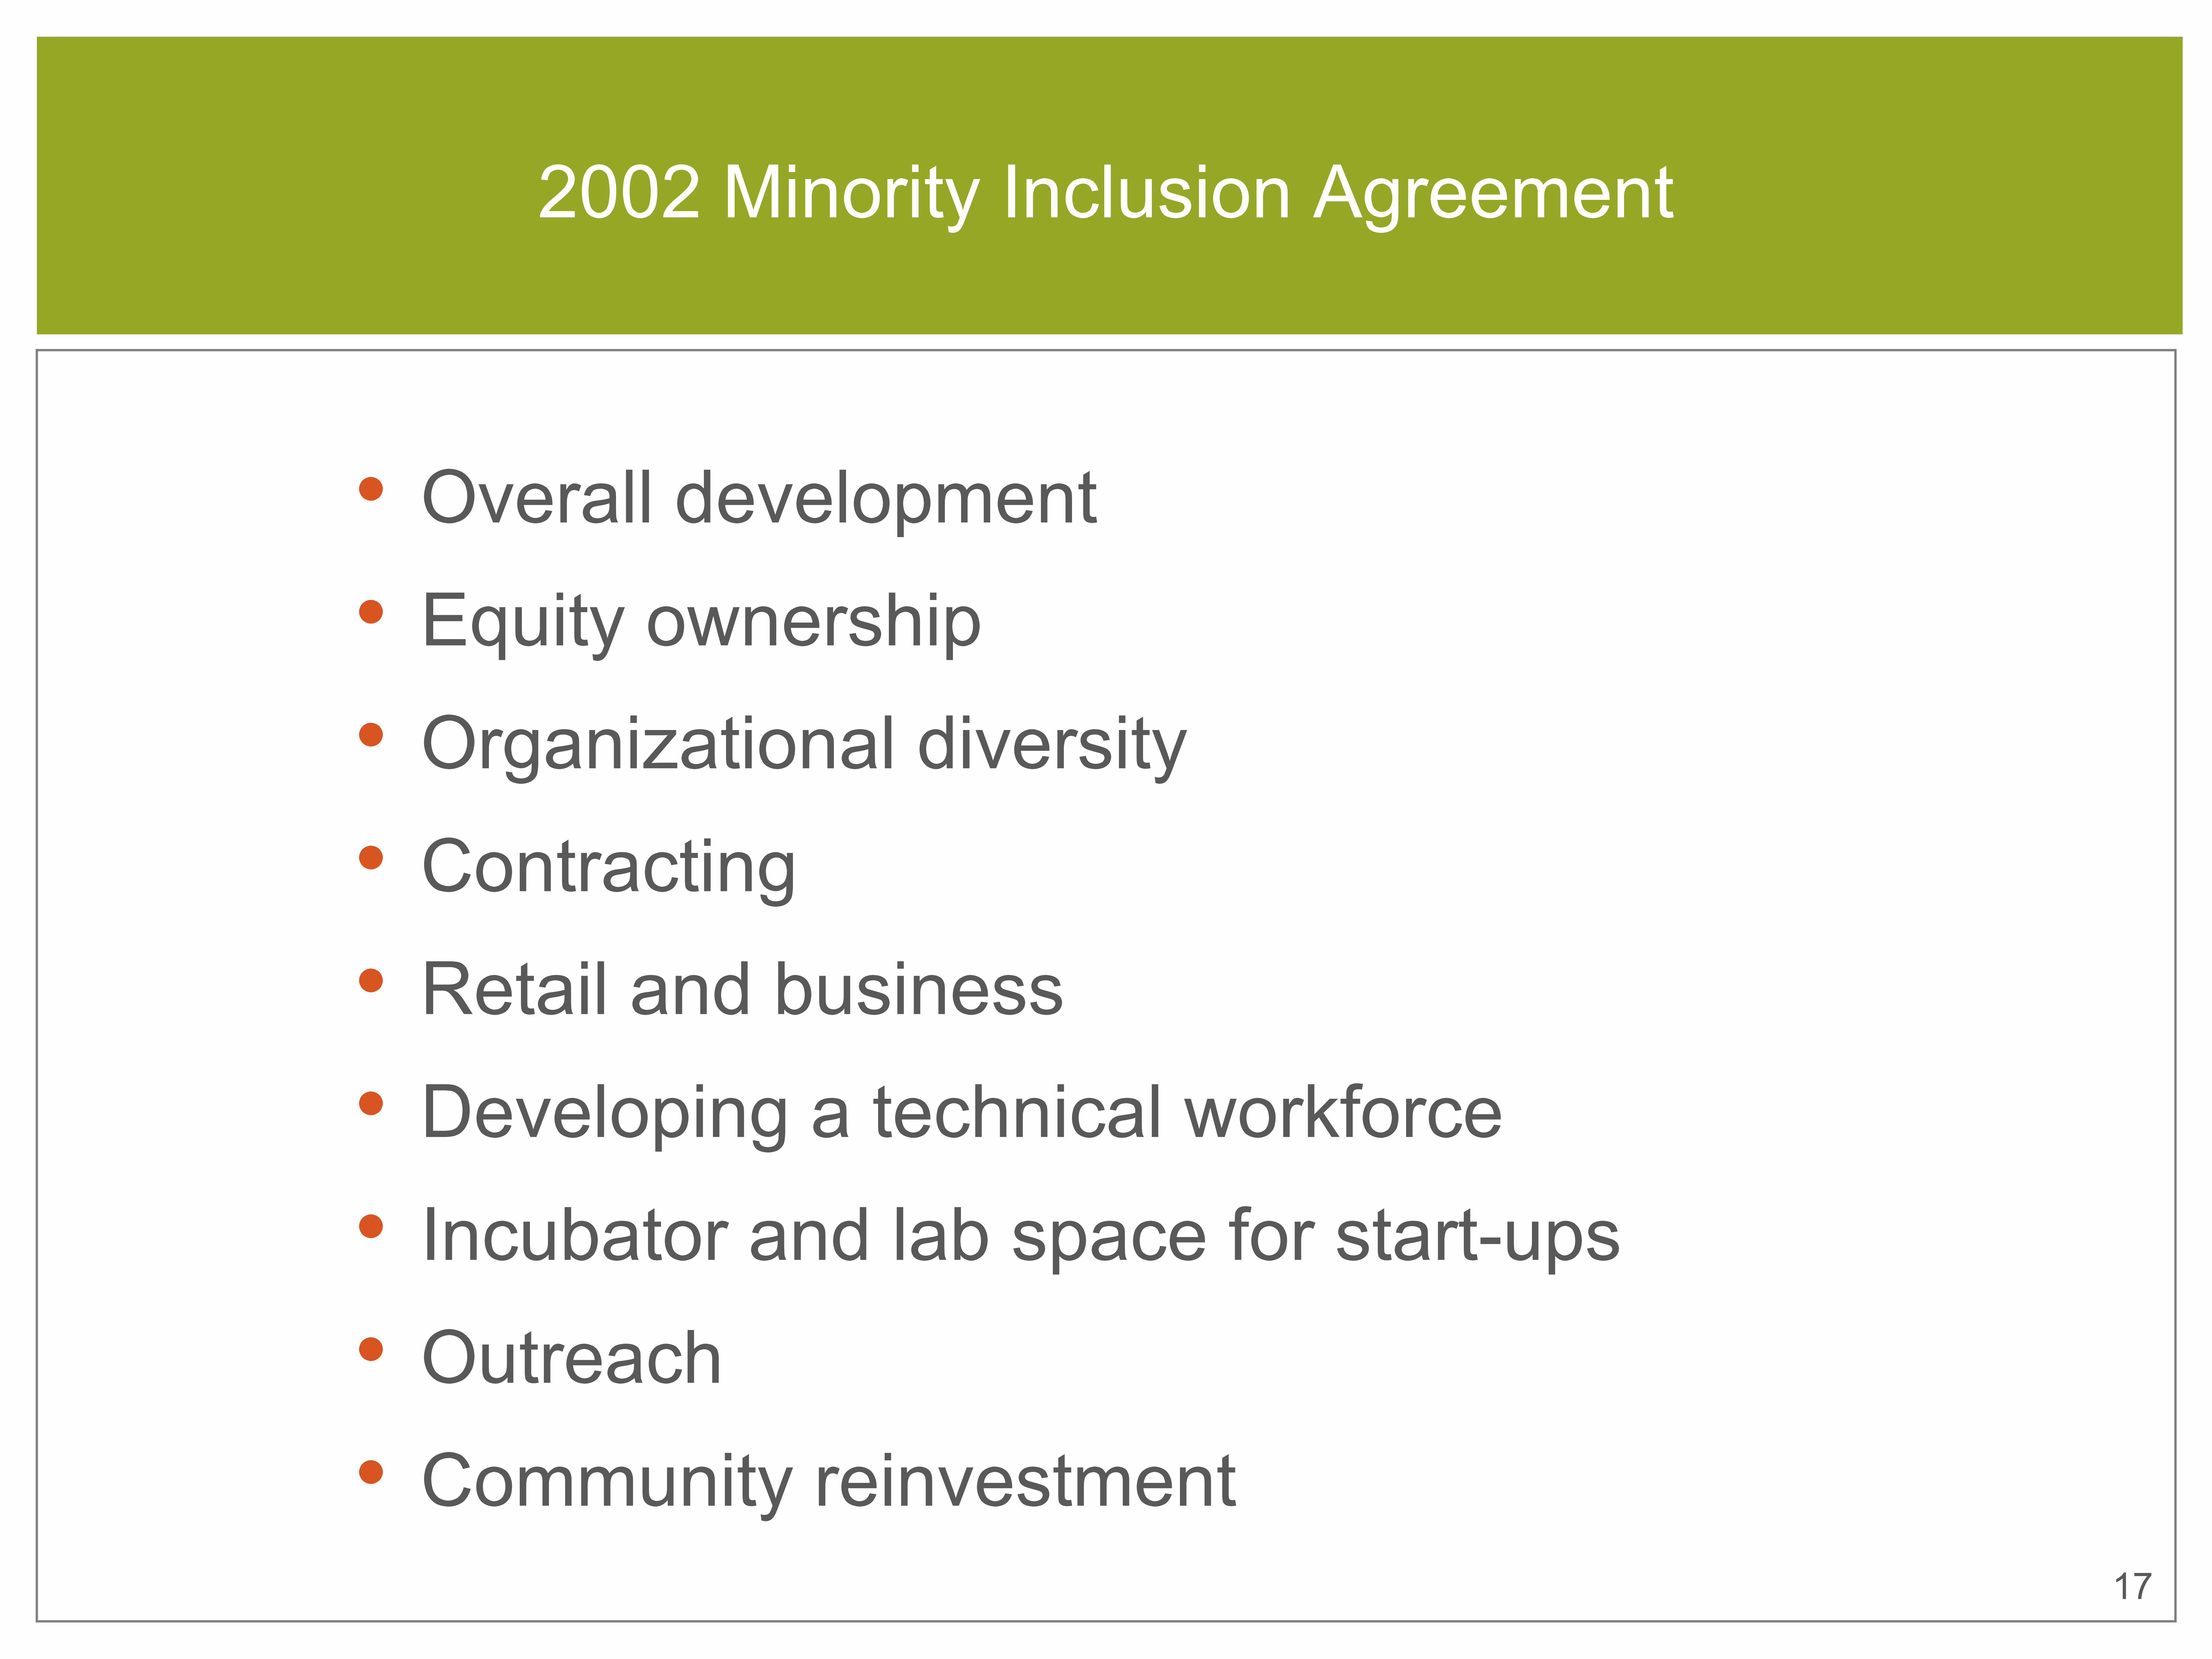
• Overall development• Equity ownership• Organizational diversity• Contracting• Retail and business• Developing a technical workforce• Incubator and lab space for start-ups• Outreach• Community reinvestment
2002 Minority Inclusion Agreement

18
Economic Inclusion Policies and Progress: East Baltimore
Local and Targeted Hire Goals (Percentage)
2011 Goal 2013 Goal Actual
Commercial 15% local23% Baltimore City12% East Baltimore
28% Baltimore City
Residential 20% local25% Baltimore City 12% East Baltimore
30% Baltimore City
Source: DPN group and Sage Policy Group Inc., March 2014.

19
• San Francisco Local Hire Ordinance– 50% local by 2017;; 25% disadvantaged
• Los Angeles CRA Construction Careers– 30% targeted hire
• Boston Kroc Center – 51% local;; 51% minority;; 15% women
• Missouri DOT Workforce Development– 14.7% minority;; 6.9% women;; 20% on-the-job trainees
Local and Targeted Hire: Benchmarks
20
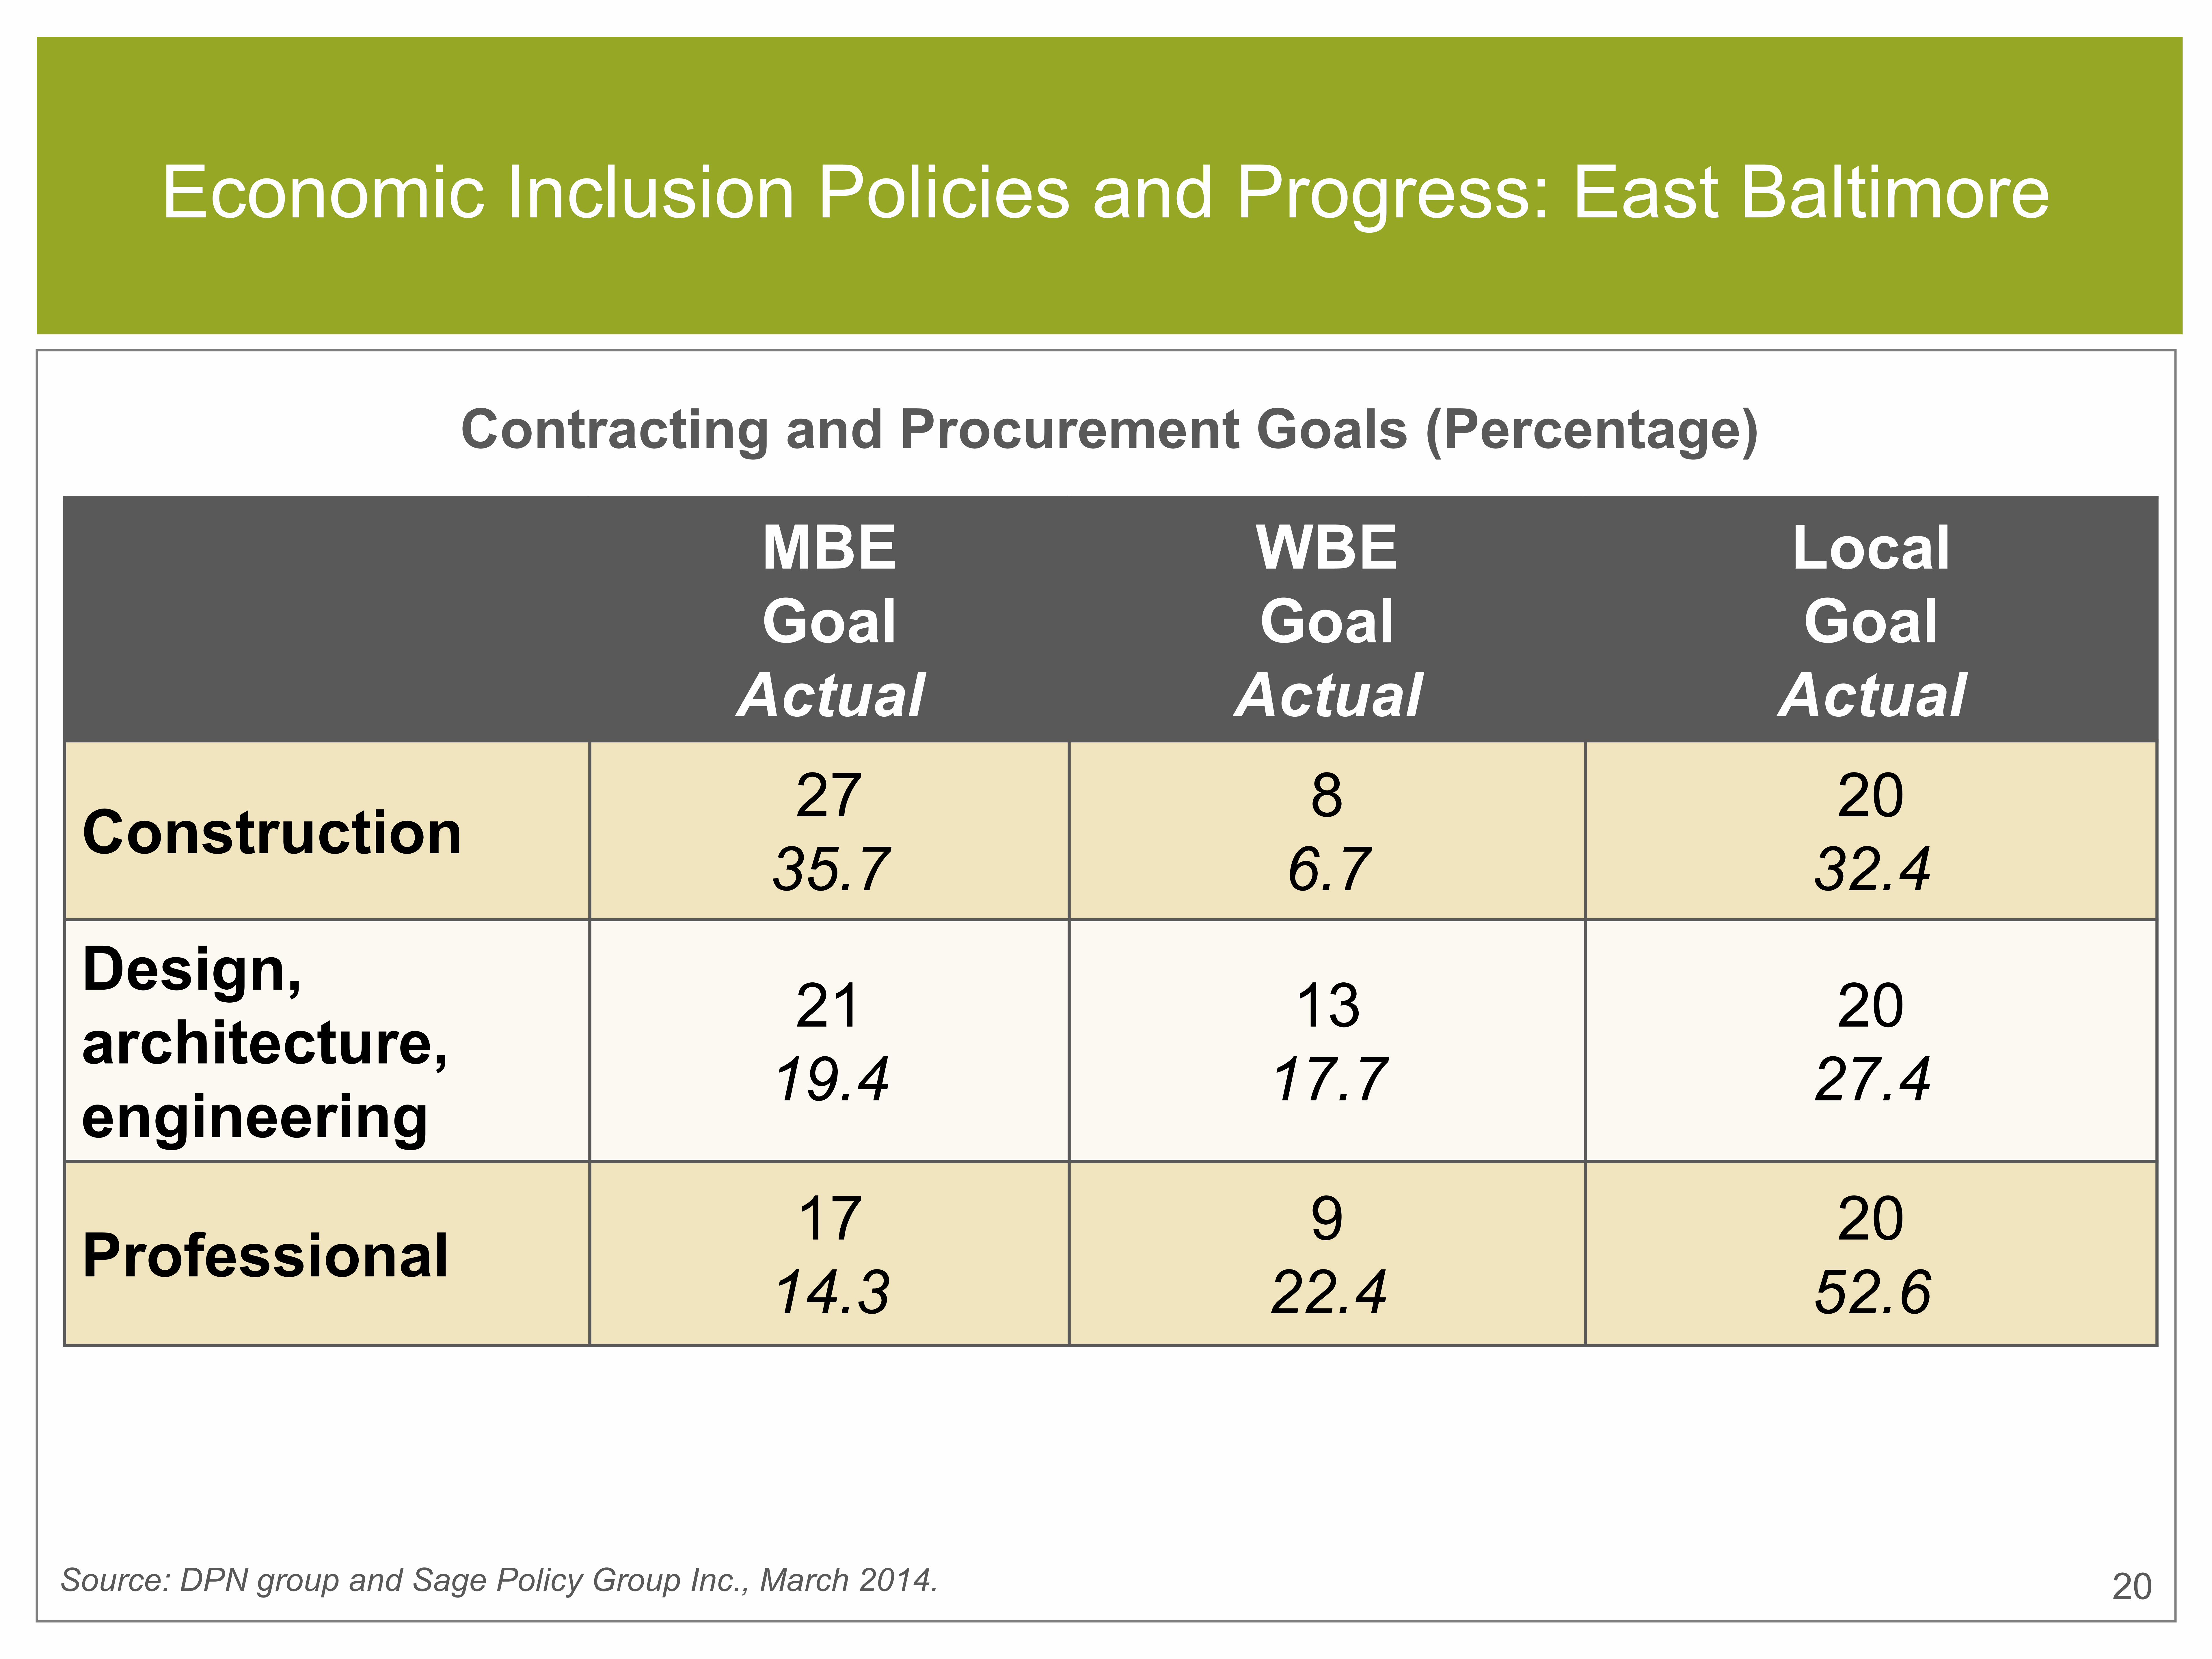
Economic Inclusion Policies and Progress: East Baltimore
Contracting and Procurement Goals (Percentage)
Source: DPN group and Sage Policy Group Inc., March 2014.
MBE GoalActual
WBE GoalActual
Local GoalActual
Construction 2735.7
86.7
2032.4
Design, architecture, engineering
2119.4
1317.7
2027.4
Professional 1714.3
922.4
2052.6

21
• New Orleans Office of Supplier Diversity– 35% DBE;; 50% local
• Los Angeles Alameda Corridor– 22% DBE
• Boston Kroc Center– 25% minority;; 10% women
Contracting and Procurement: Benchmarks
22
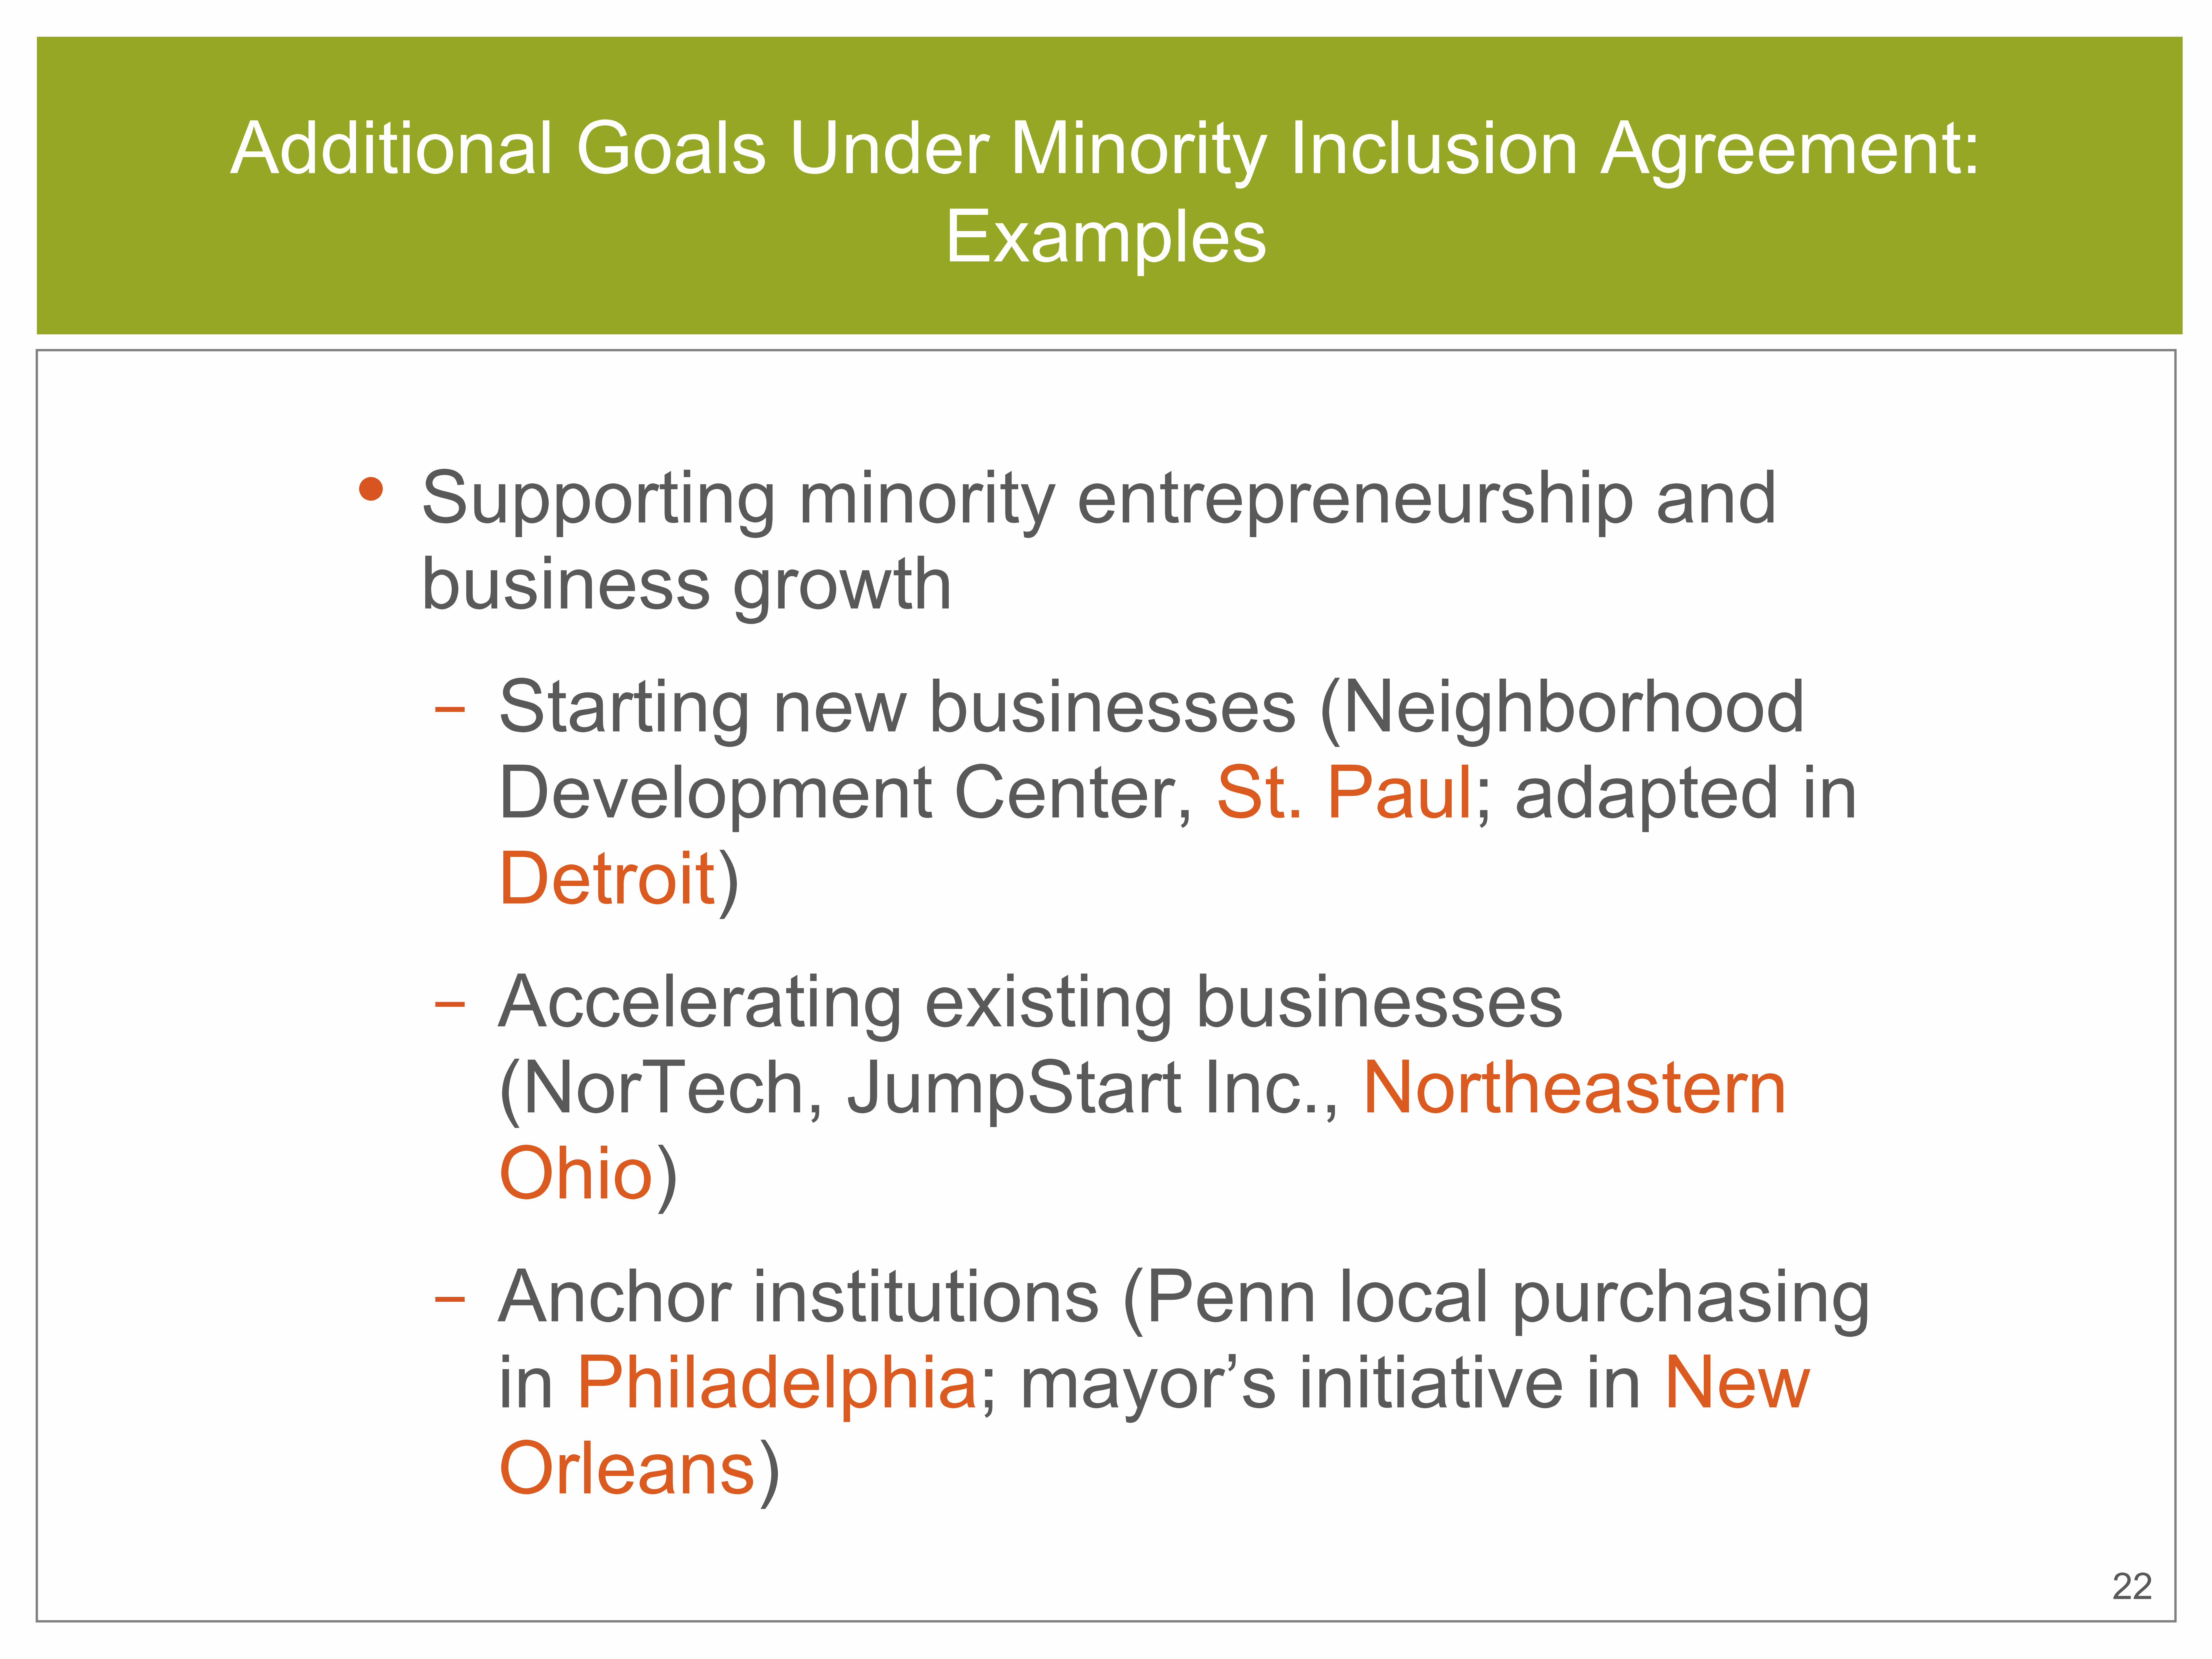
• Supporting minority entrepreneurship and business growth– Starting new businesses (Neighborhood Development Center, St. Paul;; adapted in Detroit)
– Accelerating existing businesses (NorTech, JumpStart Inc., Northeastern Ohio)
– Anchor institutions (Penn local purchasing in Philadelphia;; mayor’s initiative in New Orleans)
Additional Goals Under Minority Inclusion Agreement: Examples

23
• Community reinvestment fund– Missouri Department of Transportation fund
– Port of Oakland Social Justice Trust Fund– Portland Community Benefits Agreement funds
Additional Goals Under Minority Inclusion Agreement: Examples (cont.)

RECOMMENDATIONS
Photo credit: Baltimore Integration Partnership.

25
• Collaborative leadership• New resources• Transparent and effective processes• Innovations in programs
Themes

26
• A guarantor for equity and inclusion• A different kind of support system• A partnership for workforce development connecting neighborhood, city, region
Collaborative Leadership

27
• Establish sustainable funding source• Create community reinvestment fund• Support minority-owned businesses
New Resources

28
• Revise the Minority Inclusion Agreement• Align advance planning with economic inclusion goals• Increase transparency and strengthen partnerships
Transparent and Effective Processes

29
• Ensure job applicants are prepared to succeed• Engage all types of employers• Enhance education and training programs
Innovations in Programs
30
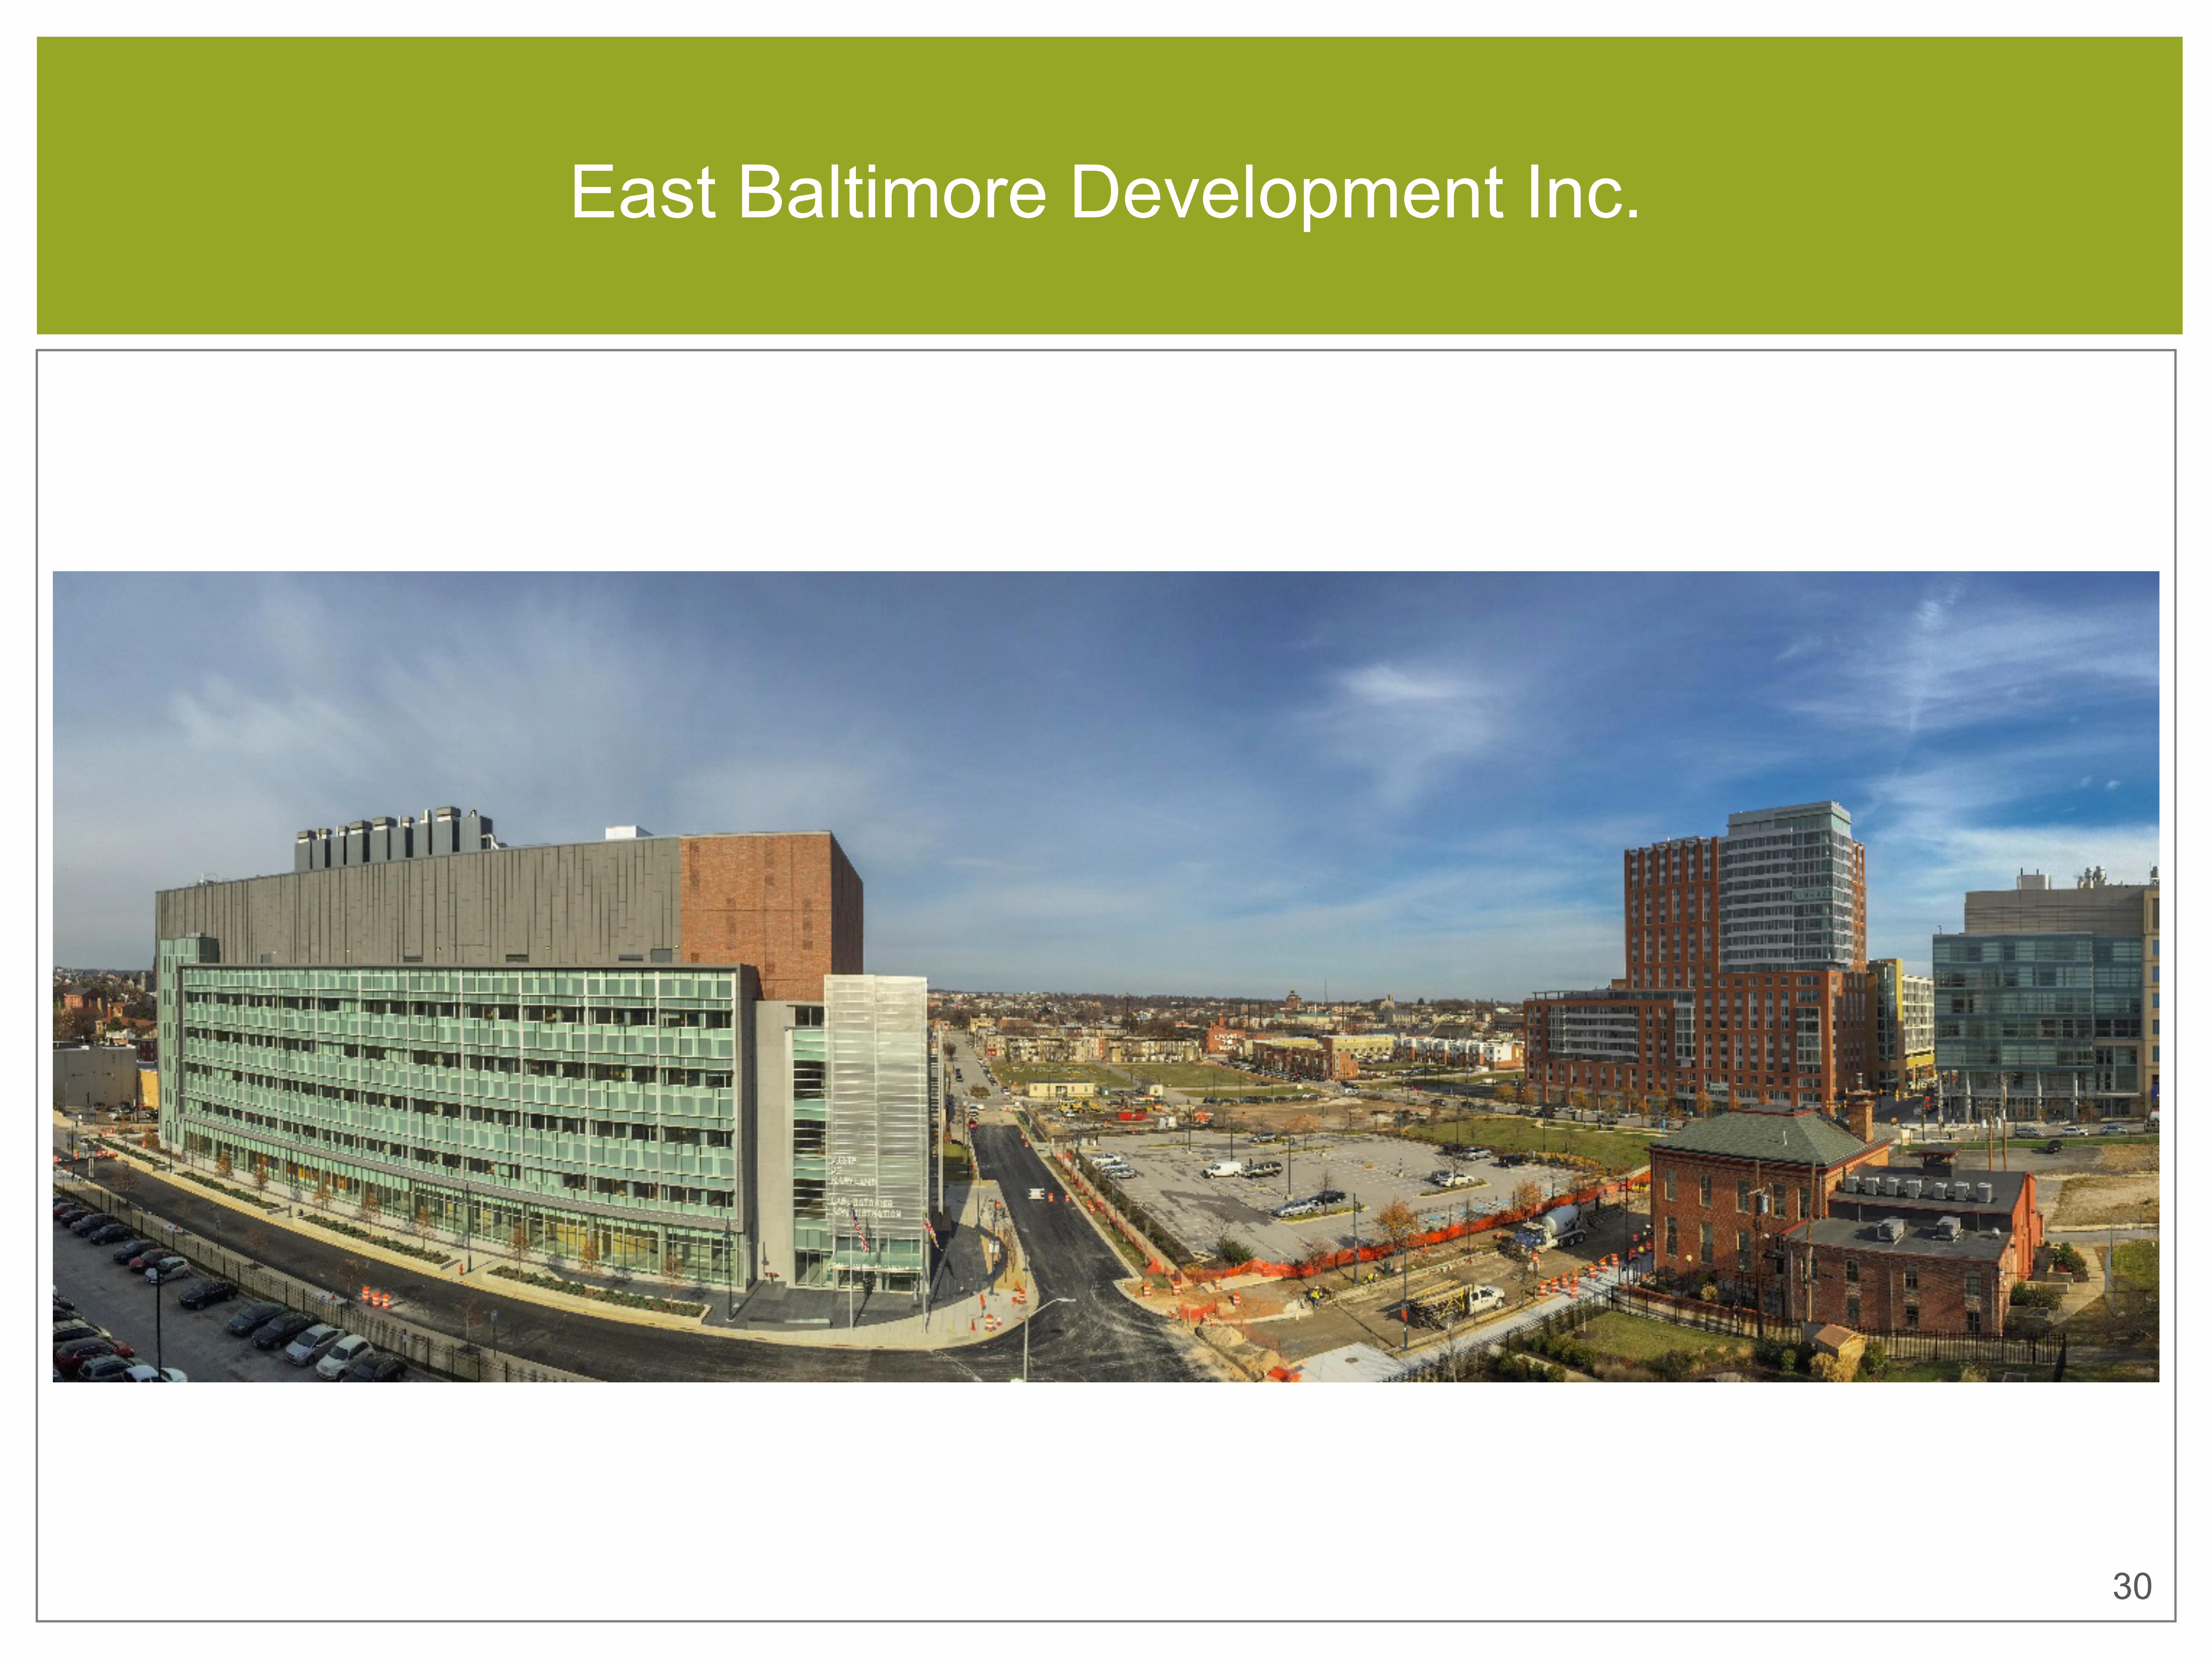
East Baltimore Development Inc.

31
City of New Orleans
32
• At www.aecf.org: – Expanding Economic Opportunity for Local Residents and Business: www.aecf.org/resources/expanding-economic-opportunity
• At www.policylink.org:– Leveraging Anchor Institutions for Economic Inclusion: www.policylink.org/find-resources/library/leveraging-anchor-institutions-for-economic-inclusion
– America’s Tomorrow newsletter: www.policylink.org/focus-areas/equitable-economy/americas-tomorrow-newsletters
• ebdi.org/economic_inclusion
Resources
Developing solutions to build a brighter future for children, families and communities
www.aecf.org