Community management of floodplain and forest … Sultana - Talk_0.pdf · and forest commons:...
20
Parvin Sultana Flood Hazard Research Centre, Middlesex University Evidence and Impact Research: Community management of floodplain and forest commons: incentives and constraints on ecosystem services for poverty alleviation
Transcript of Community management of floodplain and forest … Sultana - Talk_0.pdf · and forest commons:...

Parvin Sultana
Flood Hazard Research Centre, Middlesex University
Evidence and Impact Research:
Community management of floodplain
and forest commons: incentives and
constraints on ecosystem services for
poverty alleviation

Aim
Understand the impact of community based natural resource governance and networks of community organisations in:
enhancing ecosystem sustainability, and
reducing poverty
Based on case studies and synthesis of over 10 years of research on community based floodplain management in Bangladesh and community forestry in Nepal
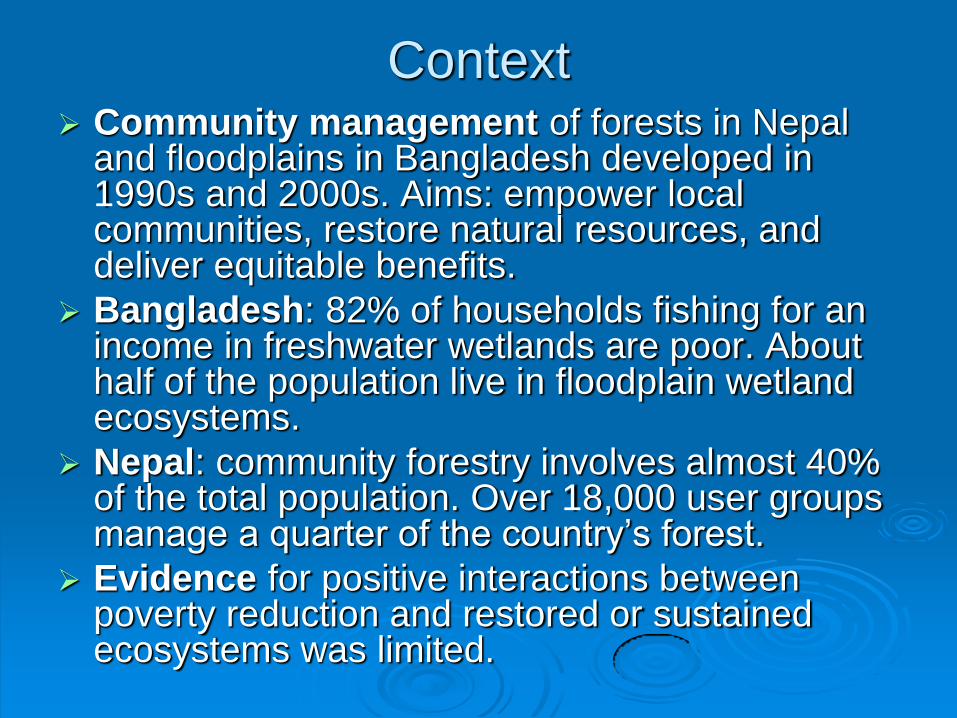
Context Community management of forests in Nepal
and floodplains in Bangladesh developed in 1990s and 2000s. Aims: empower local communities, restore natural resources, and deliver equitable benefits.
Bangladesh: 82% of households fishing for an income in freshwater wetlands are poor. About half of the population live in floodplain wetland ecosystems.
Nepal: community forestry involves almost 40% of the total population. Over 18,000 user groups manage a quarter of the country’s forest.
Evidence for positive interactions between poverty reduction and restored or sustained ecosystems was limited.

CBOs and networks
Typically CBOs are: Non-profit.
Registered with government as a legal entity.
Formed under programmes or projects, but have become independent.
Manage a specific area of floodplain or forest.
In both countries there are vibrant networks of community organisations: in Nepal FECOFUN focused on
forests
in Bangladesh SWRM focused on floodplains and water bodies
Federations of local citizen groups grow to improve coordination, learning and interaction with government.

Methods
Collate evidence to examine the effects of community
management and networking among CBOs on: livelihoods of poor people dependent on these systems, and
key indicators of ecosystem sustainability.
32 detailed case studies (18 in Bangladesh, 14 in
Nepal), purposively selected to represent: diversity of environments (deeply flooded haors, coastal
floodplains, oxbow lakes, typical floodplains, rivers in
Bangladesh; high mountains, hills and Terai forest in Nepal);
tenural arrangements over commons (leased waterbodies,
traditional seasonal commons, allocated community forests,
buffer zones); and
levels of involvement in networking (four of the Bangladesh
cases dropped out of networking).

Bangladesh: diverse natural resources, but under threat

Ecosystem management initiatives in
Bangladesh cases Ecosystem component
No of CBOs (out of 18)
Management interventions Evidence/outcome
Agriculture 17 Promote low water demand crops, IPM, pesticide restriction
Changes in cropping
Fishery 16 Sanctuary, closed season, reintroduce fish sp.
Catches increased outside sanctuaries
Water 14 Limit on pumping, sluice management
Retain water for fish
Wetland restoration 9 excavation Sanctuaries hold water, fish catches, water retention
Wildlife 9 Ban on hunting Waterbirds increased, tourism increased
Timber/trees/ fuelwood
8 Swamp trees planted (for habitat), other timber trees, some access for fuelwood for poor
Ban on cutting, trees restored
Duck rearing 6 Enterprise using water Income
Aquaculture/fish stocking
5 Enterprise, also or release of native sp to wild
Income
Tourism/biodiversity 2 Visitor facilities (external funds) Increasing visitors, limited income
Fallow land returned to cultivation
2 Irrigation, suitable crops, sharecropping
Crops profitable, incomes for poor
Medicine 1 Common medicinal plant garden Own use
Aquatic plants (food) 1 Organised harvesting Income and own use

Bangladesh ecosystem service change (number of sites
showing change in fishery indicators) Environment/tenure Fish catch Fish diversity
Haor 1 of 1 1 of 1
Fishery leased 1999-2010 doubled per ha (data available only for entire haor where 2 CBOs located)
69-81 sp; Small increase 1999-2010
Coastal 0 of 2 1 of 2
Fishery leased Chandra: 2010-12 unclear 31-33 sp; Same 2010-2012
Mixed NR Baliatali: 2011-12 same 0-14 sp; Increase 2010-2012
Closed beel 3 of 4 0 of 3
Fishery leased e.g. Dhumnadi 1991-2003 increase stocked and wild fish
e.g. Nasti: 43-13 sp; declined
Floodplain 4 of 4 3 of 5
Fishery leased e.g. Dhali Baila 2000-10 about doubled per ha
e.g. Atrai: increased 19-38 sp, 2002-2012
Mixed NR e.g. Solua 2002-05 increase and maintained by 2012 (before CBO declining)
e.g. Goakhola 30-40 sp; same
Water management No data No data
River 0 of 2 0 of 3
Fishery no lease e.g. Titas Ka 1997-2002 increase then return to same catch per ha; decline catch per person
e.g. Tangaon 43-35 sp; decline 2002-2012

Number of sites in Bangladesh showing an
improvement in poverty indicators since
community management
Environ-ment/ tenure
Food security
Income Housing Participation of poor in executive
committee*
Haor 1 of 1 1 of 1 No data 2 of 2
Coastal 2 of 2 2 of 2 2 of 2 0 of 2
Closed beel
4 of 4 3 of 4 2 of 3 1 of 4
Floodplain 2 of 7 6 of 7 1 of 1 2 of 7
River 2 of 2 3 of 3 2 of 2 3 of 3
Expressed out of those with available data
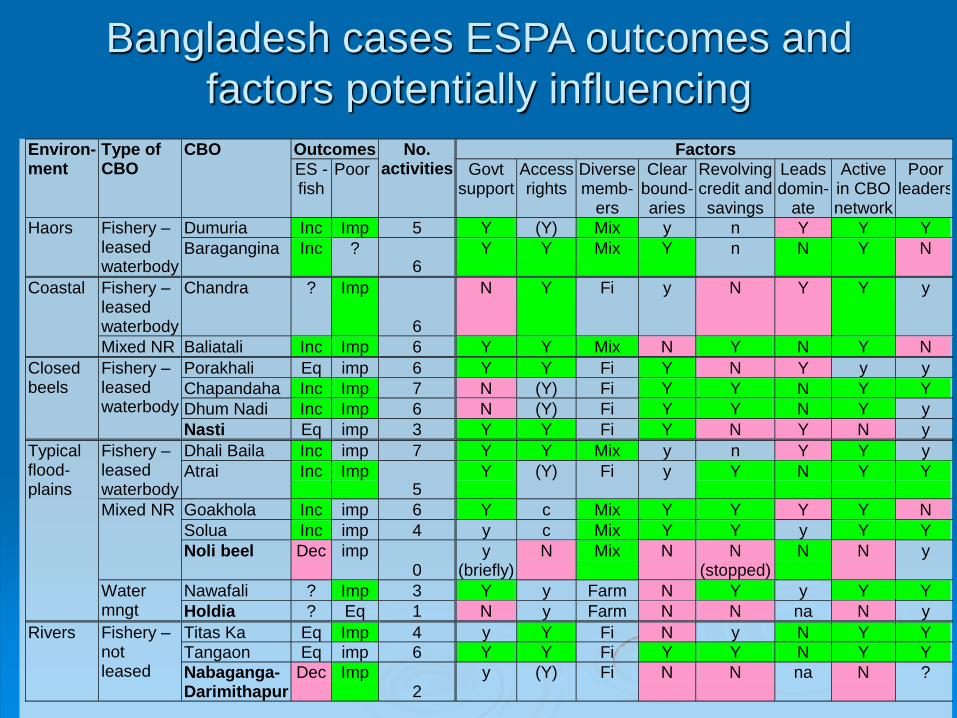
Outcomes Factors Environ-ment
Type of CBO
CBO
ES - fish
Poor
No. activities Govt
support Access rights
Diverse memb-
ers
Clear bound-aries
Revolving credit and savings
Leads domin-
ate
Active in CBO network
Poor leaders
Dumuria Inc Imp 5 Y (Y) Mix y n Y Y Y Haors Fishery – leased waterbody
Baragangina Inc ? 6
Y Y Mix Y n N Y N
Fishery – leased waterbody
Chandra ? Imp
6
N Y Fi y N Y Y y Coastal
Mixed NR Baliatali Inc Imp 6 Y Y Mix N Y N Y N
Porakhali Eq imp 6 Y Y Fi Y N Y y y
Chapandaha Inc Imp 7 N (Y) Fi Y Y N Y Y
Dhum Nadi Inc Imp 6 N (Y) Fi Y Y N Y y
Closed beels
Fishery – leased waterbody
Nasti Eq imp 3 Y Y Fi Y N Y N y
Dhali Baila Inc imp 7 Y Y Mix y n Y Y y Fishery – leased waterbody
Atrai Inc Imp 5
Y (Y) Fi y Y N Y Y
Goakhola Inc imp 6 Y c Mix Y Y Y Y N
Solua Inc imp 4 y c Mix Y Y y Y Y
Mixed NR
Noli beel Dec imp 0
y (briefly)
N Mix N N (stopped)
N N y
Nawafali ? Imp 3 Y y Farm N Y y Y Y
Typical flood-plains
Water mngt Holdia ? Eq 1 N y Farm N N na N y
Titas Ka Eq Imp 4 y Y Fi N y N Y Y
Tangaon Eq imp 6 Y Y Fi Y Y N Y Y
Rivers Fishery – not leased Nabaganga-
Darimithapur Dec Imp
2 y (Y) Fi N N na N ?
Bangladesh cases ESPA outcomes and
factors potentially influencing

Nepal: diverse natural resources, but under threat

Ecosystem management initiatives
in Nepal cases Ecosystem component
No. of cases (out of 14)
Management interventions Evidence
Timber 14 Block based silviculture management; nursery and plantation; fire line improvement; cleaning, thinning, pruning, etc
Cash earning; better off people have used best timber/furniture in their houses, timber for community buildings
Fuelwood/ fodder
14 Bamboo and broom grass plantation; allocation of land for grass
Fuelwood collection for cooking and heating; livestock feeding; construction materials, household uses, pro-poor enterprise development (e.g. leaf plate from Shorea robusta);
Herbs/ medicine
10 Plantation of seedlings of medicinal plants
Household use of herbal medicines, cash earning through sale.
Soil conservation
10 Bamboo and grass planted on erosion prone areas; ban on harvesting in erosion prone areas
Reduced erosion
Water bodies 6 Construction of irrigation channel and tube wells; construction of water holes
Increased supply of water for irrigation and drinking; improved water holes for wild animals
Wildlife 3 Habitat management; construction of water holes; wildlife observation centres
Revenue from tourism, employment

Change in ecosystem services in Nepal sites Change in ES Evidence
Annual increment in total (and growing) stock of timber, fuelwood and fodder
Timber stock has increased from 89.2 m3 (in 2005) to180.5 m3 (in 2010). (Adhere Chara);
Timber stock has increased from 2.9 m3 per ha (in 2003) 13.7 m3 per ha (in 2008) (Chautari)
Annual growth of grass and fodder is 2.6 tons per hectare; and that of leaf litter is 1.05 tons
Large part of internal demand is met by the CF production
Before the formation of the group only 20% of forest product needs were fulfilled by the forest. Now the internal demand is met (Kankali)
Increase in wildlife, birds, biodiversity
Number of wild animals including leopard, porcupine, rabbit, deer, and monkeys significantly increased (Jautar, Sundari).
Increased number of rhinos and tigers along with other small animals (Baghmara)
New species of mammals (12), birds (6) and python reported (Jamunabari)
Non-Timber Forest Products (NTFP)
Annual allowable harvest of Lokta (Daphne spp) - 4 kg/ha, Argeli -1 kg/ha and Machhino (Galtheria spp) -124 kg/ha is claimed to have increased but no current inventory (Baisakheswori-2004)
Annual allowable harvest of bamboo: 26 steam per ha. EC claims that the biomass of NTFPs is increasing in CF and supplying 50% of total demand of bamboo (Katike);
New water sources
Increase in availability of drinking water (Baghmara)
New water springs have emerged.
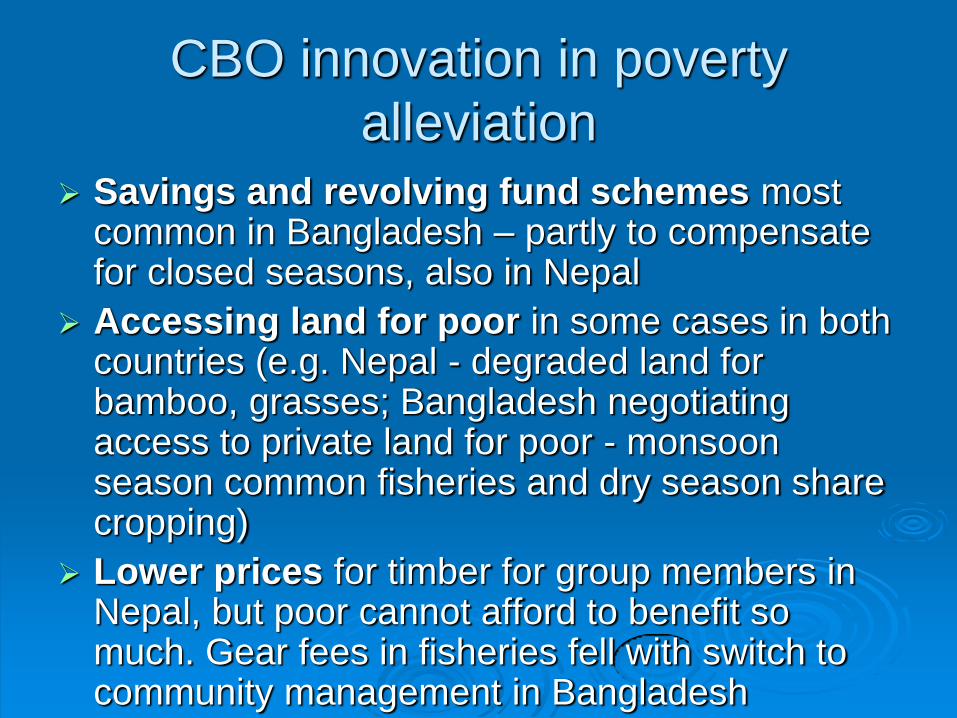
CBO innovation in poverty
alleviation
Savings and revolving fund schemes most common in Bangladesh – partly to compensate for closed seasons, also in Nepal
Accessing land for poor in some cases in both countries (e.g. Nepal - degraded land for bamboo, grasses; Bangladesh negotiating access to private land for poor - monsoon season common fisheries and dry season share cropping)
Lower prices for timber for group members in Nepal, but poor cannot afford to benefit so much. Gear fees in fisheries fell with switch to community management in Bangladesh

Conclusions –
Community based NRM Community based management has brought
improvements in ecosystem services beyond the original narrow focus of individual CBOs.
This has improved the lives of poor people in a majority of the cases.
Attempts to enhance resource sustainability and poverty reduction outcomes from community based NRM must link communities with higher scales, both in relation to learning and power.
Supportive tenurial arrangements can be complex and fragile.
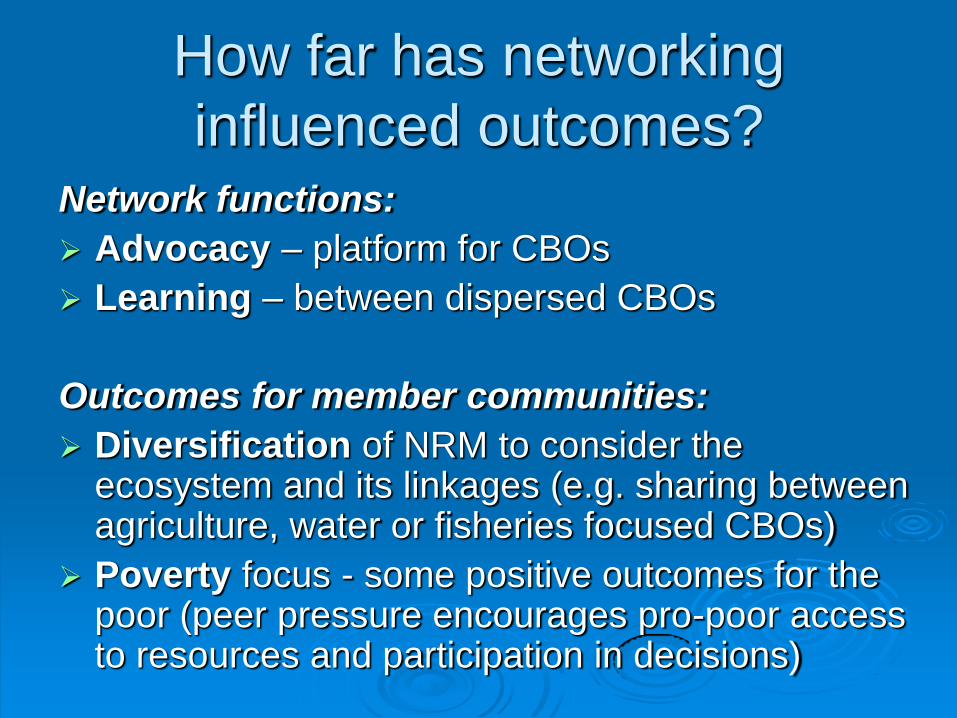
Network functions:
Advocacy – platform for CBOs
Learning – between dispersed CBOs
Outcomes for member communities:
Diversification of NRM to consider the ecosystem and its linkages (e.g. sharing between agriculture, water or fisheries focused CBOs)
Poverty focus - some positive outcomes for the poor (peer pressure encourages pro-poor access to resources and participation in decisions)
How far has networking
influenced outcomes?

Nepal - advocacy (e.g. Forest Act amendment bill)
Media reports FECOFUN protest
Policy round table Discussion paper
Government proposal
Field research
Contributed to
informed
debate on the
bill

Bangladesh – learning (more resilient diversification)
CBO-1 CBO-2 etc CBO-250
Process at
Individual CBO level
repeated by each CBO
+ Lessons learned
Adaptive Learning Network process
Multiple CBOs/sites shared
Participatory
monitoring
Management
plan review
Revise
management
plan
Implement
management
planPropose
action/
innovation
Agree on design changes
in management plans to
improve management &
knowledge
Identify
uncertainties,
problems, good
practices
Review experiences
and analyse lessons
Revise
management plan
(set of plans)
Reflective learning/
assessment of IFM
actions
Agreement on
experiment, piloting
possible good
practices good
practices
Set
indicators
Evidence and data
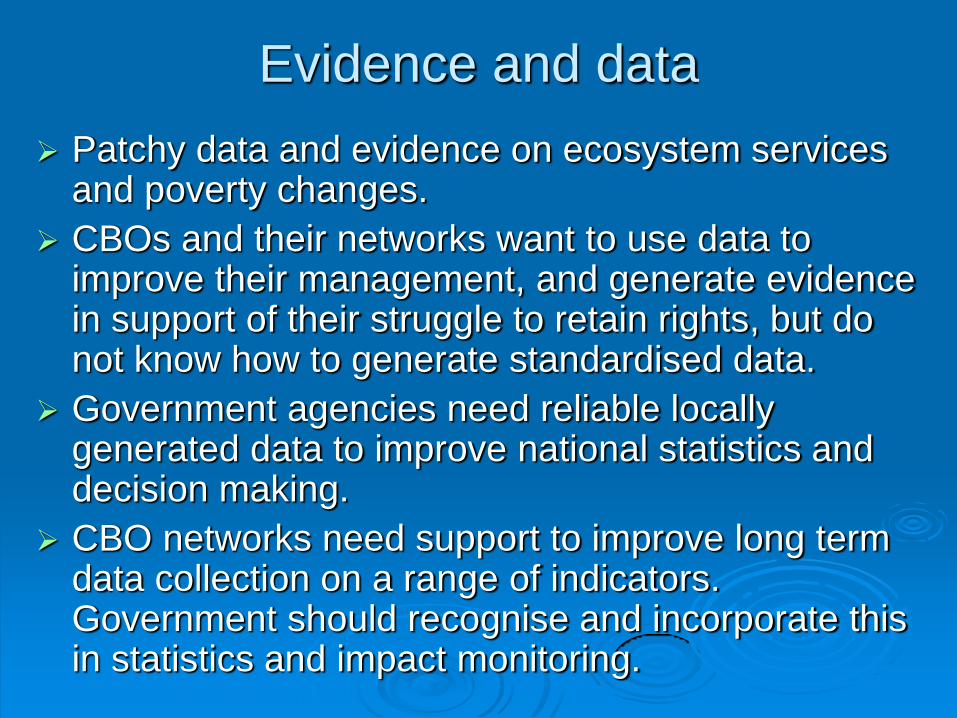
Patchy data and evidence on ecosystem services and poverty changes.
CBOs and their networks want to use data to improve their management, and generate evidence in support of their struggle to retain rights, but do not know how to generate standardised data.
Government agencies need reliable locally generated data to improve national statistics and decision making.
CBO networks need support to improve long term data collection on a range of indicators. Government should recognise and incorporate this in statistics and impact monitoring.
Thank you