Community-Level Differences in the Microbiome of …Community-Level Differences in the Microbiome of...
15
Community-Level Differences in the Microbiome of Healthy Wild Mallards and Those Infected by Influenza A Viruses Holly H. Ganz, a Ladan Doroud, b Alana J. Firl, a Sarah M. Hird, c Jonathan A. Eisen, a Walter M. Boyce d Genome Center, University of California, Davis, Davis, California, USA a ; Department of Computer Science, University of California, Davis, Davis, California, USA b ; Department of Molecular and Cell Biology, University of Connecticut, Storrs, Connecticut, USA c ; Department of Pathology, Microbiology, and Immunology, School of Veterinary Medicine, University of California, Davis, Davis, California, USA d ABSTRACT Waterfowl, especially ducks and geese, are primary reservoirs for influ- enza A viruses (IAVs) that evolve and emerge as important pathogens in domestic animals and humans. In contrast to humans, where IAVs infect the respiratory tract and cause significant morbidity and mortality, IAVs infect the gastrointestinal tract of waterfowl and cause little or no pathology and are spread by fecal-oral transmission. For this reason, we examined whether IAV infection is associated with differences in the cloacal microbiome of mallards (Anas platyrhyncos), an important host of IAVs in North America and Eurasia. We characterized bacterial community composition by sequencing the V4 region of 16S rRNA genes. IAV-positive mallards had lower spe- cies diversity, richness, and evenness than IAV-negative mallards. Operational taxo- nomic unit (OTU) cooccurrence patterns were also distinct depending on infection status. Network analysis showed that IAV-positive mallards had fewer significant cooccurring OTUs and exhibited fewer coassociation patterns among those OTUs than IAV-negative mallards. These results suggest that healthy mallards have a more robust and complex cloacal microbiome. By combining analytical approaches, we identi- fied 41 bacterial OTUs, primarily representatives of Streptococcus spp., Veillonella dispar, and Rothia mucilaginosa, contributing to the observed differences. This study found that IAV-infected wild mallards exhibited strong differences in microbiome composition relative to noninfected mallards and identified a concise set of putative biomarker OTUs. Using Random Forest, a supervised machine learning method, we verified that these 41 bacterial OTUs are highly predictive of infection status. IMPORTANCE Seasonal influenza causes 3 to 5 million severe illnesses and 250,000 to 500,000 human deaths each year. While pandemic influenza viruses emerge only periodically, they can be devastating—for example, the 1918 H1N1 pandemic virus killed more than 20 million people. IAVs infect the respiratory tract and cause signifi- cant morbidity and mortality in humans. In contrast, IAVs infect the gastrointestinal tract of waterfowl, producing little pathology. Recent studies indicated that viruses can alter the microbiome at the respiratory and gastrointestinal mucosa, but there are no reports of how the microbiota of the natural host of influenza is affected by infection. Here we find that the mallard microbiome is altered during IAV infection. Our results suggest that detailed examination of humans and animals infected with IAVs may reveal individualized microbiome profiles that correspond to health and disease. Moreover, future studies should explore whether the altered microbiome fa- cilitates maintenance and transmission of IAVs in waterfowl populations. KEYWORDS influenza, mallard, microbiome, network modeling, machine learning, biomarkers Received 6 December 2016 Accepted 14 December 2016 Published 28 February 2017 Citation Ganz HH, Doroud L, Firl AJ, Hird SM, Eisen JA, Boyce WM. 2017. Community-level differences in the microbiome of healthy wild mallards and those infected by influenza A viruses. mSystems 2:e00188-16. https://doi.org/ 10.1128/mSystems.00188-16. Editor Peter J. Turnbaugh, G.W. Hooper Research Foundation Copyright © 2017 Ganz et al. This is an open- access article distributed under the terms of the Creative Commons Attribution 4.0 International license. Address correspondence to Holly H. Ganz, [email protected], or Walter M. Boyce, [email protected]. H.H.G. and L.D. are joint first authors. Mallards infected with influenza A viruses exhibit altered microbiomes RESEARCH ARTICLE Ecological and Evolutionary Science crossm January/February 2017 Volume 2 Issue 1 e00188-16 msystems.asm.org 1 on March 5, 2020 by guest http://msystems.asm.org/ Downloaded from
Transcript of Community-Level Differences in the Microbiome of …Community-Level Differences in the Microbiome of...

Community-Level Differences in theMicrobiome of Healthy Wild Mallardsand Those Infected by Influenza AViruses
Holly H Ganza Ladan Doroudb Alana J Firla Sarah M Hirdc
Jonathan A Eisena Walter M Boyced
Genome Center University of California Davis Davis California USAa Department of Computer ScienceUniversity of California Davis Davis California USAb Department of Molecular and Cell Biology University ofConnecticut Storrs Connecticut USAc Department of Pathology Microbiology and Immunology School ofVeterinary Medicine University of California Davis Davis California USAd
ABSTRACT Waterfowl especially ducks and geese are primary reservoirs for influ-enza A viruses (IAVs) that evolve and emerge as important pathogens in domesticanimals and humans In contrast to humans where IAVs infect the respiratory tractand cause significant morbidity and mortality IAVs infect the gastrointestinal tract ofwaterfowl and cause little or no pathology and are spread by fecal-oral transmissionFor this reason we examined whether IAV infection is associated with differences inthe cloacal microbiome of mallards (Anas platyrhyncos) an important host of IAVs inNorth America and Eurasia We characterized bacterial community composition bysequencing the V4 region of 16S rRNA genes IAV-positive mallards had lower spe-cies diversity richness and evenness than IAV-negative mallards Operational taxo-nomic unit (OTU) cooccurrence patterns were also distinct depending on infectionstatus Network analysis showed that IAV-positive mallards had fewer significantcooccurring OTUs and exhibited fewer coassociation patterns among those OTUs thanIAV-negative mallards These results suggest that healthy mallards have a more robustand complex cloacal microbiome By combining analytical approaches we identi-fied 41 bacterial OTUs primarily representatives of Streptococcus spp Veillonelladispar and Rothia mucilaginosa contributing to the observed differences This studyfound that IAV-infected wild mallards exhibited strong differences in microbiomecomposition relative to noninfected mallards and identified a concise set of putativebiomarker OTUs Using Random Forest a supervised machine learning method weverified that these 41 bacterial OTUs are highly predictive of infection status
IMPORTANCE Seasonal influenza causes 3 to 5 million severe illnesses and 250000to 500000 human deaths each year While pandemic influenza viruses emerge onlyperiodically they can be devastatingmdashfor example the 1918 H1N1 pandemic viruskilled more than 20 million people IAVs infect the respiratory tract and cause signifi-cant morbidity and mortality in humans In contrast IAVs infect the gastrointestinaltract of waterfowl producing little pathology Recent studies indicated that virusescan alter the microbiome at the respiratory and gastrointestinal mucosa but thereare no reports of how the microbiota of the natural host of influenza is affected byinfection Here we find that the mallard microbiome is altered during IAV infectionOur results suggest that detailed examination of humans and animals infected withIAVs may reveal individualized microbiome profiles that correspond to health anddisease Moreover future studies should explore whether the altered microbiome fa-cilitates maintenance and transmission of IAVs in waterfowl populations
KEYWORDS influenza mallard microbiome network modeling machine learningbiomarkers
Received 6 December 2016 Accepted 14December 2016 Published 28 February 2017
Citation Ganz HH Doroud L Firl AJ Hird SMEisen JA Boyce WM 2017 Community-leveldifferences in the microbiome of healthy wildmallards and those infected by influenza Aviruses mSystems 2e00188-16 httpsdoiorg101128mSystems00188-16
Editor Peter J Turnbaugh GW HooperResearch Foundation
Copyright copy 2017 Ganz et al This is an open-access article distributed under the terms ofthe Creative Commons Attribution 40International license
Address correspondence to Holly H Ganzhollyhganzgmailcom or Walter M Boycewmboyceucdavisedu
HHG and LD are joint first authors
Mallards infected with influenza A virusesexhibit altered microbiomes
RESEARCH ARTICLEEcological and Evolutionary Science
crossm
JanuaryFebruary 2017 Volume 2 Issue 1 e00188-16 msystemsasmorg 1
on March 5 2020 by guest
httpmsystem
sasmorg
Dow
nloaded from
Mallards (Anas platyrhyncos) are an important natural reservoir in North Americaand Eurasia for many subtypes of influenza A viruses (IAVs) the group of influenza
viruses mainly responsible for seasonal and pandemic influenza in humans (1) Water-fowl (ducks geese and swans in the avian family Anatidae) are the primary reservoir ofnaturally occurring IAVs (2 6) In humans and domestic animals (poultry swine horsesdogs etc) IAVs contain gene segments that trace back to a wild avian origin (3 4)Recent concern over the emergence of new pandemic IAVs led to intensive IAVsurveillance in waterfowl especially of dabbling ducks in the genus Anas whichrevealed that IAV prevalence may reach 40 especially in young (hatch year) birds(58ndash61 65) In contrast to humans where IAVs infect the respiratory tract and causesignificant morbidity and mortality IAVs infect the gastrointestinal tract of waterfowland cause little or no pathology (5) and are spread by fecal-oral transmission (6)
Here we investigated the bacterial microbiome in wild juvenile mallards and testedfor associations with IAV infection The microbiome was first defined by Whipps et al(7) as a characteristic microbial community (including bacteria archaea fungi thevarious single-celled eukaryotes generally referred to as protists and viruses) occupyinga distinct habitat For a variety of reasons most microbiome research to date hasfocused on the bacterial portion of these communities The application of contempo-rary sequencing methods to characterize diversity in the microbiome has revolution-ized the study of interactions between microbial inhabitants of the microbiome ingeneral as well as the study of interactions between members of the microbiome andparticular pathogens (see eg references 8ndash12) Identification of potential effects of IAVinfection on the microbiome of mallards (a natural reservoir) should contribute to agreater understanding of how these viruses are maintained and transmitted in nature
When a mallard ingests IAV from contaminated material in the environment theprocess of infection requires a virus to pass from the gut lumen through mucus whichpresents a potent physical and immunological barrier to microbial invasion (13 14 15)In birds and mammals mucus is composed primarily of mucins produced by underlyingepithelial cells and is divided into two layers an outer layer that typically contains adiverse community of resident microbes and an inner ldquoprotectedrdquo layer that has a lowdensity of microbes except during pathogen invasion (15) In some cases the micro-biome of the mucus layer may affect pathogen attachment to host cells for exampleglycan structures on the surface of the bacterium Enterobacter cloacae in the humangut microbiome may facilitate the attachment of human norovirus to host cells (16) Inaddition some orally transmitted viruses including poliovirus and reovirus may ma-nipulate the bacterial microbiome to promote their transmission across the mucosalinterface (reviewed in reference 10) Along with its associated microbiota and anypotential pathogens trapped in the mucus layer mucus is continuously expelledfrom the body Once IAVs have crossed the mucosal barrier in the intestinal tract ofwaterfowl they amplify inside host epithelial cells and are then shed into the environ-ment and transmitted to new hosts Free-ranging mallards typically shed IAVs in fecesfor about 6 days after infection (5 17)
In this study we analyzed the relationship between infection by low-pathogenicityIAVs and the composition and species cooccurrence patterns of bacteria inhabiting thecloacal microbiome of juvenile mallards We hypothesized that IAV infection would beassociated with an altered microbiome To investigate this we identified members ofthe microbiome that contribute to the observed associations We compared bacterialcommunity composition characteristics using standard approaches (alpha and betadiversity see Materials and Methods) and to assess the relationships between groupsof taxa we analyzed bacterial operational taxonomic unit (OTU) cooccurrence patternsGiven that groups of bacterial taxa are often both functionally and phylogeneticallyrelated it is useful to assess how infection might affect interdependencies betweenbacterial OTUs In order to investigate potential interactions and relationships amongdifferent microbial taxa we analyzed their cooccurrence relationships using a networkNetwork analysis of significant cooccurrence structures of microbial taxa has helped
Ganz et al
JanuaryFebruary 2017 Volume 2 Issue 1 e00188-16 msystemsasmorg 2
on March 5 2020 by guest
httpmsystem
sasmorg
Dow
nloaded from
decipher complex microbial dynamics such as groups of taxa that are metabolicallylinked or are genetically related (18)
Although several studies have focused on IAVs and the microbiome in humans andmice (19ndash25) we believe that this is the first study to have investigated the relationshipbetween IAV infection and the microbiome of a wild bird that is an important primaryreservoir
RESULTS
Cloacal swabs were collected from 122 juvenile mallards in the Suisun Bay area inCalifornia in the United States between 2009 and 2013 All mallards sampled in thisstudy were apparently healthy at the time of sampling We performed influenza testingand microbiome analysis on the cloacal swabs
OTU richness levels in cloacal samples differed based on infection status (t 720df 948 P 000001) (Fig 1a) After rarefaction to 5000 reads per sample andremoval of OTUs that were unidentified at the kingdom level IAV-negative (hereldquoIAVrdquo) mallards had 15 times as many OTUs per individual (282 OTUs) as IAV-positive(IAV) mallards (187 OTUs Fig 1a) OTU diversity (based on Shannon index values) wasgreater in IAV mallards than in IAV mallards (t 377 df 7883 P 00003)(Fig 1a) and OTU evenness was greater in IAV mallards than in IAV mallards (t
253 df 7645 P 0014) (Fig 1a)Representatives of the bacterial phyla Firmicutes Proteobacteria Bacteroidetes Acti-
nobacteria Fusobacteria and Tenericutes were detected in all of the samples compris-ing averages of 44 27 16 5 4 and 14 in IAV mallards and 27 33 244 55 and 1 in IAV mallards respectively (Fig 1b) Infection status was correlatedwith large differences in the proportions of bacterial OTUs particularly within the phylaFirmicutes Proteobacteria and Bacteroidetes (Fig 1b)
The overall composition of cloacal bacteria in IAV mallards differed significantlyfrom that in IAV mallards (permutational multivariate analysis of variance[PERMANOVA] F1114 112 P 0001) even though the community composition wasinfluenced by the year of sampling (PERMANOVA F1114 3 28 P 0001) and the
FIG 1 (a) IAV-positive (IAV) and IAV mallards also differed in OTU richness Shannon index and OTU evennessresults (b) Proportions of bacterial phyla in the cloacal microbiome differed between IAV and IAV mallards
Influenza A Viruses and the Mallard Microbiome
JanuaryFebruary 2017 Volume 2 Issue 1 e00188-16 msystemsasmorg 3
on March 5 2020 by guest
httpmsystem
sasmorg
Dow
nloaded from
interaction between influenza infection status and year of sampling was also significant(PERMANOVA F1114 305 P 0002) The microbiome of mallard males did not differfrom that of females (PERMANOVA F2114 114 P 024) Despite the effect of theyear data we detected significant clustering based on infection status (see Fig S1 in thesupplemental material)
Infected mallards only Among IAV mallards there was a significant effect of IAVsubtype (based on the levels of the surface proteins hemagglutinin [HA] and neur-aminidase [NA]) on bacterial community composition (F169 135 P 0004) Inaddition we detected a significant effect of year of sampling (F169 303 P 0004)likely because some subtypes occurred only in certain years and the interactionbetween HA and NA subtype and the year that the mallards were sampled wassignificant (F169 214 P 0007)
Using the DIROM (Difference in the Relative Occurrence Metric see Materials andMethods) method we identified all OTUs that had a greater than 50 difference in howfrequently they occurred in the two groups This resulted in 47 OTUs (see Table S1 inthe supplemental material) all of which occurred in greater frequency in the IAV
mallards These OTUs belonged to the phyla Tenericutes (n 1) Proteobacteria (n 4)Firmicutes (n 31) Bacteroidetes (n 5) and Actinobacteria (n 6) According to theresults obtained with a Quantitative Insights in Microbial Ecology (QIIME) taxonomyassignment script (assign_taxonomypy) 21 of the 47 OTUs belonged to the genusStreptococcus 5 were representatives of the species Rothia mucilaginosa and 5 wererepresentatives of the species Veillonella dispar The largest difference belonged to thesingle OTU from the Tenericutes representing a mycoplasma whose examples differedby 921 between the groups and like the other OTUs occurred more frequently inIAV mallards
We also used the G-test (see Materials and Methods) to identify 85 OTUs thatdiffered in abundance between IAV and IAV mallards (Table S2) IAV mallards hadhigher abundances in 51 OTUs in Firmicutes particularly in representatives of Strepto-coccus (n 31 OTUs) and Veillonella (n 14 OTUs) as well as OTUs in other phylaincluding Actinobacteria (n 10) Bacteroidetes (n 10) Proteobacteria (n 5)Tenericutes (n 4) and Fusobacteria (n 3) Only one OTU (in phylum Actinobacteriafamily Micrococcaceae) was significantly enriched in the IAV mallards compared toIAV individuals
Network analysis The resulting bacterial networks (see Materials and Methods) bothconsisted of 674 nodes (OTUs) with 112488 non-zero-weighted edges in IAV and 132875edges in IAV networks with average node connections (ie the average number of edgesincident to each node) of 33379 and 39402 respectively The average values for weighteddegree (ie sum of all the weights for incident edges) were 1312 for IAV and 2989 forIAV These results show that OTUs in the IAV group had a lower number of connectionsin total and that the edges had relatively much lower weights Thus the OTUs in IAV
mallards cooccurred in fewer IAV mallards than IAV mallardsTo ensure that we were detecting OTUs associated with infection status (rather than
clusters idiosyncratic to individuals) we filtered the OTU table to include only thoseOTUs that appeared in two or more samples per IAV condition resulting in 674 OTUsWe then characterized OTU cooccurrence networks across the 674 OTUs in the IAV
and IAV mallards and compared the IAV and IAV networks to generate differencenetworks (D and D see Materials and Methods) Briefly the cooccurrences that wereat higher levels in IAV were assigned to D and the cooccurrences that were at higherlevels in IAV were assigned to D The assumption is that the clusters of OTUs highlycooccurring in one group (D or D) but not the other were infection dependent Theresulting difference networks both consisted of 674 nodes (OTUs) with 344 edges in D
and 6702 edges in D networks with average node connections of 102 and 198respectively We found that the network of D mallards had fewer edges and thuslower network density than the network of D mallards The density values were 0002in D and 003 in D showing proportionally larger numbers of existing connections
Ganz et al
JanuaryFebruary 2017 Volume 2 Issue 1 e00188-16 msystemsasmorg 4
on March 5 2020 by guest
httpmsystem
sasmorg
Dow
nloaded from
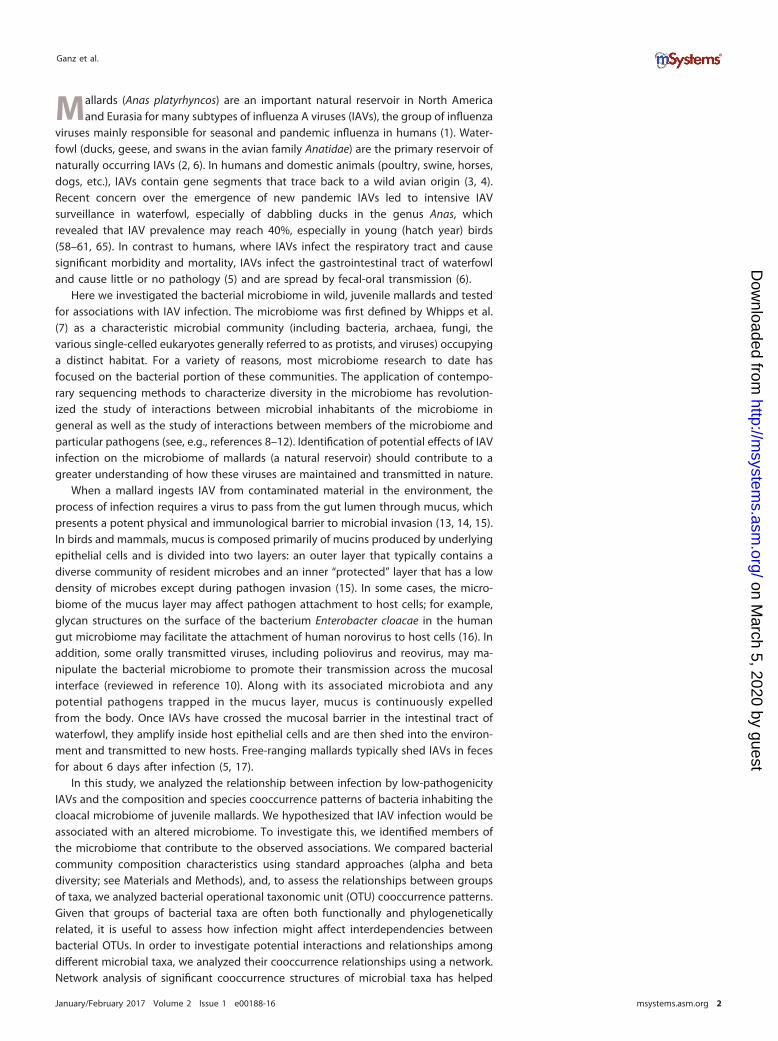
in D In order to identify core communities of bacteria that were associated with IAVinfection we set a threshold for edge weights (see Materials and Methods) to excludeweak connections and then decomposed our D and D networks into modules (iegroups of nodes that were more densely connected to one another than to the rest ofthe network) (26) to find significant community differences in cooccurrence patternsbetween IAV and IAV mallards Both D and D resulted in the formation of onecluster by the use of the Chinese whispers clustering method (27) and Markov clusteralgorithm (MCL) clustering (28) with 27 and 80 nodes respectively A visualization ofthese clusters is shown in Fig 2 Twenty of these OTUs were mutual (shared) betweenthe two groups (mutual 20) The mutual 20 exhibited similar abundance patterns acrossall the samples regardless of the infection group (Fig 3) and may be part of the coremicrobiome of the mallard In addition to the mutual 20 OTUs we found 7 OTUs thatwere uniquely identified by the D cluster and we found 60 OTUs that were uniquelyidentified by the D cluster The set of OTUs that were uniquely identified in D maybe indicative of a community of bacteria that are activated in the presence of infectionThis approach allows us to identify those OTUs that were uniquely identified in the D
cluster (and therefore absent in the D cluster) and may reflect bacteria that arediminished in population during infection The obtained cluster from D was biggerand more densely connected whereas the D cluster had fewer OTUs and weakerconnections Therefore the cluster from D may represent stronger patterns of coas-sociation between OTUs
In the final step of network modeling we used the difference networks to identifyclusters that were highly correlated with groups of mallards based on their infectionstatus (Table S3) Notably 41 of the OTUs identified by network analysis overlapped theOTUs identified by G-test and DIROM (Fig 3 Table 1) All of these OTUs were containedin the clusters retrieved from the D network We studied the distribution of those 41OTUs across the clusters and observed that all of them were contained in one clusterand had high edge weights (Fig 2)
To confirm whether these OTUs are predictive of infection status we also used theRandom Forest model which is a supervised machine-learning technique (29) The
FIG 2 (a) Networks of cooccurrence patterns for OTUs found in mallards that tested either positive for IAV (IAV) or negativefor IAV (IAV) Networks of D and D data were constructed from the IAV and IAV networks by adding edges that differedin edge weight by more than a threshold value of 02 from those of their D networks Once D networks were created weapplied an edge threshold value of 05 to remove the edges with low edge weights The clusters obtained for the D and D
networks with the overlapping 41 are shown next to the difference networks and are colored (in D cluster) (b) Toy graphillustrating our method
Influenza A Viruses and the Mallard Microbiome
JanuaryFebruary 2017 Volume 2 Issue 1 e00188-16 msystemsasmorg 5
on March 5 2020 by guest
httpmsystem
sasmorg
Dow
nloaded from
3-fold cross-validation approach was applied to estimate the accuracy of the classifierWe assigned OTUs as the features in our model to identify the set of OTUs mostpredictive of infection status resulting in 211 OTUs Of the 211 OTUs 38 wererepresented in the 41 overlapping OTUs obtained from our previous approaches Usingonly the 41 overlapping OTUs as features in a second Random Forest model weobtained 96 accuracy in predicting infection status
FIG 3 Log-scaled abundances of OTUs under different IAV conditions (a) A total of 41 overlapping OTUs (b) A total of 8 DIROMOTUs not including the overlapping 41 (c) A total of 46 G-test OTUs not including the overlapping 41 (d) A total of 7 OTUsthat were uniquely found to be highly cooccurring in IAV networks (e) A total of 80 OTUs that were uniquely found to be highlycooccurring in IAV networks (f) A total of 20 OTUs that were mutually significant under both IAV conditions
Ganz et al
JanuaryFebruary 2017 Volume 2 Issue 1 e00188-16 msystemsasmorg 6
on March 5 2020 by guest
httpmsystem
sasmorg
Dow
nloaded from
Classifying mallards using overlapping OTUs Subsequently we determinedwhether the overlapping 41 OTUs indicated the IAV condition for each sample Wefound that the 41 overlapping OTUs were highly represented in IAV mallards andwere not highly represented in IAV mallards (Fig 3) IAV mallards had most of the41 OTUs at high abundance whereas IAV mallards frequently had few of the 41 OTUsand that those few OTUs occurred at low abundance (Fig 4) More than 90 of theIAV mallards had 12 or fewer of the overlapping 41 OTUs and 80 of the IAV
mallards had more than 24 of the overlapping OTUs
DISCUSSION
This study was the first characterization of the cloacal microbiome of wild free-ranging mallards Anatomically the cloaca differs from the gastrointestinal tract in thatit interacts with the digestive system the urogenital system and the outside world(including sexual partners) Only a few sequence-based studies have been conductedon the cloacal microbiome of birds As we found for the mallards black-leggedkittiwakes (Rissa tridactyla) another natural host for IAV (30) contain ActinobacteriaFirmicutes and Proteobacteria in the cloacal microbiome and even share many generawith our data set (eg Rothia Streptococcus Corynebacterium and Enterococcus) (31)
TABLE 1 Taxonomic information for the 41 OTUs identified as contributing to observed differences in IAV and IAV juvenile mallardsbased on the intersection of the DIROM G-test and network analysis resultsa
OTU ID Phylum Class Order Family Genus Species
4466006 Actinobacteria Actinobacteria Actinomycetales Micrococcaceae Rothia dentocariosa866280 Actinobacteria Actinobacteria Actinomycetales Micrococcaceae Rothia mucilaginosa1017181 Actinobacteria Actinobacteria Actinomycetales Micrococcaceae Rothia mucilaginosa4294457 Actinobacteria Actinobacteria Actinomycetales Micrococcaceae Rothia mucilaginosa4411138 Actinobacteria Actinobacteria Actinomycetales Micrococcaceae Rothia mucilaginosa269907 Bacteroidetes Bacteroidia Bacteroidales (Prevotellaceae) (Prevotella)4423790 Bacteroidetes Bacteroidia Bacteroidales Porphyromonadaceae Porphyromonas endodontalis4321559 Bacteroidetes Bacteroidia Bacteroidales Porphyromonadaceae Porphyromonas4307391 Bacteroidetes Bacteroidia Bacteroidales Prevotellaceae Prevotella melaninogenica4446902 Firmicutes Bacilli Gemellales Gemellaceae92535 Firmicutes Bacilli Lactobacillales Streptococcaceae Streptococcus298862 Firmicutes Bacilli Lactobacillales Streptococcaceae Streptococcus513646 Firmicutes Bacilli Lactobacillales Streptococcaceae Streptococcus526804 Firmicutes Bacilli Lactobacillales Streptococcaceae Streptococcus536866 Firmicutes Bacilli Lactobacillales Streptococcaceae Streptococcus584109 Firmicutes Bacilli Lactobacillales Streptococcaceae Streptococcus864465 Firmicutes Bacilli Lactobacillales Streptococcaceae Streptococcus1000547 Firmicutes Bacilli Lactobacillales Streptococcaceae Streptococcus2953981 Firmicutes Bacilli Lactobacillales Streptococcaceae Streptococcus3384047 Firmicutes Bacilli Lactobacillales Streptococcaceae Streptococcus4306048 Firmicutes Bacilli Lactobacillales Streptococcaceae Streptococcus4307484 Firmicutes Bacilli Lactobacillales Streptococcaceae Streptococcus4309301 Firmicutes Bacilli Lactobacillales Streptococcaceae Streptococcus4424239 Firmicutes Bacilli Lactobacillales Streptococcaceae Streptococcus4425214 Firmicutes Bacilli Lactobacillales Streptococcaceae Streptococcus4439603 Firmicutes Bacilli Lactobacillales Streptococcaceae Streptococcus4442130 Firmicutes Bacilli Lactobacillales Streptococcaceae Streptococcus4455767 Firmicutes Bacilli Lactobacillales Streptococcaceae StreptococcusNROTU326 Firmicutes Bacilli Lactobacillales Streptococcaceae Streptococcus271159 Firmicutes Bacilli Lactobacillales1696853 Firmicutes Bacilli Lactobacillales1061772 Firmicutes Bacilli4316391 Firmicutes Clostridia Clostridiales Veillonellaceae Veillonella dispar4318671 Firmicutes Clostridia Clostridiales Veillonellaceae Veillonella dispar4410401 Firmicutes Clostridia Clostridiales Veillonellaceae Veillonella dispar4453501 Firmicutes Clostridia Clostridiales Veillonellaceae Veillonella dispar4458959 Firmicutes Clostridia Clostridiales Veillonellaceae Veillonella parvula4318122 Proteobacteria Gammaproteobacteria Pasteurellales Pasteurellaceae Actinobacillus porcinus70728 Proteobacteria Gammaproteobacteria Pasteurellales Pasteurellaceae Aggregatibacter pneumotropica4477696 Proteobacteria Gammaproteobacteria Pasteurellales Pasteurellaceae HaemophilusNROTU97 Tenericutes Mollicutes Mycoplasmatales Mycoplasmataceae MycoplasmaaID identifier NR new reference
Influenza A Viruses and the Mallard Microbiome
JanuaryFebruary 2017 Volume 2 Issue 1 e00188-16 msystemsasmorg 7
on March 5 2020 by guest
httpmsystem
sasmorg
Dow
nloaded from
The most abundant bacterial phyla reported in the cloacal microbiota of the barnswallow (Hirundo rustica) a passerine bird were Actinobacteria Firmicutes Proteobac-teria Bacteroidetes and Tenericutes (32) Several genera frequently found in our samples(eg Rothia Streptococcus Corynebacterium Enterococcus Streptococcus and Staphylo-coccus) were detected in barn swallows as well
All of the mallards sampled in this study were apparently healthy at the time thatthey were sampled and a number of studies have shown that infection with low-pathogenicity IAVs does not cause gross or microscopic lesions in the gastrointestinaltract of waterfowl (4 5 6 33) Thus we assume that the microbiome effects were causedby the IAV and were not due to lower fitness in infected birds All mallards were in theirhatch year (likely 6 months of age) and were sampled on their breeding grounds prior tomigration Thus our findings almost certainly reflect their first exposure to the particularvirus strain isolated from their feces and may reflect their first exposure to any IAV In anexperimental infection study of IAV in mallards Jourdain et al (5) found that most viralshedding occurs during the first 7 days of infection Despite the apparent lack of clinicaldisease or detectable pathology some authors have suggested that infection may causereduced fitness perhaps due to IAV-induced decreases in nutrient uptake For exampleLatorre-Margalef et al (17) found that body mass was significantly lower in free-ranginginfected mallards than in uninfected mallards however prior infection status did not affectthe speed or distance of subsequent migration Importantly we found that IAV mallardsexhibited large differences in the composition of their cloacal microbiome suggesting thatIAV infection and associated changes in the host microbiome may have effects on thenormal function of the gastrointestinal tract and perhaps of other organ systems andphysiological responses (ie immune system responses) as well (4 62 63 64)Although our study focused on a single species and a single anatomic location ourresults indicate that future studies of host-IAV interactions may be incomplete if theydo not include members of the microbiome as key players in the progress and outcomeof infection
Whether the observed differences in bacterial community composition associ-ated with IAV infection in mallards represent a transient change in the cloacalmicrobiome is unknown Although we assume that our IAV and IAV mallards hadsimilar microbiomes prior to IAV infection additional studies are needed to follow themicrobiome composition before during and after infection If IAV infection caused ourobserved differences in microbiome composition an interesting future direction wouldbe to verify that cloacal diversity returns to preinfection (IAV) levels after recoveryAlternatively mallards with more-diverse cloacal bacterial communities may be lesssusceptible to infection by IAVs and the observed differences in bacterial communitystructure may instead reflect variations in the host susceptibility to infection ratherthan being a consequence of infection Furthermore if reduced diversity in the
FIG 4 The number and abundance of the overlapping 41 OTUs in juvenile mallards
Ganz et al
JanuaryFebruary 2017 Volume 2 Issue 1 e00188-16 msystemsasmorg 8
on March 5 2020 by guest
httpmsystem
sasmorg
Dow
nloaded from
cloacal microbiome persists following infection mallards exposed to IAVs may bemore vulnerable to opportunistic infections However no studies have suggested thatprior exposure reflected by the presence of anti-IAV antibodies is associated withdecreased fitness or enhanced susceptibility to opportunistic infections
More-diverse ecological communities are often more stable in response to pertur-bations because decreases in the abundances of some species are counterbalanced byincreases in the abundances of others (34) Studies of macroorganisms (see egreferences 35 and 36) have found that greater species diversity is correlated withgreater surface cover which may help prevent the establishment of invasive speciesInteractions between taxa may occur on surfaces in animal microbiomes and in somecases low diversity may make hosts vulnerable to invasion Still it is important torecognize that diversity is not a panacea and that the consequences of diversity depend oncomplex interactions between host susceptibility and traits associated with invading spe-cies (37) In the human microbiome diseases that incite a strong inflammatory response areknown to cause changes (both decreases and increases) in bacterial OTU richness anddiversity (reviewed in reference 38) For example bacterial diversity in the lung is increasedin patients with cystic fibrosis (39) and in patients with bacterial vaginosis (40) Highmicrobial diversity is expected to occur in a healthy gut microbiome and in patients withCrohnrsquos disease (41) and patients with inflammatory bowel disease tend to have reducedbacterial diversity in their gastrointestinal tracts (42) However it is unclear whether reduceddiversity is a symptom or a cause of these conditions
In this study we used network modeling to identify a set of highly diagnostic cooccur-ring OTUs that would not have been detected by standard diversity analysis or differential-abundance-based statistics Difference networks for the two IAV conditions revealed thatD was a denser network which was consistent with the observation that the IAV
mallards had greater OTU diversity richness and evenness Combining all three approachesrevealed that a relatively small number of OTUs were significantly different across both theabundance and presenceabsence patterns and that these OTUs contributed to differencesassociated with infection status including infections by representatives of Streptococcusspp Veillonella dispar Rothia mucilaginosa and Prevotella among others
Nearly all OTUs identified as contributing significantly to the observed differenceswere enriched in uninfected individuals The only exception was a single OTU in thefamily Micrococcaceae (phylum Actinobacteria) that was enriched in IAV mallards (newreference OTU 462) In contrast enrichment of specific bacterial taxa is associated withvarious medical conditions in humans and other animals For example enrichment byStreptococcus spp was detected in human patients with irritable bowel disease (IBD)(reviewed in reference 43) and in chickens infected with pathogenic Campylobacterjejuni (44)
For an OTU to show up as significant in the G-test the DIROM and networkclusters it would need to be differentially enriched differentially occurring andhighly cooccurring with other OTUs OTUs identified as significant by all three methodsdid not fully overlap (Fig 5a) This is because these methods detect different contri-butions of variance to the data The network analysis identifies clusters based on thefrequency of OTU cooccurrence within group whereas the G-test and DIROM identifyOTUs based on differential levels of enrichment between groups Enrichment level andcooccurrence may be independent effects of IAV infection in which case we would notexpect to see a full overlap of the two analyses However both enrichment andcooccurrence contribute to intersample variance thus it was not unexpected for theOTUs identified by G-test and OTUs from the network analysis to overlap the highlyvariant OTUs without overlapping each other However the overlapping 41 OTUs wereidentified as significant in the three different approaches (Fig 5 and Table 1) Theintersection of the three methods contained OTU representatives of StreptococcusRothia mucilaginosa Veillonella dispar Prevotella Haemophilus and Mycoplasma and anunidentified OTU from the Lactobacillales order These OTUs were assigned to thesetaxonomic classifications in QIIME and these assignments were verified using BLASTInterestingly Streptococcus Haemophilus and Veillonella form consortia in the human
Influenza A Viruses and the Mallard Microbiome
JanuaryFebruary 2017 Volume 2 Issue 1 e00188-16 msystemsasmorg 9
on March 5 2020 by guest
httpmsystem
sasmorg
Dow
nloaded from
oral microbiome and Rothia and Prevotella are common members as well (45) It wouldbe interesting to investigate whether these taxa facilitate transmission of avian influ-enza virus to humans
In conclusion our methods revealed large differences in the compositions of thebacterial cloacal microbiomes of juvenile free-ranging mallards associated with IAVFurthermore we identified a set of significantly enriched differentially occurring andhighly cooccurring OTUs that may be potential biomarker candidates for predictinginfection status Intersection of our analysis methods identified a concise subset ofOTUs that best described the effect of IAV in mallards This subset of OTUs providesspecific targets for more-detailed studies addressing functional validation of in-depthinteractions between individual taxa and IAVs Experimental studies with appropriate
FIG 5 (a) Venn diagram showing the degree of overlap of the following different approaches G-test for significant differences between groups (with Bonferronicorrections for false-discovery rate) DIROM and unique network clusters Unique networks consist of the set of OTUs that were obtained by clustering in D
or D but not in both (b) Induced subnetwork of IAV and IAV for the overlapping 41 OTUs Both subnetworks are shown as roughly complete graphs (iethere exists an edge within every pair of OTUs) however the edge weights in IAV are all of high value (average weighted degree of 254) and thus form arobust cluster showing strong cooccurrence patterns among the nodes whereas in IAV edge weights among 41 overlapping OTUs were on average very low(average weighted degree of 17)
Ganz et al
JanuaryFebruary 2017 Volume 2 Issue 1 e00188-16 msystemsasmorg 10
on March 5 2020 by guest
httpmsystem
sasmorg
Dow
nloaded from
infected and noninfected controls sampled before during and after infection areneeded to confirm our findings and demonstrate causal relationships Those studiesshould be performed with different IAV subtypes to explore the observed significanteffect that different surface glycoproteins (HA and NA) have on bacterial diversityFinally such studies are also essential for assessing the relevance and ubiquity of ourputative biomarker OTUs
MATERIALS AND METHODSField collection and influenza testing Cloacal swabs were collected from 122 mallards for influenza
testing and microbiome analysis In the field swabs were placed in separate vials containing 2 ml ofice-cold virus transport medium (VTM medium 199 with Earlersquos salts L-glutamine and sodium bicar-bonate plus 2 mUliter penicillin G 200 mgliter streptomycin 2 mUliter polymyxin B 250 mglitergentamicin 05 mUliter nystatin 60 mgliter ofloxacin 200 mgliter sulfamethoxazole and 05 bovineserum albumin V) The samples were transported on ice to the laboratory where they were stored at80degC Samples underwent one or more freezethaw cycles as aliquots were removed for influenzatesting prior to microbiome analysis
Samples were screened for the influenza matrix gene by reverse transcription-PCR (RT-PCR) viruseswere isolated from matrix-positive samples by egg inoculation and full-genome sequences weregenerated as described in reference 65 Known negative samples did not yield virus on egg inoculationand were matrix RT-PCR negative We focused on juvenile mallards in this study in order to minimizedifferences that might arise in the composition of the microbiome in different age classes More detailon these samples is included in Table S4 in the supplemental material)
DNA extraction DNA was extracted from cloacal swabs using a PowerSoil 96-well soil DNA isolationkit (MoBio Carlsbad CA) Samples in 96-well plates were incubated at 65degC for 10 min after addition ofC1 solution Each 96-well plate was then subjected to vortex mixing for 3-min using a plate shaker onthe high setting (2600 rpm) and then the standard kit protocol was followed After elution DNA wasquantified using Qubit fluorometic quantitation (Invitrogen South San Francisco CA)
Nested PCR to amplify and sequence the 16S rRNA gene DNA was characterized for bacterialdiversity based on the V4 region of 16S rRNA gene following the methods of Caporaso et al (46) Whenpossible 10 to 50 l of template DNA was used for PCR However due to low DNA concentrations forsome samples bacterial DNA was amplified by a two-step PCR enrichment using primers 27F-YM3 and1492R to target V1 to V4 of the 16S rRNA gene (47) The 7-fold-degenerate primer 27f-YM3 is composedof four parts 27f-YM (AGAGTTTGATYMTGGCTCAG) plus one part each of primers specific for theamplification of Bifidobacteriaceae Borrelia and Chlamydiales sequences (47) For the second PCR theprimers used were the bacterialarchaeal primers 515F806R (46) modified by addition of an Illuminaadaptor and an in-house barcode system (described in reference 48) After amplification magnetic beads(Agencourt AMPure XP Beckman Coulter Inc Indianapolis IN) were used to clean the PCRs Ampliconswere quantified and characterized using Qubit fluorometic quantitation quantitative PCR (qPCR) and aBioanalyzer (Agilent Technologies Santa Clara CA) prior to sequencing Libraries were sequenced usingan Illumina MiSeq system generating 250-bp paired-end amplicon reads The amplicon data weremultiplexed using dual-barcode combinations for each sample
Data analysis We used a custom script (available in a GitHub repository httpsgithubcomgjospinscriptsblobmasterDemul_trim_preppl) to assign each pair of reads to their respective sampleswhen parsing the raw data This script allows for a 1-bp difference per barcode The paired readswere then aligned and a consensus was computed using FLASH (49) with a maximum overlap of 120and a minimum overlap of 70 (other parameters were left as the default) The custom scriptautomatically demultiplexes the data into fastq files executes FLASH and parses its results to reformatthe sequences with appropriate naming conventions for Quantitative Insights in Microbial Ecology(QIIME v191 46) in fasta format Each sample was characterized for taxonomic composition (numberand abundance) using QIIME For presenceabsence analyses representative operational taxonomic units(OTUs) were clustered at the 97 identity level and an OTU table was constructed using QIIMErsquospick_otus_through_otu_tablepy script Samples in the OTU table were rarefied to 5000 reads persample After rarefaction the total number of samples was 115 individuals 71 mallards were IAV positiveand 44 were IAV negative (Table S4)
We compared alpha diversity (mean species diversity per habitat) using the Shannon index asimplemented in the vegan library (50) in R (51) We compared levels of OTU richness (numbers of OTUsfound in each sample) and Pieloursquos evenness (calculated by dividing the value for the Shannon index fordiversity by the log of the value for OTU richness) We tested for statistical significance in alpha diversitymeasures using the Welch two-sample t test in R We compared levels of beta diversity (the ratio betweenregional species diversity and local species diversity) using Bray-Curtis dissimilarity and we usedprincipal-coordinate analysis (PCoA) for ordination and clustering We then used Adonis a multivariateANOVA based on dissimilarities to test for significant categorical differences with 1000 permutations inthe picante library (52) in R
Identification of significant OTUs To identify the OTUs most responsible for the differentiationbetween IAV and IAV birds we employed several strategies The first and simplest method involvedsimply computing the difference in the relative occurrence metric (DIROM) results for each OTU in theIAV and IAV groups For example if an OTU was found in 40 of the 44 (091) IAV birds and 7 of the71 (009) IAV birds then that OTU had a DIROM value of 082 (the absolute difference between 091 and009) We then sorted the OTUs in descending DIROM order causing the most differentially occurring
Influenza A Viruses and the Mallard Microbiome
JanuaryFebruary 2017 Volume 2 Issue 1 e00188-16 msystemsasmorg 11
on March 5 2020 by guest
httpmsystem
sasmorg
Dow
nloaded from
OTUs to be highest on the list Next we used the G-test to identify differences in OTU abundancebetween the different sample groups using the group_significancepy script in QIIME and the Bonferronimethod to correct for multiple comparisons We used Venny 21 (53) to examine the intersection of theresults from the methods described above with the results of the network analysis described belowFinally we used the Random Forest classifier (available in Pythonrsquos scikit-learn package 29) with 3-foldcross-validation to learn the linear and nonlinear relationships among the features (here relative OTUabundances) in order to find the set of the OTUs that are the most predictive of infection status
Building the IAV networks To identify OTUs that cooccur within an infection group (namely IAV
or IAV) we used network analysis Recent studies have shown that network inference techniques areuseful for deciphering microbial relationships from cooccurrence patterns (18 54 55) Here we built anetwork of the OTUs based on the presenceabsence patterns across all samples The goal was to see ifthere are clusters of OTUs that are more likely to cooccur in (only) one of the infection groups Wecompared every pair of OTUs in one group to the same pair of OTUs in the other infection groupdetermining the cooccurrence patterns between them If the cooccurrence patterns of a pair of OTUsdiffered by only a little between the infection groups we ignored that pair of OTUs Alternatively if thepatterns were very different we studied that pair in more detail We assumed that clusters of OTUs highlycooccurring in one group but not the other were infection dependent We discuss the details of how weobtained these clusters below
After identifying clustering of IAV and IAV mallards using ordination methods and ANOVA weperformed network analysis of the two groups as follows First we filtered the OTU table to remove taxapresent in fewer than two individuals per IAV condition Next we binarized the OTU abundance matrixfor presenceabsence of OTUs We define each sample as a binary presenceabsence vector of OTUs xjXwhere j (sample1 sampleN) Each vector value was multiplied by its transpose to obtain cooccur-rence between all pairs of OTUs and then the results were averaged across samples for each IAVcondition to obtain the cooccurrence score for all pairs of OTUs as follows
G
j1
N
XjXjT
N
We explored the cooccurrence patterns in each group by building a network of OTUs where eachOTU represented a node in the network and where there existed an edge between every two nodes Theelements of G are the scores for determining edge weights between two corresponding OTUs In thisstudy we focused only on the positive cooccurrence patterns since only the positive patterns have thetransitive property We then visualized the networks of infected and uninfected groups in Fig 2 usingGephi (56)
Building the difference networks We then analyzed bacterial communities in IAV and IAV
mallards by building separate difference networks (for each condition) based on the original networks(Fig 2) Difference networks were calculated as the difference of edge weights between the two groupsLet us assume that we have OTUi and OTUj with an edge between them with weight WIAV in the IAV
group The same pair of OTUs namely (OTUiOTUj) also occurs in the IAV group with weight WIAV Webuilt two difference networks D and D and added OTUi and OTUj to the difference networks as nodesIf WIAV minus WIAV was positive and higher than a threshold value (02 was arbitrarily chosenthroughout this study) this indicated that (OTUiOTUj) had a strong cooccurrence pattern in the IAV
group We then added an edge between the terms (OTUiOTUj) with weight WIAV to the differencenetwork D Similarly if WIAV minus WIAV was higher than we added an edge between the terms(OTUiOTUj) with weight WIAV to D
We denote a weighted graph G by G (V E) in which V is the set of vertices (nodes) and E isthe set of edges between the vertices that connects them (|V| n) with the weight function W E iexcl[0 1] Graph G should be undirected and irreflexive We define our networks as the set of verticesV (OTU0OTU1 OTUi OTUj OTUn) The network of the infected mallards (IAV) is defined asfollows
G V E and for simplicity we call WEOTUiOTUj Wij
The network of the uninfected mallards (IAV) is defined as follows
G V E and for simplicity we call WEOTUiOTUj Wij
We can now define our difference networks (GD and GD) The network of the D mallards is definedas follows
GD V EDWED
OTUiOTUj Wij|Wij Wij and forall OTUi OTUj where OTUi V and OTUj V and i jAnd the network of the D mallards is defined as follows
GD V EDWED
OTUiOTUj Wij|Wij Wij and forall OTUi OTUj where OTUi V and OTUj V and i jOnce the difference networks D and D were constructed we applied a threshold of 05 to remove
the edges with low edge weights (Fig 2) Then we extracted the clusters (ie the groups of nodes thatwere more densely connected to each other than to the rest of the network) (26) We filtered out theclusters that were of size 3 or less (including singletons) The resulting clusters in the D and D networkscontained 27 OTUs and 80 OTUs respectively We then examined which of the OTUs identified through
Ganz et al
JanuaryFebruary 2017 Volume 2 Issue 1 e00188-16 msystemsasmorg 12
on March 5 2020 by guest
httpmsystem
sasmorg
Dow
nloaded from
the network analysis contributed the most to the differences between the IAV and IAV groupsNetwork analyses were performed in Python using the NetworkX package and Gephi (56 57) The effectof removal of OTUs identified as significant by all the methods described above on PCoA clusters wasdetermined (see Text S1 and Fig S1 and S2 in the supplemental material)
Accession number(s) The sequence data reported in this study have been submitted to the NCBISRA database under BioProject accession number PRJNA358103
SUPPLEMENTAL MATERIALSupplemental material for this article may be found at httpsdoiorg101128
mSystems00188-16FIG S1 PDF file 04 MBTABLE S1 DOCX file 01 MBTABLE S2 DOCX file 01 MBTABLE S3 DOCX file 01 MBTABLE S4 DOCX file 003 MBTEXT S1 DOCX file 01 MBFIG S2 PDF file 03 MB
ACKNOWLEDGMENTSWe thank Magdalena Plancarte and Winston Vickers for their contributions to the
influenza study and Matt Rolston for sample preparation for the bacterial microbiomecharacterization We also thank the United States Geological Survey the CaliforniaWaterfowl Association and the California Department of Fish and Wildlife Grizzly IslandWildlife Area for their cooperation and assistance in sample collection from mallards
This study was supported in part by funding from NIH (CEIRSmdashHHSN272201400008Cand HHSN266200700010C) (WMB) and by a grant to JAE from the Alfred P SloanFoundation as part of their ldquoMicrobiology of the Built Environmentrdquo program SMHwas funded through The UC Davis Chancellorrsquos Postdoctoral Fellowship and AJF wasfunded through the UC Davis College of Biological Sciences New Biology PostdoctoralFellowship
REFERENCES1 Taubenberger JK Morens DM 2008 The pathology of influenza virus
infections Annu Rev Pathol 3499 ndash522 httpsdoiorg101146annurevpathmechdis3121806154316
2 Gorman OT Bean WJ Webster RG 1992 Evolutionary processes ininfluenza viruses divergence rapid evolution and stasis p 75ndash97 InGenetic diversity of RNA viruses Springer New York NY
3 Medina RA Garciacutea-Sastre A 2011 Influenza A viruses new researchdevelopments Nat Rev Microbiol 9590 ndash 603 httpsdoiorg101038nrmicro2613
4 Runstadler J Hill N Hussein IT Puryear W Keogh M 2013 Connecting thestudy of wild influenza with the potential for pandemic disease InfectGenet Evol 17162ndash187 httpsdoiorg101016jmeegid201302020
5 Jourdain E Gunnarsson G Wahlgren J Latorre-Margalef N Broumljer CSahlin S Svensson L Waldenstroumlm J Lundkvist A Olsen B 2010 Influ-enza virus in a natural host the mallard experimental infection dataPLoS One 5e8935 httpsdoiorg101371journalpone0008935
6 Webster RG Bean WJ Gorman OT Chambers TM Kawaoka Y 1992Evolution and ecology of influenza A viruses Microbiol Rev 56152ndash179
7 Whipps J Lewis K Cooke R 1988 Mycoparasitism and plant diseasecontrol p 161ndash187 In Fungi in biological control systems ManchesterUniversity Press Manchester United Kingdom
8 Morgan XC Huttenhower C 2012 Human microbiome analysis PLoSComput Biol 8e1002808 httpsdoiorg101371journalpcbi1002808
9 Mutlu EA Keshavarzian A Losurdo J Swanson G Siewe B Forsyth CFrench A DeMarais P Sun Y Koenig L Cox S Engen P Chakradeo PAbbasi R Gorenz A Burns C Landay A 2014 A compositional look at thehuman gastrointestinal microbiome and immune activation parametersin HIV infected subjects PLoS Pathog 10e1003829 httpsdoiorg101371journalppat1003829
10 Berkhout B 2015 With a little help from my enteric microbial friendsFront Med 230 httpsdoiorg103389fmed201500030
11 Abt MC Osborne LC Monticelli LA Doering TA Alenghat T SonnenbergGF Paley MA Antenus M Williams KL Erikson J Wherry EJ Artis D 2012
Commensal bacteria calibrate the activation threshold of innate antiviralimmunity Immunity 37158 ndash170 httpsdoiorg101016jimmuni201204011
12 Fujimura KE Demoor T Rauch M Faruqi AA Jang S Johnson CCBoushey HA Zoratti E Ownby D Lukacs NW Lynch SV 2014 House dustexposure mediates gut microbiome lactobacillus enrichment and airwayimmune defense against allergens and virus infection Proc Natl Acad SciU S A 111805ndash 810 httpsdoiorg101073pnas1310750111
13 Turner JR 2009 Intestinal mucosal barrier function in health and dis-ease Nat Rev Immunol 9799 ndash 809 httpsdoiorg101038nri2653
14 Alemka A Corcionivoschi N Bourke B 2012 Defense and adaptationthe complex inter-relationship between Campylobacter jejuni and mu-cus Front Cell Infect Microbiol 215 httpsdoiorg103389fcimb201200015
15 Linden SK Sutton P Karlsson NG Korolik V McGuckin MA 2008 Mucinsin the mucosal barrier to infection Mucosal Immunol 1183ndash197 httpsdoiorg101038mi20085
16 Jones MK Watanabe M Zhu S Graves CL Keyes LR Grau KR Gonzalez-Hernandez MB Iovine NM Wobus CE Vinjeacute J Tibbetts SA Wallet SM Karst SM2014 Enteric bacteria promote human and mouse norovirus infection of Bcells Science 346755ndash759 httpsdoiorg101126science1257147
17 Latorre-Margalef N Gunnarsson G Munster VJ Fouchier RA OsterhausAD Elmberg J Olsen B Wallensten A Haemig PD Fransson T Brudin LWaldenstroumlm J 2009 Effects of influenza A virus infection on migratingmallard ducks Proc R Soc Lond B Biol Sci 2761029 ndash1036 httpsdoiorg101098rspb20081501
18 Barberaacuten A Bates ST Casamayor EO Fierer N 2012 Using networkanalysis to explore co-occurrence patterns in soil microbial communitiesISME J 6343ndash351 httpsdoiorg101038ismej2011119
19 Ito T Suzuki Y Suzuki T Takada A Horimoto T Wells K Kida H Otsuki KKiso M Ishida H Kawaoka Y 2000 Recognition of N-glycolylneuraminicacid linked to galactose by the 23 linkage is associated with intestinal
Influenza A Viruses and the Mallard Microbiome
JanuaryFebruary 2017 Volume 2 Issue 1 e00188-16 msystemsasmorg 13
on March 5 2020 by guest
httpmsystem
sasmorg
Dow
nloaded from
replication of influenza A virus in ducks J Virol 749300 ndash9305 httpsdoiorg101128JVI74199300-93052000
20 Ichinohe T Pang IK Kumamoto Y Peaper DR Ho JH Murray TS IwasakiA 2011 Microbiota regulates immune defense against respiratory tractinfluenza A virus infection Proc Natl Acad Sci USA 1085354 ndash5359httpsdoiorg101073pnas1019378108
21 Nishikawa T Shimizu K Tanaka T Kuroda K Takayama T Yamamoto THanada N Hamada Y 2012 Bacterial neuraminidase rescues influenzavirus replication from inhibition by a neuraminidase inhibitor PLoS One7e45371 httpsdoiorg101371journalpone0045371
22 Chaban B Albert A Links MG Gardy J Tang P Hill JE 2013 Character-ization of the upper respiratory tract microbiomes of patients withpandemic H1N1 influenza PLoS One 8e69559 httpsdoiorg101371journalpone0069559
23 Leung RK Zhou JW Guan W Li SK Yang ZF Tsui SK 2013 Modulationof potential respiratory pathogens by pH1N1 viral infection Clin Micro-biol Infect 19930 ndash935 httpsdoiorg1011111469-069112054
24 Lambert N Salk H Kennedy R Chia N Grill D Jacobson R Poland G2014 Intranasal vaccination with live attenuated influenza vaccine in-creases diversity of the human nasal microbiome (VAC8P 1001) JImmunol 1921427
25 Oh Y Yang S-WJ Ngan DA Hirota JA Niikura M Tam S Knight DAHackett T-L Dorscheid D Man S 2015 The bacterial microbiome ofgut lung and blood after H1N1 influenza virus infection in micewith and without house dust mite exposure p A1315ndashA1315 In A32Microbial Interactions And Host Defense American Thoracic SocietyNew York NY
26 Blondel VD Guillaume J-L Lambiotte R Lefebvre E 2008 Fast unfoldingof communities in large networks J Stat Mech 2008P10008 httpsdoiorg1010881742-5468200810P10008
27 Biemann C 2006 Chinese whispers an efficient graph clustering algo-rithm and its application to natural language processing problems p73ndash 80 In Proceedings of the First Workshop on Graph Based Methodsfor Natural Language Processing Association for Computational Linguis-tics Stroudsburg PA
28 van Dongen S 2000 Graph clustering by flow simulation PhD thesisUniversity of Utrecht Utrecht Holland
29 Pedregosa F Varoquaux G Gramfort A Michel V Thirion B Grisel OBlondel M Prettenhofer P Weiss R Dubourg V 2011 Scikit-learn ma-chine learning in Python J Mach Learn Res 122825ndash2830
30 Toennessen R Germundsson A Jonassen CM Haugen I Berg K BarrettRT Rimstad E 2011 Virological and serological surveillance for type Ainfluenza in the black-legged kittiwake (Rissa tridactyla) Virol J 821httpsdoiorg1011861743-422X-8-21
31 van Dongen WF White J Brandl HB Moodley Y Merkling T Leclaire SBlanchard P Danchin E Hatch SA Wagner RH 2013 Age-related differ-ences in the cloacal microbiota of a wild bird species BMC Ecol 1311httpsdoiorg1011861472-6785-13-11
32 Kreisinger J Ciacutežkovaacute D Kropaacuteckovaacute L Albrecht T 2015 Cloacal micro-biome structure in a long-distance migratory bird assessed using deep16sRNA pyrosequencing PLoS One 10e0137401 httpsdoiorg101371journalpone0137401
33 Kuiken T 2013 Is low pathogenic avian influenza virus virulent for wildwaterbirds Proc R Soc Lond B Biol Sci 28020130990 httpsdoiorg101098rspb20130990
34 Ives AR Carpenter SR 2007 Stability and diversity of ecosystems Sci-ence 31758 ndash 62 httpsdoiorg101126science1133258
35 Dukes JS 2001 Biodiversity and invasibility in grassland microcosmsOecologia 126563ndash568 httpsdoiorg101007s004420000549
36 Stachowicz JJ Fried H Osman RW Whitlatch RB 2002 Biodiversityinvasion resistance and marine ecosystem function reconciling patternand process Ecology 832575ndash2590 httpsdoiorg1018900012-9658(2002)083[2575BIRAME]20CO2
37 Ganz HH Ebert D 2010 Benefits of host genetic diversity for resistanceto infection depend on parasite diversity Ecology 911263ndash1268 httpsdoiorg10189009-12431
38 Fierer N Ferrenberg S Flores GE Gonzaacutelez A Kueneman J Legg T LynchRC McDonald D Mihaljevic JR OrsquoNeill SP Rhodes ME Song SJ WaltersWA 2012 From animalcules to an ecosystem application of ecologicalconcepts to the human microbiome Annu Rev Ecol Evol Syst 43137ndash155 httpsdoiorg101146annurev-ecolsys-110411-160307
39 Harrison F 2007 Microbial ecology of the cystic fibrosis lung Microbi-ology 153917ndash923 httpsdoiorg101099mic02006004077-0
40 Lamont RF Sobel JD Akins RA Hassan SS Chaiworapongsa T Ku-
sanovic JP Romero R 2011 The vaginal microbiome new informa-tion about genital tract flora using molecular based techniques BJOGInt J Obstet Gynaecol 118533ndash549 httpsdoiorg101111j1471-0528201002840x
41 Manichanh C Rigottier-Gois L Bonnaud E Gloux K Pelletier E FrangeulL Nalin R Jarrin C Chardon P Marteau P Roca J Dore J 2006 Reduceddiversity of faecal microbiota in Crohnrsquos disease revealed by a metag-enomic approach Gut 55205ndash211 httpsdoiorg101136gut2005073817
42 Frank DN St Amand AL Feldman RA Boedeker EC Harpaz N Pace NR2007 Molecular-phylogenetic characterization of microbial communityimbalances in human inflammatory bowel diseases Proc Natl Acad SciU S A 10413780 ndash13785 httpsdoiorg101073pnas0706625104
43 Bennet SM Ohman L Simreacuten M 2015 Gut microbiota as potentialorchestrators of irritable bowel syndrome Gut Liver 9318 ndash331 httpsdoiorg105009gnl14344
44 Indikova I Humphrey TJ Hilbert F 2015 Survival with a helping handcampylobacter and microbiota Front Microbiol 61266 httpsdoiorg103389fmicb201501266
45 Mark Welch JL Rossetti BJ Rieken CW Dewhirst FE Borisy GG 2016Biogeography of a human oral microbiome at the micron scale ProcNatl Acad Sci U S A 113E791ndashE800 httpsdoiorg101073pnas1522149113
46 Caporaso JG Kuczynski J Stombaugh J Bittinger K Bushman FDCostello EK Fierer N Pentildea AG Goodrich JK Gordon JI Huttley GA KelleyST Knights D Koenig JE Ley RE Lozupone CA McDonald D MueggeBD Pirrung M Reeder J Sevinsky JR Turnbaugh PJ Walters WA Wid-mann J Yatsunenko T Zaneveld J Knight R 2010 QIIME allows analysisof high-throughput community sequencing data Nat Methods7335ndash336 httpsdoiorg101038nmethf303
47 Frank JA Reich CI Sharma S Weisbaum JS Wilson BA Olsen GJ 2008Critical evaluation of two primers commonly used for amplification ofbacterial 16S rRNA genes Appl Environ Microbiol 742461ndash2470 httpsdoiorg101128AEM02272-07
48 Lang JM Eisen JA Zivkovic AM 2014 The microbes we eat abundanceand taxonomy of microbes consumed in a dayrsquos worth of meals for threediet types PeerJ 2e659 httpsdoiorg107717peerj659
49 Magoc T Salzberg SL 2011 FLASH fast length adjustment of short readsto improve genome assemblies Bioinformatics 272957ndash2963 httpsdoiorg101093bioinformaticsbtr507
50 Oksanen J Blanchet FG Kindt R Legendre P Minchin PR OrsquoHara RBSimpson GL Solymos P Stevens MHH Wagner H 2016 vegan commu-nity ecology package R package version 23-5 httpscranr-projectorgpackagevegan
51 Team RC 2016 R a language and environment for statistical computingR Foundation for Statistical Computing Vienna Austria httpswwwr-projectorg
52 Kembel SW Cowan PD Helmus MR Cornwell WK Morlon H Ackerly DDBlomberg SP Webb CO 2010 Picante R tools for integrating phylog-enies and ecology Bioinformatics 261463ndash1464 httpsdoiorg101093bioinformaticsbtq166
53 Oliveros JC 2007ndash2015 Venny An interactive tool for comparing lists withVennrsquos diagrams httpbioinfogpcnbcsicestoolsvennyindexhtml
54 Faust K Lima-Mendez G Lerat JS Sathirapongsasuti JF Knight R Hut-tenhower C Lenaerts T Raes J 2015 Cross-biome comparison of micro-bial association networks Front Microbiol 61200 httpsdoiorg103389fmicb201501200
55 Faust K Sathirapongsasuti JF Izard J Segata N Gevers D Raes J Hutten-hower C 2012 Microbial co-occurrence relationships in the human mi-crobiome PLoS Comput Biol 8e1002606 httpsdoiorg101371journalpcbi1002606
56 Bastian M Heymann S Jacomy M 2009 Gephi an open source softwarefor exploring and manipulating networks p 361ndash362 In Proceedings ofthe Third International Conference on Weblogs and Social Media TheAAAI Press Menlo Park CA
57 Schult DA Swart P 2008 Exploring network structure dynamics andfunction using NetworkX p 11ndash16 In Proceedings of the 7th Python inScience Conferences (SciPy 2008)
58 Boyce WM Sandrock C Kreuder-Johnson C Kelly T Cardona C 2009Avian influenza viruses in wild birds a moving target Comp ImmunolMicrobiol Infect Dis 32275ndash286 httpsdoiorg101016 jcimid200801002
59 Dusek RJ Bortner JB DeLiberto TJ Hoskins J Franson JC Bales BDYparraguirre D Swafford SR Ip HS 2009 Surveillance for high pathoge-
Ganz et al
JanuaryFebruary 2017 Volume 2 Issue 1 e00188-16 msystemsasmorg 14
on March 5 2020 by guest
httpmsystem
sasmorg
Dow
nloaded from
nicity avian influenza virus in wild birds in the Pacific flyway of theUnited States 2006 ndash2007 Avian Dis 53222ndash230 httpsdoiorg1016378462-082908-Reg1
60 Girard YA Runstadler JA Aldehoff F Boyce W 2012 Genetic structure ofPacific flyway avian influenza viruses is shaped by geographic locationhost species and sampling period Virus Genes 44415ndash 428 httpsdoiorg101007s11262-011-0706-5
61 Olson SH Parmley J Soos C Gilbert M Latorre-Margalef N Hall JSHansbro PM Leighton F Munster V Joly D 2014 Sampling strategiesand biodiversity of influenza A subtypes in wild birds PLoS One9e90826 httpsdoiorg101371journalpone0090826
62 Tolf C Latorre-Margalef N Wille M Bengtsson D Gunnarsson G Grosbois
V Hasselquist D Olsen B Elmberg J Waldenstrom J 2013 Individualvariation in influenza A virus infection histories and long-term immuneresponses in mallards PLoS One 8e61201 httpsdoiorg101371journalpone0061201
63 Wilks J Beilinson H Golovkina TV 2013 Dual role of commensal bacteria in viralinfections Immunol Rev 255222ndash229 httpsdoiorg101111imr12097
64 Waite DW Taylor MW 2014 Characterizing the avian gut microbiotamembership driving influences and potential function Front Microbiol5223 httpsdoiorg103389fmicb201400223
65 Lindsay LL Kelly TR Plancarte M Schobel S Lin X Dugan VG WentworthDE Boyce WM 2013 Avian influenza mixed infections and missingviruses Viruses 51964 ndash1977 httpsdoiorg103390v5081964
Influenza A Viruses and the Mallard Microbiome
JanuaryFebruary 2017 Volume 2 Issue 1 e00188-16 msystemsasmorg 15
on March 5 2020 by guest
httpmsystem
sasmorg
Dow
nloaded from
- RESULTS
-
- Infected mallards only
- Network analysis
- Classifying mallards using overlapping OTUs
-
- DISCUSSION
- MATERIALS AND METHODS
-
- Field collection and influenza testing
- DNA extraction
- Nested PCR to amplify and sequence the 16S rRNA gene
- Data analysis
- Identification of significant OTUs
- Building the IAV networks
- Building the difference networks
- Accession number(s)
-
- SUPPLEMENTAL MATERIAL
- ACKNOWLEDGMENTS
- REFERENCES
-
Mallards (Anas platyrhyncos) are an important natural reservoir in North Americaand Eurasia for many subtypes of influenza A viruses (IAVs) the group of influenza
viruses mainly responsible for seasonal and pandemic influenza in humans (1) Water-fowl (ducks geese and swans in the avian family Anatidae) are the primary reservoir ofnaturally occurring IAVs (2 6) In humans and domestic animals (poultry swine horsesdogs etc) IAVs contain gene segments that trace back to a wild avian origin (3 4)Recent concern over the emergence of new pandemic IAVs led to intensive IAVsurveillance in waterfowl especially of dabbling ducks in the genus Anas whichrevealed that IAV prevalence may reach 40 especially in young (hatch year) birds(58ndash61 65) In contrast to humans where IAVs infect the respiratory tract and causesignificant morbidity and mortality IAVs infect the gastrointestinal tract of waterfowland cause little or no pathology (5) and are spread by fecal-oral transmission (6)
Here we investigated the bacterial microbiome in wild juvenile mallards and testedfor associations with IAV infection The microbiome was first defined by Whipps et al(7) as a characteristic microbial community (including bacteria archaea fungi thevarious single-celled eukaryotes generally referred to as protists and viruses) occupyinga distinct habitat For a variety of reasons most microbiome research to date hasfocused on the bacterial portion of these communities The application of contempo-rary sequencing methods to characterize diversity in the microbiome has revolution-ized the study of interactions between microbial inhabitants of the microbiome ingeneral as well as the study of interactions between members of the microbiome andparticular pathogens (see eg references 8ndash12) Identification of potential effects of IAVinfection on the microbiome of mallards (a natural reservoir) should contribute to agreater understanding of how these viruses are maintained and transmitted in nature
When a mallard ingests IAV from contaminated material in the environment theprocess of infection requires a virus to pass from the gut lumen through mucus whichpresents a potent physical and immunological barrier to microbial invasion (13 14 15)In birds and mammals mucus is composed primarily of mucins produced by underlyingepithelial cells and is divided into two layers an outer layer that typically contains adiverse community of resident microbes and an inner ldquoprotectedrdquo layer that has a lowdensity of microbes except during pathogen invasion (15) In some cases the micro-biome of the mucus layer may affect pathogen attachment to host cells for exampleglycan structures on the surface of the bacterium Enterobacter cloacae in the humangut microbiome may facilitate the attachment of human norovirus to host cells (16) Inaddition some orally transmitted viruses including poliovirus and reovirus may ma-nipulate the bacterial microbiome to promote their transmission across the mucosalinterface (reviewed in reference 10) Along with its associated microbiota and anypotential pathogens trapped in the mucus layer mucus is continuously expelledfrom the body Once IAVs have crossed the mucosal barrier in the intestinal tract ofwaterfowl they amplify inside host epithelial cells and are then shed into the environ-ment and transmitted to new hosts Free-ranging mallards typically shed IAVs in fecesfor about 6 days after infection (5 17)
In this study we analyzed the relationship between infection by low-pathogenicityIAVs and the composition and species cooccurrence patterns of bacteria inhabiting thecloacal microbiome of juvenile mallards We hypothesized that IAV infection would beassociated with an altered microbiome To investigate this we identified members ofthe microbiome that contribute to the observed associations We compared bacterialcommunity composition characteristics using standard approaches (alpha and betadiversity see Materials and Methods) and to assess the relationships between groupsof taxa we analyzed bacterial operational taxonomic unit (OTU) cooccurrence patternsGiven that groups of bacterial taxa are often both functionally and phylogeneticallyrelated it is useful to assess how infection might affect interdependencies betweenbacterial OTUs In order to investigate potential interactions and relationships amongdifferent microbial taxa we analyzed their cooccurrence relationships using a networkNetwork analysis of significant cooccurrence structures of microbial taxa has helped
Ganz et al
JanuaryFebruary 2017 Volume 2 Issue 1 e00188-16 msystemsasmorg 2
on March 5 2020 by guest
httpmsystem
sasmorg
Dow
nloaded from
decipher complex microbial dynamics such as groups of taxa that are metabolicallylinked or are genetically related (18)
Although several studies have focused on IAVs and the microbiome in humans andmice (19ndash25) we believe that this is the first study to have investigated the relationshipbetween IAV infection and the microbiome of a wild bird that is an important primaryreservoir
RESULTS
Cloacal swabs were collected from 122 juvenile mallards in the Suisun Bay area inCalifornia in the United States between 2009 and 2013 All mallards sampled in thisstudy were apparently healthy at the time of sampling We performed influenza testingand microbiome analysis on the cloacal swabs
OTU richness levels in cloacal samples differed based on infection status (t 720df 948 P 000001) (Fig 1a) After rarefaction to 5000 reads per sample andremoval of OTUs that were unidentified at the kingdom level IAV-negative (hereldquoIAVrdquo) mallards had 15 times as many OTUs per individual (282 OTUs) as IAV-positive(IAV) mallards (187 OTUs Fig 1a) OTU diversity (based on Shannon index values) wasgreater in IAV mallards than in IAV mallards (t 377 df 7883 P 00003)(Fig 1a) and OTU evenness was greater in IAV mallards than in IAV mallards (t
253 df 7645 P 0014) (Fig 1a)Representatives of the bacterial phyla Firmicutes Proteobacteria Bacteroidetes Acti-
nobacteria Fusobacteria and Tenericutes were detected in all of the samples compris-ing averages of 44 27 16 5 4 and 14 in IAV mallards and 27 33 244 55 and 1 in IAV mallards respectively (Fig 1b) Infection status was correlatedwith large differences in the proportions of bacterial OTUs particularly within the phylaFirmicutes Proteobacteria and Bacteroidetes (Fig 1b)
The overall composition of cloacal bacteria in IAV mallards differed significantlyfrom that in IAV mallards (permutational multivariate analysis of variance[PERMANOVA] F1114 112 P 0001) even though the community composition wasinfluenced by the year of sampling (PERMANOVA F1114 3 28 P 0001) and the
FIG 1 (a) IAV-positive (IAV) and IAV mallards also differed in OTU richness Shannon index and OTU evennessresults (b) Proportions of bacterial phyla in the cloacal microbiome differed between IAV and IAV mallards
Influenza A Viruses and the Mallard Microbiome
JanuaryFebruary 2017 Volume 2 Issue 1 e00188-16 msystemsasmorg 3
on March 5 2020 by guest
httpmsystem
sasmorg
Dow
nloaded from
interaction between influenza infection status and year of sampling was also significant(PERMANOVA F1114 305 P 0002) The microbiome of mallard males did not differfrom that of females (PERMANOVA F2114 114 P 024) Despite the effect of theyear data we detected significant clustering based on infection status (see Fig S1 in thesupplemental material)
Infected mallards only Among IAV mallards there was a significant effect of IAVsubtype (based on the levels of the surface proteins hemagglutinin [HA] and neur-aminidase [NA]) on bacterial community composition (F169 135 P 0004) Inaddition we detected a significant effect of year of sampling (F169 303 P 0004)likely because some subtypes occurred only in certain years and the interactionbetween HA and NA subtype and the year that the mallards were sampled wassignificant (F169 214 P 0007)
Using the DIROM (Difference in the Relative Occurrence Metric see Materials andMethods) method we identified all OTUs that had a greater than 50 difference in howfrequently they occurred in the two groups This resulted in 47 OTUs (see Table S1 inthe supplemental material) all of which occurred in greater frequency in the IAV
mallards These OTUs belonged to the phyla Tenericutes (n 1) Proteobacteria (n 4)Firmicutes (n 31) Bacteroidetes (n 5) and Actinobacteria (n 6) According to theresults obtained with a Quantitative Insights in Microbial Ecology (QIIME) taxonomyassignment script (assign_taxonomypy) 21 of the 47 OTUs belonged to the genusStreptococcus 5 were representatives of the species Rothia mucilaginosa and 5 wererepresentatives of the species Veillonella dispar The largest difference belonged to thesingle OTU from the Tenericutes representing a mycoplasma whose examples differedby 921 between the groups and like the other OTUs occurred more frequently inIAV mallards
We also used the G-test (see Materials and Methods) to identify 85 OTUs thatdiffered in abundance between IAV and IAV mallards (Table S2) IAV mallards hadhigher abundances in 51 OTUs in Firmicutes particularly in representatives of Strepto-coccus (n 31 OTUs) and Veillonella (n 14 OTUs) as well as OTUs in other phylaincluding Actinobacteria (n 10) Bacteroidetes (n 10) Proteobacteria (n 5)Tenericutes (n 4) and Fusobacteria (n 3) Only one OTU (in phylum Actinobacteriafamily Micrococcaceae) was significantly enriched in the IAV mallards compared toIAV individuals
Network analysis The resulting bacterial networks (see Materials and Methods) bothconsisted of 674 nodes (OTUs) with 112488 non-zero-weighted edges in IAV and 132875edges in IAV networks with average node connections (ie the average number of edgesincident to each node) of 33379 and 39402 respectively The average values for weighteddegree (ie sum of all the weights for incident edges) were 1312 for IAV and 2989 forIAV These results show that OTUs in the IAV group had a lower number of connectionsin total and that the edges had relatively much lower weights Thus the OTUs in IAV
mallards cooccurred in fewer IAV mallards than IAV mallardsTo ensure that we were detecting OTUs associated with infection status (rather than
clusters idiosyncratic to individuals) we filtered the OTU table to include only thoseOTUs that appeared in two or more samples per IAV condition resulting in 674 OTUsWe then characterized OTU cooccurrence networks across the 674 OTUs in the IAV
and IAV mallards and compared the IAV and IAV networks to generate differencenetworks (D and D see Materials and Methods) Briefly the cooccurrences that wereat higher levels in IAV were assigned to D and the cooccurrences that were at higherlevels in IAV were assigned to D The assumption is that the clusters of OTUs highlycooccurring in one group (D or D) but not the other were infection dependent Theresulting difference networks both consisted of 674 nodes (OTUs) with 344 edges in D
and 6702 edges in D networks with average node connections of 102 and 198respectively We found that the network of D mallards had fewer edges and thuslower network density than the network of D mallards The density values were 0002in D and 003 in D showing proportionally larger numbers of existing connections
Ganz et al
JanuaryFebruary 2017 Volume 2 Issue 1 e00188-16 msystemsasmorg 4
on March 5 2020 by guest
httpmsystem
sasmorg
Dow
nloaded from
in D In order to identify core communities of bacteria that were associated with IAVinfection we set a threshold for edge weights (see Materials and Methods) to excludeweak connections and then decomposed our D and D networks into modules (iegroups of nodes that were more densely connected to one another than to the rest ofthe network) (26) to find significant community differences in cooccurrence patternsbetween IAV and IAV mallards Both D and D resulted in the formation of onecluster by the use of the Chinese whispers clustering method (27) and Markov clusteralgorithm (MCL) clustering (28) with 27 and 80 nodes respectively A visualization ofthese clusters is shown in Fig 2 Twenty of these OTUs were mutual (shared) betweenthe two groups (mutual 20) The mutual 20 exhibited similar abundance patterns acrossall the samples regardless of the infection group (Fig 3) and may be part of the coremicrobiome of the mallard In addition to the mutual 20 OTUs we found 7 OTUs thatwere uniquely identified by the D cluster and we found 60 OTUs that were uniquelyidentified by the D cluster The set of OTUs that were uniquely identified in D maybe indicative of a community of bacteria that are activated in the presence of infectionThis approach allows us to identify those OTUs that were uniquely identified in the D
cluster (and therefore absent in the D cluster) and may reflect bacteria that arediminished in population during infection The obtained cluster from D was biggerand more densely connected whereas the D cluster had fewer OTUs and weakerconnections Therefore the cluster from D may represent stronger patterns of coas-sociation between OTUs
In the final step of network modeling we used the difference networks to identifyclusters that were highly correlated with groups of mallards based on their infectionstatus (Table S3) Notably 41 of the OTUs identified by network analysis overlapped theOTUs identified by G-test and DIROM (Fig 3 Table 1) All of these OTUs were containedin the clusters retrieved from the D network We studied the distribution of those 41OTUs across the clusters and observed that all of them were contained in one clusterand had high edge weights (Fig 2)
To confirm whether these OTUs are predictive of infection status we also used theRandom Forest model which is a supervised machine-learning technique (29) The
FIG 2 (a) Networks of cooccurrence patterns for OTUs found in mallards that tested either positive for IAV (IAV) or negativefor IAV (IAV) Networks of D and D data were constructed from the IAV and IAV networks by adding edges that differedin edge weight by more than a threshold value of 02 from those of their D networks Once D networks were created weapplied an edge threshold value of 05 to remove the edges with low edge weights The clusters obtained for the D and D
networks with the overlapping 41 are shown next to the difference networks and are colored (in D cluster) (b) Toy graphillustrating our method
Influenza A Viruses and the Mallard Microbiome
JanuaryFebruary 2017 Volume 2 Issue 1 e00188-16 msystemsasmorg 5
on March 5 2020 by guest
httpmsystem
sasmorg
Dow
nloaded from
3-fold cross-validation approach was applied to estimate the accuracy of the classifierWe assigned OTUs as the features in our model to identify the set of OTUs mostpredictive of infection status resulting in 211 OTUs Of the 211 OTUs 38 wererepresented in the 41 overlapping OTUs obtained from our previous approaches Usingonly the 41 overlapping OTUs as features in a second Random Forest model weobtained 96 accuracy in predicting infection status
FIG 3 Log-scaled abundances of OTUs under different IAV conditions (a) A total of 41 overlapping OTUs (b) A total of 8 DIROMOTUs not including the overlapping 41 (c) A total of 46 G-test OTUs not including the overlapping 41 (d) A total of 7 OTUsthat were uniquely found to be highly cooccurring in IAV networks (e) A total of 80 OTUs that were uniquely found to be highlycooccurring in IAV networks (f) A total of 20 OTUs that were mutually significant under both IAV conditions
Ganz et al
JanuaryFebruary 2017 Volume 2 Issue 1 e00188-16 msystemsasmorg 6
on March 5 2020 by guest
httpmsystem
sasmorg
Dow
nloaded from
Classifying mallards using overlapping OTUs Subsequently we determinedwhether the overlapping 41 OTUs indicated the IAV condition for each sample Wefound that the 41 overlapping OTUs were highly represented in IAV mallards andwere not highly represented in IAV mallards (Fig 3) IAV mallards had most of the41 OTUs at high abundance whereas IAV mallards frequently had few of the 41 OTUsand that those few OTUs occurred at low abundance (Fig 4) More than 90 of theIAV mallards had 12 or fewer of the overlapping 41 OTUs and 80 of the IAV
mallards had more than 24 of the overlapping OTUs
DISCUSSION
This study was the first characterization of the cloacal microbiome of wild free-ranging mallards Anatomically the cloaca differs from the gastrointestinal tract in thatit interacts with the digestive system the urogenital system and the outside world(including sexual partners) Only a few sequence-based studies have been conductedon the cloacal microbiome of birds As we found for the mallards black-leggedkittiwakes (Rissa tridactyla) another natural host for IAV (30) contain ActinobacteriaFirmicutes and Proteobacteria in the cloacal microbiome and even share many generawith our data set (eg Rothia Streptococcus Corynebacterium and Enterococcus) (31)
TABLE 1 Taxonomic information for the 41 OTUs identified as contributing to observed differences in IAV and IAV juvenile mallardsbased on the intersection of the DIROM G-test and network analysis resultsa
OTU ID Phylum Class Order Family Genus Species
4466006 Actinobacteria Actinobacteria Actinomycetales Micrococcaceae Rothia dentocariosa866280 Actinobacteria Actinobacteria Actinomycetales Micrococcaceae Rothia mucilaginosa1017181 Actinobacteria Actinobacteria Actinomycetales Micrococcaceae Rothia mucilaginosa4294457 Actinobacteria Actinobacteria Actinomycetales Micrococcaceae Rothia mucilaginosa4411138 Actinobacteria Actinobacteria Actinomycetales Micrococcaceae Rothia mucilaginosa269907 Bacteroidetes Bacteroidia Bacteroidales (Prevotellaceae) (Prevotella)4423790 Bacteroidetes Bacteroidia Bacteroidales Porphyromonadaceae Porphyromonas endodontalis4321559 Bacteroidetes Bacteroidia Bacteroidales Porphyromonadaceae Porphyromonas4307391 Bacteroidetes Bacteroidia Bacteroidales Prevotellaceae Prevotella melaninogenica4446902 Firmicutes Bacilli Gemellales Gemellaceae92535 Firmicutes Bacilli Lactobacillales Streptococcaceae Streptococcus298862 Firmicutes Bacilli Lactobacillales Streptococcaceae Streptococcus513646 Firmicutes Bacilli Lactobacillales Streptococcaceae Streptococcus526804 Firmicutes Bacilli Lactobacillales Streptococcaceae Streptococcus536866 Firmicutes Bacilli Lactobacillales Streptococcaceae Streptococcus584109 Firmicutes Bacilli Lactobacillales Streptococcaceae Streptococcus864465 Firmicutes Bacilli Lactobacillales Streptococcaceae Streptococcus1000547 Firmicutes Bacilli Lactobacillales Streptococcaceae Streptococcus2953981 Firmicutes Bacilli Lactobacillales Streptococcaceae Streptococcus3384047 Firmicutes Bacilli Lactobacillales Streptococcaceae Streptococcus4306048 Firmicutes Bacilli Lactobacillales Streptococcaceae Streptococcus4307484 Firmicutes Bacilli Lactobacillales Streptococcaceae Streptococcus4309301 Firmicutes Bacilli Lactobacillales Streptococcaceae Streptococcus4424239 Firmicutes Bacilli Lactobacillales Streptococcaceae Streptococcus4425214 Firmicutes Bacilli Lactobacillales Streptococcaceae Streptococcus4439603 Firmicutes Bacilli Lactobacillales Streptococcaceae Streptococcus4442130 Firmicutes Bacilli Lactobacillales Streptococcaceae Streptococcus4455767 Firmicutes Bacilli Lactobacillales Streptococcaceae StreptococcusNROTU326 Firmicutes Bacilli Lactobacillales Streptococcaceae Streptococcus271159 Firmicutes Bacilli Lactobacillales1696853 Firmicutes Bacilli Lactobacillales1061772 Firmicutes Bacilli4316391 Firmicutes Clostridia Clostridiales Veillonellaceae Veillonella dispar4318671 Firmicutes Clostridia Clostridiales Veillonellaceae Veillonella dispar4410401 Firmicutes Clostridia Clostridiales Veillonellaceae Veillonella dispar4453501 Firmicutes Clostridia Clostridiales Veillonellaceae Veillonella dispar4458959 Firmicutes Clostridia Clostridiales Veillonellaceae Veillonella parvula4318122 Proteobacteria Gammaproteobacteria Pasteurellales Pasteurellaceae Actinobacillus porcinus70728 Proteobacteria Gammaproteobacteria Pasteurellales Pasteurellaceae Aggregatibacter pneumotropica4477696 Proteobacteria Gammaproteobacteria Pasteurellales Pasteurellaceae HaemophilusNROTU97 Tenericutes Mollicutes Mycoplasmatales Mycoplasmataceae MycoplasmaaID identifier NR new reference
Influenza A Viruses and the Mallard Microbiome
JanuaryFebruary 2017 Volume 2 Issue 1 e00188-16 msystemsasmorg 7
on March 5 2020 by guest
httpmsystem
sasmorg
Dow
nloaded from
The most abundant bacterial phyla reported in the cloacal microbiota of the barnswallow (Hirundo rustica) a passerine bird were Actinobacteria Firmicutes Proteobac-teria Bacteroidetes and Tenericutes (32) Several genera frequently found in our samples(eg Rothia Streptococcus Corynebacterium Enterococcus Streptococcus and Staphylo-coccus) were detected in barn swallows as well
All of the mallards sampled in this study were apparently healthy at the time thatthey were sampled and a number of studies have shown that infection with low-pathogenicity IAVs does not cause gross or microscopic lesions in the gastrointestinaltract of waterfowl (4 5 6 33) Thus we assume that the microbiome effects were causedby the IAV and were not due to lower fitness in infected birds All mallards were in theirhatch year (likely 6 months of age) and were sampled on their breeding grounds prior tomigration Thus our findings almost certainly reflect their first exposure to the particularvirus strain isolated from their feces and may reflect their first exposure to any IAV In anexperimental infection study of IAV in mallards Jourdain et al (5) found that most viralshedding occurs during the first 7 days of infection Despite the apparent lack of clinicaldisease or detectable pathology some authors have suggested that infection may causereduced fitness perhaps due to IAV-induced decreases in nutrient uptake For exampleLatorre-Margalef et al (17) found that body mass was significantly lower in free-ranginginfected mallards than in uninfected mallards however prior infection status did not affectthe speed or distance of subsequent migration Importantly we found that IAV mallardsexhibited large differences in the composition of their cloacal microbiome suggesting thatIAV infection and associated changes in the host microbiome may have effects on thenormal function of the gastrointestinal tract and perhaps of other organ systems andphysiological responses (ie immune system responses) as well (4 62 63 64)Although our study focused on a single species and a single anatomic location ourresults indicate that future studies of host-IAV interactions may be incomplete if theydo not include members of the microbiome as key players in the progress and outcomeof infection
Whether the observed differences in bacterial community composition associ-ated with IAV infection in mallards represent a transient change in the cloacalmicrobiome is unknown Although we assume that our IAV and IAV mallards hadsimilar microbiomes prior to IAV infection additional studies are needed to follow themicrobiome composition before during and after infection If IAV infection caused ourobserved differences in microbiome composition an interesting future direction wouldbe to verify that cloacal diversity returns to preinfection (IAV) levels after recoveryAlternatively mallards with more-diverse cloacal bacterial communities may be lesssusceptible to infection by IAVs and the observed differences in bacterial communitystructure may instead reflect variations in the host susceptibility to infection ratherthan being a consequence of infection Furthermore if reduced diversity in the
FIG 4 The number and abundance of the overlapping 41 OTUs in juvenile mallards
Ganz et al
JanuaryFebruary 2017 Volume 2 Issue 1 e00188-16 msystemsasmorg 8
on March 5 2020 by guest
httpmsystem
sasmorg
Dow
nloaded from
cloacal microbiome persists following infection mallards exposed to IAVs may bemore vulnerable to opportunistic infections However no studies have suggested thatprior exposure reflected by the presence of anti-IAV antibodies is associated withdecreased fitness or enhanced susceptibility to opportunistic infections
More-diverse ecological communities are often more stable in response to pertur-bations because decreases in the abundances of some species are counterbalanced byincreases in the abundances of others (34) Studies of macroorganisms (see egreferences 35 and 36) have found that greater species diversity is correlated withgreater surface cover which may help prevent the establishment of invasive speciesInteractions between taxa may occur on surfaces in animal microbiomes and in somecases low diversity may make hosts vulnerable to invasion Still it is important torecognize that diversity is not a panacea and that the consequences of diversity depend oncomplex interactions between host susceptibility and traits associated with invading spe-cies (37) In the human microbiome diseases that incite a strong inflammatory response areknown to cause changes (both decreases and increases) in bacterial OTU richness anddiversity (reviewed in reference 38) For example bacterial diversity in the lung is increasedin patients with cystic fibrosis (39) and in patients with bacterial vaginosis (40) Highmicrobial diversity is expected to occur in a healthy gut microbiome and in patients withCrohnrsquos disease (41) and patients with inflammatory bowel disease tend to have reducedbacterial diversity in their gastrointestinal tracts (42) However it is unclear whether reduceddiversity is a symptom or a cause of these conditions
In this study we used network modeling to identify a set of highly diagnostic cooccur-ring OTUs that would not have been detected by standard diversity analysis or differential-abundance-based statistics Difference networks for the two IAV conditions revealed thatD was a denser network which was consistent with the observation that the IAV
mallards had greater OTU diversity richness and evenness Combining all three approachesrevealed that a relatively small number of OTUs were significantly different across both theabundance and presenceabsence patterns and that these OTUs contributed to differencesassociated with infection status including infections by representatives of Streptococcusspp Veillonella dispar Rothia mucilaginosa and Prevotella among others
Nearly all OTUs identified as contributing significantly to the observed differenceswere enriched in uninfected individuals The only exception was a single OTU in thefamily Micrococcaceae (phylum Actinobacteria) that was enriched in IAV mallards (newreference OTU 462) In contrast enrichment of specific bacterial taxa is associated withvarious medical conditions in humans and other animals For example enrichment byStreptococcus spp was detected in human patients with irritable bowel disease (IBD)(reviewed in reference 43) and in chickens infected with pathogenic Campylobacterjejuni (44)
For an OTU to show up as significant in the G-test the DIROM and networkclusters it would need to be differentially enriched differentially occurring andhighly cooccurring with other OTUs OTUs identified as significant by all three methodsdid not fully overlap (Fig 5a) This is because these methods detect different contri-butions of variance to the data The network analysis identifies clusters based on thefrequency of OTU cooccurrence within group whereas the G-test and DIROM identifyOTUs based on differential levels of enrichment between groups Enrichment level andcooccurrence may be independent effects of IAV infection in which case we would notexpect to see a full overlap of the two analyses However both enrichment andcooccurrence contribute to intersample variance thus it was not unexpected for theOTUs identified by G-test and OTUs from the network analysis to overlap the highlyvariant OTUs without overlapping each other However the overlapping 41 OTUs wereidentified as significant in the three different approaches (Fig 5 and Table 1) Theintersection of the three methods contained OTU representatives of StreptococcusRothia mucilaginosa Veillonella dispar Prevotella Haemophilus and Mycoplasma and anunidentified OTU from the Lactobacillales order These OTUs were assigned to thesetaxonomic classifications in QIIME and these assignments were verified using BLASTInterestingly Streptococcus Haemophilus and Veillonella form consortia in the human
Influenza A Viruses and the Mallard Microbiome
JanuaryFebruary 2017 Volume 2 Issue 1 e00188-16 msystemsasmorg 9
on March 5 2020 by guest
httpmsystem
sasmorg
Dow
nloaded from
oral microbiome and Rothia and Prevotella are common members as well (45) It wouldbe interesting to investigate whether these taxa facilitate transmission of avian influ-enza virus to humans
In conclusion our methods revealed large differences in the compositions of thebacterial cloacal microbiomes of juvenile free-ranging mallards associated with IAVFurthermore we identified a set of significantly enriched differentially occurring andhighly cooccurring OTUs that may be potential biomarker candidates for predictinginfection status Intersection of our analysis methods identified a concise subset ofOTUs that best described the effect of IAV in mallards This subset of OTUs providesspecific targets for more-detailed studies addressing functional validation of in-depthinteractions between individual taxa and IAVs Experimental studies with appropriate
FIG 5 (a) Venn diagram showing the degree of overlap of the following different approaches G-test for significant differences between groups (with Bonferronicorrections for false-discovery rate) DIROM and unique network clusters Unique networks consist of the set of OTUs that were obtained by clustering in D
or D but not in both (b) Induced subnetwork of IAV and IAV for the overlapping 41 OTUs Both subnetworks are shown as roughly complete graphs (iethere exists an edge within every pair of OTUs) however the edge weights in IAV are all of high value (average weighted degree of 254) and thus form arobust cluster showing strong cooccurrence patterns among the nodes whereas in IAV edge weights among 41 overlapping OTUs were on average very low(average weighted degree of 17)
Ganz et al
JanuaryFebruary 2017 Volume 2 Issue 1 e00188-16 msystemsasmorg 10
on March 5 2020 by guest
httpmsystem
sasmorg
Dow
nloaded from
infected and noninfected controls sampled before during and after infection areneeded to confirm our findings and demonstrate causal relationships Those studiesshould be performed with different IAV subtypes to explore the observed significanteffect that different surface glycoproteins (HA and NA) have on bacterial diversityFinally such studies are also essential for assessing the relevance and ubiquity of ourputative biomarker OTUs
MATERIALS AND METHODSField collection and influenza testing Cloacal swabs were collected from 122 mallards for influenza
testing and microbiome analysis In the field swabs were placed in separate vials containing 2 ml ofice-cold virus transport medium (VTM medium 199 with Earlersquos salts L-glutamine and sodium bicar-bonate plus 2 mUliter penicillin G 200 mgliter streptomycin 2 mUliter polymyxin B 250 mglitergentamicin 05 mUliter nystatin 60 mgliter ofloxacin 200 mgliter sulfamethoxazole and 05 bovineserum albumin V) The samples were transported on ice to the laboratory where they were stored at80degC Samples underwent one or more freezethaw cycles as aliquots were removed for influenzatesting prior to microbiome analysis
Samples were screened for the influenza matrix gene by reverse transcription-PCR (RT-PCR) viruseswere isolated from matrix-positive samples by egg inoculation and full-genome sequences weregenerated as described in reference 65 Known negative samples did not yield virus on egg inoculationand were matrix RT-PCR negative We focused on juvenile mallards in this study in order to minimizedifferences that might arise in the composition of the microbiome in different age classes More detailon these samples is included in Table S4 in the supplemental material)
DNA extraction DNA was extracted from cloacal swabs using a PowerSoil 96-well soil DNA isolationkit (MoBio Carlsbad CA) Samples in 96-well plates were incubated at 65degC for 10 min after addition ofC1 solution Each 96-well plate was then subjected to vortex mixing for 3-min using a plate shaker onthe high setting (2600 rpm) and then the standard kit protocol was followed After elution DNA wasquantified using Qubit fluorometic quantitation (Invitrogen South San Francisco CA)
Nested PCR to amplify and sequence the 16S rRNA gene DNA was characterized for bacterialdiversity based on the V4 region of 16S rRNA gene following the methods of Caporaso et al (46) Whenpossible 10 to 50 l of template DNA was used for PCR However due to low DNA concentrations forsome samples bacterial DNA was amplified by a two-step PCR enrichment using primers 27F-YM3 and1492R to target V1 to V4 of the 16S rRNA gene (47) The 7-fold-degenerate primer 27f-YM3 is composedof four parts 27f-YM (AGAGTTTGATYMTGGCTCAG) plus one part each of primers specific for theamplification of Bifidobacteriaceae Borrelia and Chlamydiales sequences (47) For the second PCR theprimers used were the bacterialarchaeal primers 515F806R (46) modified by addition of an Illuminaadaptor and an in-house barcode system (described in reference 48) After amplification magnetic beads(Agencourt AMPure XP Beckman Coulter Inc Indianapolis IN) were used to clean the PCRs Ampliconswere quantified and characterized using Qubit fluorometic quantitation quantitative PCR (qPCR) and aBioanalyzer (Agilent Technologies Santa Clara CA) prior to sequencing Libraries were sequenced usingan Illumina MiSeq system generating 250-bp paired-end amplicon reads The amplicon data weremultiplexed using dual-barcode combinations for each sample
Data analysis We used a custom script (available in a GitHub repository httpsgithubcomgjospinscriptsblobmasterDemul_trim_preppl) to assign each pair of reads to their respective sampleswhen parsing the raw data This script allows for a 1-bp difference per barcode The paired readswere then aligned and a consensus was computed using FLASH (49) with a maximum overlap of 120and a minimum overlap of 70 (other parameters were left as the default) The custom scriptautomatically demultiplexes the data into fastq files executes FLASH and parses its results to reformatthe sequences with appropriate naming conventions for Quantitative Insights in Microbial Ecology(QIIME v191 46) in fasta format Each sample was characterized for taxonomic composition (numberand abundance) using QIIME For presenceabsence analyses representative operational taxonomic units(OTUs) were clustered at the 97 identity level and an OTU table was constructed using QIIMErsquospick_otus_through_otu_tablepy script Samples in the OTU table were rarefied to 5000 reads persample After rarefaction the total number of samples was 115 individuals 71 mallards were IAV positiveand 44 were IAV negative (Table S4)
We compared alpha diversity (mean species diversity per habitat) using the Shannon index asimplemented in the vegan library (50) in R (51) We compared levels of OTU richness (numbers of OTUsfound in each sample) and Pieloursquos evenness (calculated by dividing the value for the Shannon index fordiversity by the log of the value for OTU richness) We tested for statistical significance in alpha diversitymeasures using the Welch two-sample t test in R We compared levels of beta diversity (the ratio betweenregional species diversity and local species diversity) using Bray-Curtis dissimilarity and we usedprincipal-coordinate analysis (PCoA) for ordination and clustering We then used Adonis a multivariateANOVA based on dissimilarities to test for significant categorical differences with 1000 permutations inthe picante library (52) in R
Identification of significant OTUs To identify the OTUs most responsible for the differentiationbetween IAV and IAV birds we employed several strategies The first and simplest method involvedsimply computing the difference in the relative occurrence metric (DIROM) results for each OTU in theIAV and IAV groups For example if an OTU was found in 40 of the 44 (091) IAV birds and 7 of the71 (009) IAV birds then that OTU had a DIROM value of 082 (the absolute difference between 091 and009) We then sorted the OTUs in descending DIROM order causing the most differentially occurring
Influenza A Viruses and the Mallard Microbiome
JanuaryFebruary 2017 Volume 2 Issue 1 e00188-16 msystemsasmorg 11
on March 5 2020 by guest
httpmsystem
sasmorg
Dow
nloaded from
OTUs to be highest on the list Next we used the G-test to identify differences in OTU abundancebetween the different sample groups using the group_significancepy script in QIIME and the Bonferronimethod to correct for multiple comparisons We used Venny 21 (53) to examine the intersection of theresults from the methods described above with the results of the network analysis described belowFinally we used the Random Forest classifier (available in Pythonrsquos scikit-learn package 29) with 3-foldcross-validation to learn the linear and nonlinear relationships among the features (here relative OTUabundances) in order to find the set of the OTUs that are the most predictive of infection status
Building the IAV networks To identify OTUs that cooccur within an infection group (namely IAV
or IAV) we used network analysis Recent studies have shown that network inference techniques areuseful for deciphering microbial relationships from cooccurrence patterns (18 54 55) Here we built anetwork of the OTUs based on the presenceabsence patterns across all samples The goal was to see ifthere are clusters of OTUs that are more likely to cooccur in (only) one of the infection groups Wecompared every pair of OTUs in one group to the same pair of OTUs in the other infection groupdetermining the cooccurrence patterns between them If the cooccurrence patterns of a pair of OTUsdiffered by only a little between the infection groups we ignored that pair of OTUs Alternatively if thepatterns were very different we studied that pair in more detail We assumed that clusters of OTUs highlycooccurring in one group but not the other were infection dependent We discuss the details of how weobtained these clusters below
After identifying clustering of IAV and IAV mallards using ordination methods and ANOVA weperformed network analysis of the two groups as follows First we filtered the OTU table to remove taxapresent in fewer than two individuals per IAV condition Next we binarized the OTU abundance matrixfor presenceabsence of OTUs We define each sample as a binary presenceabsence vector of OTUs xjXwhere j (sample1 sampleN) Each vector value was multiplied by its transpose to obtain cooccur-rence between all pairs of OTUs and then the results were averaged across samples for each IAVcondition to obtain the cooccurrence score for all pairs of OTUs as follows
G
j1
N
XjXjT
N
We explored the cooccurrence patterns in each group by building a network of OTUs where eachOTU represented a node in the network and where there existed an edge between every two nodes Theelements of G are the scores for determining edge weights between two corresponding OTUs In thisstudy we focused only on the positive cooccurrence patterns since only the positive patterns have thetransitive property We then visualized the networks of infected and uninfected groups in Fig 2 usingGephi (56)
Building the difference networks We then analyzed bacterial communities in IAV and IAV
mallards by building separate difference networks (for each condition) based on the original networks(Fig 2) Difference networks were calculated as the difference of edge weights between the two groupsLet us assume that we have OTUi and OTUj with an edge between them with weight WIAV in the IAV
group The same pair of OTUs namely (OTUiOTUj) also occurs in the IAV group with weight WIAV Webuilt two difference networks D and D and added OTUi and OTUj to the difference networks as nodesIf WIAV minus WIAV was positive and higher than a threshold value (02 was arbitrarily chosenthroughout this study) this indicated that (OTUiOTUj) had a strong cooccurrence pattern in the IAV
group We then added an edge between the terms (OTUiOTUj) with weight WIAV to the differencenetwork D Similarly if WIAV minus WIAV was higher than we added an edge between the terms(OTUiOTUj) with weight WIAV to D
We denote a weighted graph G by G (V E) in which V is the set of vertices (nodes) and E isthe set of edges between the vertices that connects them (|V| n) with the weight function W E iexcl[0 1] Graph G should be undirected and irreflexive We define our networks as the set of verticesV (OTU0OTU1 OTUi OTUj OTUn) The network of the infected mallards (IAV) is defined asfollows
G V E and for simplicity we call WEOTUiOTUj Wij
The network of the uninfected mallards (IAV) is defined as follows
G V E and for simplicity we call WEOTUiOTUj Wij
We can now define our difference networks (GD and GD) The network of the D mallards is definedas follows
GD V EDWED
OTUiOTUj Wij|Wij Wij and forall OTUi OTUj where OTUi V and OTUj V and i jAnd the network of the D mallards is defined as follows
GD V EDWED
OTUiOTUj Wij|Wij Wij and forall OTUi OTUj where OTUi V and OTUj V and i jOnce the difference networks D and D were constructed we applied a threshold of 05 to remove
the edges with low edge weights (Fig 2) Then we extracted the clusters (ie the groups of nodes thatwere more densely connected to each other than to the rest of the network) (26) We filtered out theclusters that were of size 3 or less (including singletons) The resulting clusters in the D and D networkscontained 27 OTUs and 80 OTUs respectively We then examined which of the OTUs identified through
Ganz et al
JanuaryFebruary 2017 Volume 2 Issue 1 e00188-16 msystemsasmorg 12
on March 5 2020 by guest
httpmsystem
sasmorg
Dow
nloaded from
the network analysis contributed the most to the differences between the IAV and IAV groupsNetwork analyses were performed in Python using the NetworkX package and Gephi (56 57) The effectof removal of OTUs identified as significant by all the methods described above on PCoA clusters wasdetermined (see Text S1 and Fig S1 and S2 in the supplemental material)
Accession number(s) The sequence data reported in this study have been submitted to the NCBISRA database under BioProject accession number PRJNA358103
SUPPLEMENTAL MATERIALSupplemental material for this article may be found at httpsdoiorg101128
mSystems00188-16FIG S1 PDF file 04 MBTABLE S1 DOCX file 01 MBTABLE S2 DOCX file 01 MBTABLE S3 DOCX file 01 MBTABLE S4 DOCX file 003 MBTEXT S1 DOCX file 01 MBFIG S2 PDF file 03 MB
ACKNOWLEDGMENTSWe thank Magdalena Plancarte and Winston Vickers for their contributions to the
influenza study and Matt Rolston for sample preparation for the bacterial microbiomecharacterization We also thank the United States Geological Survey the CaliforniaWaterfowl Association and the California Department of Fish and Wildlife Grizzly IslandWildlife Area for their cooperation and assistance in sample collection from mallards
This study was supported in part by funding from NIH (CEIRSmdashHHSN272201400008Cand HHSN266200700010C) (WMB) and by a grant to JAE from the Alfred P SloanFoundation as part of their ldquoMicrobiology of the Built Environmentrdquo program SMHwas funded through The UC Davis Chancellorrsquos Postdoctoral Fellowship and AJF wasfunded through the UC Davis College of Biological Sciences New Biology PostdoctoralFellowship
REFERENCES1 Taubenberger JK Morens DM 2008 The pathology of influenza virus
infections Annu Rev Pathol 3499 ndash522 httpsdoiorg101146annurevpathmechdis3121806154316
2 Gorman OT Bean WJ Webster RG 1992 Evolutionary processes ininfluenza viruses divergence rapid evolution and stasis p 75ndash97 InGenetic diversity of RNA viruses Springer New York NY
3 Medina RA Garciacutea-Sastre A 2011 Influenza A viruses new researchdevelopments Nat Rev Microbiol 9590 ndash 603 httpsdoiorg101038nrmicro2613
4 Runstadler J Hill N Hussein IT Puryear W Keogh M 2013 Connecting thestudy of wild influenza with the potential for pandemic disease InfectGenet Evol 17162ndash187 httpsdoiorg101016jmeegid201302020
5 Jourdain E Gunnarsson G Wahlgren J Latorre-Margalef N Broumljer CSahlin S Svensson L Waldenstroumlm J Lundkvist A Olsen B 2010 Influ-enza virus in a natural host the mallard experimental infection dataPLoS One 5e8935 httpsdoiorg101371journalpone0008935
6 Webster RG Bean WJ Gorman OT Chambers TM Kawaoka Y 1992Evolution and ecology of influenza A viruses Microbiol Rev 56152ndash179
7 Whipps J Lewis K Cooke R 1988 Mycoparasitism and plant diseasecontrol p 161ndash187 In Fungi in biological control systems ManchesterUniversity Press Manchester United Kingdom
8 Morgan XC Huttenhower C 2012 Human microbiome analysis PLoSComput Biol 8e1002808 httpsdoiorg101371journalpcbi1002808
9 Mutlu EA Keshavarzian A Losurdo J Swanson G Siewe B Forsyth CFrench A DeMarais P Sun Y Koenig L Cox S Engen P Chakradeo PAbbasi R Gorenz A Burns C Landay A 2014 A compositional look at thehuman gastrointestinal microbiome and immune activation parametersin HIV infected subjects PLoS Pathog 10e1003829 httpsdoiorg101371journalppat1003829
10 Berkhout B 2015 With a little help from my enteric microbial friendsFront Med 230 httpsdoiorg103389fmed201500030
11 Abt MC Osborne LC Monticelli LA Doering TA Alenghat T SonnenbergGF Paley MA Antenus M Williams KL Erikson J Wherry EJ Artis D 2012
Commensal bacteria calibrate the activation threshold of innate antiviralimmunity Immunity 37158 ndash170 httpsdoiorg101016jimmuni201204011
12 Fujimura KE Demoor T Rauch M Faruqi AA Jang S Johnson CCBoushey HA Zoratti E Ownby D Lukacs NW Lynch SV 2014 House dustexposure mediates gut microbiome lactobacillus enrichment and airwayimmune defense against allergens and virus infection Proc Natl Acad SciU S A 111805ndash 810 httpsdoiorg101073pnas1310750111
13 Turner JR 2009 Intestinal mucosal barrier function in health and dis-ease Nat Rev Immunol 9799 ndash 809 httpsdoiorg101038nri2653
14 Alemka A Corcionivoschi N Bourke B 2012 Defense and adaptationthe complex inter-relationship between Campylobacter jejuni and mu-cus Front Cell Infect Microbiol 215 httpsdoiorg103389fcimb201200015
15 Linden SK Sutton P Karlsson NG Korolik V McGuckin MA 2008 Mucinsin the mucosal barrier to infection Mucosal Immunol 1183ndash197 httpsdoiorg101038mi20085
16 Jones MK Watanabe M Zhu S Graves CL Keyes LR Grau KR Gonzalez-Hernandez MB Iovine NM Wobus CE Vinjeacute J Tibbetts SA Wallet SM Karst SM2014 Enteric bacteria promote human and mouse norovirus infection of Bcells Science 346755ndash759 httpsdoiorg101126science1257147
17 Latorre-Margalef N Gunnarsson G Munster VJ Fouchier RA OsterhausAD Elmberg J Olsen B Wallensten A Haemig PD Fransson T Brudin LWaldenstroumlm J 2009 Effects of influenza A virus infection on migratingmallard ducks Proc R Soc Lond B Biol Sci 2761029 ndash1036 httpsdoiorg101098rspb20081501
18 Barberaacuten A Bates ST Casamayor EO Fierer N 2012 Using networkanalysis to explore co-occurrence patterns in soil microbial communitiesISME J 6343ndash351 httpsdoiorg101038ismej2011119
19 Ito T Suzuki Y Suzuki T Takada A Horimoto T Wells K Kida H Otsuki KKiso M Ishida H Kawaoka Y 2000 Recognition of N-glycolylneuraminicacid linked to galactose by the 23 linkage is associated with intestinal
Influenza A Viruses and the Mallard Microbiome
JanuaryFebruary 2017 Volume 2 Issue 1 e00188-16 msystemsasmorg 13
on March 5 2020 by guest
httpmsystem
sasmorg
Dow
nloaded from
replication of influenza A virus in ducks J Virol 749300 ndash9305 httpsdoiorg101128JVI74199300-93052000
20 Ichinohe T Pang IK Kumamoto Y Peaper DR Ho JH Murray TS IwasakiA 2011 Microbiota regulates immune defense against respiratory tractinfluenza A virus infection Proc Natl Acad Sci USA 1085354 ndash5359httpsdoiorg101073pnas1019378108
21 Nishikawa T Shimizu K Tanaka T Kuroda K Takayama T Yamamoto THanada N Hamada Y 2012 Bacterial neuraminidase rescues influenzavirus replication from inhibition by a neuraminidase inhibitor PLoS One7e45371 httpsdoiorg101371journalpone0045371
22 Chaban B Albert A Links MG Gardy J Tang P Hill JE 2013 Character-ization of the upper respiratory tract microbiomes of patients withpandemic H1N1 influenza PLoS One 8e69559 httpsdoiorg101371journalpone0069559
23 Leung RK Zhou JW Guan W Li SK Yang ZF Tsui SK 2013 Modulationof potential respiratory pathogens by pH1N1 viral infection Clin Micro-biol Infect 19930 ndash935 httpsdoiorg1011111469-069112054
24 Lambert N Salk H Kennedy R Chia N Grill D Jacobson R Poland G2014 Intranasal vaccination with live attenuated influenza vaccine in-creases diversity of the human nasal microbiome (VAC8P 1001) JImmunol 1921427
25 Oh Y Yang S-WJ Ngan DA Hirota JA Niikura M Tam S Knight DAHackett T-L Dorscheid D Man S 2015 The bacterial microbiome ofgut lung and blood after H1N1 influenza virus infection in micewith and without house dust mite exposure p A1315ndashA1315 In A32Microbial Interactions And Host Defense American Thoracic SocietyNew York NY
26 Blondel VD Guillaume J-L Lambiotte R Lefebvre E 2008 Fast unfoldingof communities in large networks J Stat Mech 2008P10008 httpsdoiorg1010881742-5468200810P10008
27 Biemann C 2006 Chinese whispers an efficient graph clustering algo-rithm and its application to natural language processing problems p73ndash 80 In Proceedings of the First Workshop on Graph Based Methodsfor Natural Language Processing Association for Computational Linguis-tics Stroudsburg PA
28 van Dongen S 2000 Graph clustering by flow simulation PhD thesisUniversity of Utrecht Utrecht Holland
29 Pedregosa F Varoquaux G Gramfort A Michel V Thirion B Grisel OBlondel M Prettenhofer P Weiss R Dubourg V 2011 Scikit-learn ma-chine learning in Python J Mach Learn Res 122825ndash2830
30 Toennessen R Germundsson A Jonassen CM Haugen I Berg K BarrettRT Rimstad E 2011 Virological and serological surveillance for type Ainfluenza in the black-legged kittiwake (Rissa tridactyla) Virol J 821httpsdoiorg1011861743-422X-8-21
31 van Dongen WF White J Brandl HB Moodley Y Merkling T Leclaire SBlanchard P Danchin E Hatch SA Wagner RH 2013 Age-related differ-ences in the cloacal microbiota of a wild bird species BMC Ecol 1311httpsdoiorg1011861472-6785-13-11
32 Kreisinger J Ciacutežkovaacute D Kropaacuteckovaacute L Albrecht T 2015 Cloacal micro-biome structure in a long-distance migratory bird assessed using deep16sRNA pyrosequencing PLoS One 10e0137401 httpsdoiorg101371journalpone0137401
33 Kuiken T 2013 Is low pathogenic avian influenza virus virulent for wildwaterbirds Proc R Soc Lond B Biol Sci 28020130990 httpsdoiorg101098rspb20130990
34 Ives AR Carpenter SR 2007 Stability and diversity of ecosystems Sci-ence 31758 ndash 62 httpsdoiorg101126science1133258
35 Dukes JS 2001 Biodiversity and invasibility in grassland microcosmsOecologia 126563ndash568 httpsdoiorg101007s004420000549
36 Stachowicz JJ Fried H Osman RW Whitlatch RB 2002 Biodiversityinvasion resistance and marine ecosystem function reconciling patternand process Ecology 832575ndash2590 httpsdoiorg1018900012-9658(2002)083[2575BIRAME]20CO2
37 Ganz HH Ebert D 2010 Benefits of host genetic diversity for resistanceto infection depend on parasite diversity Ecology 911263ndash1268 httpsdoiorg10189009-12431
38 Fierer N Ferrenberg S Flores GE Gonzaacutelez A Kueneman J Legg T LynchRC McDonald D Mihaljevic JR OrsquoNeill SP Rhodes ME Song SJ WaltersWA 2012 From animalcules to an ecosystem application of ecologicalconcepts to the human microbiome Annu Rev Ecol Evol Syst 43137ndash155 httpsdoiorg101146annurev-ecolsys-110411-160307
39 Harrison F 2007 Microbial ecology of the cystic fibrosis lung Microbi-ology 153917ndash923 httpsdoiorg101099mic02006004077-0
40 Lamont RF Sobel JD Akins RA Hassan SS Chaiworapongsa T Ku-
sanovic JP Romero R 2011 The vaginal microbiome new informa-tion about genital tract flora using molecular based techniques BJOGInt J Obstet Gynaecol 118533ndash549 httpsdoiorg101111j1471-0528201002840x
41 Manichanh C Rigottier-Gois L Bonnaud E Gloux K Pelletier E FrangeulL Nalin R Jarrin C Chardon P Marteau P Roca J Dore J 2006 Reduceddiversity of faecal microbiota in Crohnrsquos disease revealed by a metag-enomic approach Gut 55205ndash211 httpsdoiorg101136gut2005073817
42 Frank DN St Amand AL Feldman RA Boedeker EC Harpaz N Pace NR2007 Molecular-phylogenetic characterization of microbial communityimbalances in human inflammatory bowel diseases Proc Natl Acad SciU S A 10413780 ndash13785 httpsdoiorg101073pnas0706625104
43 Bennet SM Ohman L Simreacuten M 2015 Gut microbiota as potentialorchestrators of irritable bowel syndrome Gut Liver 9318 ndash331 httpsdoiorg105009gnl14344
44 Indikova I Humphrey TJ Hilbert F 2015 Survival with a helping handcampylobacter and microbiota Front Microbiol 61266 httpsdoiorg103389fmicb201501266
45 Mark Welch JL Rossetti BJ Rieken CW Dewhirst FE Borisy GG 2016Biogeography of a human oral microbiome at the micron scale ProcNatl Acad Sci U S A 113E791ndashE800 httpsdoiorg101073pnas1522149113
46 Caporaso JG Kuczynski J Stombaugh J Bittinger K Bushman FDCostello EK Fierer N Pentildea AG Goodrich JK Gordon JI Huttley GA KelleyST Knights D Koenig JE Ley RE Lozupone CA McDonald D MueggeBD Pirrung M Reeder J Sevinsky JR Turnbaugh PJ Walters WA Wid-mann J Yatsunenko T Zaneveld J Knight R 2010 QIIME allows analysisof high-throughput community sequencing data Nat Methods7335ndash336 httpsdoiorg101038nmethf303
47 Frank JA Reich CI Sharma S Weisbaum JS Wilson BA Olsen GJ 2008Critical evaluation of two primers commonly used for amplification ofbacterial 16S rRNA genes Appl Environ Microbiol 742461ndash2470 httpsdoiorg101128AEM02272-07
48 Lang JM Eisen JA Zivkovic AM 2014 The microbes we eat abundanceand taxonomy of microbes consumed in a dayrsquos worth of meals for threediet types PeerJ 2e659 httpsdoiorg107717peerj659
49 Magoc T Salzberg SL 2011 FLASH fast length adjustment of short readsto improve genome assemblies Bioinformatics 272957ndash2963 httpsdoiorg101093bioinformaticsbtr507
50 Oksanen J Blanchet FG Kindt R Legendre P Minchin PR OrsquoHara RBSimpson GL Solymos P Stevens MHH Wagner H 2016 vegan commu-nity ecology package R package version 23-5 httpscranr-projectorgpackagevegan
51 Team RC 2016 R a language and environment for statistical computingR Foundation for Statistical Computing Vienna Austria httpswwwr-projectorg
52 Kembel SW Cowan PD Helmus MR Cornwell WK Morlon H Ackerly DDBlomberg SP Webb CO 2010 Picante R tools for integrating phylog-enies and ecology Bioinformatics 261463ndash1464 httpsdoiorg101093bioinformaticsbtq166
53 Oliveros JC 2007ndash2015 Venny An interactive tool for comparing lists withVennrsquos diagrams httpbioinfogpcnbcsicestoolsvennyindexhtml
54 Faust K Lima-Mendez G Lerat JS Sathirapongsasuti JF Knight R Hut-tenhower C Lenaerts T Raes J 2015 Cross-biome comparison of micro-bial association networks Front Microbiol 61200 httpsdoiorg103389fmicb201501200
55 Faust K Sathirapongsasuti JF Izard J Segata N Gevers D Raes J Hutten-hower C 2012 Microbial co-occurrence relationships in the human mi-crobiome PLoS Comput Biol 8e1002606 httpsdoiorg101371journalpcbi1002606
56 Bastian M Heymann S Jacomy M 2009 Gephi an open source softwarefor exploring and manipulating networks p 361ndash362 In Proceedings ofthe Third International Conference on Weblogs and Social Media TheAAAI Press Menlo Park CA
57 Schult DA Swart P 2008 Exploring network structure dynamics andfunction using NetworkX p 11ndash16 In Proceedings of the 7th Python inScience Conferences (SciPy 2008)
58 Boyce WM Sandrock C Kreuder-Johnson C Kelly T Cardona C 2009Avian influenza viruses in wild birds a moving target Comp ImmunolMicrobiol Infect Dis 32275ndash286 httpsdoiorg101016 jcimid200801002
59 Dusek RJ Bortner JB DeLiberto TJ Hoskins J Franson JC Bales BDYparraguirre D Swafford SR Ip HS 2009 Surveillance for high pathoge-
Ganz et al
JanuaryFebruary 2017 Volume 2 Issue 1 e00188-16 msystemsasmorg 14
on March 5 2020 by guest
httpmsystem
sasmorg
Dow
nloaded from
nicity avian influenza virus in wild birds in the Pacific flyway of theUnited States 2006 ndash2007 Avian Dis 53222ndash230 httpsdoiorg1016378462-082908-Reg1
60 Girard YA Runstadler JA Aldehoff F Boyce W 2012 Genetic structure ofPacific flyway avian influenza viruses is shaped by geographic locationhost species and sampling period Virus Genes 44415ndash 428 httpsdoiorg101007s11262-011-0706-5
61 Olson SH Parmley J Soos C Gilbert M Latorre-Margalef N Hall JSHansbro PM Leighton F Munster V Joly D 2014 Sampling strategiesand biodiversity of influenza A subtypes in wild birds PLoS One9e90826 httpsdoiorg101371journalpone0090826
62 Tolf C Latorre-Margalef N Wille M Bengtsson D Gunnarsson G Grosbois
V Hasselquist D Olsen B Elmberg J Waldenstrom J 2013 Individualvariation in influenza A virus infection histories and long-term immuneresponses in mallards PLoS One 8e61201 httpsdoiorg101371journalpone0061201
63 Wilks J Beilinson H Golovkina TV 2013 Dual role of commensal bacteria in viralinfections Immunol Rev 255222ndash229 httpsdoiorg101111imr12097
64 Waite DW Taylor MW 2014 Characterizing the avian gut microbiotamembership driving influences and potential function Front Microbiol5223 httpsdoiorg103389fmicb201400223
65 Lindsay LL Kelly TR Plancarte M Schobel S Lin X Dugan VG WentworthDE Boyce WM 2013 Avian influenza mixed infections and missingviruses Viruses 51964 ndash1977 httpsdoiorg103390v5081964
Influenza A Viruses and the Mallard Microbiome
JanuaryFebruary 2017 Volume 2 Issue 1 e00188-16 msystemsasmorg 15
on March 5 2020 by guest
httpmsystem
sasmorg
Dow
nloaded from
- RESULTS
-
- Infected mallards only
- Network analysis
- Classifying mallards using overlapping OTUs
-
- DISCUSSION
- MATERIALS AND METHODS
-
- Field collection and influenza testing
- DNA extraction
- Nested PCR to amplify and sequence the 16S rRNA gene
- Data analysis
- Identification of significant OTUs
- Building the IAV networks
- Building the difference networks
- Accession number(s)
-
- SUPPLEMENTAL MATERIAL
- ACKNOWLEDGMENTS
- REFERENCES
-
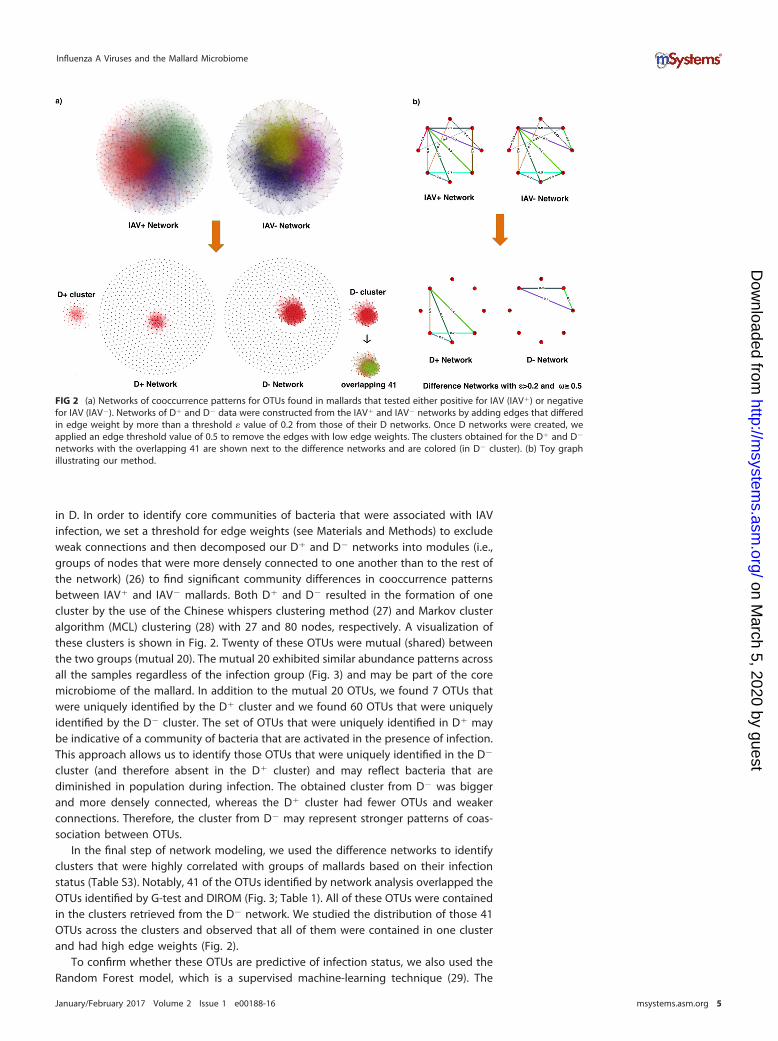
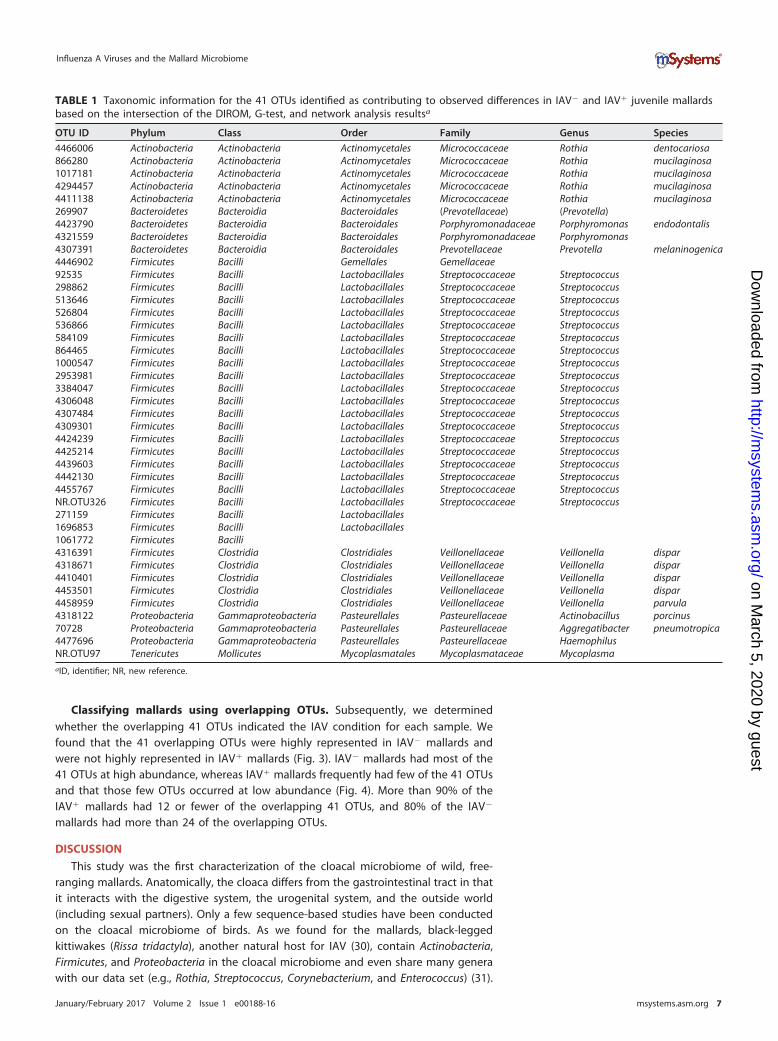