Community Healthorange.floridahealth.gov/programs-and-services/community-health-planning-and... ·...
30
Improvement Plan Community Health 2016-2019 Chronic Conditions and Causes of Death Prevention Built Environment (CHIP) Access to Care Produced by Florida Department of Health in Orange County & CHIP Collaborave Created: March 2017 Revised: March 2018
Transcript of Community Healthorange.floridahealth.gov/programs-and-services/community-health-planning-and... ·...

Improvement Plan
Community Health
2016-2019
Chronic Conditions and Causes of
Death Prevention
Built Environment
(CHIP)
Access to Care
Produced by Florida Department of Health in Orange County
& CHIP Collaborative
Created: March 2017 Revised: March 2018

TABLE OF CONTENTS
ACKNOWLEDGEMENTS ........................................................................................................................................................... 1
HEALTH FOR ALL ORANGE....................................................................................................................................................... 3
INTRODUCTION ....................................................................................................................................................................... 5
PRIORITY 1: CHRONIC DISEASES & CAUSES OF DEATH ........................................................................................................... 7
PRIORITY 1: CHRONIC DISEASES & CAUSES OF DEATH ....................................................................................................... 8
PRIORITY 1: CHRONIC DISEASES & CAUSES OF DEATH ................................................................................................... 9
PRIORITY 2: ACCESS TO CARE ................................................................................................................................................ 10
PRIORITY 2: ACCESS TO CARE ............................................................................................................................................ 11
PRIORITY 2: ACCESS TO CARE ........................................................................................................................................ 12
PRIORITY 3: BUILT ENVIRONMENT ....................................................................................................................................... 13
PRIORITY 3: BUILT ENVIRONMENT ................................................................................................................................... 14
APPENDICES .......................................................................................................................................................................... 17
APPENDIX A: THE MAPP PROCESS .................................................................................................................................... 17
APPENDIX B: KEY MAPP FINDINGS .................................................................................................................................... 18
APPENDIX C: COMMUNITY HEALTH ASSESSMENT (CHA) ................................................................................................. 19
APPENDIX D: LOCAL PUBLIC HEALTH SYSTEM ASSESSMENT ............................................................................................ 22
APPENDIX E: ORANGE COUNTY, FL: COMMUNITY DESCRIPTION ..................................................................................... 24
APPENDIX F: ANNUAL EVALUATION REPORT ................................................................................................................... 26
APPENDIX G: ASSETS & RESOURCES ................................................................................................................................. 27
REFERENCES .......................................................................................................................................................................... 28
1 | P a g e
ACKNOWLEDGEMENTS
The following agencies actively participated in the development of the
Community Health Improvement Plan (CHIP)
American Lung Association Rebecca Desir, MPH Center for Change, Inc. Peggie Burges Center for Disease and Control Ellen Wan, MPH Children’s Home Society of Florida Kevin Egan, Ed.D Shannon Currie, MSL, CPE City of Orlando Mary-Stewart Droege, AICP Commissioner Samuel B. Ings Wesley Shaffer City of Orlando Police Department Joseph Lundy Community Coordinated Care for Children, Inc, (4C) Amy Richter Community Members Katherine Arias Naeecha Silva Early Learning Coalition of Orange County Anna Kinchens Karen Willis, CWDP
East Central Florida Regional Planning Council Fred Milch, AICP Tara McCue, AICP Florida Department of Health in Orange County Angela Weister Arthur Howell, MPH, CCHW Audrey Alexander Ben Klekamp, MSPH, CPH, CIC Daniel M. Avila, SPHR, SHRM-SCP Danielle Rankin Daphne Brewington David Overfield Deborah Collinge Ellis Pérez, MPH Jennifer Jackson Karen Clark Kariely Negron Kevin Sherin, MD, MPH, MBA Lesli Ahonkhai, MA Mirna Chamorro Vicente Araujo Wanda Back William Haubenestel Yolanda Martínez, EdPhD, Ph.D Florida Department of Transportation Deborah Tyrone Judy Pizzo, MSURP
Florida Hospital Anwar Georges-Abeyie Ed Fluker, RRT Leigh Ann Kelly, BS, RN, CIC Tiffany Richens, MS, MPH, CIC Florida State University College of Medicine Alexandra Nowakowski, PhD, MPH Health Communications Consultant Sarah Matthews, MPH Health Council of East Central Florida, Inc Ken Peach, MBA, FACHE Heart of Florida United Way Ray Larsen Healthy Start Coalition of Orange County Elaine Cauthen Linda Sutherland Hunters Creek Nursing & Rehab Tristan Mohadeo, NHA, MBA Interfaith Council of Central Florida James Coffin

2 | P a g e
ACKNOWLEDGMENTS
LYNX Kasia Castro, MNM Myles O’Keefe Metro Plan Orlando Elizabeth Whitton, AICP Gary Huttmann Mt. Sinai Seventh-day Adventist Church Jackie Taylor Mt. Zion Missionary Baptist Church Rev. Dr. Robert Spooney National Association of Chronic Disease Directors Catherine McCann, PhD, MSPH Orange County Drug Free Coalition Carol Burkett Orange County Fire Rescue Dept. Kimberly Buffkin James Bates Orange County Government Elwyn Gonzalez, AICP Marthaly Irizarry Orange County Head Start Brenda Nieves Maria Gonzalez Parie Register
Orange County Jail Lisa Graham Orange County Medical Examiner Marie Hansen, MD Orange County Office of Aging Mimi Reggentin Orange County Public Schools Amanda Bot, RDN, SNS John Zerega, Ed.S Nayda I. Hernandez-Buitrago, RDN, LDN, SHRM-CP Orange County Sheriff Office Pamela McKinley Orlando Health Asim A. Jani, MD Eric Alberts, CEM, CHS V, FPEM, CHEP, FABCHS Lainie Fox-Ackerman, JD Rosana Flores Terry Roberts Primary Care Access Network Inc. Rebecca Sayago
Second Harvest Food Bank of Central Florida Karen Broussard, MSW, LCSW Shepherd’s Hope Gina Johnson Sustainable Synergy Jennifer Waxman-Loyd, MBA True Health Janelle Dunn, MS University of Florida Institute of Food and Agricultural Sciences (UF/IFAS) Extension Gricelle Negron, MA, MPH Jamila Adams Michael Swain University of Central Florida Chait Renduchintala Gordon Hogan Karen Yerkes, ARNP-C, RN-C Lani Steffens Lynette Feder, PhD Mary Schmidt-Owens, PhD Visionary Vanguard Group Lauren Josephs, PhD Winter Park Health Foundation Lisa Portelli

3 | P a g e
HEALTH FOR ALL ORANGE
In an effort to capture a closing remark (from those who participated in the development of the
CHIP), we asked them:
How do you see the implementation of the CHIP benefiting the community?
“The development process for Orange
County’s CHIP enhanced cross-sector
collaboration. Implementation strengthens
the collaborations and supports increased
intergovernmental coordination as we
strive to improve health for every
resident.”
Elizabeth Whitton, AICP
Metro Plan Orlando E
l
i
z
a
b
e
t
h
W
h
i
t
t
o
n
,
A
I
C
P
M
e
t
r
o
P
l
a
n
O
r
“It will provide healthy alternatives in multiple areas of importance to all people.” Judy Pizzo, MSURP
Florida Department of Transportation
“The implementation of the Community Health
Improvement Plan (CHIP) sets the bar for Orange
County to achieve its goals for a healthy, sustainable,
and equitable future. By aligning our public health,
transportation, housing, and healthy food assets
together, we create a cohesive strategy that will
address the health needs of our citizens. From our
diverse backgrounds and expertise, the crafting of the
CHIP will ensure that various aspects of the built
environment are improved and that we are able to
reduce barriers that prevent our brothers and sisters
from obtaining access to healthy foods and safer
modes of travel.”
Elwy Gonzalez, AICP
Orange County Transportation Planning
”Access to healthy food is foundational to the
health of the community. As the single largest
provider of emergency and supplemental food to
low-income people in the community, Second
Harvest is keenly aware of the multiple negative
effects of food insecurity. We believe that public
recognition of food insecurity in the CHIP is a major
step in improving access to healthy foods and
nutrition education for people who are
disproportionately affected by chronic diet-related
disease.”
Karen Broussard, MSW, LCSW
Second Harvest Food Bank

4 | P a g e
“For any community health improvement plan to ‘move
the needle’ by actually favorably impacting reported
health indicators, an ‘all hands on deck’ approach is
required. With the exception of indicators completely
within the control of the health department (i.e. number
of environmental monitoring points), improved
community health requires the work of public health
‘partners’ who contribute to the results. Every
organization that can impact one or more of the CHIP
indicators must now let the health department know
how it will undertake its portion of community health
improvement.”
Ken Peach, MBA, FACH
Health Council of East Central Florida
“One thing I definitely see the CHIP doing is facilitating comprehensive health care that affirms the whole person rather than just specific issues they are experiencing. A lot of the discussions that fed into the development of the CHIP addressed intersecting health experiences shaped by a vast web of contextual factors across multiple domains. This is the perspective we need to embrace as we plan out our approach to community health and wellness in the 21st Century.
Alexandra Nowakowski, PhD, MPH Florida State University College of Medicine
“I see the benefits in that we will be able,
as a group, provide much more
comprehensive and inclusive services. “S
Gricelle Negron, MA, MPH
University of Florida Institute of
Food and Agricultural Sciences
(UF/IFAS) Extension
vices will be more targeted,
efficient and strategic and with less
duplication.
“We hope that the CHP will provide
valuable county level direction on
regional community health priorities
that benefit low income, minority, and
vulnerable populations.”
Anwar Georges-Abeyie
Florida Hospital
HEALTH FOR ALL ORANGE
5 | P a g e
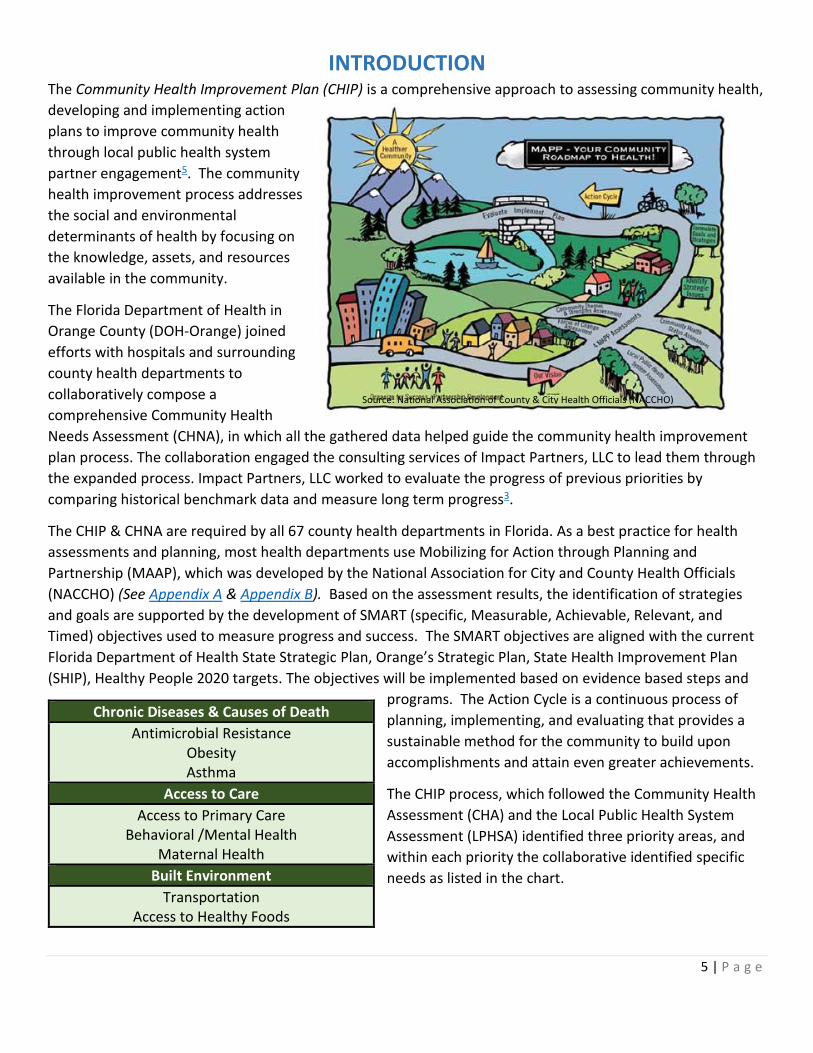
INTRODUCTION The Community Health Improvement Plan (CHIP) is a comprehensive approach to assessing community health,
developing and implementing action
plans to improve community health
through local public health system
partner engagement5. The community
health improvement process addresses
the social and environmental
determinants of health by focusing on
the knowledge, assets, and resources
available in the community.
The Florida Department of Health in
Orange County (DOH-Orange) joined
efforts with hospitals and surrounding
county health departments to
collaboratively compose a
comprehensive Community Health
Needs Assessment (CHNA), in which all the gathered data helped guide the community health improvement
plan process. The collaboration engaged the consulting services of Impact Partners, LLC to lead them through
the expanded process. Impact Partners, LLC worked to evaluate the progress of previous priorities by
comparing historical benchmark data and measure long term progress3.
The CHIP & CHNA are required by all 67 county health departments in Florida. As a best practice for health
assessments and planning, most health departments use Mobilizing for Action through Planning and
Partnership (MAAP), which was developed by the National Association for City and County Health Officials
(NACCHO) (See Appendix A & Appendix B). Based on the assessment results, the identification of strategies
and goals are supported by the development of SMART (specific, Measurable, Achievable, Relevant, and
Timed) objectives used to measure progress and success. The SMART objectives are aligned with the current
Florida Department of Health State Strategic Plan, Orange’s Strategic Plan, State Health Improvement Plan
(SHIP), Healthy People 2020 targets. The objectives will be implemented based on evidence based steps and
programs. The Action Cycle is a continuous process of
planning, implementing, and evaluating that provides a
sustainable method for the community to build upon
accomplishments and attain even greater achievements.
The CHIP process, which followed the Community Health
Assessment (CHA) and the Local Public Health System
Assessment (LPHSA) identified three priority areas, and
within each priority the collaborative identified specific
needs as listed in the chart.
Chronic Diseases & Causes of Death
Antimicrobial Resistance Obesity Asthma
Access to Care
Access to Primary Care Behavioral /Mental Health
Maternal Health
Built Environment
Transportation Access to Healthy Foods
Source: National Association of County & City Health Officials (NACCHO)

6 | P a g e
CHIP PROCESS
Based on the data gathered in the Community Health Needs Assessment (CHNA) (See Appendix C), the County level
collaborative identified 15 focus areas. When the first Community Health Improvement Plan face to face meeting was
held, on November 2nd 2016 at the Florida Department of Health in Orange County, the 15 focus areas were organized
by three themes. Data from each Community Health Needs Assessment (See Appendix C) focus area, along with the
information gathered from the Local Public Health System Assessment (See Appendix D) was presented to all
participants for baseline knowledge. Following the data presentation, community participants were asked to self-select
themselves into one of the themed groups according to their work/organization’s priority area of focus. While in their
workgroup, participants worked together to develop a goals and objectives based on their organizations area of focus.
The group then utilized a multi-voting/consensus building method to prioritize the work they will be contributing to for
the next three years. In the second meeting, on January 10th 2017, participants were invited for another face to face
meeting. The objective of this meeting was to add specific activities from each participating organization. The following
diagram shows the synthesized focus areas:
CHNA IDENTIFIED PRIORITIES
CHIP PRIORITIES
CHIP COLLABORATIVE THEMES/PRIORITIES
Chronic Conditions/Causes of Death - Cancer - Cardiovascular Disease - Cerebrovascular Disease - Diabetes - Respiratory Disease - Unintentional Injuries
Access to Care - Access to Primary Care - Maternal & Child Health - Mental Health - STI/HIV - Substance Abuse (heroin) - The Uninsured
Built Environment - Access to Healthy Foods - Housing Security - Transportation
Chronic Conditions/Causes of Death - Antimicrobial Resistance - Asthma - Obesity
Access to Care - Access to Dental care - Access to Primary care - Behavioral/Mental health - Maternal and Child Health
Built Environment - Access to Healthy Foods - Transportation
- Access to care - Cancer - Diabetes - Disability/injury prevention - Food Security
- Heart Disease - Housing Security - Maternal and Child health - Mental Health - Obesity - Poor Transportation - Senior mobility/falls - STI/HIV - Substance Abuse (heroin) - Uninsured Rates
It takes a coordinated community effort across all sectors to improve the health of Orange County. Implementation
of the action plans will ultimately strengthen the public health infrastructure; enhance the planning, research and
development of community health partnerships, and promote and support the health, well-being and quality of life
of residents; for a brief description of the current state of Orange County, FL please see Appendix E.
Evaluation: To ensure effectiveness, the Health for All Orange Collaborative will work together to implement and
evaluate each action plan activity for success and impact on a periodic basis. CHIP participants will update their
progress, on an evaluation template (See Appendix F), to continually and collaboratively improve the health of the
county.

7 | P a g e
PRIORITY 1: CHRONIC DISEASES & CAUSES OF DEATH
Antibiotics and similar drugs, together called antimicrobial agents, have been used for the last 70 years to
treat patients who have infectious diseases. Since the 1940s, these drugs have greatly reduced illness and
death from infectious diseases. However, these drugs have been used so widely and for so long that the
infectious organisms the antibiotics are designed to kill have adapted to them, making the drugs less
effective1.
The Department of Health in Orange County (DOH-Orange) has participated in a Healthcare Associated
Infections and Antibiotic Stewardship Demonstration project with the National Association of County and City
Health Officials (NACCHO) and the Center for Disease Control and Prevention (CDC).
GOAL 1: Reduce chronic conditions through education/prevention, and decrease the causes of death in our focus areas through health prevention activities.
Antimicrobial Resistance
Objective 1.1: Increase the number of Hospital-Acquired Infection (HAI) collaboration projects to at least 5 by December 2019
Performance indicator: # of Hospital-Acquired Infection (HAI) collaboration projects
Baseline: Baseline data is currently not available. The scheduled activities will provide the baseline information Target Date: December 2019 Lead Organizations: DOH- Orange Epidemiology & FSU College of Medicine
Alignment: No alignment to Healthy People 2020, State or Local strategic plan; however, identified as key
issues by county-wide Collaborative working on HAI.
Policy Changes: No policy changes at this moment
Assets & Resources: See Appendix G

8 | P a g e
PRIORITY 1: CHRONIC DISEASES & CAUSES OF DEATH
Excess pounds increase an individual’s risk of major health problems; people who are obese are at higher risk of
developing a chronic disease. Efforts to reduce Orange County resident weight will help decrease incidence and
prevalence of chronic diseases.
Alignment: Healthy People 2020 (0-5.1), Florida State Health Improvement Plan 2016-2019 (2.1.1);
DOH-Orange Strategic Plan (C3.4.5); State Health Improvement Plan (TBD)
Policies Changes: Supporting community organizations to disseminate health education to adults and children
Assets & Resources: See Appendix G
GOAL 1: Reduce chronic conditions through education/prevention, and decrease the cause of death in our focus areas through health prevention activities.
Obesity
Objective 1.2. Decrease by 3% the prevalence of obesity among Orange County residents by December 2019 through culturally and linguistically appropriate nutrition education, physical activity and food access efforts (measured by reductions in Hb A1c and BMI).
Performance Indicator(s): % of OC residents with Hb A1c levels in "normal range" % of OC residents with BMI levels in "normal range"
Baseline: Adults who meet moderate physical activity recommendations = 20.2% (2013) Adults Diagnosed with Diabetes = 10.3% (2013) Adults who are Obese = 25% (2013) Middle School Students Reporting BMI at or above 95th Percentile 9% (2012) High School Students Reporting BMI at or above 95th Percentile 14% (2012)
Target Date: December 2019 Lead Organizations: DOH- Orange, Florida Hospital, Orlando Health, UF/IFAS Extension

9 | P a g e
PRIORITY 1: CHRONIC DISEASES & CAUSES OF DEATH
According to the American Lung Association, asthma is a major health problem in our society. Asthma affects both
adults and children; it is the leading cause of limitations in daily activity2. Reducing the public burden of asthma through
community interventions may help close disparities and improve outcome to all Orange County residents.
Alignment: No alignment to State and Local strategies; however, it was identified as a key issue in Community
Health Needs Assessment; Healthy People 2020 (NW2)
Policy Changes: Adopt smoke free and indoor air quality policies in public schools; Policies for medical
insurance reimbursements for asthma self-managing and home visits.
Assets & Resources: See Appendix G
GOAL 1: Reduce chronic conditions through education/prevention, and decrease the causes of death in our focus areas through health prevention activities.
Asthma
Objective 1.3: Decrease by 3% emergency department use for asthma by in Orange County by December 2019.
Performance Indicator: # of Emergency Department visits due to asthma-related events
Baseline: Adult Emergency Department Visits due to Asthma: 3,335 (2015) Children Emergency Department Visits due to Asthma: 3,672 (2015) Target Date: December 2019 Lead Organizations: DOH- Orange, FSU College of Medicine, Florida Hospital
10 | P a g e
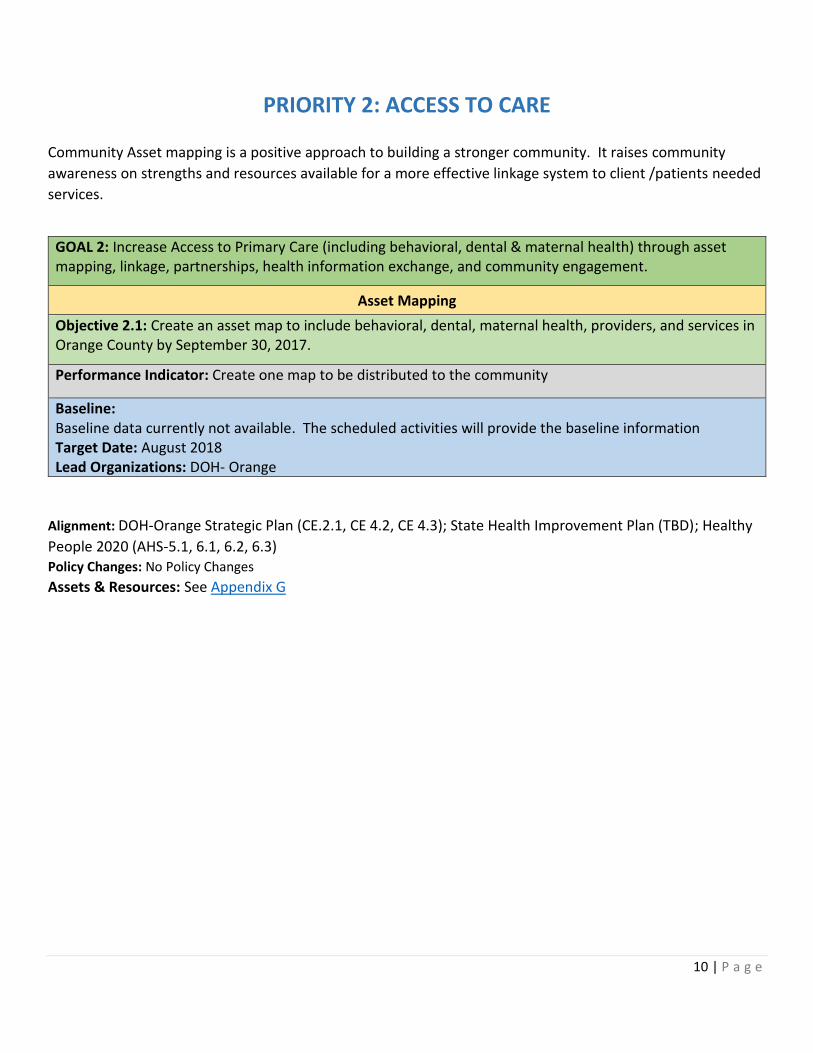
PRIORITY 2: ACCESS TO CARE
Community Asset mapping is a positive approach to building a stronger community. It raises community
awareness on strengths and resources available for a more effective linkage system to client /patients needed
services.
Alignment: DOH-Orange Strategic Plan (CE.2.1, CE 4.2, CE 4.3); State Health Improvement Plan (TBD); Healthy
People 2020 (AHS-5.1, 6.1, 6.2, 6.3) Policy Changes: No Policy Changes
Assets & Resources: See Appendix G
GOAL 2: Increase Access to Primary Care (including behavioral, dental & maternal health) through asset mapping, linkage, partnerships, health information exchange, and community engagement.
Asset Mapping
Objective 2.1: Create an asset map to include behavioral, dental, maternal health, providers, and services in Orange County by September 30, 2017.
Performance Indicator: Create one map to be distributed to the community
Baseline: Baseline data currently not available. The scheduled activities will provide the baseline information Target Date: August 2018 Lead Organizations: DOH- Orange

11 | P a g e
PRIORITY 2: ACCESS TO CARE
Alignment: DOH-Orange Strategic Plan (CE 2.1, CE 4.2, CE 4.3); State Health Improvement Plan (TBD); Healthy
People 2020 (AHS- 5.1, 6.1, 6.2, 6.3)
Policy Changes: No Policy Changes
Assets & Resources: See Appendix G
GOAL 2: Increase access to primary care (including behavioral, dental & maternal health) through asset mapping, linkage, partnerships, health information exchange, and community engagement.
Education & Awareness
Objective 2.2: Increase education/awareness to health services by April 15, 2018.
Performance Indicator: Increase the # of efforts to educate about services per month.
Baseline: Baseline data currently not available. The scheduled activities will provide the baseline information Target Date: December 2018 Lead Organizations: DOH- Orange, Access to Care- CHIP Collaborative
12 | P a g e
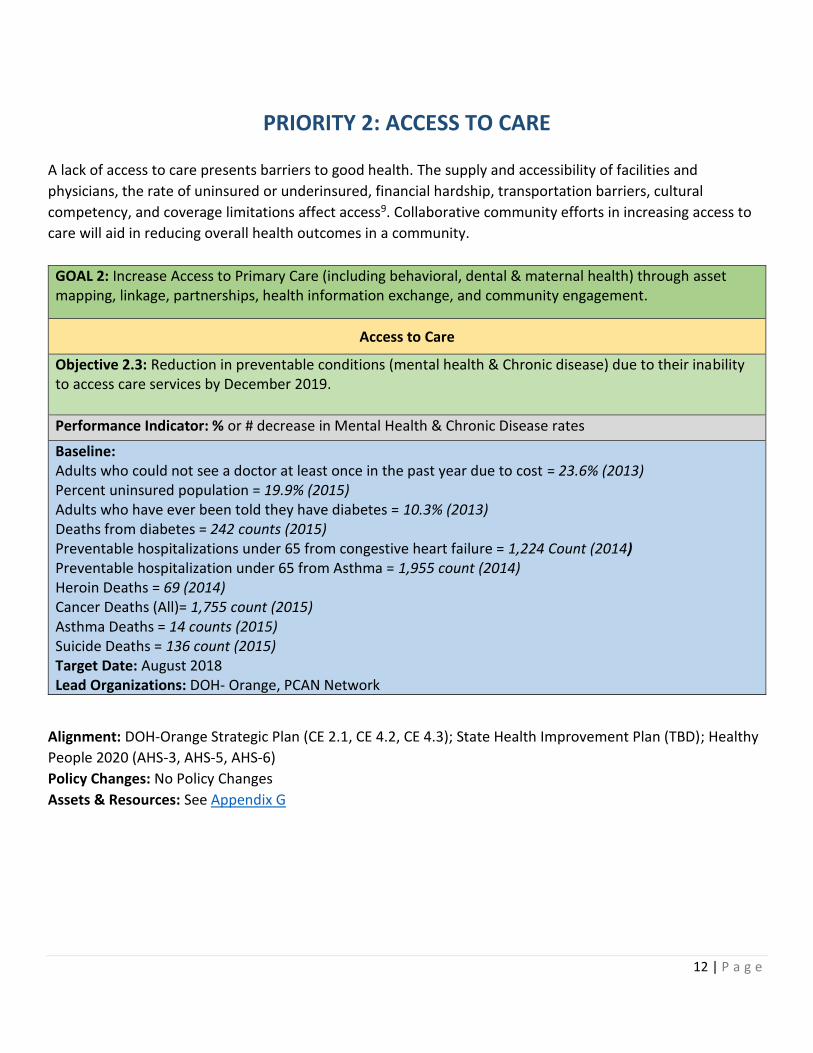
PRIORITY 2: ACCESS TO CARE
A lack of access to care presents barriers to good health. The supply and accessibility of facilities and
physicians, the rate of uninsured or underinsured, financial hardship, transportation barriers, cultural
competency, and coverage limitations affect access9. Collaborative community efforts in increasing access to
care will aid in reducing overall health outcomes in a community.
GOAL 2: Increase Access to Primary Care (including behavioral, dental & maternal health) through asset mapping, linkage, partnerships, health information exchange, and community engagement.
Access to Care
Objective 2.3: Reduction in preventable conditions (mental health & Chronic disease) due to their inability to access care services by December 2019.
Performance Indicator: % or # decrease in Mental Health & Chronic Disease rates
Baseline: Adults who could not see a doctor at least once in the past year due to cost = 23.6% (2013) Percent uninsured population = 19.9% (2015) Adults who have ever been told they have diabetes = 10.3% (2013) Deaths from diabetes = 242 counts (2015) Preventable hospitalizations under 65 from congestive heart failure = 1,224 Count (2014) Preventable hospitalization under 65 from Asthma = 1,955 count (2014) Heroin Deaths = 69 (2014) Cancer Deaths (All)= 1,755 count (2015) Asthma Deaths = 14 counts (2015) Suicide Deaths = 136 count (2015) Target Date: August 2018 Lead Organizations: DOH- Orange, PCAN Network
Alignment: DOH-Orange Strategic Plan (CE 2.1, CE 4.2, CE 4.3); State Health Improvement Plan (TBD); Healthy
People 2020 (AHS-3, AHS-5, AHS-6)
Policy Changes: No Policy Changes
Assets & Resources: See Appendix G

13 | P a g e
PRIORITY 3: BUILT ENVIRONMENT
Transportation is a commonly identified barrier in public health. Several studies have found transportation to
be a barrier to prenatal care, preventative medical visits, cancer care, and chronic disease management, and
access to healthy food establishments9. Working together as a community to improve transportation options
will provide a positive outcome to the health community residents especially those in a more rural, low
income community.
GOAL 3: Identify and leverage existing community resources that can equitably improve, access to healthy foods, transportation and connectivity.
Transportation
Objective 3.1: Ensure access to multi-modal options by providing equitable transportation alternatives to and within rural and urban areas across diverse income communities by December 2019.
Performance Indicator: Increase multi-modal options by 25%
Baseline: Baseline data not currently available. The scheduled activities will provide the baseline information. Target Date: December 2018 Lead Organizations: DOH-Orange, Metro Plan, East Central Florida Regional Planning Council, LYNX, Built Environment Collaborative
Alignment: DOH-Orange Strategic Plan (CE 2.1, CE 4.2, CE 4.3); State Health Improvement Plan (TBD); Healthy
People 2020 (EH-2)
Policy Changes: Working with transportation sectors to create equitable and healthy transportation polices.
Assets & Resources: See Appendix G
14 | P a g e
PRIORITY 3: BUILT ENVIRONMENT
People who live in food deserts are less likely to have access to supermarkets or grocery stores that provide
healthy choices for food10. With limited or no access to food retailers, these communities may be more likely
to suffer from certain chronic disease. Adequate access to healthy foods is a key driver to maintain a healthy
lifestyle. Collaborative efforts to ensure accessibility to healthy foods will help improve the health outcomes.
GOAL 3: Identify and leverage existing community resources that can equitably improve access to healthy foods, transportation and connectivity.
Access to Healthy Foods
Objective 3.2: Champion policies and partnerships that will increase availability to low cost healthy foods across communities by December 2019.
Performance Indicator: Increase low cost healthy foods availability to 25% across communities
Baseline: Baseline data not currently available. The scheduled activities will provide the baseline information. Target Date: December 2019 Lead Organization: DOH-Orange, Metro Plan Orlando, East Central Florida Regional Planning Council, Second Harvest, LYNX, Built Environment – CHIP Collaborative
Alignment: DOH-Orange Strategic Plan (CE 2.1, CE 4.2, CE 4.3); State Health Improvement Plan (TBD)
Policy Changes: Possible change in polices to increase access to healthy foods in food desert communities.
Assets & Resources: See Appendix G
15 | P a g e
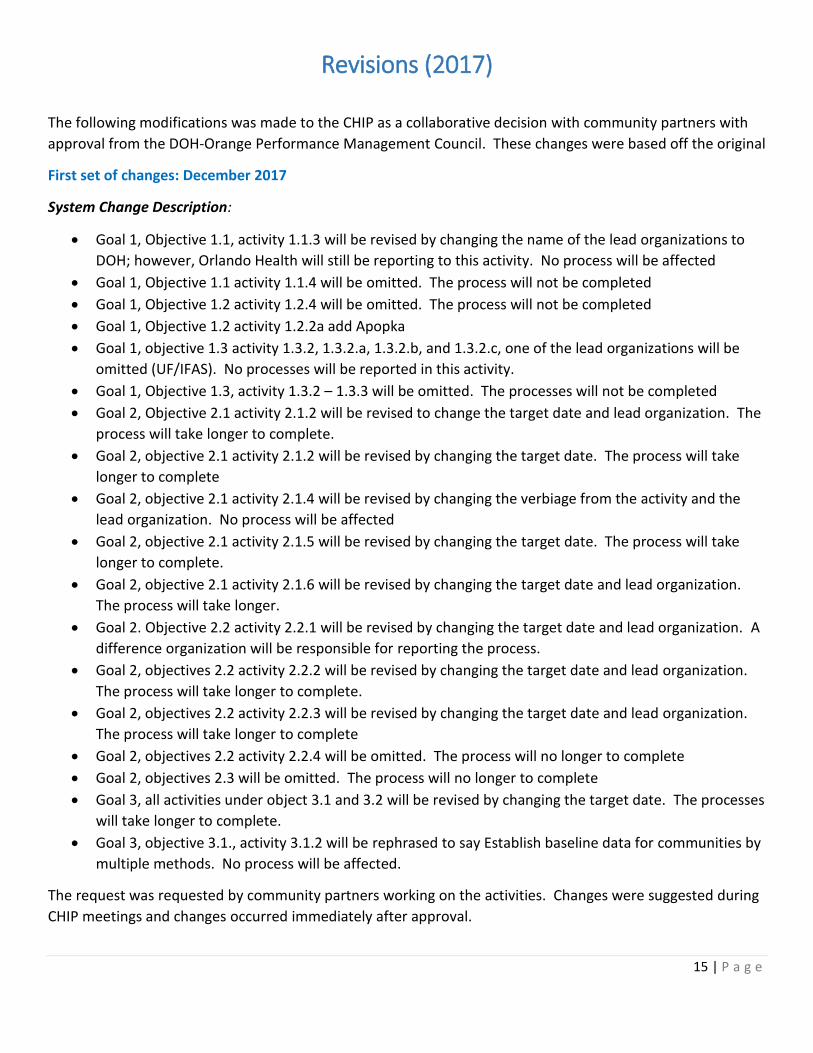
Revisions (2017)
The following modifications was made to the CHIP as a collaborative decision with community partners with
approval from the DOH-Orange Performance Management Council. These changes were based off the original
First set of changes: December 2017
System Change Description:
• Goal 1, Objective 1.1, activity 1.1.3 will be revised by changing the name of the lead organizations to
DOH; however, Orlando Health will still be reporting to this activity. No process will be affected
• Goal 1, Objective 1.1 activity 1.1.4 will be omitted. The process will not be completed
• Goal 1, Objective 1.2 activity 1.2.4 will be omitted. The process will not be completed
• Goal 1, Objective 1.2 activity 1.2.2a add Apopka
• Goal 1, objective 1.3 activity 1.3.2, 1.3.2.a, 1.3.2.b, and 1.3.2.c, one of the lead organizations will be
omitted (UF/IFAS). No processes will be reported in this activity.
• Goal 1, Objective 1.3, activity 1.3.2 – 1.3.3 will be omitted. The processes will not be completed
• Goal 2, Objective 2.1 activity 2.1.2 will be revised to change the target date and lead organization. The
process will take longer to complete.
• Goal 2, objective 2.1 activity 2.1.2 will be revised by changing the target date. The process will take
longer to complete
• Goal 2, objective 2.1 activity 2.1.4 will be revised by changing the verbiage from the activity and the
lead organization. No process will be affected
• Goal 2, objective 2.1 activity 2.1.5 will be revised by changing the target date. The process will take
longer to complete.
• Goal 2, objective 2.1 activity 2.1.6 will be revised by changing the target date and lead organization.
The process will take longer.
• Goal 2. Objective 2.2 activity 2.2.1 will be revised by changing the target date and lead organization. A
difference organization will be responsible for reporting the process.
• Goal 2, objectives 2.2 activity 2.2.2 will be revised by changing the target date and lead organization.
The process will take longer to complete.
• Goal 2, objectives 2.2 activity 2.2.3 will be revised by changing the target date and lead organization.
The process will take longer to complete
• Goal 2, objectives 2.2 activity 2.2.4 will be omitted. The process will no longer to complete
• Goal 2, objectives 2.3 will be omitted. The process will no longer to complete
• Goal 3, all activities under object 3.1 and 3.2 will be revised by changing the target date. The processes
will take longer to complete.
• Goal 3, objective 3.1., activity 3.1.2 will be rephrased to say Establish baseline data for communities by
multiple methods. No process will be affected.
The request was requested by community partners working on the activities. Changes were suggested during
CHIP meetings and changes occurred immediately after approval.

16 | P a g e
Community partners felt they needed more time in some activities. Target dates were realized to allow ample
time for activities to be accomplished. Led individuals and organization took ownership on some activities,
therefore, the change needs to be state on the document. There was an error when assigning an organization
to an activity. Also, some changes needed to be made due to unresponsiveness and lack of commitment of
some partners.
Second Set of Changes: March 2018
System Change Description (state exactly what is being changed and what processes are affected): Some activities under Goal 1, 2 and 3 of the action plans will be revised or omitted. No processes will be affected. The list of activities from Goals 1, 2, and 3 will be omitted from the CHIP document; however, the activities will not be omitted from the VMSG Dashboard, where activities will be tracked and any changes in the activities will be documented. No processes will be affected. CHIP Administrator suggested the change to decrease the number of future change request procedures. Community partners agreed on the change.
Community partners working on the activity requested the change. Activities and activity target dates are subject to multiple changes throughout the CHIP process, therefore it was preferred to omit the activities from the CHIP document to decrease the number of multiple change request procedures. Changes will occur immediately after approval.

17 | P a g e
APPENDICES _________________________________________________________________________________________________
APPENDIX A: THE MAPP PROCESS
Framework: Mobilizing Action through Planning & Partnerships (MAPP)
The Mobilizing for Action through Planning & Partnership (MAPP) process is a community-driven strategic
planning process for improving community health. The
process helps communities apply strategic thinking to
identify and prioritize health issues and identify resources to
address them. There are four individual assessments.
Community Themes & Strength Assessment (CTSA)
The CTSA provides a deep understanding of the issues and
concerns residents feel are important. It answers questions
such as: “What’s important to our community?” and: How is
quality of life perceived in our community?”
Local Public Health System Assessment (LPHSA)
The LPHSA is a comprehensive assessment of all the
organizations/entities that contribute to the public’s health.
It answers the questions: “What are the components,
activities, competencies, and capacities of our local public health system?” and “How are the Essential Services
being provided to our community?”
Community Health Assessment (CHA)
The CHA assesses the current health status of a
community through the selection and collection of relevant data indicators. It identifies priority issues related
to community health and quality of life.
Forces of Change Assessments (FOCA)
The FOCA identifies forces, such as trends or events, and other issues that affect the context in which the
community and its public health system operates.
Source: National Association of County & City Health Officials (NACCHO)
18 | P a g e
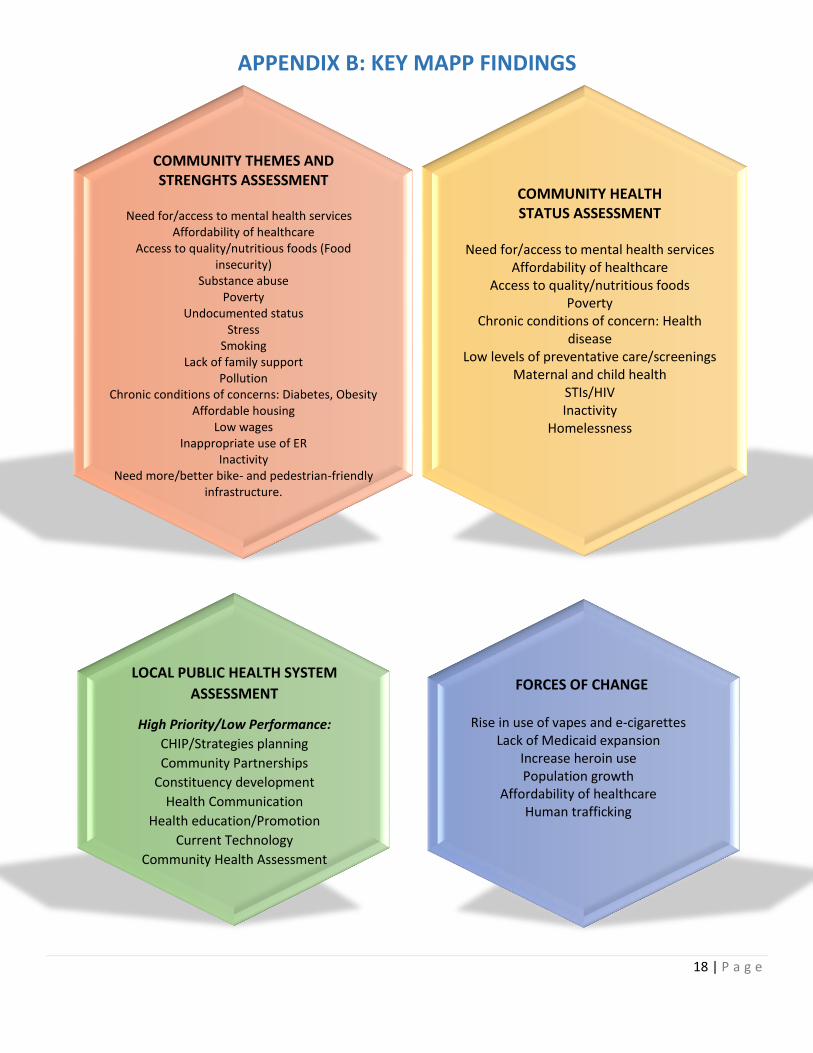
APPENDIX B: KEY MAPP FINDINGS
COMMUNITY HEALTH STATUS ASSESSMENT
Need for/access to mental health services
Affordability of healthcare Access to quality/nutritious foods
Poverty Chronic conditions of concern: Health
disease Low levels of preventative care/screenings
Maternal and child health STIs/HIV Inactivity
Homelessness
COMMUNITY THEMES AND STRENGHTS ASSESSMENT
Need for/access to mental health services
Affordability of healthcare Access to quality/nutritious foods (Food
insecurity) Substance abuse
Poverty Undocumented status
Stress Smoking
Lack of family support Pollution
Chronic conditions of concerns: Diabetes, Obesity Affordable housing
Low wages Inappropriate use of ER
Inactivity Need more/better bike- and pedestrian-friendly
infrastructure.
LOCAL PUBLIC HEALTH SYSTEM
ASSESSMENT
High Priority/Low Performance:
CHIP/Strategies planning
Community Partnerships
Constituency development
Health Communication
Health education/Promotion
Current Technology
Community Health Assessment
FORCES OF CHANGE
Rise in use of vapes and e-cigarettes Lack of Medicaid expansion
Increase heroin use Population growth
Affordability of healthcare Human trafficking
19 | P a g e
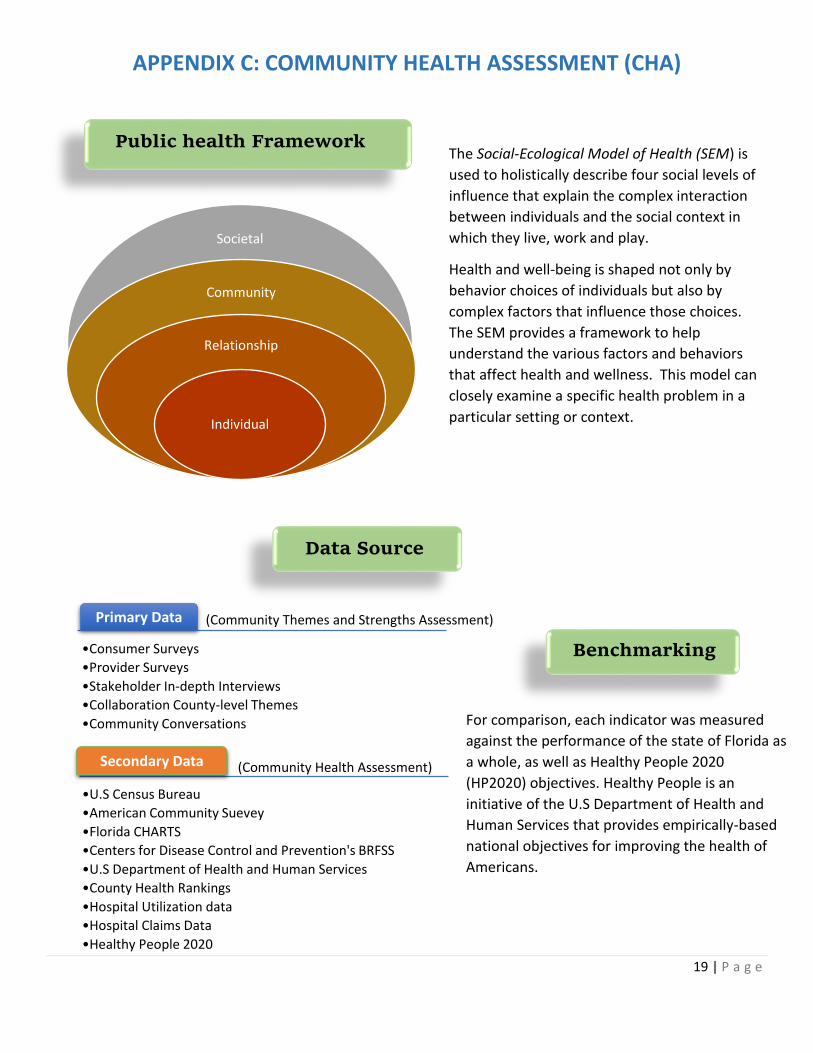
APPENDIX C: COMMUNITY HEALTH ASSESSMENT (CHA)
Public health Framework
Societal
Community
Relationship
Individual
The Social-Ecological Model of Health (SEM) is
used to holistically describe four social levels of
influence that explain the complex interaction
between individuals and the social context in
which they live, work and play.
Health and well-being is shaped not only by
behavior choices of individuals but also by
complex factors that influence those choices.
The SEM provides a framework to help
understand the various factors and behaviors
that affect health and wellness. This model can
closely examine a specific health problem in a
particular setting or context.
Primary Data
•Consumer Surveys
•Provider Surveys
•Stakeholder In-depth Interviews
•Collaboration County-level Themes
•Community Conversations
Secondary Data
•U.S Census Bureau
•American Community Suevey
•Florida CHARTS
•Centers for Disease Control and Prevention's BRFSS
•U.S Department of Health and Human Services
•County Health Rankings
•Hospital Utilization data
•Hospital Claims Data
•Healthy People 2020
Data Source
Benchmarking
For comparison, each indicator was measured
against the performance of the state of Florida as
a whole, as well as Healthy People 2020
(HP2020) objectives. Healthy People is an
initiative of the U.S Department of Health and
Human Services that provides empirically-based
national objectives for improving the health of
Americans.
(Community Themes and Strengths Assessment)
(Community Health Assessment)

20 | P a g e
In order to prioritize and address specific areas of focus, the Health for All Orange collaborative were
presented with the most recent data available on the first meeting. The following information was presented:
County Health Rankings Source: County Health Rankings - 2016
Rank
Orange County
Health Outcomes 21
Length of Life (Mortality) 7
Quality of Life (Morbidity) 43
Health Factors 21
Health Behaviors 18
Clinical Care 31
Socioeconomic 18
Physical Environment 53
County Health Rankings produce a report by
ranking the counties in each state. Out of 67
counties, Orange County ranked better than 46
other counties in Health outcomes and Health
Factors. However, the concern lies in that ranking
for Health factors has dropped from 13 (2015), to
now 21; as well as the health factors from 19
(2015) to now 21.
Mortality from certain chronic diseases and unintentional injuries is top concerns in the county. If
morbidity and preventable unintentional injuries are reduced, it can greatly impact the life
expectancy of Orange County residents. As the chart shows, all top causes of death have steadily
been decreasing throughout the years, in exception of cerebrovascular disease and unintentional
injuries. In addition, heroin related deaths and cases of infant deaths are also of great concern to the
community.

21 | P a g e
• County Demographics
• Chronic Conditions & Causes of Death
o Top 3 concerning cancers (Rectal,
Breast, Lung)
o GIS mapping on cancer prevalence
by zip code
o Hospitalizations rates from Cognitive
Heart Failure
o GIS mapping on Cardiovascular
disease prevalence by zip code
o Unintentional Fall rates,
Unintentional Poisoning rates, and
moto vehicle crash
o Adult asthma diagnosis
o Children’s asthma hospitalization
rates
o GIS mapping of respiratory disease
prevalence by zip code
o GIS mapping of cerebrovascular
disease prevalence by zip code
o Adult diabetes diagnosis
o Adult Obesity
o GIS mapping of diabetes prevalence
by zip code
o Life Expectancy
• Access to care
o GIS map of Medical Services
o Adult Mental Health (depressive
disorder)
o Heroin Deaths
o Uninsured adult
o GIS map of uninsured residents
by zip code
o Infant Mortality
o Pre-term & Low birth
o Maternal Prenatal care
o Births to uninsured mothers
o HIV/AIDS cases
• Built Environment
o Housing Security
▪ Homelessness
▪ Cost burden
o Food Security
▪ Food Deserts
▪ SNAP Benefits
▪ GIS mapping of Fast Food
Locations in the County
o Poverty
o Transportation
• Data gathered from the Local Public
Health System Assessment
The Following Data was also shared with the participants:
ADDITIONAL CHA DATA

22 | P a g e
APPENDIX D: LOCAL PUBLIC HEALTH SYSTEM ASSESSMENT The Local Public Health System Assessment (LPHSA) serves as a snapshot of
where the health department and public health system are relative to the
National Public Health Performance Standard, and to progressively move
towards refining, and improving outcomes for performance across the public
health system.
On March 16th 2016, 53 community partners from 37 different organization
participated in an assessment. The self-assessment was structured around the
Model Standards for each of the 10 Essential Public Health Services; 30 Model
Standards which served as quality indicators that are organized into 10
Essential Public Health Service areas in the instrument and address the three
core functions of Public Health; Priority of Model standards questionnaire, and a Local Health Department
contribution, which was completed internally by Florida Department of Health in Orange County employees.
After a thorough discussion of the Essential Services and its Model Standards, participants evaluated the
public health system and voted on its performance (Optimal Activity, Significant Activity, Moderate Activity,
Minimal Activity, No
Activity)
Based on the responses
provided by participants,
an average was calculated
by combining all the
scores from each model
standard performance
measure. The average
score was then inputted
in the National Public
Health Performance
Standards database,
where it then generated
the average score to each
Essential Service and
overall. The following
chart provides a
composite summary of
how the Model Standards
performed in each of the
10 Essential Services. This
gives a sense of the Local
Public Health System’s
greatest strengths and
weakness.
Optimal Activity (76-100%) Moderate Activity (26-50%) ES 2: Diagnose and Investigate
Identification/Surveillance Emergency Responses
Laboratories ES 5: Develop Policies and Plans
Emergency Plan ES 6: Enforce Laws & Regulations
Review Laws
ES1: Monitor Health Status Community Health Assessment
Current Technology Registries
ES 3: Inform, Educate, and empower Health Education and Promotion
Health Communication ES: 4 Mobilize Community Partnerships
Constituency Development Community Partnerships
ES 5: Develop Polices and Plans CHIP/Strategic Planning
ES 7: Link People to Health Services Assure Linkage
ES 8: Assure Workforce Workforce Assessment
Leadership Development ES 9: Evaluate Service
Evaluation of Population Health Evaluation of Personal Health
Evaluation of LPHS
Significant Activity (51-75%) ES 3: Inform, Educate, and Empower
Risk Communication ES 5: Develop Polices and Plans
Government Presence Policy Development
ES 6: Enforce Laws & Regulations Improve Laws Enforce Laws
ES 7: Link People to Health Services Personal Health Service Needs
ES 8: Assure Workforce Workforce Standards Continuing Education
ES 10: Research/Innovations Foster Innovation
Academic Linkages Research Capacity
Minimal Activity (1-25%)
None of the Essential Services scored in the Minimal/No Activity range
No Activity (0%)
Source: Centers for Disease Control, and Prevention

23 | P a g e
When participants scored the performance of each model standard they also considered the priority of each
model standard to the system. This shows the performance scores in relation to how they have prioritized
model standards. This information serves to strengthen the performance improvement activities resulting
from the assessment process, by increasing efforts in other areas in need of attention to other areas which are
currently performing well.
The final result of the prioritization, categorized the model standards in four quadrants as shown in the chart
below.
Quadrant A is where the
public health system needs
to increase their efforts in
order to strengthen and
increase its overall
performance.
The following Model standards fell into Quadrant A:
Participating Organizations: Orange County Public Schools, 4C, Head Start, Orange County Drug free office, NACDD, Department of
Transportation, Orange County Medical Examiner, Healthy Start, Orlando Health Metro Plan Orlando, East Central Florida Regional
Planning Council, Shepherd Hope, Mt Sinai Church, Orange County Fire Department, Interfaith Council, Healthy Start, LYNX, UF/IFAS
Cooperative Extension, True Health, City of Orlando Police Department, Second Harvest, Early Learning Coalition of Orange County,
Community Member, Orlando Health, UCF College of Medicine, Visionary Vanguard Group, Orange County Jail, Orange County
Government, City of Orlando, Orange County office of aging, Community member, Center for Change, United way, American Lung
Association, Mt Zion Missionary Baptist Church , Children's Home Society, Hunters Creek Nursing & Rehab
Quadrant A (High Priority & Low Performance)
These activities may need increased attention
Quadrant B (High priority & High Performance) These activities may need increase
attention.
Quadrant C (Low Priority & High Performance)
These activities are being done well, consideration may be given to reducing effort in these areas.
Quadrant D (Low Priority & Low Performance)
These activities could be improved, but are of low priority. They may need little
or no attention at this time.
ES 1.1: Community Health Assessment
ES 1.2: Current Technology
ES 3.1: Health Education/Promotion
ES 3.2: Health Communication
ES 4.1: Constituency Development
ES 4.2: Community Partnership
ES 5.3: CHIP/Strategic Planning
- Increase knowledge on CHIP/CHA
- Increase knowledge of other organizations work and services.
- Increase system interaction level
- Create/maintain a directory of community organizations.
- Increase health communication plans.
- Utilize more current technology to analyze and display health data
Recommendations
for improvement
24 | P a g e
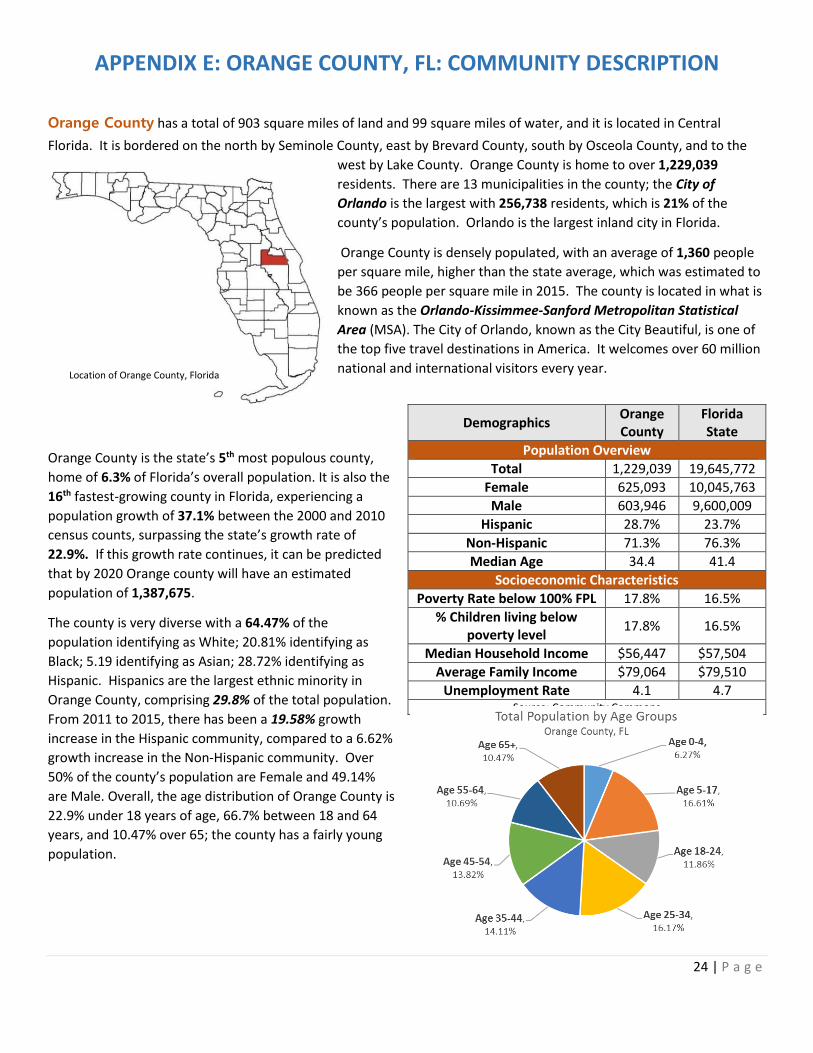
APPENDIX E: ORANGE COUNTY, FL: COMMUNITY DESCRIPTION
Orange County has a total of 903 square miles of land and 99 square miles of water, and it is located in Central
Florida. It is bordered on the north by Seminole County, east by Brevard County, south by Osceola County, and to the
west by Lake County. Orange County is home to over 1,229,039
residents. There are 13 municipalities in the county; the City of
Orlando is the largest with 256,738 residents, which is 21% of the
county’s population. Orlando is the largest inland city in Florida.
Orange County is densely populated, with an average of 1,360 people
per square mile, higher than the state average, which was estimated to
be 366 people per square mile in 2015. The county is located in what is
known as the Orlando-Kissimmee-Sanford Metropolitan Statistical
Area (MSA). The City of Orlando, known as the City Beautiful, is one of
the top five travel destinations in America. It welcomes over 60 million
national and international visitors every year.
Orange County is the state’s 5th most populous county,
home of 6.3% of Florida’s overall population. It is also the
16th fastest-growing county in Florida, experiencing a
population growth of 37.1% between the 2000 and 2010
census counts, surpassing the state’s growth rate of
22.9%. If this growth rate continues, it can be predicted
that by 2020 Orange county will have an estimated
population of 1,387,675.
The county is very diverse with a 64.47% of the
population identifying as White; 20.81% identifying as
Black; 5.19 identifying as Asian; 28.72% identifying as
Hispanic. Hispanics are the largest ethnic minority in
Orange County, comprising 29.8% of the total population.
From 2011 to 2015, there has been a 19.58% growth
increase in the Hispanic community, compared to a 6.62%
growth increase in the Non-Hispanic community. Over
50% of the county’s population are Female and 49.14%
are Male. Overall, the age distribution of Orange County is
22.9% under 18 years of age, 66.7% between 18 and 64
years, and 10.47% over 65; the county has a fairly young
population.
Demographics Orange County
Florida State
Population Overview
Total 1,229,039 19,645,772
Female 625,093 10,045,763
Male 603,946 9,600,009
Hispanic 28.7% 23.7%
Non-Hispanic 71.3% 76.3%
Median Age 34.4 41.4
Socioeconomic Characteristics
Poverty Rate below 100% FPL 17.8% 16.5%
% Children living below poverty level
17.8% 16.5%
Median Household Income $56,447 $57,504
Average Family Income $79,064 $79,510
Unemployment Rate 4.1 4.7 Source: Community Commons
Location of Orange County, Florida

25 | P a g e
Median household income is $56,447, which is slightly lower than the state median household income. Median
household income is the most widely used measure for income due to the fact that its less impacted by high and low
incomes. A family’s income has the ability to define their access to affordable housing, healthcare, higher education
opportunities, and food. In 2015, 212,489 (17.7%)
of the population had incomes below 100% of the
Federal Poverty Level (FPL); from that population,
70,549 (25.5%) are under age 18. The lack of health
insurance is considered a key driver of health. Lack
of insurance is a primary barrier to health access
including primary care, specialty care, and other
health services that contribute to poor health
status. The county (20%) has a slightly higher
uninsured population percentage than the state
(18%).
Education is also a very strong predictor of health.
Orange County is doing well with high school graduation and higher education rates. From the average freshmen base
enrollment (14,573), 79% students receive their high school diploma within four years. Although the rate (79%) is lower
than the Healthy People 2020 Target, Orange County’s rate surpasses both state and national rates of the same
measure. From the total population age 25+, 41.6% hold an associate degree or higher; 31.1% hold a bachelor’s degree
or higher. These rates could possibly hold a correlation to the low unemployment rate of the county (4.1) compared to
the state. Unemployment rates has steadily been decreasing in the county since the year 2010.
When taking a closer
look at the county we
can see how some
areas are
disproportionality
affected by certain
health indicators than
others. The map
illustrates areas of
great need within
Orange County. This
map highlights, by
census tracts, areas
with a high
percentage of the
population living
below the poverty
line, and population
with low education
attainment.
0.00%
10.00%
20.00%
30.00%
40.00%
Uninsured Population by Race Alone
Orange County, FL Florida
Vulnerable Populations Footprint, ACS 2011-15
Above threshold for poverty and education
>30% of population below the poverty level
>25% of population with less than HS education
Highest 1/5 income mean at least twice the
county mean (by tract)
Source: Community Commons
26 | P a g e
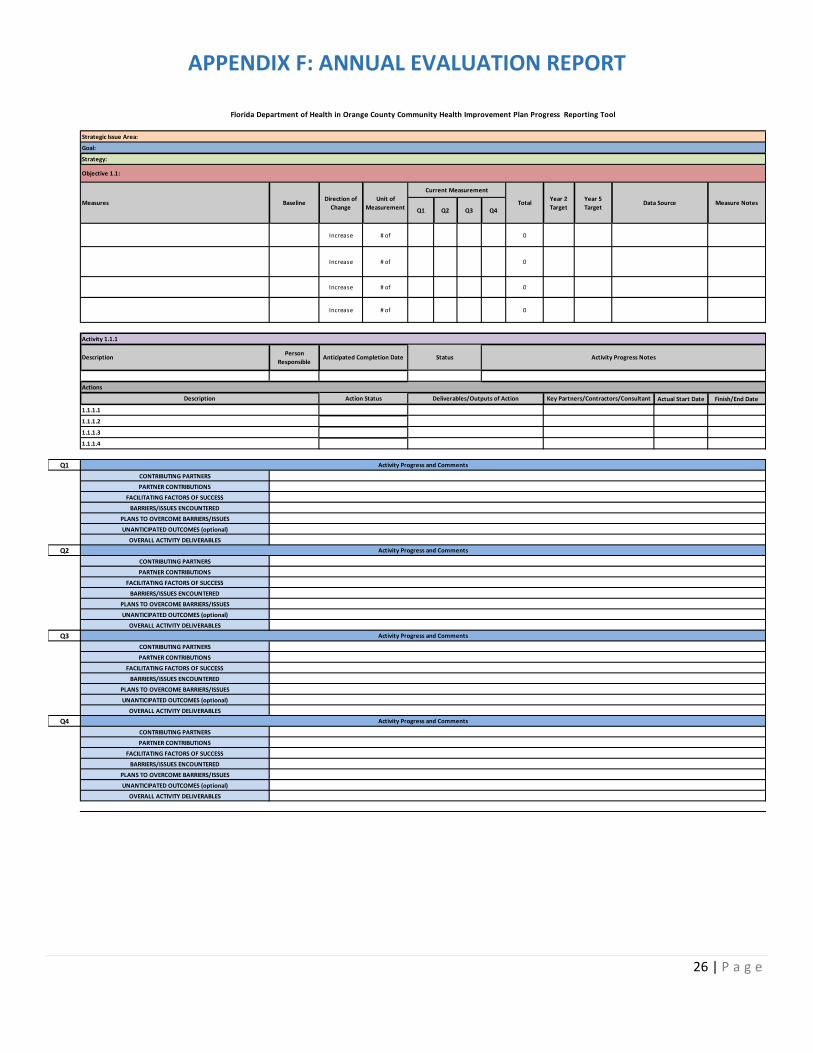
APPENDIX F: ANNUAL EVALUATION REPORT
Actual Start Date Finish/End Date
Q1
CONTRIBUTING PARTNERS
PARTNER CONTRIBUTIONS
FACILITATING FACTORS OF SUCCESS
BARRIERS/ISSUES ENCOUNTERED
PLANS TO OVERCOME BARRIERS/ISSUES
UNANTICIPATED OUTCOMES (optional)
OVERALL ACTIVITY DELIVERABLES
Q2
CONTRIBUTING PARTNERS
PARTNER CONTRIBUTIONS
FACILITATING FACTORS OF SUCCESS
BARRIERS/ISSUES ENCOUNTERED
PLANS TO OVERCOME BARRIERS/ISSUES
UNANTICIPATED OUTCOMES (optional)
OVERALL ACTIVITY DELIVERABLES
Q3
CONTRIBUTING PARTNERS
PARTNER CONTRIBUTIONS
FACILITATING FACTORS OF SUCCESS
BARRIERS/ISSUES ENCOUNTERED
PLANS TO OVERCOME BARRIERS/ISSUES
UNANTICIPATED OUTCOMES (optional)
OVERALL ACTIVITY DELIVERABLES
Q4
CONTRIBUTING PARTNERS
PARTNER CONTRIBUTIONS
FACILITATING FACTORS OF SUCCESS
BARRIERS/ISSUES ENCOUNTERED
PLANS TO OVERCOME BARRIERS/ISSUES
UNANTICIPATED OUTCOMES (optional)
OVERALL ACTIVITY DELIVERABLES
Strategic Issue Area:
Goal:
Strategy:
Increase # of 0
Q2 Q3 Q4
Increase # of 0
Increase # of
Florida Department of Health in Orange County Community Health Improvement Plan Progress Reporting Tool
Objective 1.1:
Measures BaselineDirection of
Change
Unit of
Measurement
Current Measurement
Increase # of 0
0
TotalYear 2
Target
Year 5
TargetData Source Measure Notes
Q1
Activity 1.1.1
DescriptionPerson
ResponsibleAnticipated Completion Date Status
1.1.1.2
Activity Progress Notes
Actions
Description Action Status Deliverables/Outputs of Action Key Partners/Contractors/Consultant
1.1.1.3
1.1.1.1
Activity Progress and Comments
1.1.1.4
Activity Progress and Comments
Activity Progress and Comments
Activity Progress and Comments

27 | P a g e
APPENDIX G: ASSETS & RESOURCES
• Impower
• Interfaith Hospitality Network Orlando
• La Amistad Residential Treatment Center
• Leadership Orlando
• Local Physicians
• Long Term Care Facilities
• Metro Orlando Economic Development
• Mission Fit Kids
• National Alliance on Mental Health
• National Association of County and City Health Officials
(NACCHO)
• Nemours
• Orange Blossom Family Health
• Orange County Parks & Recreation
• Orange County Public library
• Orange County Public School System
• Orlando Health
• Orlando Union Rescue Mission Men’s Division
• Orlando VA Medical Center
• Overeater Anonymous
• Park Place Behavioral HealthCare
• Pathways Drop in Center
• Primary Care Access Network (PCAN)
• Reduce Obesity in Central Florida
• Second Harvest Food Bank
• Seniors Resource Alliance
• Shepherds Hope
• The Center Orlando
• The Chrysalis Center, Inc
• The Collaborative Obesity Prevention Program
• The grove Counseling Center
• The Mental Association of Central Florida
• The National Kidney Foundation
• The Transition house
• True Health
• United Against poverty
• United Way 2-1-1
• University Behavioral Center
• University of Central Florida
• USA Dance
• Visionary Vanguard
• Wayne Densch Center
• Winter Park Health Foundation
• Workforce Central Florida
• Wraparound Orange
• 100 Black Men of Orlando, INC
• American Cancer Society
• American Diabetes Association
• American Heart Association
• American Lung Association
• Apopka Family Learning Center
• Aspire Health Partners
• Assisted Living Facilities
• Beta Center
• Boys & Girls Club of Central Florida
• Center for Change
• The Center for Disease Control and Prevention
• Center for Multicultural Wellness & Prevention
• Central Florida Commission on Homeless
• Central Florida Employment Council
• Central Florida Family Medicine
• Central Florida Partnerships on Health Disparities
• Central Florida Pharmacy Council
• Central Florida Urban League
• Central Florida YMCA
• Children’s Home Society of Central Florida
• Christian Services Center of Central Florida
• City of Orlando Parks & Recreation
• Coalition for the Homeless of Central Florida
• Community Health Centers
• Community Vision
• County Chamber of Commerce
• Dental Care Assess Foundation
• Downtown Orlando Partnership
• Florida Department of Health in Orange County
• Florida Hospital
• Florida Nurses Association
• Florida State University College of Medicine
• Get Active Orlando
• Goodwill
• Grace Medical Home
• Harvest Time International, INC
• Health Central Hospital
• Healthy 100 Kids
• Healthy Central Florida
• Healthy Kids Today
• Healthy Orange Collaboration
• Hebni Nutrition Consultant
• Hispanic Health Initiatives
• Homeless Service Network of Central Florida
28 | P a g e
REFERENCES
1Antimicrobial Resistance. (2017, January 5). Retrieved from Centers for Disease Control and Prevention :
https://www.cdc.gov/drugresistance/
2Asthma. (n.d.). Retrieved from American Lung Association: http://www.lung.org/lung-health-and-diseases/lung-
disease-lookup/asthma/
3(2016). Community Health Needs Assessment . Orlando: Impact Partners.
4Communtiy Commons. (n.d.). Retrieved from Community Commons: https://www.communitycommons.org/
5Communtiy Heath Assessement and Improvement Planning. (n.d.). Retrieved from National Association of County & City
Health Officials (NAACHO): http://www.naccho.org/programs/public-health-infrastructure/community-health-
assessment
6FL Health CHARTS. (2017). Retrieved from FL Health CHARTS: http://www.flhealthcharts.com/charts/Default.aspx
7Healthy People 2020. (n.d.). Retrieved from HealthyPeople.gov
8Hinkle-Brown, D., Lehmann, Y., & Bell, J. (n.d.). Access to Healthy Food Improves Health, Brings Economic Benefits.
Retrieved from THE HUFFINGTON POST: http://www.huffingtonpost.com/don-hinklebrown/access-to-healthy-
food_b_4822735.html
9Johns Hopkins Center to Eliminate Cardiovascular Health Disparities. (n.d.). Retrieved from Access to Care:
http://www.jhsph.edu/research/centers-and-institutes/johns-hopkins-center-to-eliminate-cardiovascular-
health-disparities/about/influences_on_health/access_to_care.html
10Living in a Food Desert: How Lack of Access to Healthy Foods Can Affect Public Health. (n.d.). Retrieved from The
National Academies of Sciences Engineering Medicine: https://notes.nap.edu/2011/01/25/living-in-a-food-
desert-how-lack-of-access-to-healthy-foods-can-affect-public-health/
11Orange County. Florida. (n.d.). Retrieved from County Health Rankings:
http://www.countyhealthrankings.org/app/florida/2016/rankings/orange/county/outcomes/overall/snapshot


![Community management of chronic obstructive … · chronic bronchitis and emphysema (National Institute for Health and Care Excellence [NICE], 2010). It ... Community management of](https://static.fdocuments.in/doc/165x107/5b92d91d09d3f27f5d8c0d7a/community-management-of-chronic-obstructive-chronic-bronchitis-and-emphysema.jpg)