Community Health Worker (CHW) Assessment 2017 North ...€¦ · A community health worker also...
24
1 Community Health Worker (CHW) Assessment 2017 North Country Region
Transcript of Community Health Worker (CHW) Assessment 2017 North ...€¦ · A community health worker also...

1
Community Health Worker (CHW)
Assessment 2017
North Country Region

2
Table of Contents
Introduction and Methodology of the Community Health Worker Assessment 3
Community Health Worker Assessment Summary of Findings 5
Conclusion and Dissemination Plan 9
Exhibit A: Northern NH Community Health Needs Assessment Data 10
Exhibit B: Northern NH Data and Documented Health Indicators 18
Exhibit C: Community Health Worker Assessment Survey Example 20

3
Introduction and Methodology of the Community Health Worker Assessment 2017
The assessment of the Community Health Worker (CHW) role in chronic disease prevention and
management in the North Country Public Health Region has been conducted through in-
person interviews, telephone interviews and an online survey to gather information (63%
response rate). The group represented a broad constituency including leaders in area business,
faith-based groups, and health and human service organizations. Additional information
includes data from the recent Community Health Needs Assessment by The North Country
Health Consortium. The success of the assessment has relied on the established relationships
with health care providers and community based organizations in the North Country, and used
assessment tools that were customized to address the specific needs of the North Country
communities.
The needs assessment includes information pertaining to:
• Understanding of the role of CHWs
• Current practices and barriers related to the integration of CHWs into health care teams
and their use in the community for targeted outreach
• Training and technical assistance needs of health care systems and community
organizations related to CHWs
• Policies or protocols that incorporate CHWs into teams
• Identified opportunities to incorporate CHWs into chronic disease prevention and
management
The following information are summary points of the most recent regional Community Health
Needs Assessments(CHNA) conducted between November 2015 and September 2016. The
Executive Summary from the CHNA is available in Exhibit A. In Exhibit B are demographic
and area health indicators to provide context of the communities in the Northern NH service area
of Coos and upper Grafton counties. The secondary data was collected from the U.S. Bureau of
the Census, Behavioral Risk Factor Surveillance Survey, County Health Rankings, and the NH
State Health Profile and available as benchmark data to see how the area compares to state and
national trends. Information from the surveys and secondary data sources are used to evaluate
the health of the community, identify high priority health needs, and develop and implement
strategies to address the needs of the community.
The top six serious health issues in the North Country that were identified by the community
assessment surveys were:
• Substance Misuse (includes drugs, opioids, heroin, etc.) (83.9%)
• Obesity/Overweight (79%)
• Alcohol Abuse (74.4%)
• Low-income/Poverty (74%)
• Physical Inactivity (72.9o/o)
• Smoking and Tobacco Use (72.1%)
Key informants in the Community Health Needs Assessment identified the following as
challenges in the North Country healthcare system:
• Access to Healthcare
4
• Affordable Health and Dental Insurance
• Barriers to Healthy Living
• Healthcare Workforce Capacity
• Inadequate Behavioral Health Services
Using this information as a building block for improving health and wellness in the northern NH
area alongside the known ca
pacity of Community Health Workers(CHW) across the United states that address these issues, a
survey was developed and implemented to gain a better understanding of potential incorporation
of CHWs into local health and human services for a comprehensive approach to whole patient
care.
5
Community Health Worker Assessment 2017
Summary of Findings*
Key findings from the Community Health Worker Survey:
• 90% of all respondents are very to extremely interested in learning about CHWs.
• 95.5% see CHWs as relevant to their organizational needs, with 4.5% stating CHWs may
not be relevant.
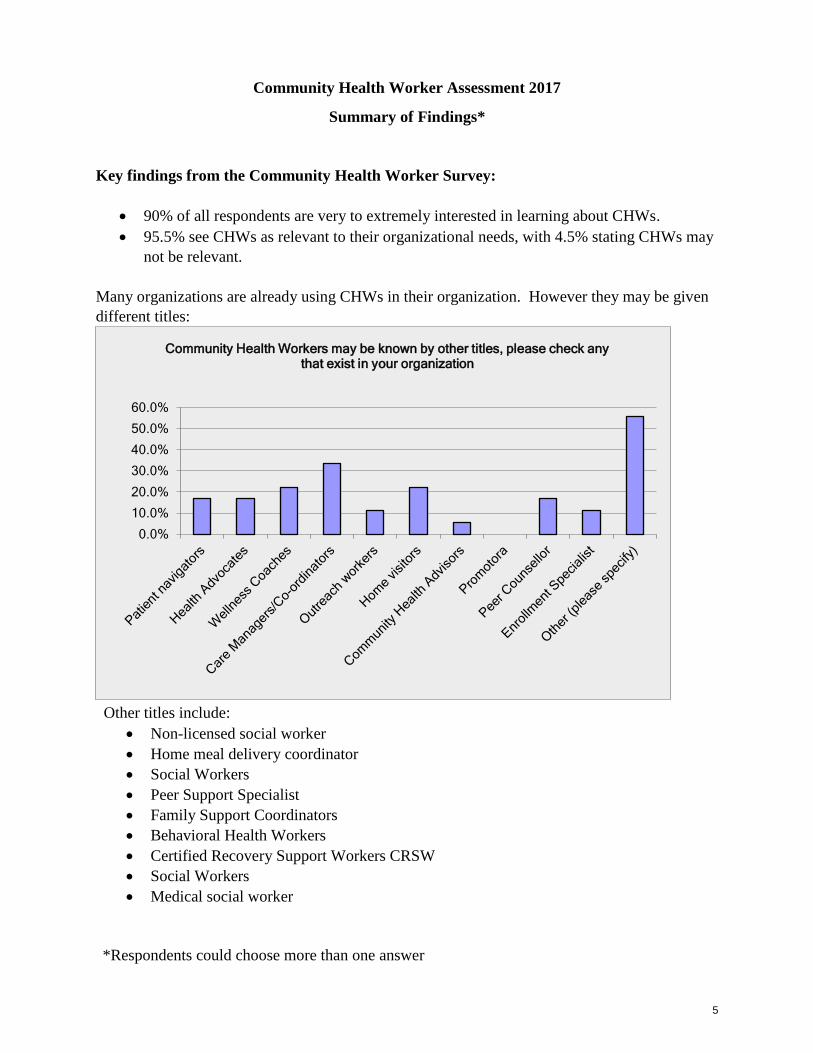
Many organizations are already using CHWs in their organization. However they may be given
different titles:
Other titles include:
• Non-licensed social worker
• Home meal delivery coordinator
• Social Workers
• Peer Support Specialist
• Family Support Coordinators
• Behavioral Health Workers
• Certified Recovery Support Workers CRSW
• Social Workers
• Medical social worker
*Respondents could choose more than one answer
0.0%
10.0%
20.0%
30.0%
40.0%
50.0%
60.0%
Community Health Workers may be known by other titles, please check any that exist in your organization
6
50% of all respondents stated they could “absolutely” imagine CHWs integrated into their
organization and all others said it could be possible.
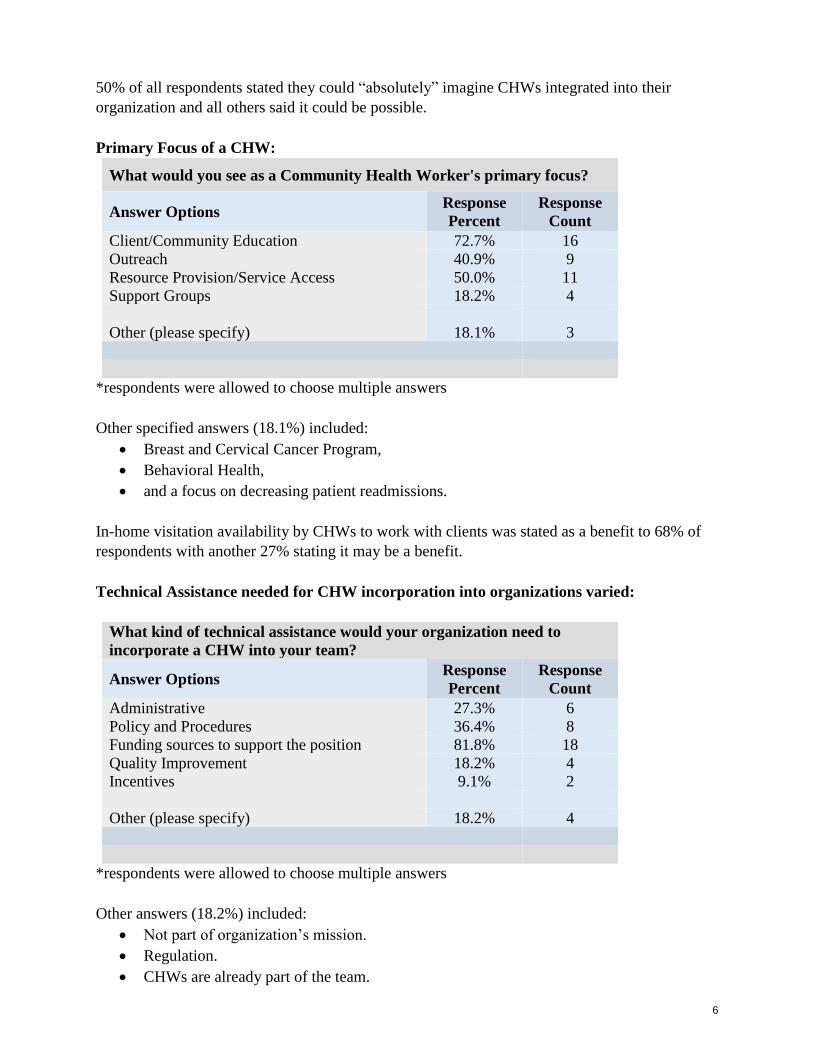
Primary Focus of a CHW:
What would you see as a Community Health Worker's primary focus?
Answer Options Response
Percent
Response
Count
Client/Community Education 72.7% 16
Outreach 40.9% 9
Resource Provision/Service Access 50.0% 11
Support Groups 18.2% 4
Other (please specify) 18.1% 3
*respondents were allowed to choose multiple answers
Other specified answers (18.1%) included:
• Breast and Cervical Cancer Program,
• Behavioral Health,
• and a focus on decreasing patient readmissions.
In-home visitation availability by CHWs to work with clients was stated as a benefit to 68% of
respondents with another 27% stating it may be a benefit.
Technical Assistance needed for CHW incorporation into organizations varied:
What kind of technical assistance would your organization need to
incorporate a CHW into your team?
Answer Options Response
Percent
Response
Count
Administrative 27.3% 6
Policy and Procedures 36.4% 8
Funding sources to support the position 81.8% 18
Quality Improvement 18.2% 4
Incentives 9.1% 2
Other (please specify) 18.2% 4
*respondents were allowed to choose multiple answers
Other answers (18.2%) included:
• Not part of organization’s mission.
• Regulation.
• CHWs are already part of the team.

7
Lack of funding for education/initial course fees.
Barriers for the use of CHWs correlated to the necessary Technical Assistance:
Other barriers (36.36%) noted:
• A Volunteer CHW may work, but need to have a job responsibility.
• Bureaucracy re: insurance/reimbursement.
• Funding - State Agency.
• Peer support already in place.
• Not enough personnel.
CHW Compensation:
.
8
It was stated that 50% of workers currently used with roles similar to CHWs are being funded
as a paid staff member and 40% are grant/temporarily funded. The remaining 10% are not
funded.
Other comments from CHW survey respondents:
• “Essential if we are trying to support elders in their homes.”
• “Social worker acts as the community health worker, not all senior center sites have this
capacity. Need to work on reducing the stigma of senior centers so more people have
access to the resources.”
• “Community Health Workers can be helpful in providing more case management and
more investigation than we are able with our high case loads.”
9
Conclusion and Dissemination Plans
The survey was delivered to individuals representing local health and human service providers,
faith-based community representatives and social service organizations. In some cases, this was
the first opportunity to share Community Health Worker(CHW) roles and capabilities. The
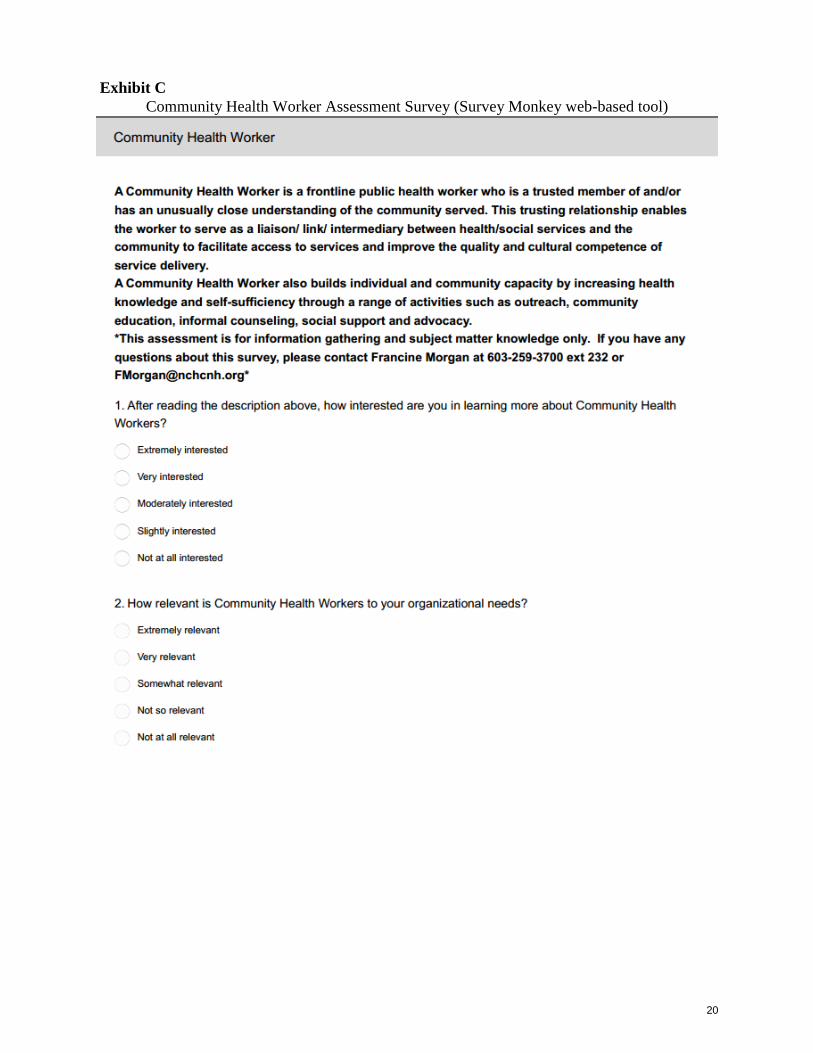
American Public Health Association “ A community health worker is a frontline public health
worker who is a trusted member of and/or has an unusually close understanding of the
community served. This trusting relationship enables the worker to serve as a
liaison/link/intermediary between health/social services and the community to facilitate access to
services and improve the quality and cultural competence of service delivery.
A community health worker also builds individual and community capacity by increasing health
knowledge and self-sufficiency through a range of activities such as outreach, community
education, informal counseling, social support and advocacy.” Once the definition of the
Community Health Worker was clarified, a majority (90%) stated their interest in potential
integration of CHWs is very high.
The CHNA data show consistent themes that directly reflect a need to address the social
determinants of health, the primary role of Community Health Workers and complement the
information gained through the surveys process.
The dissemination of assessment findings will occur in several ways. The North Country Health
Consortium Board of Directors is made up of the leadership of North Country stakeholder
organizations. These include all of the regional Federally Qualified Health Centers, all of the
regional Critical Access Hospitals, the community mental health center, home health agencies,
long-term care facilities, tri-county community action programs, and several other social service
organizations. The assessment findings will be reviewed by the Board at a monthly meeting, and
program progress will be discussed quarterly. Assessment findings will be reported at a
quarterly CHW Coalition Meeting, and posted on the NCHC web site. Results will be shared
with the Department of Health and Human Services, as requested. A press release will be
disseminated to local media that describes the role of CHWs, results of the survey, and CHW
training opportunities.
10
Exhibit A
Community Health Needs Assessment
Executive Summary
As part of the 2016 North Country Regional Community Health Needs Assessment, 181
community leaders and 528 community members were surveyed to gather information about
health status, health concerns, unmet health needs and services, and suggestions for improving
health in the community.
Key findings from the Community Survey:
The top six serious health issues in the North Country that were identified by the
community assessment surveys were:
• Substance Misuse (includes drugs, opioids, heroin, etc.) (83.9%)
• Obesity/Overweight (79%)
• Alcohol Abuse (74.4%)
• Low-income/Poverty (74%)
• Physical Inactivity (72.9o/o)
• Smoking and Tobacco Use (72.1%)
The top six serious health concerns for the North Country that contribute to the most
serious health issues were identified to be:
• Drug Abuse (84%)
• Lack of Dental Insurance (79%)
• Cost of Prescription Drugs (78%)
• Lack of Physical Exercise (75%)
• Cost of Healthy Foods (74%)
• Alcohol Abuse (72%)
Community members identified the following programs, services or strategies to improve
the health of the community:
• Access to Healthcare and Services: Need urgent care facilities; weekend and
evening availability for urgent care beyond emergency departments; addiction
treatment and supports as well as Suboxone prescribers; access to mental health
services, including psychiatrists and child development specialists; continuum of care
services for mental health and substance misuse, appropriately addressing the social
determinants of health; in-home supports for children with emotional and
developmental needs; expanded healthcare workforce, including primary care
providers, actual MDs/DOs, dermatologists, pediatricians, functional medicine,
specialists, and internal medicine; need a naturopath care giver; access to more
affordable prescription medications; access to more affordable dental services,
especially for the uninsured; more community-based services for seniors; assistance
with navigating the marketplace; more safety net services for low-income families;
COPD and cardiac rehab; local cancer care; more of a focus on preventative care versus
sick care; better in-home care for elderly by qualified individuals; more police to help

11
combat the drug abuse problems in the region; access to on-call nurses; develop more
homeless shelters out of vacant buildings; better insurance benefits that cover gym
memberships and decrease other out-of-pocket costs;
need exchange programs; more patient education classes at hospitals; hospice house;
free diabetes classes; medical art therapy programing; autism services, such as OT and
ABA therapy, and more funding to support parents who are paying for these services;
palliative care outpatient clinic; and weight loss services.
• Environment/Economy: Better public transportation options; opportunities
for families to have fun; less fast food; more affordable housing; lower taxes for
homeowners; better paying jobs that provide benefits, especially health insurance;
varied exercise programs; affordable rec programs for kids; more programs and
activities for middle age group; more safe places to walk, cross-country ski, and
organized events; more recycling; more 5K races or community run/walks; enhance
walking areas to entice residents to walk; more community recreation centers; more
businesses and social activities; access to more affordable fresh and healthy food; more
integration between agencies and institutions; more healthy dining options; better
handicapped accessibility universally; support services for the elderly to age in-place;
more jobs and industry; more farm to table programs; more spaces for community
gardens; more inclusive activities for people with disabilities; more outdoor gatherings,
such as outdoor movies or music and treasure hunts; access to indoor walking space;
develop initiative for retaining young people in the region; create a pedestrian walkway
that connects to shops and services; offer extended hours for water aerobics, water
jogging, and low-impact aerobics for adult at local rec center; library expansion to
include cultural offerings and plant swaps; dedicated bike lanes; adult organized sports;
continue to develop technology infrastructure; expand volunteer opportunities for teens;
affordable bus trips for seniors to different areas and places of interest; and public
health challenges, such as community-wide walking challenge; lower cost childcare.
• Education: Mental health and substance abuse prevention education in school,
especially young children; better promotion of community activities and events that are
open to the public; intensive primary and secondary prevention education programs;
parenting classes; education for healthy lifestyles for all ages; more holistic health
groups and education; cooking classes for local food pantry and community meals
participants; reduce stigma associated with addiction; on-going health seminars; better
education for police and healthcare providers who interact with people with mental
illness or substance abuse issues; education around cost-effective ways to eat healthy;
teen cooking classes; create hotline for food, cooking, and shopping to assist people
trying to learn better eating habits; community forums, public radio, and TV spot ads
for promotion of education and activities; life skills education for teens; community
education on food allergies; education for elderly regarding Medicare choices, when to
register, and how to prepare for nursing home placement; structured health education in
schools; hygiene education in schools; well-advertised support groups for drug abuse
assistance and help; one-on-one outreach to individuals living in poverty or victims of
substance abuse to develop a sense of self-worth and coping skills and an opportunity
to become a visible member of the community; and community food drives with
nutrition education.
12
Key findings from the Key Informant Survey:
The top five serious health issues in the North Country, as identified by key informants,
were:
• Substance Misuse (drugs, opioids, heroin, etc.) (94%)
• Alcohol Abuse (91%)
• Obesity/Overweight (90%)
• Mental Health Problems (89%)
• Low-income/Poverty (85%)
Key informants identified the following as challenges in the North Country healthcare
system:
• Access to Healthcare: Healthcare costs are prohibitive; transportation to needed
medical treatment and services remains a barrier for residents; long travel distances to
specialists; low incomes families need services but lack the necessary resources; and
Medicaid transportation assistance is cumbersome with the spenddown requirements.
• Affordable Health and Dental Insurance: High deductibles and co-pays;
premiums are too costly; many North Country residents lack health insurance; health
insurance plans are inadequate and won't cover all of the services that an individual
ultimately needs; lack of dental insurance in the region; lower reimbursement limits the
number of tests that providers can order; and conflicting recommendations between the
government and expert recommendations for care.
• Barriers to Healthy Living: Healthy food is costly; cost of medications and
prescription drugs; high cost for exercise and wellness classes and activities; lack
resources for teaching parenting skills to families; lack of community service
opportunities; lack of education regarding healthy living and other determinants of
health for low-income families; smoking and other unhealthy behaviors lead to chronic
illnesses that become costly and disabling, therefore have an impact on the economy;
access to dental care; obesity; need to shift the mindset to prevention versus treatment;
and the current alcohol and drug dependence.
• Healthcare Workforce Capacity: Lack providers in the region; the high turnover
rates for primary care and specialists affects patient relationship; lack of jobs for
spouses of providers who want to work in the region; communication among the
healthcare workforce remains problematic, especially between hospitals and primary
care; expanded hours for healthcare services is needed, but facilities lack the resources
to pay for the additional staffing; patients' ability to pay for services affects workforce
and the ability to hire; and difficult to attract and retain qualified, quality providers.
• Inadequate Behavioral Health Services: Inadequate behavioral health treatment
and resources, including for mental health, alcohol, and substance use treatment; stigma
associated with treatment; providers need to take a "whole-person" approach; better
processes for referral as current wait times for treatment are not acceptable; need more
behavioral health workforce; and adequate coverage for services in insurance plans.

13
Key informants identified the following new or existing programs or services that could be
implemented or enhanced to improve the health of the residents in the North Country:
• Education: Adult education around fitness; evening and summer classes offered
at schools for adults, including sewing, gardening, Spanish, basket weaving, etc.;
healthy eating seminars; more programs for adults; more educational programs on drug
misuse; invest in local workforce to create opportunities for advancement; increased
educational opportunities for healthcare positions; parenting programs; free or low-cost
nutrition education; community education programs to teach how to shop and cook
healthy meals; raise awareness of services that are available in the region, as many are
unaware and may be traveling longer distances for services; and offer "how to
recognize mental health issues" workshops; education on home economics.
• Expanded Services: Including substance abuse and mental health services; drug
and alcohol abuse treatment centers; more veteran's services; add Certified Health
Educators into school curriculums as well as health, physical, and mental health
programs; more physical activities for seniors; half-way house for those struggling with
addiction; cardiac ' rehab; early screening for disabilities; mobile preventative services
and testing unit to go to communities to provide care; providers offer house calls for
seniors; develop a cancer treatment center and a diabetes center; more narcotics support
groups; make alternative healthcare options available; smoking cessation programs;
local cancer treatment; more public health dentistry; local laboratory services included
in insurance (Anthem) network; outpatient clinic open 7 days a week; better outreach
for services across the board; recovery supports, including workers and housing; adult
dental services; continuity of care services upon discharge; increase screening for
suicide; dermatology; a mental health respite program to help those in need or crisis
stabilization; and employ Community Health Workers.
• Enhanced Environment: Better walking options, including walking trails and
better sidewalks; funding to expand community recreation center facilities and services;
indoor walking areas; better public transportation and accommodations for those with
behavioral health issues; more grocery stores with affordable options; farm-to-table
initiatives; workplace integration of health improvement incentives and initiatives; free
or low-cost exercise classes; set community health improvement goals; increase
physical activities for all ages; institute fitness challenges; and start walking groups and
create bike-friendly roads.
14
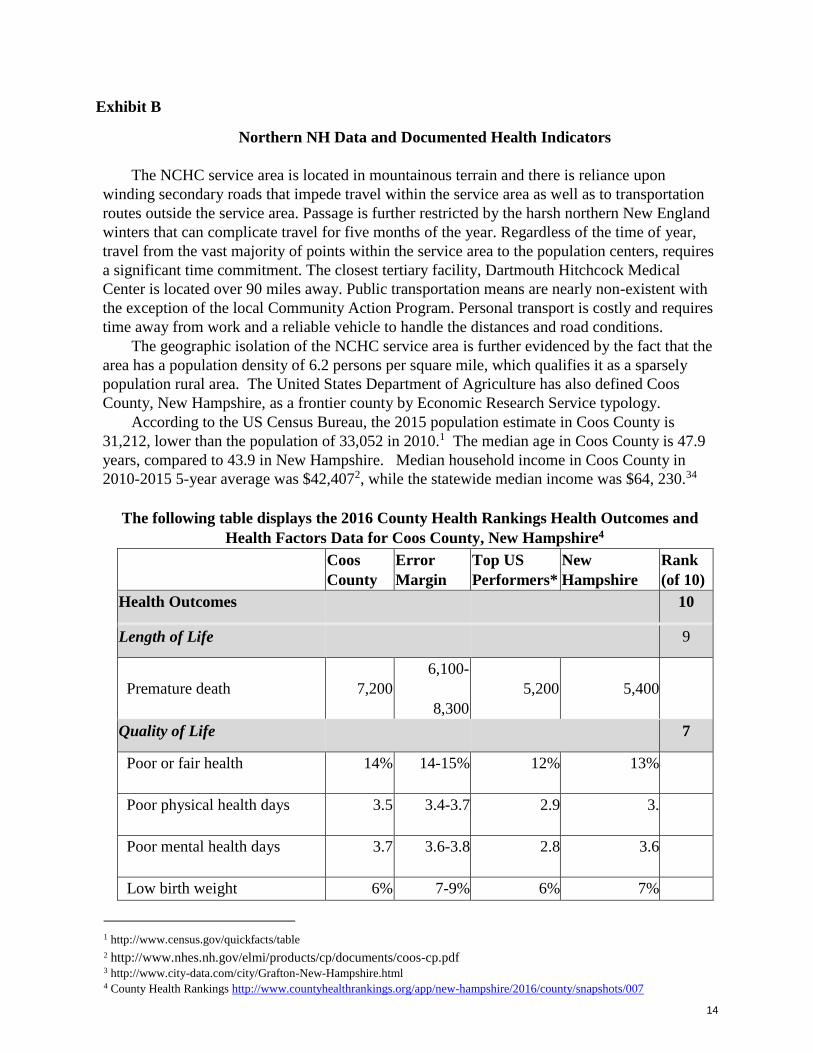
Exhibit B
Northern NH Data and Documented Health Indicators
The NCHC service area is located in mountainous terrain and there is reliance upon
winding secondary roads that impede travel within the service area as well as to transportation
routes outside the service area. Passage is further restricted by the harsh northern New England
winters that can complicate travel for five months of the year. Regardless of the time of year,
travel from the vast majority of points within the service area to the population centers, requires
a significant time commitment. The closest tertiary facility, Dartmouth Hitchcock Medical
Center is located over 90 miles away. Public transportation means are nearly non-existent with
the exception of the local Community Action Program. Personal transport is costly and requires
time away from work and a reliable vehicle to handle the distances and road conditions.
The geographic isolation of the NCHC service area is further evidenced by the fact that the
area has a population density of 6.2 persons per square mile, which qualifies it as a sparsely
population rural area. The United States Department of Agriculture has also defined Coos
County, New Hampshire, as a frontier county by Economic Research Service typology.
According to the US Census Bureau, the 2015 population estimate in Coos County is
31,212, lower than the population of 33,052 in 2010.1 The median age in Coos County is 47.9
years, compared to 43.9 in New Hampshire. Median household income in Coos County in
2010-2015 5-year average was $42,4072, while the statewide median income was $64, 230.34
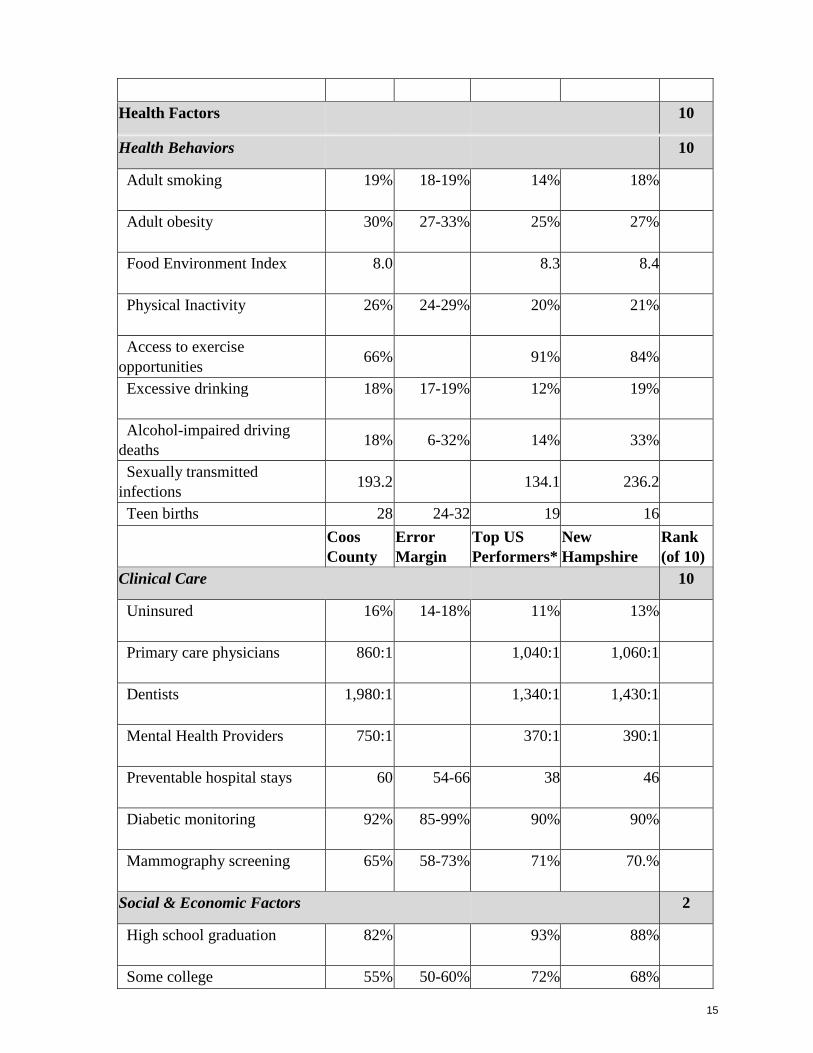
The following table displays the 2016 County Health Rankings Health Outcomes and
Health Factors Data for Coos County, New Hampshire4
Coos
County
Error
Margin
Top US
Performers*
New
Hampshire
Rank
(of 10)
Health Outcomes 10
Length of Life 9
Premature death 7,200
6,100-
8,300
5,200
5,400
Quality of Life 7
Poor or fair health 14% 14-15% 12% 13%
Poor physical health days 3.5 3.4-3.7 2.9 3.
Poor mental health days 3.7 3.6-3.8 2.8 3.6
Low birth weight 6% 7-9% 6% 7%
1 http://www.census.gov/quickfacts/table
2 http://www.nhes.nh.gov/elmi/products/cp/documents/coos-cp.pdf 3 http://www.city-data.com/city/Grafton-New-Hampshire.html 4 County Health Rankings http://www.countyhealthrankings.org/app/new-hampshire/2016/county/snapshots/007
15
Health Factors 10
Health Behaviors 10
Adult smoking 19% 18-19% 14% 18%
Adult obesity 30% 27-33% 25% 27%
Food Environment Index 8.0 8.3 8.4
Physical Inactivity 26% 24-29% 20% 21%
Access to exercise
opportunities 66% 91% 84%
Excessive drinking 18% 17-19% 12% 19%
Alcohol-impaired driving
deaths 18% 6-32% 14% 33%
Sexually transmitted
infections 193.2 134.1 236.2
Teen births 28 24-32 19 16
Coos
County
Error
Margin
Top US
Performers*
New
Hampshire
Rank
(of 10)
Clinical Care 10
Uninsured 16% 14-18% 11% 13%
Primary care physicians 860:1 1,040:1 1,060:1
Dentists 1,980:1 1,340:1 1,430:1
Mental Health Providers 750:1 370:1 390:1
Preventable hospital stays 60 54-66 38 46
Diabetic monitoring 92% 85-99% 90% 90%
Mammography screening 65% 58-73% 71% 70.%
Social & Economic Factors 2
High school graduation 82% 93% 88%
Some college 55% 50-60% 72% 68%
16
Unemployment 5.8 3.5% 4.3%
Children in poverty 23% 16-29% 13% 13%
Income inequality 4.3 4.0-4.7 3.7 4.2
Children in single-parent
households 38% 32-44% 21% 28%
Social associations 12.8 22.1 10.3
Violent crime 143 59 181
Injury deaths 80 67-94 51 59
Physical Environment 1
Air pollution - particulate
matter 10.6 9.5 10.5
Drinking water violations yes no
Severe housing problems 16% 14-19% 9% 16%
Driving alone to work 80% 77-83% 71% 81%
Long commute- driving alone 23% 21-26% 15% 38%
*90th percentile, i.e., only 10% are better. Note: Blank values reflect unreliable or missing
data
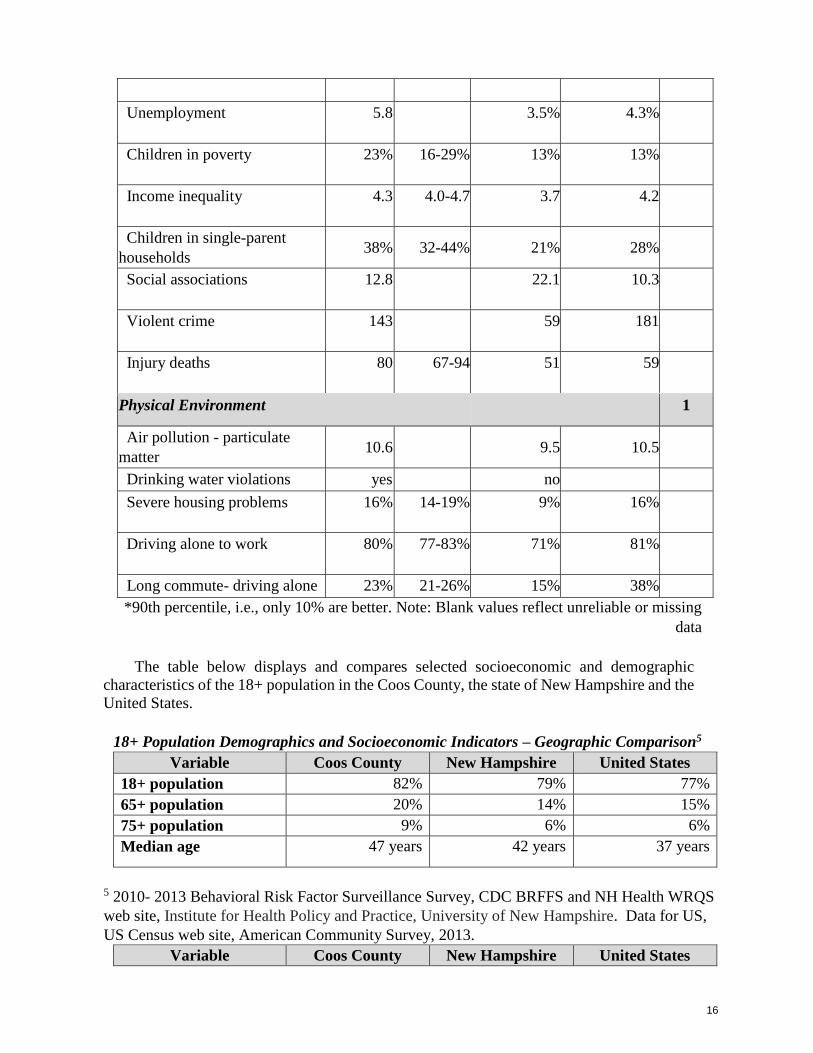
The table below displays and compares selected socioeconomic and demographic
characteristics of the 18+ population in the Coos County, the state of New Hampshire and the
United States.
18+ Population Demographics and Socioeconomic Indicators – Geographic Comparison5
Variable Coos County New Hampshire United States
18+ population 82% 79% 77%
65+ population 20% 14% 15%
75+ population 9% 6% 6%
Median age 47 years 42 years 37 years
5 2010- 2013 Behavioral Risk Factor Surveillance Survey, CDC BRFFS and NH Health WRQS
web site, Institute for Health Policy and Practice, University of New Hampshire. Data for US,
US Census web site, American Community Survey, 2013.
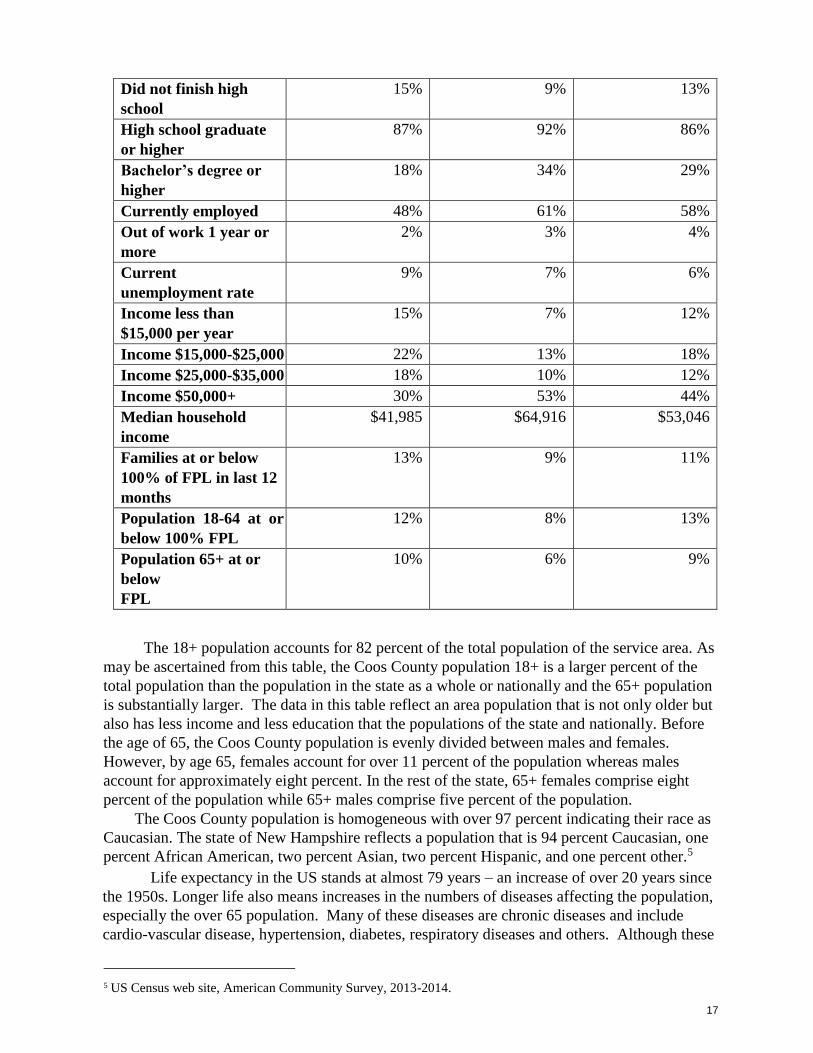
Variable Coos County New Hampshire United States
17
Did not finish high
school
15% 9% 13%
High school graduate
or higher
87% 92% 86%
Bachelor’s degree or
higher
18% 34% 29%
Currently employed 48% 61% 58%
Out of work 1 year or
more
2% 3% 4%
Current
unemployment rate
9% 7% 6%
Income less than
$15,000 per year
15% 7% 12%
Income $15,000-$25,000 22% 13% 18%
Income $25,000-$35,000 18% 10% 12%
Income $50,000+ 30% 53% 44%
Median household
income
$41,985 $64,916 $53,046
Families at or below
100% of FPL in last 12
months
13% 9% 11%
Population 18-64 at or
below 100% FPL
12% 8% 13%
Population 65+ at or
below
FPL
10% 6% 9%
The 18+ population accounts for 82 percent of the total population of the service area. As
may be ascertained from this table, the Coos County population 18+ is a larger percent of the
total population than the population in the state as a whole or nationally and the 65+ population
is substantially larger. The data in this table reflect an area population that is not only older but
also has less income and less education that the populations of the state and nationally. Before
the age of 65, the Coos County population is evenly divided between males and females.
However, by age 65, females account for over 11 percent of the population whereas males
account for approximately eight percent. In the rest of the state, 65+ females comprise eight
percent of the population while 65+ males comprise five percent of the population.
The Coos County population is homogeneous with over 97 percent indicating their race as
Caucasian. The state of New Hampshire reflects a population that is 94 percent Caucasian, one
percent African American, two percent Asian, two percent Hispanic, and one percent other.5
Life expectancy in the US stands at almost 79 years – an increase of over 20 years since
the 1950s. Longer life also means increases in the numbers of diseases affecting the population,
especially the over 65 population. Many of these diseases are chronic diseases and include
cardio-vascular disease, hypertension, diabetes, respiratory diseases and others. Although these
5 US Census web site, American Community Survey, 2013-2014.
18
diseases affect people of all age ranges, patients over 65 tend to have more than one chronic
diseases or co-morbidities. More than 65 percent of Americans 65+ and 75 percent of those 80+
have multiple chronic diseases.
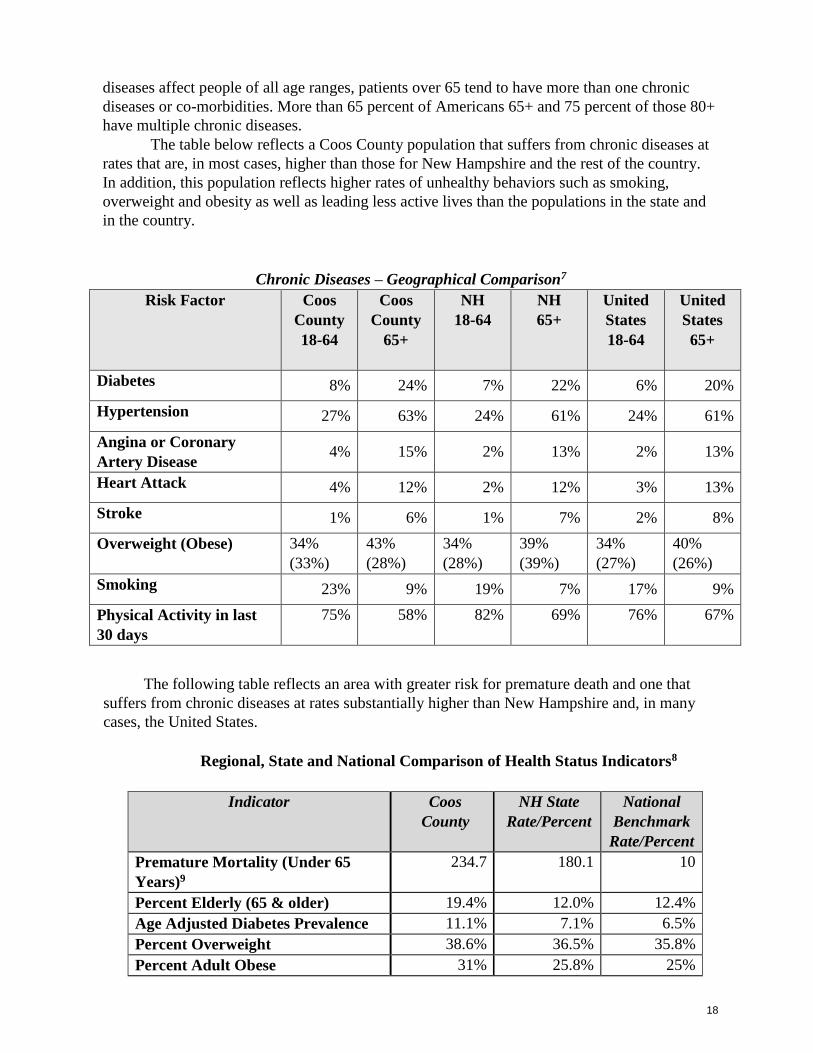
The table below reflects a Coos County population that suffers from chronic diseases at
rates that are, in most cases, higher than those for New Hampshire and the rest of the country.
In addition, this population reflects higher rates of unhealthy behaviors such as smoking,
overweight and obesity as well as leading less active lives than the populations in the state and
in the country.
Chronic Diseases – Geographical Comparison7
Risk Factor Coos
County
18-64
Coos
County
65+
NH
18-64
NH
65+
United
States
18-64
United
States
65+
Diabetes 8% 24% 7% 22% 6% 20%
Hypertension 27% 63% 24% 61% 24% 61%
Angina or Coronary
Artery Disease 4% 15% 2% 13% 2% 13%
Heart Attack 4% 12% 2% 12% 3% 13%
Stroke 1% 6% 1% 7% 2% 8%
Overweight (Obese) 34%
(33%)
43%
(28%)
34%
(28%)
39%
(39%)
34%
(27%)
40%
(26%)
Smoking 23% 9% 19% 7% 17% 9%
Physical Activity in last
30 days
75% 58% 82% 69% 76% 67%
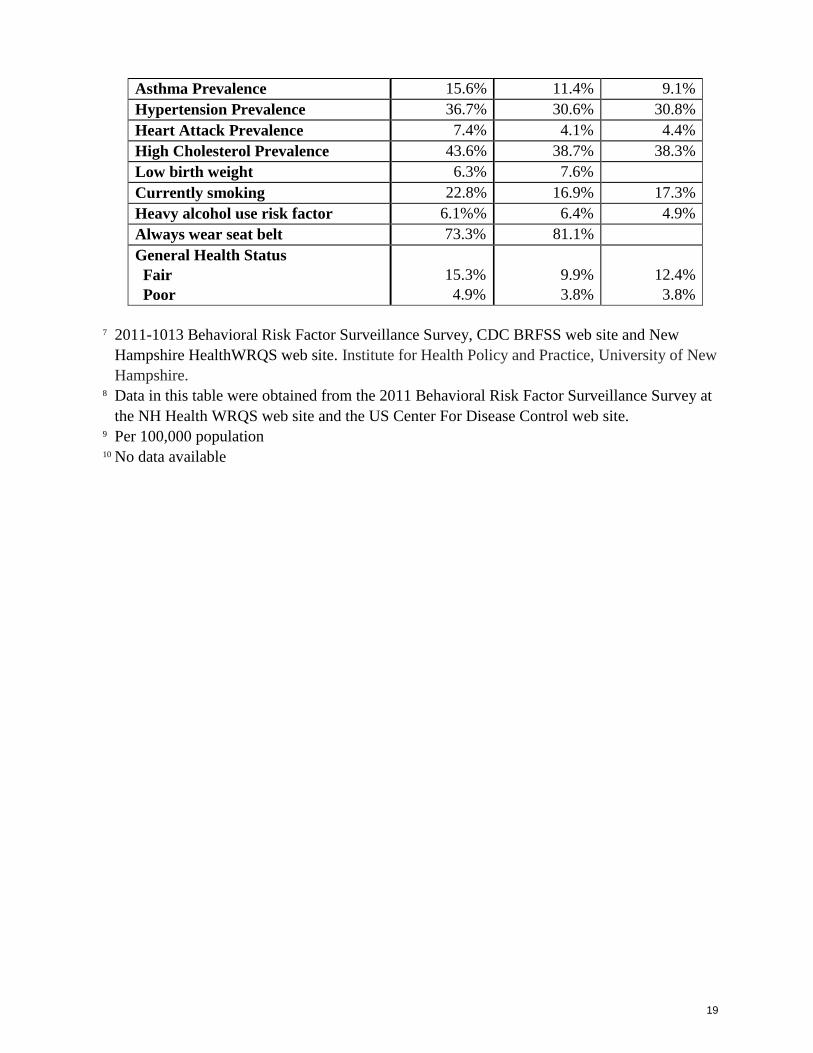
The following table reflects an area with greater risk for premature death and one that
suffers from chronic diseases at rates substantially higher than New Hampshire and, in many
cases, the United States.
Regional, State and National Comparison of Health Status Indicators8
Indicator Coos
County
NH State
Rate/Percent
National
Benchmark
Rate/Percent
Premature Mortality (Under 65
Years)9
234.7 180.1 10
Percent Elderly (65 & older) 19.4% 12.0% 12.4%
Age Adjusted Diabetes Prevalence 11.1% 7.1% 6.5%
Percent Overweight 38.6% 36.5% 35.8%
Percent Adult Obese 31% 25.8% 25%
19
Asthma Prevalence 15.6% 11.4% 9.1%
Hypertension Prevalence 36.7% 30.6% 30.8%
Heart Attack Prevalence 7.4% 4.1% 4.4%
High Cholesterol Prevalence 43.6% 38.7% 38.3%
Low birth weight 6.3% 7.6%
Currently smoking 22.8% 16.9% 17.3%
Heavy alcohol use risk factor 6.1%% 6.4% 4.9%
Always wear seat belt 73.3% 81.1%
General Health Status
Fair
Poor
15.3%
4.9%
9.9%
3.8%
12.4%
3.8%
7 2011-1013 Behavioral Risk Factor Surveillance Survey, CDC BRFSS web site and New
Hampshire HealthWRQS web site. Institute for Health Policy and Practice, University of New
Hampshire. 8 Data in this table were obtained from the 2011 Behavioral Risk Factor Surveillance Survey at
the NH Health WRQS web site and the US Center For Disease Control web site. 9 Per 100,000 population 10 No data available
20
Exhibit C
Community Health Worker Assessment Survey (Survey Monkey web-based tool)

21
22
23
24