Community Health Needs Assessment - Sanford Aberdeen ...
106
Sanford Health Network 2012-2013 Community Health Needs Assessment dba Sanford Aberdeen Medical Center EIN# 46-0388596
Transcript of Community Health Needs Assessment - Sanford Aberdeen ...

Sanford Health Network
2012-2013Community Health Needs Assessment
dba Sanford Aberdeen Medical Center EIN# 46-0388596

Sanford Aberdeen Medical Center
Community Health Needs Assessment
2012-‐2013
rev. 6/7/13

2
Table of Contents Page Purpose 5 Acknowledgements 6 Executive Summary 12-‐17 Description of Sanford Aberdeen Medical Center 19 Description of the Community Served 19 Study Design and Methodology
• Health Needs Assessment of Key Stakeholders and Community Leaders • 2011 County Health Profiles • Aging Profiles • Diversity Profiles • Quality Data • Absence of Top Diagnosis • Limitations
20
Primary Research -‐ Summary of the Survey Results 22
• Community Assets/Best Things about the Community
o Figure 1. Level of agreement with statements about the community regarding PEOPLE
o Figure 2. Level of agreement with statements about the community regarding SERVICES AND RESOURCES
o Figure 3. Level of agreement with statements about the community regarding QUALITY OF LIFE
o Figure 4. Level of agreement with statements about the community regarding GEOGRAPHIC SETTING
o Figure 5. Level of agreement with statements about the community regarding ACTIVITIES
22
• General Concerns about the Community
o Figure 6. Level of concern with statements about the community regarding ECONOMIC ISSUES
o Figure 7. Level of concern with statements about the community regarding SERVICES AND RESOURCES
o Figure 8. Level of concern with statements about the community regarding TRANSPORTATION
o Figure 9. Level of concern with statements about the community regarding ENVIRONMENTAL POLLUTION
o Figure 10. Level of concern with statements about the community regarding YOUTH CONCERNS
o Figure 11. Level of concern with statements about the community regarding SAFETY CONCERNS
26
3
• Community Health and Wellness Concerns o Figure 12. Level of concern with statements about the community regarding
ACCESS TO HEALTH CARE o Figure 13. Level of concern with statements about the community regarding
SUBSTANCE USE AND ABUSE o Figure 14. Level of concern with statements about the community regarding
PHYSICAL HEALTH o Figure 15. Level of concern with statements about the community regarding
MENTAL HEALTH o Figure 16. Level of concern with statements about the community regarding
ILLNESS
30
• Delivery of Health Care in the Community
o Figure 17. How well topics related to DELIVERY OF HEALTH CARE in the community are being addressed
33
• Personal Health Care Information
o Cancer Screening o Health Care Coverage o Primary Care Provider o Respondent’s Primary Care Provider o Respondents Representing Chronic Disease o Distance to Access Medical Care
34
• Demographic Information
o Age o Education o Gender
38
Secondary Research
• Health Outcomes o Mortality o Morbidity
• Health Factors
o Health Behaviors o Clinical Care o Social and Economic Factors o Physical Environment o Demographics o Population by Age o Housing o Economic Security o Diversity Profile
39
Health Needs Identified 46 Implementation Strategy 47

4
Appendix • 2011 Brown County Health Profile • Definition of Health Variables • Aging Profiles • Diversity Profiles • Maps:
o Mortality – Map 1 – Premature Death o Morbidity – Maps 2-‐5 o Health Factors – Maps 6-‐12 o Clinical Care – Maps 13-‐20 o Social and Economic – Maps 21-‐27 o Physical Environment – Maps 28-‐31 o Demographic – Maps 32-‐36
• Table 1 – Asset Map • Table 2 – Prioritization Worksheet
50

5
Sanford Aberdeen Medical Center Community Health Needs Assessment
2012-‐2013
Purpose Sanford Aberdeen Medical Center is part of Sanford Health, an integrated health system headquartered in the Dakotas and the largest rural not-‐for-‐profit health care system in the nation with locations in 126 communities in eight states. Sanford Aberdeen Medical Center has undertaken a community health needs assessment as required by the Patient Protection and Affordable Care Act and as part of the IRS 990 requirement for a not-‐for-‐profit health system to address issues that have been assessed as unmet needs in the community. PPACA requires that each hospital must have: (1) conducted a community health needs assessment in the applicable taxable year; (2) adopted an implementation strategy for meeting the community health needs identified in the assessment; and (3) created transparency by making the information widely available. For tax exempt hospital organizations that own and operate more than one hospital facility, as within Sanford Health, the new tax exemption requirements will apply to each individual hospital. The first required needs assessment falls within the fiscal year July 1, 2012 through June 30, 2013. The purpose of a community health needs assessment is to develop a global view of the population’s health and the prevalence of disease and health issues within our community. Findings from the assessment serve as a catalyst to align expertise and develop a Community Investment/Community Benefit plan of action. There is great intrinsic value in a community health needs assessment when it serves to validate, justify and defend not-‐for-‐profit status and create opportunity to identify and address public health issues from a broad perspective. A community health needs assessment is critical to a vital Community Investment/Community Benefit Program that builds on community assets, promotes collaboration, improves community health, and promotes innovation and research. A community health needs assessment also serves to validate progress made toward organizational strategies and provides further evidence for retaining not-‐for-‐profit status.

6
Acknowledgements Sanford Health would like to acknowledge and thank the Steering Committees and the Sanford Aberdeen Community Health Needs Assessment Team for their expertise while performing the assessment and analysis of the community health data. The assessment provides support for the future directions of our work as the region’s leading health care system. Sanford Enterprise Steering Group:
• Enterprise Lead: Carrie McLeod, MBA, MM, LRD,CDE; Office of Health Care Reform, Community Benefit/Community Health Improvement
• Sioux Falls Region Co-‐Lead: Bruce Viessman, CFO, Sanford Health Network Sioux Falls • Mike Begeman, Chief of Staff/Vice President of Public Affairs • Maxine Brinkman, CPA; Director of Financial Decisions and Operations Support • Michelle Bruhn, CPA; CFO, Health Services Division • Randy Bury, COO, Sanford Medical Center USD • Jane Heilman, BA; Senior Corporate Communication Strategist • Kristie Invie, BS, MBA; Vice President for Clinical Performance • Joy Johnson, Bemidji Region Co-‐Lead, VP, Business Development and Marketing, Bemidji • Ashley King, Bemidji Co-‐Lead, Intern in Bemidji • JoAnn Kunkel, CFO, Sanford Health • Tiffany Lawrence, CPA; Fargo Region Co-‐Lead, CFO, Sanford Medical Center Fargo • Martha Leclerc, MS; Vice President, Office of Health Reform and Strategic Payment • Doug Nowak, MBA; Executive Director, Decision Support • Heather Vanmeveren, CPA; Director of Accounting
Sanford Aberdeen Medical Center Steering Group:
• Enterprise Lead: Carrie McLeod, MBA, MM, LRD,CDE; Office of Health Care Reform, Community Benefit/Community Health Improvement
• Gordon Larson, CEO, Sanford Aberdeen Medical Center • Amy Munsen, Social Work, Sanford Aberdeen Medical Center • Paul DeVoe, Public Affairs-‐Aberdeen, Sanford Health
We express our gratitude to the following individuals and groups for their participation in this study. We extend special thanks to the city mayors, city council/commission members, physicians, nurses, school superintendents and school board members, parish nurses, representatives from the Native American community, Faith Community Leaders, as well as legal services, mentally and physically disabled, social services, non-‐profit organizations, and financial services for their participation in this work. Together we are reaching our vision “to improve the human condition through exceptional care, innovation and discovery.” Our Guiding Principles:
• All health care is a community asset • Care should be delivered as close to home as possible • Access to health care must be provided regionally • Integrated care delivers the best quality and efficiency • Community involvement and support is essential to success • Sanford Health is invited into the communities we serve

7
The following key community stakeholders participated in this assessment work: • Robbie Aamot, Pharmacist, Sanford Aberdeen, Aberdeen, SD • Lisa Adler, Regional Director, Lutheran Social Services, Groton, SD • Tom Agnitsch, Executive Director, United Way, Aberdeen, SD • John Aman, Developer, J & J Properties, Aberdeen, SD • Lisa Anderson, Marketing Consultant, Dakota Broadcasting, Aberdeen, SD • Logan Anderson, Sports Director, Dakota Broadcasting, Aberdeen, SD • Bridget Arneston, Patient Access Representative, Sanford Aberdeen, Aberdeen, SD • Josep B. Axtmann, Clinical Supervisor, Lab, Sanford Aberdeen, Aberdeen, SD • James Barringer, Executive VP, Aberdeen Development Corporation, Aberdeen, SD • Sarah Bartels, Director of the Women’s Center, Sanford Aberdeen, Aberdeen, SD • Amy Batta, Critical Care Nurse, Sanford Aberdeen, Aberdeen, SD • Cindy Beard, Director, RSVP/Foster Grandparent Program, Aberdeen, SD • Lois Beckner, Cultural Arts Program Coordinator, Parks Department, Aberdeen, SD • Susan Berreth, PACU Nurse, Sanford Aberdeen, Aberdeen, SD • Jan Beyers, Secretary, SD Department of Health, Aberdeen, SD • Thomas Black, Owner/Inspector, Prairie Home Inspections, Aberdeen, SD • Lisa Brown, Social Worker, Volunteers of America, Aberdeen, SD • Felicia Callisaya, Switchboard Operator, Sanford Aberdeen, Aberdeen, SD • Cory Bollinger, Publisher, American News, Aberdeen, SD • Stacy Braun, Executive Directcor, Aberdeen Area Arts Council, Aberdeen, SD • Shannon Broderson, Distribution Administrative Assistant, Coca Cola, Aberdeen, SD • Derik Budig, Associate Director, YMCA, Aberdeen, SD • Carla Burns, Business Consultant, Small Business Development Center, Aberdeen, SD • Mark A. Caven, Director, Aberdeen Flying Service, Aberdeen, SD • Brandon Christiansen, Property Manager, Lakewood Mall, Aberdeen, SD • Bob Compton, Senior VP, Dacotah Banks, Inc. Aberdeen, SD • Carole Curtis, Retired, Ipswich, SD • Becky Desens, Senior Secretary, Online & Continuing Education Dept., Northern State University,
Aberdeen, SD • Paul Devoe, Public Affairs, Aberdeen, SD • Laura Dickinson-‐Lee, ER Nurse, Sanford Aberdeen, Aberdeen, SD • Charleen Doerr, Fire Safety Inspection Business Owner, Aberdeen, SD • Donna Ducheneaux, Administrative Assistant, Volunteers of America, Aberdeen, SD • Janel Ellingson, Superintendent, City of Aberdeen Water Works, Aberdeen, SD • Amanda Fair, Room Service Ambassador, Sanford Aberdeen, Aberdeen, SD • Lisa Rose Falcon, Nurse, Sanford Aberdeen, Aberdeen, SD • Kathy Fandrich, Nurse, Aberdeen, SD • Lesley Farmen, Parole Agent, SD Department of Corrections, Aberdeen, SD • Kris Fastenau, Administrative Resource Nurse, Sanford Aberdeen, Aberdeen, SD • Barb Feist, Executive Assistant, Midstates, Inc., Aberdeen, SD • Linda Ferris, Sterilization Tech, Sanford Aberdeen, Aberdeen, SD • Brad Fiechtner, Owner, Kitchen Tune-‐Up, Aberdeen, SD • Joei Fiegler, Residential Supervisor, LSS New Beginnings Center, Aberdeen, SD • D. Fischer, HR Rep, Occupational Health, Aberdeen, SD • Heidi Fisher, Education Coordinator, Sanford Aberdeen, Aberdeen, SD • Tarralee Fischer, ILS Coordinator, LSS New Beginnings Center, Aberdeen, SD

8
• Clarence Fjeldheim, Assistant City Public Works Director, Aberdeen, SD • Kathy Fleming, Nurse, Sanford Aberdeen, Aberdeen, SD • Terry Fleming, Plant Manager, Glacial Lakes Energy, Aberdeen, SD • Julie Fliehs, Pediatric Nurse, Sanford Aberdeen, Aberdeen, SD • Jason Forrest, Regional Coordinator, State of SD Emergency Management, Aberdeen, SD • David Frank, CPA, Eide Bailly, LLP, Aberdeen, SD • Corey Gaulrapp, Child Support Specialist Supervisor, Dept. of Social Services, Aberdeen, SD • Dixie Garrett, Cook, LSS New Beginnings Center, Aberdeen, SD • Jay Gellhaus, Attorney, Aberdeen, SD • Margot Gillette, Executive Director, Aberdeen Downtown Association, Aberdeen, SD • Bobby Goeman, Pediatrics Nurse Practitioner, Sanford Aberdeen, Aberdeen, SD • Dan Goetz, Salesman, Midstates Printing, Aberdeen, SD • Roberta Goldade, Family Life Educator, Sanford CHILD Services • Nathan Golz, Financial Advisor, Wells Fargo Advisors, Aberdeen, SD • Rodney Grismer, Parole Agent, SD DOC Parole Services, Aberdeen, SD • Andrew Grode, Clinical Case Manageer, Lutheran Social Services, Aberdeen, SD • Becky Guffin, Assistant Superintendent, Aberdeen School District, Aberdeen, SD • Wendy Guthmiller, CPA, Guthmiller Accounting, Ltd., Aberdeen, SD • Steve Halvorsen, President, Kyburz-‐Carlson Construction, Aberdeen, SD • Brittany Halvorson, Patient Care Tech, Sanford Aberdeen, Aberdeen, SD • Ashley Hansen, Pharmacist, Sanford Aberdeen, Aberdeen, SD • Harvey Hart, Family Practice Physician, Sanford Aberdeen, Aberdeen, SD • Pam Haug, Community Partnership Manager, The Salvation Army, Aberdeen, SD • Heather Hedges, Nurse, Sanford Aberdeen, Aberdeen, SD • Mark Hedges, Psychologist, Aberdeen Public Schoolls/Lutheran Social Services, Aberdeen, SD • Jennifer Hieb, Director of Marketing & Promotions, Aberdeen Wings, Aberdeen, SD • Terry Helms, Owner, Helms & Associates Civil Engineers, Aberdeen, SD • Michael P. Herman, Executive Director, Boys & Girls Club, Aberdeen, SD • Ruth Hernandez, ICU Resource Nurse, Sanford Aberdeen, Aberdeen, SD • Sara Hernberg, Family Medicine Physician, Sanford Aberdeen, Aberdeen, SD • Doreen Hertel, Secretary, SD Department of Health, Aberdeen, SD • Richard Hickman, Executive Director, SPURS Therapeutic Riding Center, Aberdeen, SD • Thomas Hodgson, Aberdeen, SD • Tasha Hoeltzner, Case Manager, Lutheran Social Services, Aberdeen, SD • Charles Hogg, CEO, Cash Wa Distributing Co., Aberdeen, SD • Lori Hogrefe, RRT, Sanford Aberdeen, Aberdeen, SD • Liesl Hovel, Program Director, Lutheran Social Services, Aberdeen, SD • Deanne Hoyle, HR Manager, North Central Farmers Elevator, Ipswich, SD • Janet Huber, Nurse, Sanford Aberdeen, Aberdeen, SD • Roger Huff, Self-‐Employed Building Contractor, Aberdeen, SD • Theresa Huff, OR/Cath Lab Nurse, Sanford Aberdeen, Aberdeen, SD • Holly Imrie, Mental Health Counselor, Lutheran Social Services, Aberdeen, SD • Richard Inman, Director of Marketing, Banner Engineering, Aberdeen, SD • Bryon Itterman, President, Pentex Management, Aberdeen, SD • Thomas L. Ivey, Owner, Ivey Chiropractic Clinic, Aberdeen, SD • Bob Jensen, Owner, Floor to Ceiling Store, Aberdeen, SD • Jaela Johnson, Legal/Finance Assistant, Primrose Retirement Community, Aberdeen, SD

9
• Jenny Johnson, Monitor Tech, Sanford Aberdeen, Aberdeen, SD • Julie Johnson, Executive Director, Absolutely Aberdeen, Aberdeen, SD • Merissa Johnson, Lab Support Tech, Sanford Aberdeen, Aberdeen, SD • Amy Jones, HR Director, Midstates, Inc., Aberdeen, SD • Mike Jung, President, Jung Construction, Inc., Aberdeen, SD • Stan J. Jung, Branch Manager, US Bank, Aberdeen, SD • Cheryl Kallas, Lab Secretary, Sanford Aberdeen, Aberdeen, SD • Gina Karst, Executive Director, Safe Harbor, Aberdeen, SD • Duane Kavanaugh, Clinical Therapist, Lutheran Social Services, Aberdeen, SD • Erin Keeley, OR/Cath Lab Nurse, Sanford Aberdeen, Aberdeen, SD • Brian Kellar, Regional Director of Operations, Primrose Retirement Communities, Aberdeen, SD • Jennifer Klitzke, Administrative Assistant, United Way, Aberdeen, SD • Arlys Kluess, Nurse, Groton, SD • Hannah Kolb, Clerical, SD Department of Health, Aberdeen, SD • James Kraft, City Council, Aberdeen, SD • Don Krause, Credit Counselor/Housing Counselor, Luthjeran Social Services, Aberdeen, SD • DeAnna Kyburz, Nurse, SD Department of Health, Aberdeen, SD • Amy Lake-‐Harmon, JDC Administrator, Brown County Sheriff’s Office, Aberdeen, SD • Joan Lammon, Radiology/Scheduling, Sanford Aberdeen, Aberdeen, SD • Lynn Lander, Aberdeen City Manager, Aberdeen, SD • Gordon Larson, CEO, Sanford Aberdeen, Aberdeen, SD • Julie Lechner, Sterile Processessing Supervor, Sanford Aberdeen, Aberdeen, SD • Roger Legge, General Manager, Western Printing Co., Aberdeen, SD • Sunny Lester, Occupational Therapist, Sanford Aberdeen, Aberdeen, SD • Britt Locken, Respiratory Therapist, Sanford Aberdeen, Aberdeen, SD • Ashley Majeske, PACU Nurse, Sanford Aberdeen, Aberdeen, SD • Joseph G. Manuel, CEO, Northeastern Mental Health Center, Aberdeen, SD • Bri Matthews, News Director/DJ, Hub City Radio, Aberdeen, SD • Lynne McCafferty, Clinical Therapist, Lutheran Social Services, Aberdeen, SD • Craig McFarland, Manager, McFarland Supply Co., Inc., Aberdeen, SD • Bill McQuillen, Retired, Aberdeen, SD • John McQuillen, Director Communications, Brown County Public Safety Dept., Aberdeen, SD • Scott Meints, Brown County Director of Emergency Management, Aberdeen, SD • Holly Merkel, Nurse, Cardiovascular Stress Test Lab, Sanford Aberdeen, Aberdeen, SD • Laura Millett, City of Aberdeen Risk Manager, Aberdeen, SD • Jill Mohr, HR Manager, Sanford Aberdeen, Aberdeen, SD • Brad Moore, Mid Dakota Regional President, Dakotah Bank, Aberdeen, SD • Brenda Moore, Executive Director, Aberdeen Area Convention & Visitors Bureau, Aberdeen, SD • Frank Moore, Director of Operations, Glacial Lakes Energy, Aberdeen, SD • Scott Moore, Manager, Develoopment Corporation, Ipswich, SD • Rachel Mountain, Retail Manager, Midcontinent Communicaitons, Aberdeen, SD • Heidi Myhre, Nurse, Sanford Aberdeen, Aberdeen, SD • Theresa Nelson, Compliance Specialist, Sanford Aberdeen, Aberdeen, SD • Brett Newton, Graduate Student, Aberdeen, SD • Elaine Nodd, Nurse, Sanford Aberdeen, Aberdeen, SD • Samuel Nyamu, Internal Medicine Physician, Sanford Aberdeen, Aberdeen, SD • Gail Ochs, President, Chamber of Commerce, Aberdeen, SD

10
• Dennis Mike Olson, City of Aberdeen Code Enforcement/Health Officer, Aberdeen, SD • Miranda Pate, CCU Nurse, Sanford Aberdeen, Aberdeen, SD • Megan Piatz, Nuclear Medicine Technologist, Sanford Aberdeen, Aberdeen, SD • Garrett Ortmeier, SD Court Services Officer, Aberdeen, SD • Eric Payne, Insurance Agent, Insurance Plus, Aberdeen, SD • Carl Perry, Senior VP, Progressive Financial Services, Aberdeen, SD • Mindy Pfaff, Student Intern, Lutheran Social Services, Aberdeen, SD • Shari Phillips, Director, Aberdeen Area Senior Center, Aberdeen, SD • Bob Pitz, Director of Operations, Aberdeen Schools, Aberdeen, SD • Heather Poor, Radiologic Technologist, Sanford Aberdeen, Aberdeen, SD • Jessica Popham, Med/Surg/Peds Nurse, Sanford Aberdeen, Aberdeen, SD • Jeff Poppen, CFO, Sanford Aberdeen, Aberdeen, SD • Carmon Privatt, Mental Health Counselor, Lutheran Social Services, Aberdeen, SD • Charlie Pugsley, Nurse, Sanford Aberdeen, Aberdeen, SD • Amanda Rawden, Insurance Agent, Ipswich, SD • Keri Retzer, Med Aide, Golden Living Center, Ipswich, SD • Raquel Reuer, Radiologic Technologist, Sanford Aberdeen, Aberdeen, SD • Thomasina Rohrbach, Recreation Coordinator, LSS New Beginnings Center, Aberdeen, SD • Trudy Rossman, Materials Clerk, Sanford Aberdeen, Aberdeen, SD • Brock Schiferl, Juvenile Corrections Agent, SD Department of Corrections, Aberdeen, SD • Tom Schmitt, Chief Deputy, Brown County Sheriff’s Office, Aberdeen, SD • Sherwood Schrenk, Clinical Supervisor, Lutheran Social Services, Aberdeen, SD • Melissa Schwan, Lab Support/Phlebotomist, Sanford Aberdeen, Aberdeen, SD • Joe A. Senger, Executive Vice President, US Bank, Aberdeen, SD • Ikee Sirleaf, College Student, Northern State University, Aberdeen, SD • Georgia Smith, Office Manager, Sunset Memorial Gardens, Aberdeen, SD • Michele Snyder, Medical Staff Coordiantor, Sanford Aberdeen, Aberdeen, SD • Mike Sommers, Jr., Owner, Double D Body Shop, Aberdeen, SD • Karla Spear, Director of Marketing, Lakewood Mall, Aberdeen, SD • Julie Stevenson, Marketing, Sanford Aberdeen, Aberdeen, SD • Kari Stickelmyer, Nurse, Brown County Community Health Center, Aberdeen, SD • Steve Stickelmyer, President, Tel Serv Communications, Aberdeen SD • Matthew Strinden, Executive Director, New Tec, Inc., Aberdeen, SD • Brett Stulken, Assistant, Sanford Aberdeen, Aberdeen, SD • Mike Stucke, EH&S Specialist, Poet Biorefining, Groton, SD • Judy Stulken, VP, HR & Organizational Develoopment, South Dakota Wheat Growers, Aberdeen, SD • Lisa Sumption, PCT, Sanford Aberdeen, Aberdeen, SD • Casey Swanson, Business Office Supervisor, Sanford Aberdeen, Aberdeen, SD • Darcy Swanson, Pharmacist, Sanford Aberdeen, Aberdeen, SD • Joel Swanson, Manager, Dakota Broadcasting, Aberdeen, SD • Eldon Swingler, President, Insurance Plus, Aberdeen, SD • Pamela W. Teigen, Owner, Lily’s Floral Design, Aberdeen, SD • Betty Tewksbury, Residential Worker, LSS New Beginnings Center, Aberdeen, SD • Sharon K. Thomas, Clinical Therapist, Lutheran Social Services, Aberdeen, SD • Brenda Thompson, Receptionist, Sanford Aberdeen, Aberdeen, SD • Michael J. Thompson, Fire Marshall, Aberdeen Fire & Rescue, Aberdeen, SD • Kathy Thooft, Employment Specialist, Dept. of Labor & Regulations, Aberdeen, SD

11
• Pam Titze, Executive Administrator, Schwan Financial Group, Aberdeen, SD • Virginia Tobin, Consultant/Owner, Aberdeen, SD • Cindy Tople, Accountant, Aberdeen, SD • Dewey Tullar, Salesman, Steven Lust Automotive, Aberdeen, SD • Katrina Umanah, Shift Supervisor, LSS New Beginnings Center, Aberdeen, SD • NyLetta Valer, Residential Worker, LSS New Beginnings Center, Aberdeen, SD • Daniel J. Vetter, Recorder, Aberdeen, SD • Gary Vetter, Brown County Planning & Zoning Director, Aberdeen, SD • Molly Vetter, Center Manager, United Blood Services, Aberdeen, SD • Lori Volk, Office Manager, Graham Tire, Aberdeen, SD • Lisa Wagermann, Switchboard Operator, Sanford Aberdeen, Aberdeen, SD • Cynthia Walsh, Regional President, US Bank, Aberdeen, SD • Wendy Ward, Secretary, Sanford CHILD Services, Aberdeen, SD • Casey Weismantel, Sales Director, Aberdeen Convention & Visitors Bureau, Aberdeen, SD • Kelcey Wellman, Nurse, SD Department of Health, Aberdeen, SD • Mary Anne Whitman, Assistant Director of Financial Aid, Presentation College, Aberdeen, SD • Ka’Nova Williams, LSS New Beginnings Center, Aberdeen, SD • Mike Williams, Area Manager, Northwestern Energy, Aberdeen, SD • Amber Wilson, Department Asssitant, Sanford Aberdeen, Aberdeen, SD • Sarah Wilson, Pharmacy Technician, Sanford Aberdeen, Aberdeen, SD • Karly Winter, Brown County Deputy State’s Attorney, Aberdeen, SD • Carol Wolf, Administrative Assistant, Aberdeen, SD • Pam Wolf, Clerical Support Staff, SD Department of Corrections, Aberdeen, SD • Anna Wolters, LSS New Beginnings Center, Aberdeen, SD, SD • Vayle Woodward, Registrar, Sanford Aberdeen, Aberdeen, SD • Tami Zerr, Nurse, Sanford Children’s, Aberdeen, SD • Stacy Zimmerman, X-‐Ray Tech, Sanford Aberdeen, Aberdeen, SD • CNA, Avera/Lutheran Social Services, Aberdeen, SD • Sterilization Tech, Sanford Aberdeen, Aberdeen, SD • Becky, Social Worker, Safe Harbor, Aberdeen, SD • Renae, Sales Coordinator, Aberdeen, SD • Nurse, Sanford Aberdeen, Aberdeen, SD • Employment Specialist, SD Department of Labor & Regulations, Aberdeen, SD

12
Sanford Aberdeen Medical Center Community Health Needs Assessment
2012-‐2013 Executive Summary Purpose The purpose of a community health needs assessment is to develop a global view of the population’s health and the prevalence of disease and health issues within the community. Findings from the assessment serve as a catalyst to align expertise and develop a Community Investment/Community Benefit plan of action. There is great intrinsic value in a community health needs assessment when it serves to validate, justify and defend not-‐for-‐profit status and create opportunity to identify and address public health issues from a broad perspective. A community health needs assessment is critical to a vital Community Investment/Community Benefit Program that builds on community assets, promotes collaboration, improves community health, and promotes innovation and research. A community health needs assessment also serves to validate progress made toward organizational strategies and provides further evidence for retaining our not-‐for-‐profit status. Study Design and Methodology The following qualitative data set was studied:
• Community Health Needs Assessment of Community Leaders The following quantitative data sets were studied:
• 2011 County Health Profiles for Brown County • Aging Profiles for Brown County • Diversity Profiles for Brown County
Asset mapping was conducted by reviewing the data and identifying the unmet needs from the various surveys and data sets. The process implemented in this work was based on the McKnight Foundation model -‐ Mapping Community Capacity by John L. McKnight and John P. Kretzmann, Institute for Policy Research at Northwestern University. Each unmet need was researched to determine what resources were available in the community to address the needs. The steering group performed the asset mapping and reviewed the findings. The group conducted an informal gap analysis to determine what needs remained after resources were thoroughly researched. Once gaps were determined, the group proceeded to the prioritization process. The multi-‐voting methodology was implemented to determine what top priorities would be further developed into implementation strategies.

13
Key Findings – Primary Research
Community Health Needs Assessment of Community Leaders The Internal Revenue Code 501 (r) statute requires that a broad base of key community stakeholders have input into the needs of the community. Those community members specified in the statute include: persons who represent the broad interests of the community served by the hospital facility including those with special expertise in public health; Federal, tribal, regional, state and or local health or other departments or agencies with information relevant to the health needs of the community served; leaders, representatives, or members of medically underserved, low-‐income, and minority populations. Sanford extended a good faith effort to engage all of the aforementioned community representatives in the survey process. The list of individuals who agreed to take the survey and also submit their names are included in the acknowledgement section of this report. In some cases there were surveys that were submitted without names or without a specified area of expertise or affiliation. We worked closely with public health experts throughout the assessment process. Public comments and response to the community health needs assessment and the implementations strategies are welcome on the Sanford website under “About Sanford” in the Community Health Needs Assessment section. The Best Things about the Community Overall, respondents indicated that the top five community assets or best things about the community include: friendliness of people, higher education opportunities, good place to raise kids, the safety of the community, and the convenience of getting to work or activities. The respondents seem to feel that higher education, school system quality, and health care quality are stronger assets to the community. There was less agreement in the overall effectiveness of the community’s transportation system.
There is strong agreement regarding the positive quality of life in this community, with lower agreement coming as it relates to cultural richness. There is good agreement with the qualities of convenient access to work/activities and the general cleanliness of the region. There is strong agreement that many recreational activities are available in the community and good agreement that activities/events are available for families, youth, and seniors.
Leading Concerns about the Community The five leading concerns about the community include: cost of healthcare, wages, housing, cost of living, and cost of elderly care.
The leading concerns among respondents regarding services and resources were related to the costs of care for the elderly and children. There was concern about the resources to care for an aging population, availability of family services, and quality/cost of education. There was less concern about the access to groceries in the community.
There was fairly high agreement that road conditions and availability of public transportation were also concerns of the respondents. Not surprisingly, traffic congestion was much less of a concern. Compared to responses for other community concerns, the level of concern with environmental pollution is only moderate. There is strong concern with substance abuse, child abuse, and domestic violence in the community. Violent crimes and prostitution are less concerning with the respondents.
There was high agreement that road conditions and availability of public transportation were concerns of the respondents. Not surprisingly, traffic congestion was much less of a concern. Compared to responses for other community concerns, the level of concern with environmental pollution is only moderate. There is strong overall
14
concern regarding the entire scope of youth concerns that included bullying, teen pregnancy, marriage issues, crime, and school dropout rates.
Health and Wellness Concerns The leading health and wellness concerns from the respondents included: the cost of health insurance, the cost of healthcare, the adequacy of health insurance, the cost of medicine, and obesity. There is fairly strong concern shown by the respondents for drug and alcohol abuse and the presence of drug dealers in the community. There is strong concern in the community regarding obesity, eating habits, lack of exercise and the cost of exercise options. Overall, there is fairly strong concern with the mental health variables in the survey. There is concern over the issues of stress and depression and accessing qualified mental health programs/providers to address the mental health issues. Although less so for communicable disease, there is strong concern in the community regarding illness associated with cancer and chronic disease. Health Care Delivery in the Community Overall, topics related to emergency services, heart disease, cancer, transportation, health care staffing, and diabetes were better addressed than those relating to obesity, cost of care, coordination of care, preventive care, or mental health issues. Key Findings – Secondary Research Health Outcomes -‐ Mortality and Morbidity While the state of South Dakota has more premature deaths than the national benchmark, Brown County has a lower rate than the national benchmark and South Dakota as a whole. The Morbidity health outcomes indicate that Brown County citizens report more days of poor health (self-‐reported) than the national or South Dakota benchmark. They also report more physically unhealthy days than the state or national data. South Dakota and Brown County report more mentally unhealthy days (self-‐reported) than the national benchmark. Brown County reports slightly fewer mentally unhealthy days than the state. Brown County has the same percentage of low birth weight as the national benchmark, and also reports a lower percentage of low birth weight than the state. Health Behaviors The Health Behavior outcomes indicate that South Dakota and Brown County have higher percentages of adult smokers (equal to or greater than 100 cigarettes) than the national benchmark. Adult obesity (greater than or equal to 30 BMI) is also higher in South Dakota and Brown County. South Dakota and Brown County have a higher percentage of physical inactivity than the national benchmark. South Dakota (19%) and Brown County (20%) have much higher percentages of binge drinking reports (more than four drinks on one occasion for women and more than five for men) than the national benchmark (8%). Motor vehicle crash death rates are slightly lower than the national benchmark in Brown County; however, the state of South Dakota is much higher than the national benchmark. Sexually transmitted infections rank substantially higher than the national benchmark in South Dakota. Brown County is lower than the state benchmark but also is much higher than the national benchmark for sexually transmitted infections.

15
The teen birth rate is higher in South Dakota and Brown County than the national benchmark. Brown County’s teen birth rate is lower than the state’s teen birth rate. Clinical Care The Clinical Care outcomes indicate that South Dakota and Brown County have a higher percentage of uninsured adults than the national benchmark. The percentage of uninsured youth in Brown County and the national benchmark are lower than South Dakota as a whole. There are more patients per physician in South Dakota and Brown County than the national benchmark. The ratio of population to mental health providers is less positive in South Dakota and Brown County than the national benchmark. The number of professionally active dentists per 100,000 of population is lower than the national benchmark for South Dakota and Brown County. Preventable hospital stays are slightly better than the national benchmark in Brown County but the state’s rate is higher than the national benchmark. Diabetes screening in South Dakota is lower than the national benchmark. The rate of diabetes screening is higher in Brown County than the national benchmark. Brown County and South Dakota rank lower than the national benchmark for mammography screenings. Social and Economic Factors The Social and Economic Factors outcomes indicate that South Dakota and Brown County have a lower high school graduation rate than the national benchmark. South Dakota has a lower percentage of post-‐secondary education than the national benchmark while Brown County has a higher percentage of adults with some post-‐secondary education than South Dakota or the national benchmark. The unemployment rate was lower in South Dakota than the national benchmark during 2009. Brown County’s unemployment rate was lower than South Dakota or the national benchmark. The percentage of child poverty is higher in South Dakota and Brown County than the national benchmark. Brown County has a lower percentage than the South Dakota. Inadequate social support is higher in South Dakota than the national benchmark; however, it is the same as the national benchmark in Brown County. The percentage of children in single parent households is higher than the national benchmark for South Dakota and Brown County. The number of homicide deaths per 100,000 people in South Dakota is higher than the national benchmark. There was no data for homicide deaths in Brown County. Physical Environment The Physical Environment outcomes indicate that there is no air pollution or ozone pollution in this area. Because of the rural geography, access to healthy food is ranked far below the national benchmark in South

16
Dakota and Brown County. Access to recreational facilities ranks lower than the national benchmark for South Dakota and Brown County. Demographics Youth account for 22% of the population in Brown County, which is slightly lower than the national benchmark of 24%. Elderly account for 17% of the population in Brown County, which is higher than the national and South Dakota benchmarks. Thirty percent (30%) of Brown County is rural compared to 48% of South Dakota and 21% as the national benchmark. Only 2% of South Dakotans and 2% of Brown County’s population is not proficient in English compared to the national benchmark, which is 9%. South Dakota and Brown County at 7% each have a low illiteracy rate compared to the national benchmark of 15%. Population by Age The population in Brown County has a higher percentage over the ages of 65 and 85 than South Dakota or the national benchmarks. The gender distribution is slightly higher for women than men in South Dakota and Brown County. The state of South Dakota is 50 % male and 50% female. Housing Brown County has slightly higher home ownership and slightly lower renter-‐occupied housing than the national benchmark. South Dakota has higher home ownership and lower renter-‐occupied housing than the national benchmark. Economic Security The percentage of those in South Dakota who are living at less than 100% of the Federal poverty level is lower in Brown County than the state or the national benchmark. Brown County also has a smaller percentage of the population with income less than 200% of the Federal poverty level than the state of South Dakota or the national benchmark. The median household annual income is $46,369 in South Dakota, which is lower than the national benchmark. Brown County’s median income of $45,615 is lower than South Dakota or the national benchmarks. A smaller percentage of people spend 30% of their income towards housing costs in Brown County than the state of South Dakota or the national percentages. Diversity Profile The population distribution by race demonstrates that South Dakota is predominantly white, followed by American Indian, Hispanic, Asian and Black.
Health Needs Identified Two identified needs for the area are behavioral health and obesity.

17
Implementation Strategy The following needs were identified through a formal community health needs assessment, resource mapping and prioritization process:
• Mental Health Services • Obesity
Implementation Strategy: Mental Health Services
• Establish adolescent and adult mental health telemedicine services from Sanford Aberdeen to Sanford Medical Center in Sioux Falls
Implementation Strategy: Bariatric Services
• Establish a Sanford Aberdeen-‐based Bariatric Services accredited program

18
Sanford Aberdeen Medical Center
Community Health Needs Assessment 2012-‐2013
Sanford Health, long been dedicated to excellence in patient care, is on a journey of growth and momentum with vast geography, cutting edge medicine, sophisticated research, advanced education and a health plan. Through relationships built on trust, successful performance, and a vision to improve the human condition, Sanford seeks to make a significant impact on health and healing. We are proud to be from the Midwest and to impact the world. The name Sanford Health honors the legacy of Denny Sanford’s transformational gifts and vision. Our Mission: Dedicated to the Work of Health and Healing We provide the best care possible for patients at every stage of life, and support healing and wholeness in body, mind and spirit. Our Vision: To improve the Human Condition through Exceptional Care, Innovation and Discovery We strive to provide exceptional care that exceeds our patients’ expectations. We encourage diversity in thought and ideas that lead to better care, service and advanced expertise. Our Values:
• Courage: Strength to persevere, to use our voice and take action • Passion: Enthusiasm for patients and work, commitment to the organization • Resolve: Adherence to systems that align actions to achieve excellence, efficiency and purpose • Advancement: Pursuit of individual and organizational growth and development • Family: Connection and commitment to each other
Our Promise: Deliver a flawless experience that inspires We promise that every individual’s experience at Sanford—whether patient, visitor or referring physician—will result in a positive impact, and for every person to benefit from a flawless experience that inspires. Guiding Principles:
• All health care is a community asset • Care should be delivered as close to home as possible • Access to health care must be provided regionally • Integrated care delivers the best quality and efficiency • Community involvement and support is essential to success • Sanford Health is invited into the communities we serve

19
Description of Sanford Aberdeen Medical Center Sanford Health in Aberdeen, SD is comprised of Sanford Health Clinic Aberdeen and Sanford Aberdeen Medical Center. Sanford Aberdeen Medical Center is a new medical center consisting of 48 total inpatient beds. The Medical Center opened for services on July 16, 2012. The Medical Center has 8 beds in its Critical Care Unit, 8 beds in the Women’s Center, and 32 beds in a Medical/Surgical and Pediatric unit. The Emergency Department consists of 2 trauma rooms and 7 examination rooms. In addition, inpatient and outpatient services are supported by Therapies Departments, Sanford Laboratory and Imaging Departments. Procedural areas consist of 4 operating rooms, a procedure room, and a Cardiac Catheterization Laboratory. Sanford Clinic Aberdeen is a multispecialty clinic consisting of Family Practice, Pediatrics, Internal Medicine, General Surgery, Cardiology and OB/GYN practices. Clinics in Ipswich, South Dakota and Ellendale, North Dakota are also integrated with Sanford Clinic Aberdeen. The 3 clinic locations are currently staffed by 38 physicians and Advanced Practice Providers. Description of the Community Served Aberdeen is a city in and the county seat of Brown County, South Dakota, about 125 miles northeast of Pierre. The city population was 26,091 at the 2010 census, making it the third largest city in the state. Aberdeen is the principal city of the Aberdeen Micropolitan Statistical Area, which includes all of Brown and Edmunds counties and had a population of 40,602 in 2010. Named for Aberdeen, Scotland, the hometown of Milwaukee Railroad President Alexander Mitchell, this new city incorporated in 1881 quickly became known as the Hub City of the Dakotas, and the Brown County seat. By 1886, a city map was published that showed nine different rail lines converging in Aberdeen from all directions, much like the spokes of a wheel converging at its hub. The combination of multidirectional railways and fertile farmland caused Aberdeen to develop into a distribution hub for wholesale goods. The city grew rapidly and in 1890, 230 businesses called Aberdeen home. Today Aberdeen's economy has diversified and the number of businesses has grown to more than 1,500. Brown County’s 10 Largest Establishments (private ownership as of January 2011)
• 3M Company • Avera St. Luke’s • Bethesda Home • Hub City, Inc. • Kessler’s Inc.
• Midstates, Inc. Print & Media Solutions • Molded Fiber Glass South Dakota • WalMart Super Center • Wells Fargo Bank • Wyndham Hotel Group, LLC
2010 Employment by Industry for Civilian Population (Age 16+)
Aberdeen, SD South Dakota United States
Agriculture, Forestry, Fishing and Hunting, and Mining
1.95% 6.08% 1.49%
Construction 6.07% 6.45% 6.97%
Manufacturing 9.59% 9.54% 11.93%

20
2010 Employment by Industry for Civilian Population (Age 16+)
Aberdeen, SD South Dakota United States
Wholesale Trade 2.54% 2.88% 3.05%
Retail Trade 12.23% 10.34% 10.02%
Transportation and Warehousing, and Utilities
3.42% 5.08% 5.58%
Information 1.98% 2.07% 2.94%
Finance, Insurance, Real Estate, and Rental and Leasing
5.34% 7.98% 6.91%
Professional, Scientific, Management, Administrative, etc.
8.59% 5.69% 10.43%
Educational, Health and Social Services
25.54% 24.84% 22.14%
Arts, Entertainment, Accommodation and Food Services, etc.
11.12% 8.83% 8.46%
Other Services 5.71% 5.45% 5.15%
Public Administration 5.93% 4.77% 4.92%
Study Design and Methodology Health Needs Assessment of Key Stakeholders and Community Leaders In May 2011 Sanford Health convened key health care leaders and other not-‐for-‐profit leaders in the Fargo Moorhead community to establish a Fargo Moorhead Community Health Needs Assessment Collaborative. A primary goal of this collaborative is to craft standardized tools, indicators and methodology that can be used by all group members when conducting assessments and also be used by all of the Sanford medical centers across the enterprise. After much discussion it was determined that the Robert Wood Johnson Framework for county profiles would be our secondary data model. The Internal Revenue Code 501 (r) statute requires that a broad base of key community stakeholders have input into the needs of the community. Those community members specified in the statute include: persons who represent the broad interests of the community served by the hospital facility including those with special expertise in public health; Federal, tribal, regional, state and or local health or other departments or agencies with information relevant to the health needs of the community served; leaders, representatives, or members of medically underserved, low-‐income, and minority populations. Sanford extended a good faith effort to engage all of the aforementioned community representatives in the survey process. The list of individuals who agreed to take the survey and also submit their names are included in the acknowledgement section of this report. In some cases there were surveys that were submitted without names or without a specified area of expertise or affiliation. We worked closely with public health experts throughout the assessment process.
21
Public comments and response to the community health needs assessment and the implementations strategies are welcome on the Sanford website under “About Sanford” in the Community Health Needs Assessment section. A sub group of this collaborative met with researchers from the North Dakota State University Center for Social Research to develop a survey tool for our key stakeholder groups. The survey tool incorporated the University of North Dakota’s Center for Rural Health community health needs assessment tool and the Fletcher Allen community health needs assessment tool. North Dakota State University and the University of North Dakota Center for Rural Health worked together to develop additional questions and to ensure that scientific methodology was incorporated in the design. Finally, it was the desire of the collaborative that the data would be shared broadly with others and that if possible it would be hosted on a web site where there could be access for a broad base of community, state and regional individuals and groups. This community health needs assessment was conducted during FY 2012 and FY 2013. The main model for our work is the Association for Community Health Improvement’s (ACHI) Community Health Needs Assessment Toolkit. The following qualitative data sets were studied:
• Survey of Key Stakeholders
The following quantitative data sets were studied: • 2011 County Health Profile for Brown County • Aging Profiles for Brown County • Diversity Profiles for Brown County
Asset mapping was conducted by reviewing the data and identifying the unmet needs from the various surveys and data sets. The process implemented in this work was based on the McKnight Foundation model -‐ Mapping Community Capacity by John L. McKnight and John P. Kretzmann, Institute for Policy Research at Northwestern University. Each unmet need was researched to determine what resources were available in the community to address the needs. The Sanford Health Steering Committee performed the asset mapping and reviewed the findings. The group conducted an informal gap analysis to determine what needs remained after resources were thoroughly researched. Once gaps were determined the group proceeded to the prioritization process. The multi-‐voting methodology was implemented to determine what top priorities would be further developed into implementation strategies. 2011 County Health Profiles The County Health Profiles are based largely on the County Health Rankings from the Mobilizing Action Toward Community Health (MATCH), collaboration between the Robert Wood Johnson Foundation and the University of Wisconsin Population Health Institute. State and national benchmarking required additional data sources including the U.S. Census Bureau, Small Area Health Insurance Estimates, and the Centers for Disease Control and Prevention’s National Center for Health Statistics – the Health Indicators Warehouse Aging Profiles The Aging Profiles are based on data from the U.S. Census Bureau, 2010 Census Summary File 1, and 2006-‐2010 American Community Survey Five-‐Year Estimates (sample data). The estimates presented are meant to give

22
perspective on characteristics across age categories; however, because they are based on sample data, one should use caution when interpreting small numbers. Blank values reflect data that is missing or not available. Diversity Profiles The Diversity Profiles are based on data from the U.S. Census Bureau, 2010 Census Summary File 1, and 2006-‐2010 American Community Survey Five-‐Year Estimates (sample data). The estimates presented are meant to give perspective on characteristics across race and ethnic categories; however, because they are based on sample data, one should use caution when interpreting small numbers. Blank values reflect data that is missing or not available. Racial categories not represented include Native Hawaiian and Other Pacific Islander alone, Some Other Race alone, and Two or More races. Limitations The Sanford Health Community Health Needs Assessment Steering Group attempted to survey key community leaders and stakeholders for the purpose of determining the needs of the community. While over 300 surveys were returned, there were still many key stakeholders who did not complete the survey. The survey asked for individual perceptions of community health issues and is subjective to individual experiences which may or may not be the current status of the community. Primary Research – Summary of the Survey Results Community Assets/Best Things about the Community Using a 1 to 5 scale, with one being “not at all” and 5 being “a great deal”, respondents were asked to rate their level of agreement with various statements regarding PEOPLE, SERVICES AND RESOURCES, QUALITY OF LIFE, GEOGRAPHIC SETTING, and ACTIVITIES in their community. Overall, respondents indicated that the top five community assets or best things about the community include: friendliness of people (4.32), higher education opportunities (4.39), good place to raise kids (4.49), the safety of the community (4.32), and the convenience of getting to work or activities (4.47).

23
People In general, respondents felt that people in this community are friendly, with a sense of connection and community engagement. There is less agreement that the community is culturally diverse, tolerant, inclusive or open-‐minded.
Figure 1. Level of agreement with statements about the community regarding PEOPLE
3.25
3.31
3.61
3.70
3.79
4.15
4.32
1 2 3 4 5
There is tolerance, inclusion, open-‐mindedness (N=321)
The community is socially and culturally diverse (N=324)
There is an engaged government (N=303)
There is a sense that you can make a difference (N=322)
People who live here are aware of/engaged in social, civic, or poliscal issues (N=317)
There is a sense of community/feeling connected to people who live here (N=320)
People are friendly, helpful, supporsve (N=326)
Mean (1=not at all, 5=a great deal)*
24
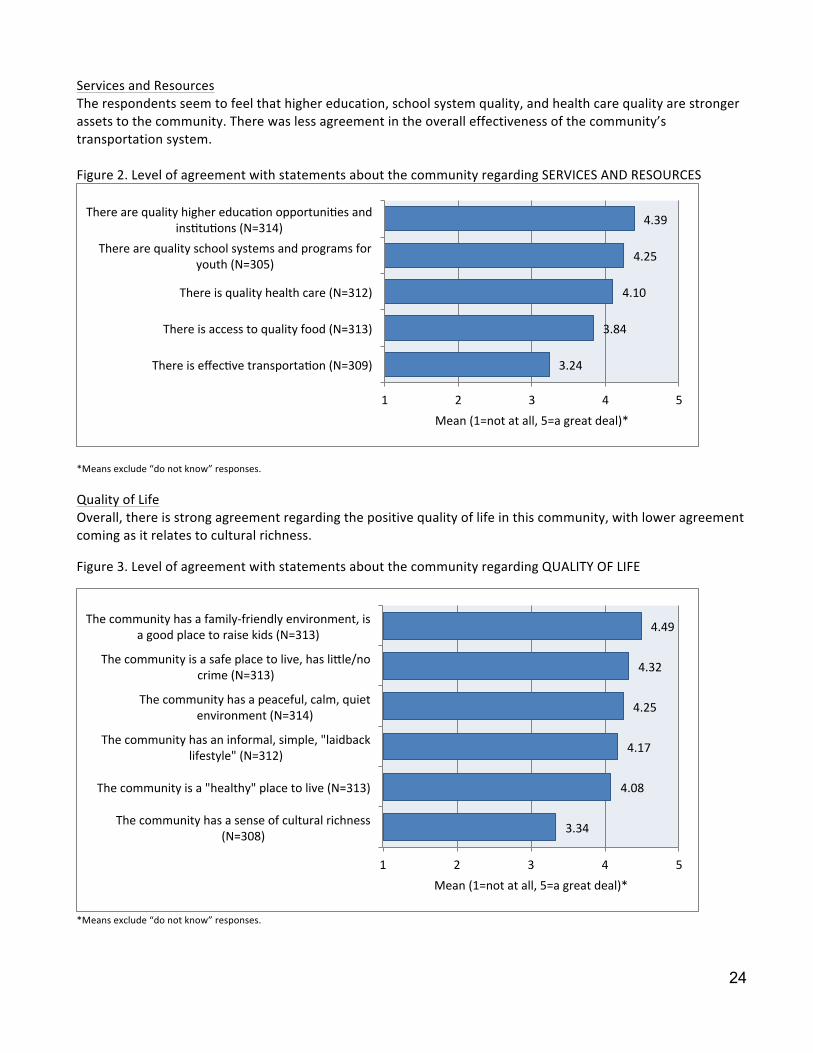
Services and Resources The respondents seem to feel that higher education, school system quality, and health care quality are stronger assets to the community. There was less agreement in the overall effectiveness of the community’s transportation system. Figure 2. Level of agreement with statements about the community regarding SERVICES AND RESOURCES
*Means exclude “do not know” responses.
Quality of Life Overall, there is strong agreement regarding the positive quality of life in this community, with lower agreement coming as it relates to cultural richness.
Figure 3. Level of agreement with statements about the community regarding QUALITY OF LIFE
*Means exclude “do not know” responses.
3.24
3.84
4.10
4.25
4.39
1 2 3 4 5
There is effecsve transportason (N=309)
There is access to quality food (N=313)
There is quality health care (N=312)
There are quality school systems and programs for youth (N=305)
There are quality higher educason opportunises and insstusons (N=314)
Mean (1=not at all, 5=a great deal)*
3.34
4.08
4.17
4.25
4.32
4.49
1 2 3 4 5
The community has a sense of cultural richness (N=308)
The community is a "healthy" place to live (N=313)
The community has an informal, simple, "laidback lifestyle" (N=312)
The community has a peaceful, calm, quiet environment (N=314)
The community is a safe place to live, has livle/no crime (N=313)
The community has a family-‐friendly environment, is a good place to raise kids (N=313)
Mean (1=not at all, 5=a great deal)*
25
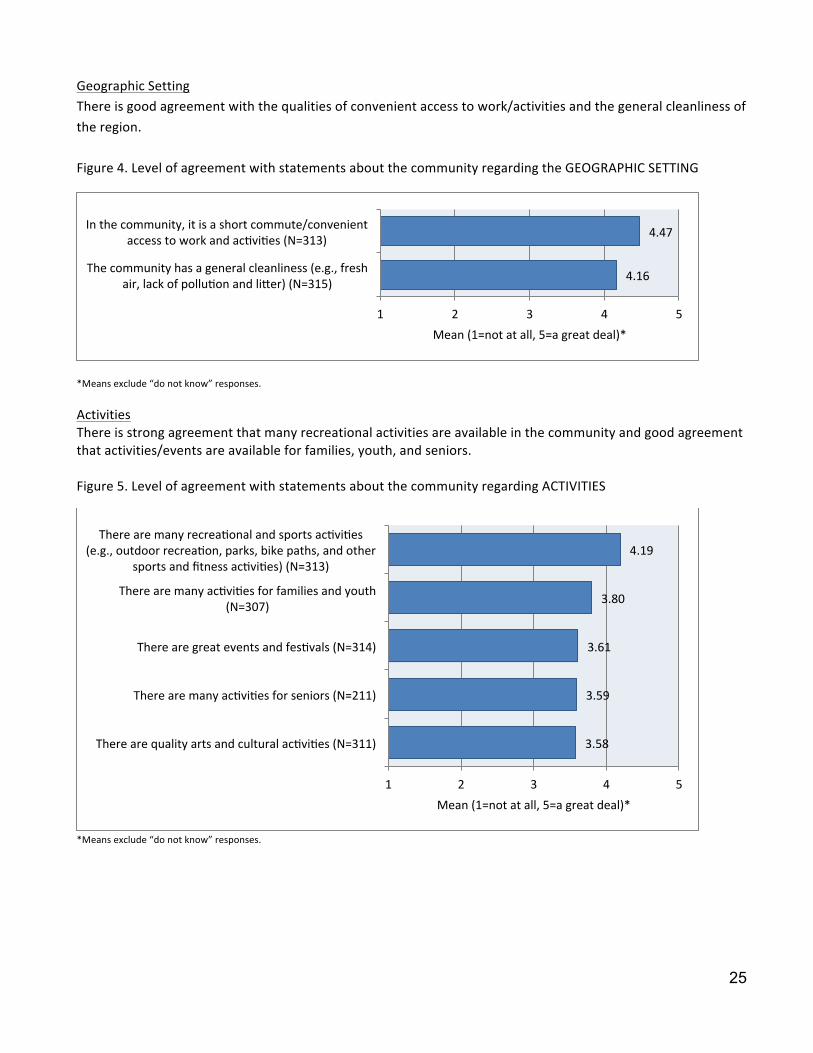
Geographic Setting There is good agreement with the qualities of convenient access to work/activities and the general cleanliness of the region. Figure 4. Level of agreement with statements about the community regarding the GEOGRAPHIC SETTING
*Means exclude “do not know” responses.
Activities There is strong agreement that many recreational activities are available in the community and good agreement that activities/events are available for families, youth, and seniors. Figure 5. Level of agreement with statements about the community regarding ACTIVITIES
*Means exclude “do not know” responses.
4.16
4.47
1 2 3 4 5
The community has a general cleanliness (e.g., fresh air, lack of polluson and liver) (N=315)
In the community, it is a short commute/convenient access to work and acsvises (N=313)
Mean (1=not at all, 5=a great deal)*
3.58
3.59
3.61
3.80
4.19
1 2 3 4 5
There are quality arts and cultural acsvises (N=311)
There are many acsvises for seniors (N=211)
There are great events and fessvals (N=314)
There are many acsvises for families and youth (N=307)
There are many recreasonal and sports acsvises (e.g., outdoor recreason, parks, bike paths, and other
sports and fitness acsvises) (N=313)
Mean (1=not at all, 5=a great deal)*

26
General Concerns about the Community
The five leading concerns about the community include: cost of healthcare (4.0), wages (3.83), housing (3.66), cost of living (3.61), and cost of elderly care (3.54). Economic Issues The leading community concern as reported by the respondents is the cost of health care, along with the economic implications of low wages, affordable housing, the high cost of living, and availability of employment opportunities. There was lower concern regarding homelessness, hunger, or poverty.
Figure 6. Level of concern with statements about the community regarding ECONOMIC ISSUES
*Means exclude “do not know” responses.
2.80
2.91
3.21
3.43
3.52
3.61
3.66
3.83
4.00
1 2 3 4 5
Homelessness (N=291)
Hunger (N=288)
Poverty (N=297)
Economic disparises between higher and lower classes (N=292)
Availability of employment opportunises (N=303)
Cost of living (N=304)
Availability of affordable housing (N= 304)
Low wages (N=299)
Cost of health care and/or insurance (N=302)
Mean (1=not at all, 5=a great deal)*

27
Services and Resources The leading concerns among respondents regarding services and resources were related to the costs of care for the elderly and children. There was concern about the resources to care for an aging population, availability of family services, and quality/cost of education. There was less concern about the access to groceries in the community.
Figure 7. Level of concern with statements about the community regarding SERVICES AND RESOURCES
*Means exclude “do not know” responses.
2.87
3.15
3.15
3.24
3.27
3.28
3.33
3.44
3.50
3.54
1 2 3 4 5
Availability/access to a grocery store (N=302)
Problems associated with mental health care systems/policies (not relasng to cost) (N=277)
Availability of youth acsvises (N=297)
Problems associated with health care systems/policies (not relasng to cost) (N=295)
Quality and/or cost of educason/school programs (N=299)
Availability of family services (N=289)
False sense of enstlement to services and resources (N=284)
Resources to meet the needs of the aging populason (N=266)
Cost and/or availability of child care (N=273)
Cost and/or availability of elder care (N=264)
Mean (1=not at all, 5=a great deal)*

28
Transportation There was fairly high agreement that road conditions and availability of public transportation were concerns of the respondents. Not surprisingly, traffic congestion was much less of a concern. Figure 8. Level of concern with statements about the community regarding TRANSPORTATION
Environmental Pollution Compared to responses for other community concerns, the level of concern with environmental pollution is only moderate. Figure 9. Level of concern with statements about the community regarding ENVIRONMENTAL POLLUTION
*Means exclude “do not know” responses.
2.25
2.95
3.18
3.68
1 2 3 4 5
Traffic congesson (N=299)
Driving habits (e.g., speeding, "road rage") (N=298)
Availability of public transportason (N=290)
Road condisons (N=299)
Mean (1=not at all, 5=a great deal)*
2.20
2.27
2.94
1 2 3 4 5
Noise polluson (N=297)
Air polluson (N=297)
Water polluson (N=294)
Mean (1=not at all, 5=a great deal)*

29
Youth Concerns There is strong overall concern regarding the entire scope of Youth Concerns that included bullying, teen pregnancy, marriage issues, crime, and school dropout rates. Figure 10. Level of concern with statements about the community regarding YOUTH CONCERNS
*Means exclude “do not know” responses.
Safety Concerns There is strong concern with substance abuse, child abuse, and domestic violence in the community. Violent crimes and prostitution are less concerning with the respondents. Figure 11. Level of concern with statements about the community regarding SAFETY CONCERNS
3.05
3.18
3.30
3.37
3.60
1 2 3 4 5
School dropout rates/truancy (N=286)
Youth crime (N=295)
Changes in family composison (e.g., divorce, single parensng) (N=291)
Teen pregnancy (N=287)
Bullying (N=291)
Mean (1=not at all, 5=a great deal)*
2.19
2.67
2.92
3.37
3.45
3.69
1 2 3 4 5
Prosstuson (N=285)
Violent crimes (N=296)
Property crimes (N=296)
Domessc violence (N=294)
Child abuse and neglect (N=295)
Substance abuse (N=296)
Mean (1=not at all, 5=a great deal)*

30
Community Health and Wellness Concerns
The leading health and wellness concerns from the respondents included: the cost of health insurance, the cost of healthcare, the adequacy of health insurance, the cost of medicine, and obesity.
Access to Health Care Overall, the leading concerns about healthcare access in this community are cost of care related and also access to insurance. Although ways to access the health system rank lower than cost concerns, they still show moderately high results from the respondents. Figure 12. Level of concern with statements about the community regarding ACCESS TO HEALTH CARE
2.67
2.79
2.83
2.85
2.86
3.10
3.16
3.20
3.47
3.51
3.79
3.82
3.90
4.11
4.11
4.24
4.37
1 2 3 4 5
Confidensality (N=287)
Distance to health care services (N=292)
Availability of/access to transportason (N=287)
Provider is not taking new pasents (N=284)
Availability of bilingual providers and/or translators (N=278)
Time it takes to get an appointment (N=286)
Availability of non-‐tradisonal hours (e.g., evenings, weekends) (N=290)
Use of emergency room services for primary health care (N=283)
Availability of prevenson programs or services (N=282)
Availability of doctors, nurses, and/or specialists (N=288)
Availability and/or cost of dental and/or vision care (N=292)
Availability and/or cost of dental and/or vision insurance coverage (N=292)
Access to health insurance coverage (e.g., preexissng condisons) (N=288)
Cost of prescripton drugs (N=293)
Adequacy of health insurance (e.g., amount of co-‐pays & deducsbles, consistency of coverage) (N=290)
Cost of health care (N=292)
Cost of health insurance (N=291)
Mean (1=not at all, 5=a great deal)*

31
Substance Abuse There is fairly strong concern shown by the respondents for drug and alcohol abuse and the presence of drug dealers in the community. Figure 13. Level of concern with statements about the community regarding SUBSTANCE USE AND ABUSE
*Means exclude “do not know” responses.
Physical Health There is strong concern in the community regarding obesity, eating habits, lack of exercise and the cost of exercise options. Figure 14. Level of concern with statements about the community regarding PHYSICAL HEALTH
*Means exclude “do not know” responses.
3.33
3.43
3.65
3.67
1 2 3 4 5
Presence and influence of drug dealers in the community (N=276)
Smoking (N=290)
Alcohol use and abuse (N=288)
Drug use and abuse (N=287)
Mean (1=not at all, 5=a great deal)*
2.88
3.00
3.68
3.75
3.83
3.88
1 2 3 4 5
Availability of good walking or biking opsons (as alternasves to driving) (N=287)
Availability of exercise facilises (N=293)
Cost of exercise facilises (N=288)
Lack of exercise and/or inacsvity (N=293)
Poor nutrison/easng habits (N=293)
Obesity (N=293)
Mean (1=not at all, 5=a great deal)*

32
Mental Health Overall, there is fairly strong concern with the mental health variables in the survey. There is concern over the issues of stress and depression and accessing qualified mental health programs/providers to address the mental health issues. Figure 15. Level of concern with statements about the community regarding MENTAL HEALTH
*Means exclude “do not know” responses.
Illness Although less so for communicable disease, there is strong concern in the community regarding illness associated with cancer and chronic disease. Figure 16. Level of concern with statements about the community regarding ILLNESS
*Means exclude “do not know” responses.
3.19
3.30
3.31
3.32
3.48
1 2 3 4 5
Availability of services for addressing mental health problems (N=277)
Availability of qualified mental health providers (N=277)
Quality of mental health programs (N=276)
Depression (N=284)
Stress (N=286)
Mean (1=not at all, 5=a great deal)*
3.04
3.75
3.85
1 2 3 4 5
Communicable diseases (e.g., including sexually transmived diseases, AIDS) (N=285)
Chronic disease (e.g., diabetes, heart disease, mulsple sclerosis) (N=288)
Cancer (N=288)
Mean (1=not at all, 5=a great deal)*

33
Delivery of Health Care in the Community
Respondents were asked to rate how well DELIVERY OF HEALTH CARE topics are being addressed in their community. Overall, topics related to emergency services, heart disease, cancer, transportation, health care staffing, and diabetes were better addressed than those relating to obesity, cost of care, coordination of care, preventive care, or mental health issues. Figure 17. How well topics related to DELIVERY OF HEALTH CARE in the community are being addressed
*Means exclude “do not know” responses.
2.69
2.76
2.99
3.03
3.04
3.06
3.21
3.24
3.31
3.32
3.39
3.43
3.48
3.57
1 2 3 4 5
Health services for obesity (N=250)
Costs of the delivery of health care (N=274)
Coordinason/communicason among providers (N=274)
Avenson given to prevensve services (N=278)
Mental health services (e.g., depression, demensa/Alzheimer's disease, stress) (N=256)
Needs of communises dealing with a hospital or clinic closure (N=175)
Access to needed technology/equipment (N=270)
Health services for diabetes (N=246)
Number of health care staff in general (N=282)
Number of health care providers and specialists (N=283)
Distance/transportason to health care facility (N=280)
Health services for cancer pasents (N=261)
Health services for heart disease (N=261)
Access to emergency services (e.g., ambulance and 911) (N=282)
Mean (1=not at all well, 5=very well)*

34
Personal Health Care Information Cancer Screening Over 50% of the respondents said they had not had a cancer screening or cancer care in the past year. The most common reason for not having done so was because they felt it was unnecessary or because their doctor had not suggested it. Figure 18. Whether respondents had a cancer screening or cancer care in the past year
Respondents were asked whether they had a cancer screening or cancer care in the past year, and if they had not, reasons for not having done so. Among respondents who had not had a cancer screening or cancer care in the past year, 46.4% thought that is was not necessary and 38.8% said their doctor had not suggested it. Figure 19. Among respondents who have not had a cancer screening or cancer care in the past year, reasons for not having done so
35.50
64.50
0.00 10.00 20.00 30.00 40.00 50.00 60.00 70.00
Yes
No
Percent
Cancer Screening
38.8
5.9 15.3
46.5 7.6
18.8 11.2
0 5 10 15 20 25 30 35 40 45 50 Doctor hasn't suggested
Fear Cost
Not necessary Access/or don't know who to see Unfamiliar with recommenda`ons
Other
Percent
Reasons for not having cancer screening

35
Health Care Coverage
Respondents were asked how they had paid for health care costs for themselves or family members, over the last 12 months. A majority of respondents said they had paid for health care costs over the last 12 months by health insurance. Personal income was also used. Figure 20. Methods respondents have used to pay for health care costs over the last 12 months
84.2
13
54.4
3.2
2.8
1.1
2.1
3.9
1.4
0 10 20 30 40 50 60 70 80 90
Health Insureance
Private health insurance
Personal income
Medicaid
Medicare
Indian Health Service
Military
Veteran's benefits
Did not access
Percent
Health Coverage

36
Primary Care Provider The top reason respondents gave for their choice of primary health care provider was quality of care. (Figure 21) Other reasons that were high among responses were availability of services, location, and the sense of being valued as a patient. Figure 21. Respondents’ reasons for choosing primary health care provider
Respondent’s Primary Care Provider
Respondents were asked which provider they used for their primary health care. Over 50% of respondents said they use Sanford Health as their primary care provider.
Figure 22. Primary Health Care Provider
42.3
53
43
41.9
22.6
28.7
0 10 20 30 40 50 60
Loca`on
Quality of service
Availability
Sense of being valued
Influenced by health insurance
Other
Percent
Reasons for choosing facility
53.5
34.9
11.5
0 10 20 30 40 50 60
Sanford Health
Avera
Other
Percent
Respondent's Primary Care Provider

37
Respondents Representing Chronic Disease Respondents were asked to select their personal general health conditions/diseases. Weight control received the most responses with 36.3% of participants selecting this condition. The chronic diseases found in the highest percentage among respondents include, depression, anxiety or stress, arthritis, hypertension, and hypercholesterolemia. (Figure 23) Figure 23. Respondent’s health/chronic diseases
18.0%
11.2%
6.7%
19.1%
1.1%
11.2%
15.4%
5.6%
17.6%
16.5%
8.6%
36.3%
27.0%
4.9%
0 0.05 0.1 0.15 0.2 0.25 0.3 0.35 0.4
Arthri`s
Asthma
Cancer
Depression, Anxiety, stress
Demen`a/Alzheimer's
Diabetes
Muscles or bone problems
Heart condi`ons
High cholesterol
Hypertension
Ob/Gyn
Weight control
None
Other
Chronic Disease
38
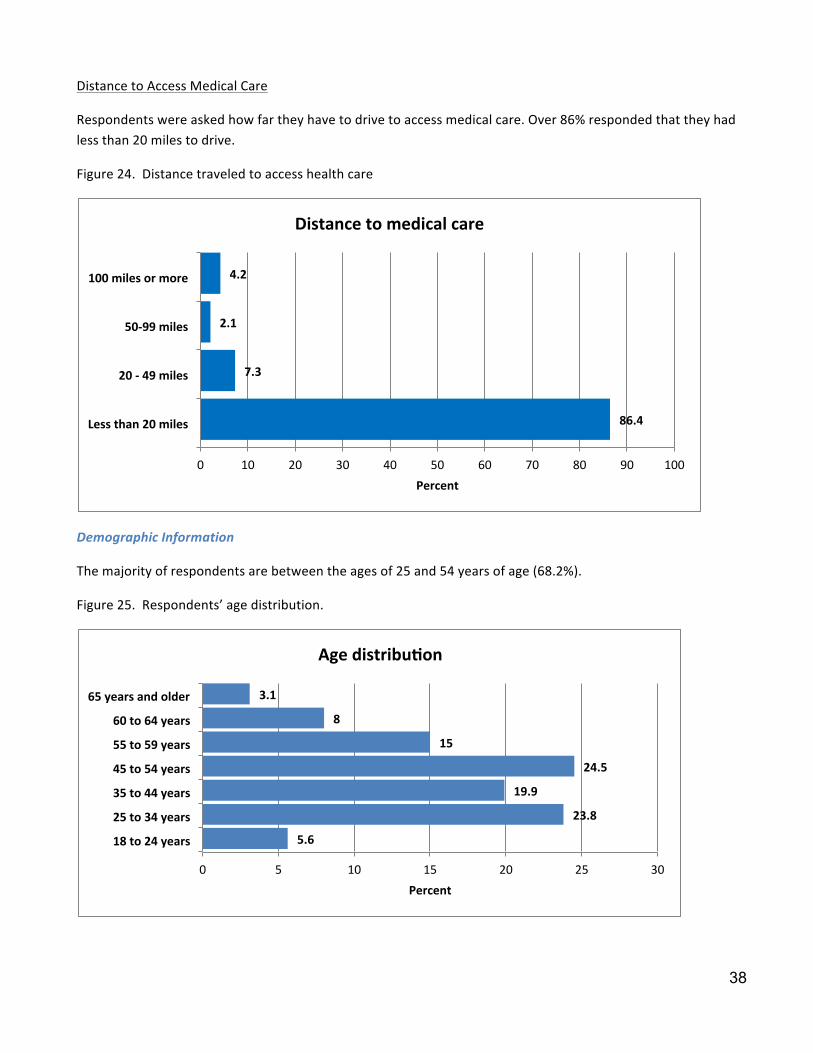
Distance to Access Medical Care
Respondents were asked how far they have to drive to access medical care. Over 86% responded that they had less than 20 miles to drive.
Figure 24. Distance traveled to access health care
Demographic Information
The majority of respondents are between the ages of 25 and 54 years of age (68.2%).
Figure 25. Respondents’ age distribution.
86.4
7.3
2.1
4.2
0 10 20 30 40 50 60 70 80 90 100
Less than 20 miles
20 -‐ 49 miles
50-‐99 miles
100 miles or more
Percent
Distance to medical care
5.6
23.8
19.9
24.5
15
8
3.1
0 5 10 15 20 25 30
18 to 24 years
25 to 34 years
35 to 44 years
45 to 54 years
55 to 59 years
60 to 64 years
65 years and older
Percent
Age distribu`on

39
Most respondents (68.9%) have a Bachelor’s degree or higher. A Bachelor’s degree was held by 45.1% of respondents and 23.8% have a graduate or professional degree. Figure 26. Respondent’s education
More females responded to the survey than males (33.6% males compared to 66.4% females).
Figure 27. Respondents by gender
0.7
4.2
11.5
14.7
45.1
23.8
0 5 10 15 20 25 30 35 40 45 50
Some high school
High school diploma or GED
Some college/no degree
Associate's degree
Bachelor's degree
Graduate or professional degree
Percent
Respondent's educa`on
66.4
33.6
0 10 20 30 40 50 60 70
Female
Male
Percent
Gender

40
Secondary Research Health Outcomes Mortality The Mortality health outcomes indicate that South Dakota as a state has more premature deaths than the national benchmark. While the state of South Dakota has more premature deaths than the national benchmark, Brown County has a lower rate than the national benchmark and South Dakota as a whole. Map 1 in the Appendix provides a county view of the premature deaths within the five-‐state region. National
Benchmark South Dakota
Brown County
Premature death
Years of potential life lost before age 75 per 100,000 (age-‐adjusted), 2005-‐2007
5,564 6,815 5,179
Morbidity The Morbidity health outcomes indicate that Brown County citizens report more days of poor health (self-‐reported) than the national or South Dakota benchmark. They also report more physically unhealthy days than the state or national data. South Dakota and Brown County report more mentally unhealthy days (self-‐reported) than the national benchmark. Brown County reports slightly fewer mentally unhealthy days than the state. Brown County has the same percentage of low birth weight as the national benchmark, and also reports a lower percentage of low birth weight than the state. Maps 1-‐2 in the Appendix provide county views of the morbidity indicators within the five-‐state region. National
Benchmark South Dakota
Brown County
Poor or fair health
Percent of adults reporting fair or poor health (age-‐adjusted), 2003-‐2009
10% 12% 13%
Poor physical health days
Average number of physical unhealthy days reported in past 30 days (age-‐adjusted), 2003-‐2009
2.6 2.8 3.0
Poor mental health days
Average number of mentally unhealthy days reported in past 30 days (age-‐adjusted), 2003-‐2009
2.3 2.6 2.4
Low birth weight
Percent of live births with low birth weight (<2,500 grams), 2001-‐2007
6.0% 6.8% 6.0%

41
Health Factors
Health Behaviors The Health Behavior outcomes indicate that South Dakota and Brown County have higher percentages of adult smokers (equal to or greater than 100 cigarettes) than the national benchmark. Adult obesity (greater than or equal to 30 BMI) is also higher in South Dakota and Brown County. South Dakota and Brown County have a higher percentage of physical inactivity than the national benchmark. South Dakota (19%) and Brown County (20%) have much higher percentages of binge drinking reports (more than four drinks on one occasion for women and more than five for men) than the national benchmark (8%). Motor vehicle crash death rates are slightly lower than the national benchmark in Brown County; however, the state of South Dakota is much higher than the national benchmark. Sexually transmitted infections rank substantially higher than the national benchmark in South Dakota. Brown County is lower than the state benchmark but also is much higher than the national benchmark for sexually transmitted infections. The teen birth rate is higher in South Dakota and Brown County than the national benchmark. Brown County’s teen birth rate is lower than the state’s teen birth rate. Maps 6 -‐12 in the Appendix provide county views of the Health Behavior indicators within the five-‐state region. National
Benchmark South Dakota
Brown County
Adult smoking Percent of adults who currently smoke and have smoked at least 100 cigarettes in their lifetime, 2003-‐2009
15% 20% 19%
Adult obesity Percent of adults that report a body mass index (BMI) of at least 30 kg/m2, 2008
25% 29% 30%
Physical inactivity
Percent of adults reporting no leisure physical activity, 2008
20% 26% 28%
Excessive drinking
Percent of adults reporting binge drinking and heavy drinking, ( consuming >4 for women and >5 for men on a single occasion ) 2003-‐2009
8% 19% 20%
Motor vehicle crash death rate
Motor vehicle crash deaths per 100,000 population, 2001-‐2007
12.0 23.7 11.4
Sexually transmitted infections
Number of Chlamydia cases (new cases reported) per 100,000 population 2008
83.0 371.3 224.7
Teen birth rate Number of teen births per 100,000 females ages 15-‐19, 2001-‐2007
22.0 38.7 28.5

42
Clinical Care The Clinical Care outcomes indicate that South Dakota and Brown County have a higher percentage of uninsured adults than the national benchmark. The percentage of uninsured youth in Brown County and the national benchmark are lower than South Dakota as a whole. There are more patients per physician in South Dakota and Brown County than the national benchmark. The ratio of population to mental health providers is less positive in South Dakota and Brown County than the national benchmark. The number of professionally active dentists per 100,000 of population is lower than the national benchmark for South Dakota and Brown County. Preventable hospital stays are slightly better than the national benchmark in Brown County but the state’s rate is higher than the national benchmark. Diabetes screening in South Dakota is lower than the national benchmark. The rate of diabetes screening is higher in Brown County than the national benchmark. Brown County and South Dakota rank lower than the national benchmark for mammography screenings. Maps 13-‐20 in the Appendix provide county views of the Clinical Care indicators within the five-‐state region. National
Benchmark South Dakota
Brown County
Uninsured adults
Percent of adult population ages 18-‐64 without health insurance, 2007
13% 16% 14%
Uninsured youth
Percent of youth ages 0-‐18 without health insurance.
7% 9% 7%
Primary Care Physicians
Ratio of population to primary care physicians, 2008
631:1 769:1 761:1
Mental Health Providers
Ratio of total population to mental health providers, 2008
2,242:1 3,544:1 4378:1
Dentist rate Number of professionally active dentists per 100,000 population, 2007
69.0 50.0 54.0
Preventable hospital stays
Hospitalization discharges for ambulatory care-‐sensitive conditions per 1,000 Medicare enrollees, 2006-‐2007
52.0 68.6 51.4
Diabetes screening
Percent of Medicare enrollees with diabetes that receive HbA1c screening, 2006-‐2007
89% 83% 90%
Mammography screening
Percent of female Medicare enrollees that receive mammography screening, 2006-‐2007
74% 68% 71%

43
Social and Economic Factors The Social and Economic Factors outcomes indicate that South Dakota and Brown County have a lower high school graduation benchmark than the national benchmark. South Dakota has a lower percentage of post-‐secondary education than the national benchmark while Brown County has a higher percentage of adults with some post-‐secondary education than South Dakota or the national benchmark. The unemployment rate was lower in South Dakota than the national benchmark during 2009. Brown County’s unemployment rate was lower than South Dakota or the national benchmark. The percentage of child poverty is higher in South Dakota and Brown County than the national benchmark. Brown County has a lower percentage than the South Dakota. Inadequate social support is higher in South Dakota than the national benchmark; however, it is the same as the national benchmark in Brown County. The percentage of children in single parent households is higher than the national benchmark for South Dakota and Brown County. The number of homicide deaths per 100,000 people in South Dakota are higher than the national benchmark. There was no data for homicide deaths in Brown County. Maps 21-‐27 in the Appendix provide county views of the Social and Economic indicators within the five-‐state region. National
Benchmark South Dakota
Brown County
High school graduation
Percent of ninth-‐grade cohort in public schools that graduates from high school in four years 2006-‐2007
92% 83% 80%
Some college Percent of adults ages 25-‐44 with some post-‐secondary education, 2005-‐2009
68% 64% 70%
Unemployment Percent of population ages 16 and older that is unemployed but seeking work 2009
5.3%
4.8%
3.5%
Child poverty Percent of children ages 0-‐17 living below the Federal Poverty Line, 2008
11% 18% 13%
Inadequate social support
Percent of adults that never, rarely, or sometimes get the social and emotional support they need, 2003-‐2009
14% 17% 14%
Children in single parent households
Percent of children in families that live in a household headed by a parent with no spouse present, 2005-‐2009
20% 29% 25%
Homicide rates Number of deaths due to murder or non-‐negligent manslaughter per 100,000 population, 2001-‐2007
1.0 2.5 0
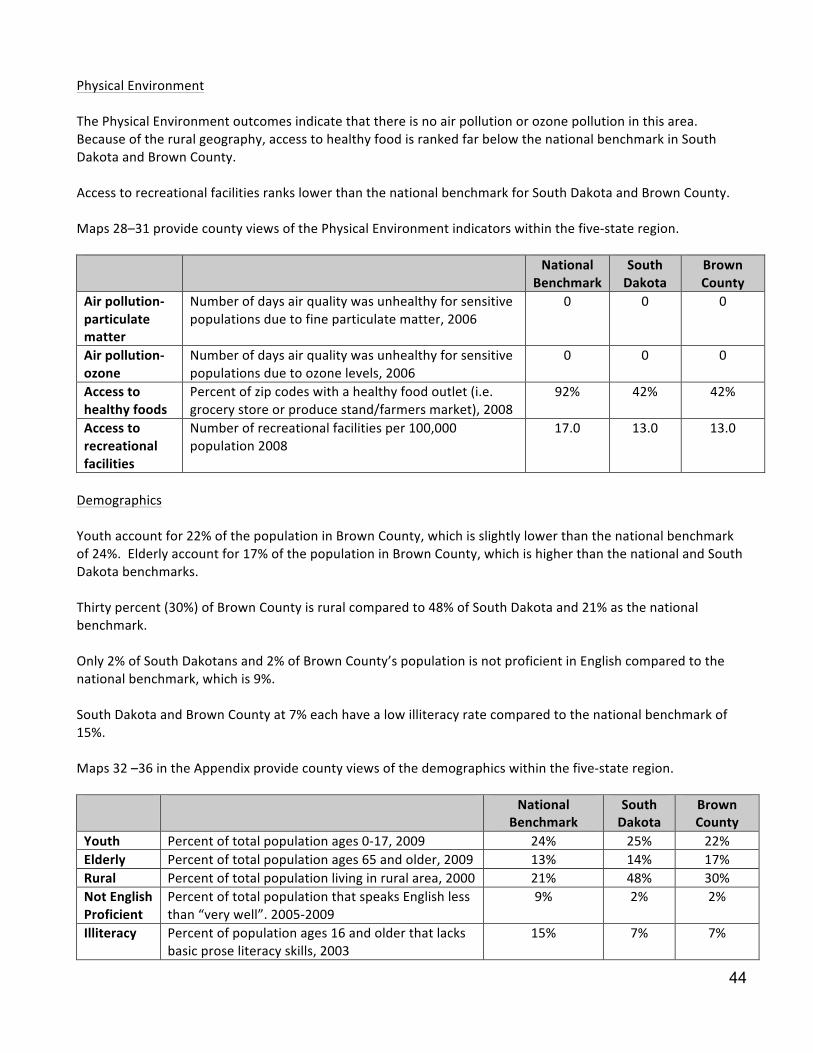
44
Physical Environment The Physical Environment outcomes indicate that there is no air pollution or ozone pollution in this area. Because of the rural geography, access to healthy food is ranked far below the national benchmark in South Dakota and Brown County. Access to recreational facilities ranks lower than the national benchmark for South Dakota and Brown County. Maps 28–31 provide county views of the Physical Environment indicators within the five-‐state region. National
Benchmark South Dakota
Brown County
Air pollution-‐particulate matter
Number of days air quality was unhealthy for sensitive populations due to fine particulate matter, 2006
0 0 0
Air pollution-‐ ozone
Number of days air quality was unhealthy for sensitive populations due to ozone levels, 2006
0 0 0
Access to healthy foods
Percent of zip codes with a healthy food outlet (i.e. grocery store or produce stand/farmers market), 2008
92% 42% 42%
Access to recreational facilities
Number of recreational facilities per 100,000 population 2008
17.0 13.0 13.0
Demographics Youth account for 22% of the population in Brown County, which is slightly lower than the national benchmark of 24%. Elderly account for 17% of the population in Brown County, which is higher than the national and South Dakota benchmarks. Thirty percent (30%) of Brown County is rural compared to 48% of South Dakota and 21% as the national benchmark. Only 2% of South Dakotans and 2% of Brown County’s population is not proficient in English compared to the national benchmark, which is 9%. South Dakota and Brown County at 7% each have a low illiteracy rate compared to the national benchmark of 15%. Maps 32 –36 in the Appendix provide county views of the demographics within the five-‐state region. National
Benchmark South Dakota
Brown County
Youth Percent of total population ages 0-‐17, 2009 24% 25% 22% Elderly Percent of total population ages 65 and older, 2009 13% 14% 17% Rural Percent of total population living in rural area, 2000 21% 48% 30% Not English Proficient
Percent of total population that speaks English less than “very well”. 2005-‐2009
9% 2% 2%
Illiteracy Percent of population ages 16 and older that lacks basic prose literacy skills, 2003
15% 7% 7%

45
Population by Age The population in Brown County has a higher percentage over the ages of 65 and 85 than South Dakota or the national benchmarks. The gender distribution is slightly higher for women than men in South Dakota and Brown County. The state of South Dakota is 50 % male and 50% female. National
Benchmark South Dakota
Brown County
Total population 308,745,538 814,180 36,531 Percent ages 65 and older 13% 14% 16% Percent 85 and older 2% 2% 3% Percent male 49% 50% 49% Percent female 51% 50% 51%
Based on 2010 Census data
Brown County has slightly higher home ownership and slightly lower renter-‐occupied housing than the national benchmark. South Dakota has higher home ownership and lower renter-‐occupied housing than the national benchmark. Housing National
Benchmark South Dakota
Brown County
Percent of occupied housing that is owner-‐occupied 65% 74% 66% Percent of occupied housing that is renter-‐occupied 35% 26% 34%
Based on 2010 Census data
Economic Security According to the 2010 Census Data, the population of working age in the labor force is 69% in South Dakota and 71% for Brown County. The percentage of those in South Dakota who are living at less than 100% of the Federal poverty level is lower in Brown County than the state or the national benchmark. Brown County also has a smaller percentage of the population with income less than 200% of the Federal poverty level than the state of South Dakota or the national benchmark. The median household annual income is $46,369 in South Dakota, which is lower than the national benchmark. Brown County’s median income of $45,615 is lower than South Dakota or the national benchmarks. A smaller percentage of people spend 30% of their income towards housing costs in Brown County than the state of South Dakota or the national percentages. National
Benchmark South Dakota
Brown County
Percent of working age population in the labor force 65% 69% 71% Percent of total population with income less than 100% of poverty 14% 14% 10% Percent of total population with income less than 200% of poverty 32% 33% 28% Median household income $51,914 $46,369 $45,615 Owner occupied housing units 76,089,650 217,250 10,377 Percent spending 30% or more income toward housing costs 30% 20% 17% Renter occupied housing units 38,146,346 98,218 4,605 Percent renters spending 30% or more of income toward housing costs
47% 35% 29%

46
Diversity Profile
The population distribution by race demonstrates that South Dakota is predominantly white, followed by American Indian, Hispanic, Asian, and Black. National
Benchmark South Dakota
Brown County
Total population 308,745,538 814,180 36,531 White alone 223,553,265 699,392 34,057 Asian alone 14,674,252 7,610 355 Black alone 38,929,319 10,207 194 Hispanic origin – of any race 50,477,594 22,119 496 American Indian 2,932,248 71,817 1105 Health Needs Identified
Although no specific needs were identified in the survey, the SAMC team chose to focus on the chronic issues of obesity and access to mental health services.

47
IMPLEMENTATION STRATEGY
48
2013 Community Health Needs Assessment
Sanford Aberdeen Medical Center Implementation Strategy
The following needs were identified through a formal community health needs assessment, resource mapping and prioritization process:
• Mental Health Services • Obesity
Implementation Strategy: Mental Health Services
• Establish adolescent and adult mental health telemedicine services from Sanford Aberdeen to Sanford
Medical Center in Sioux Falls Implementation Strategy: Bariatric Services
• Establish a Sanford Aberdeen-‐based Bariatric Services accredited program
49
2013 Community Health Needs Assessment Enterprise Implementation Strategy
The following unmet needs were identified through a formal community health needs assessment, resource mapping and prioritization process:
• Mental Health Services • Obesity
Implementation Strategy: Mental Health Services -‐ Sanford One Mind
• Completion (to the extent resources allow) of full integration of Behavioral Health services in all primary care clinics in Fargo and Sioux Falls
• Completion (to the extent resources allow) of full integration of Behavioral Health services or access to Behavioral Health outreach in all regional clinic sites in the North, South and Bemidji regions
• Complete presentation of outcomes of first three years of integrated Behavioral Health services • Implementation of integrated Behavioral Health into clinics in new regions • Design Team for Inpatient Psychiatric Unit, Partial Hospitalization and Clinic Space for Fargo presents
recommendations for design of new spaces • Design Team for Sioux Falls Inpatient Psychiatric Units and Partial Hospitalization
Implementation Strategy: Obesity
• Medical Management for Obesity o Develop CME curriculum for providers and interdisciplinary teams across the enterprise
inclusive of medical, nutrition, nursing, and Behavioral Health professionals • Develop community education programming
o Include the following program options in the curriculum to create awareness of existing resources: Ø Family Wellness Center Ø Honor Your Health Program Ø WebMD Fit Program Ø Bariatric Services Ø Eating Disorder Institute Ø Mental Health/Behavioral Health Ø Profile
• Actively participate in community initiatives to address wellness, fitness and healthy living

50
APPENDIX


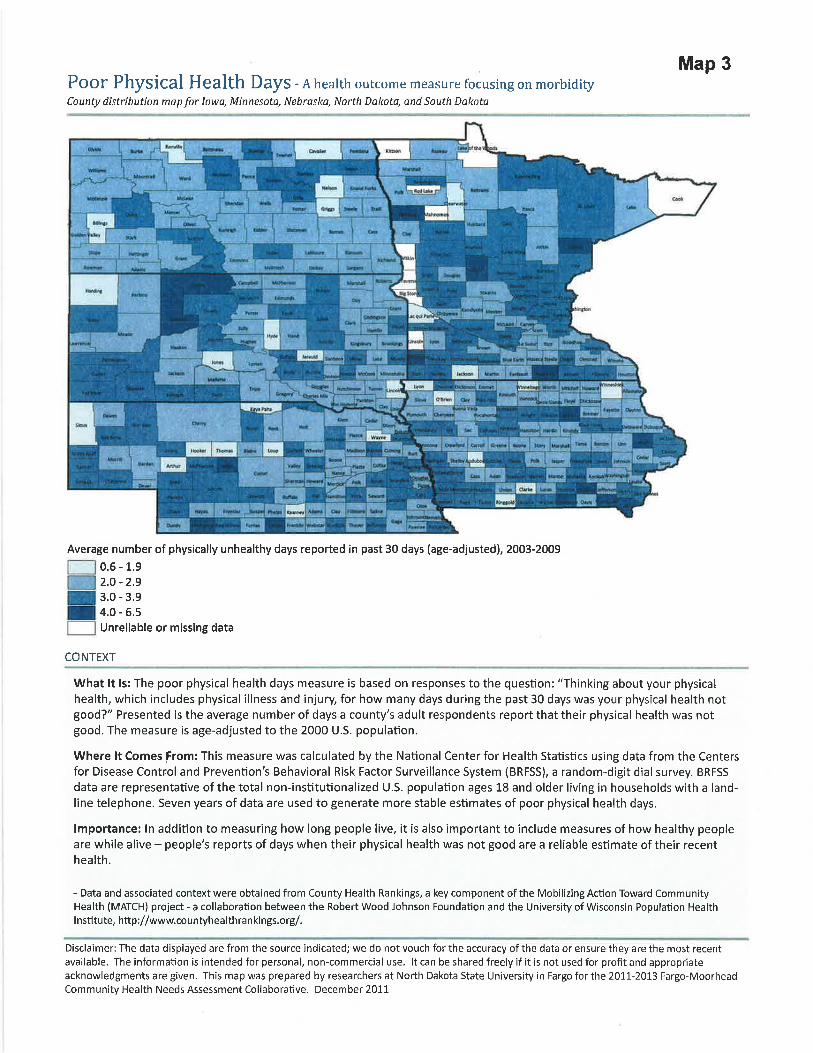
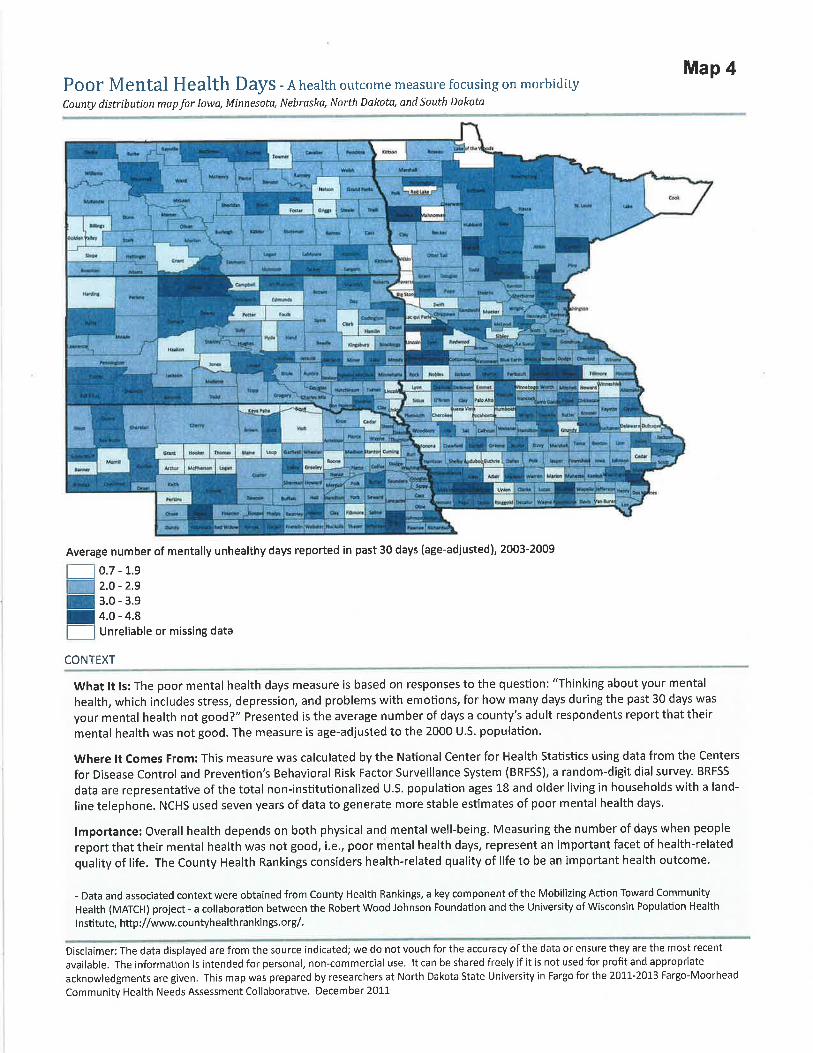
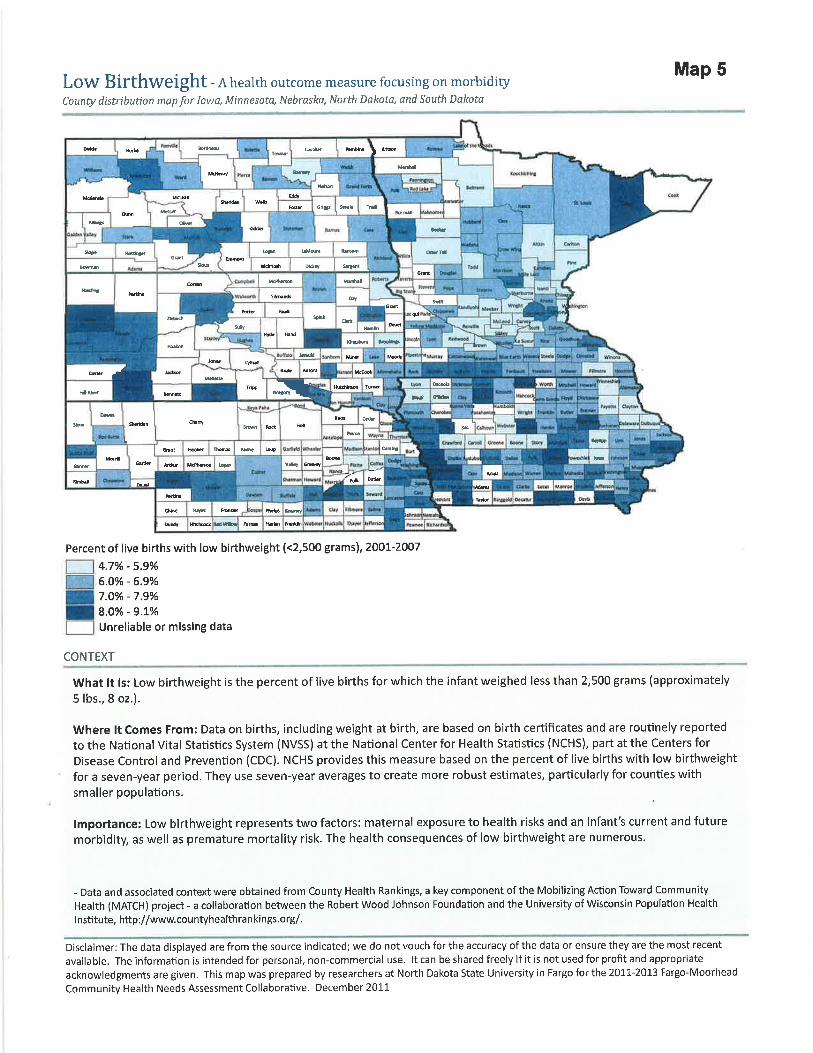

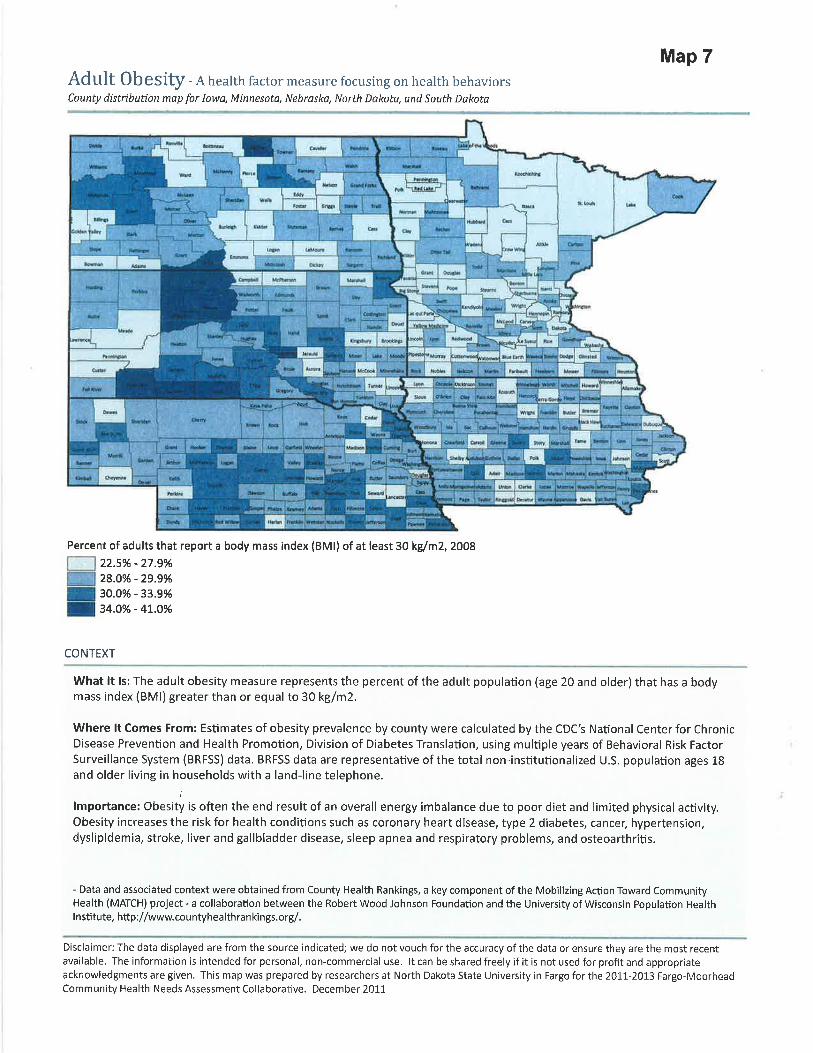
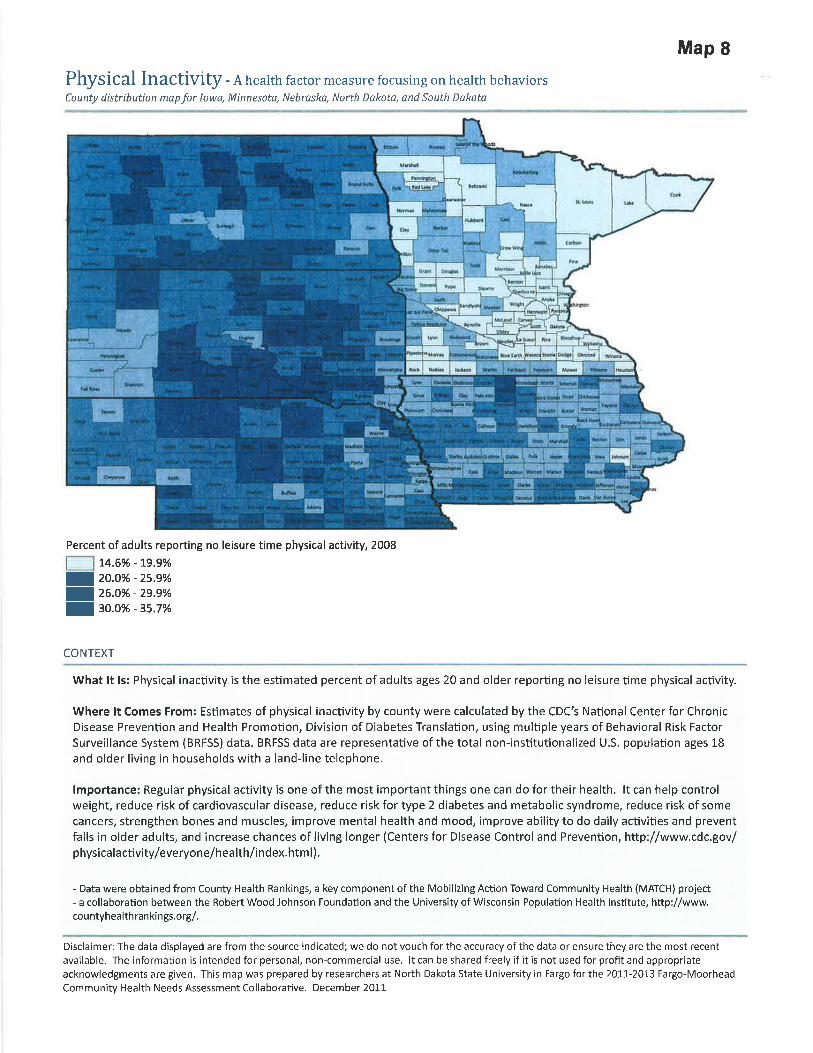


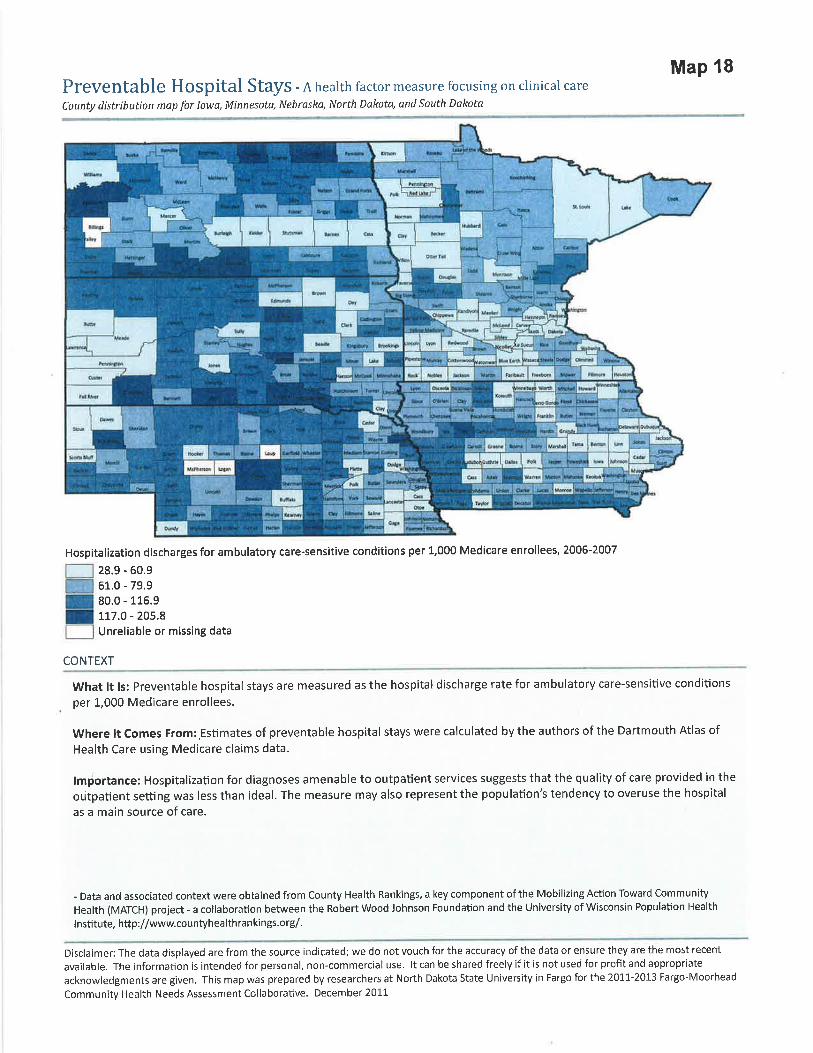


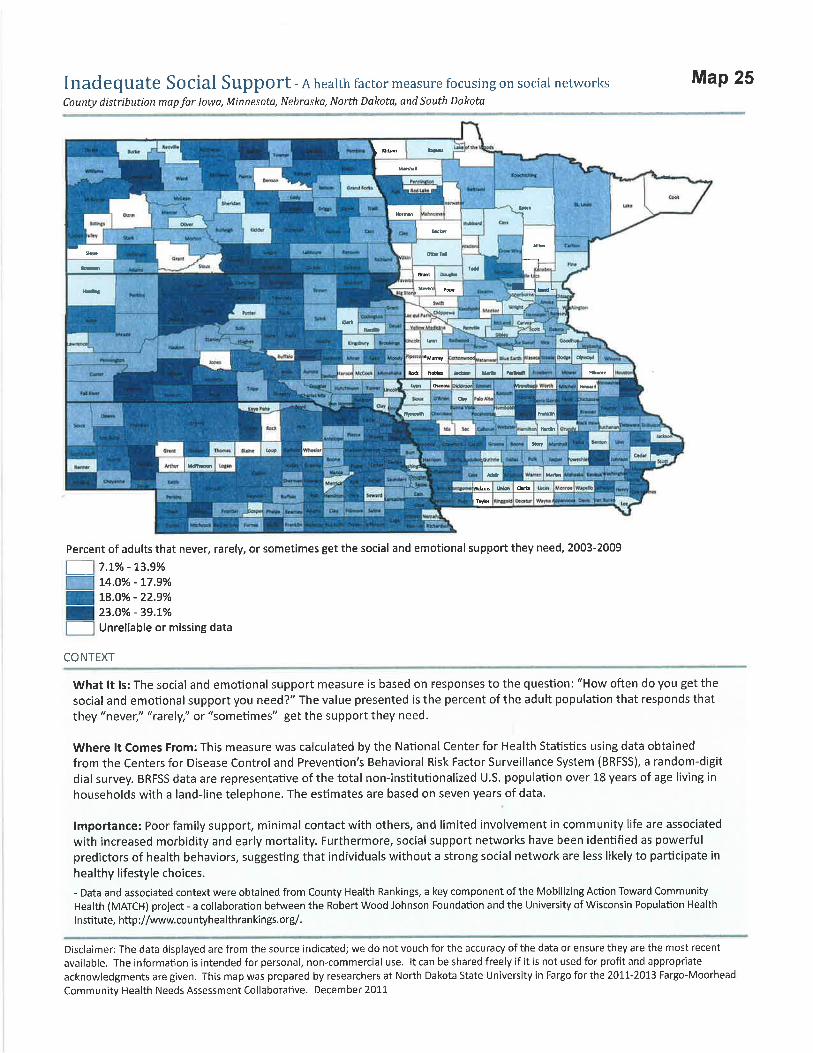
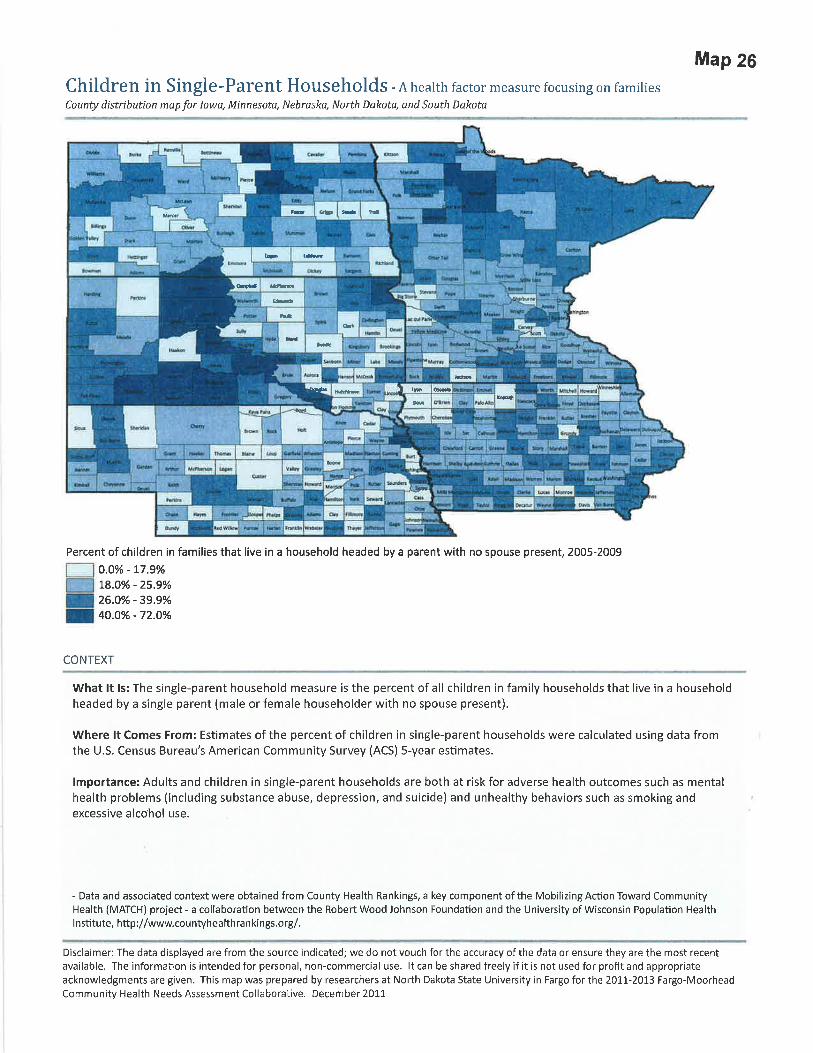

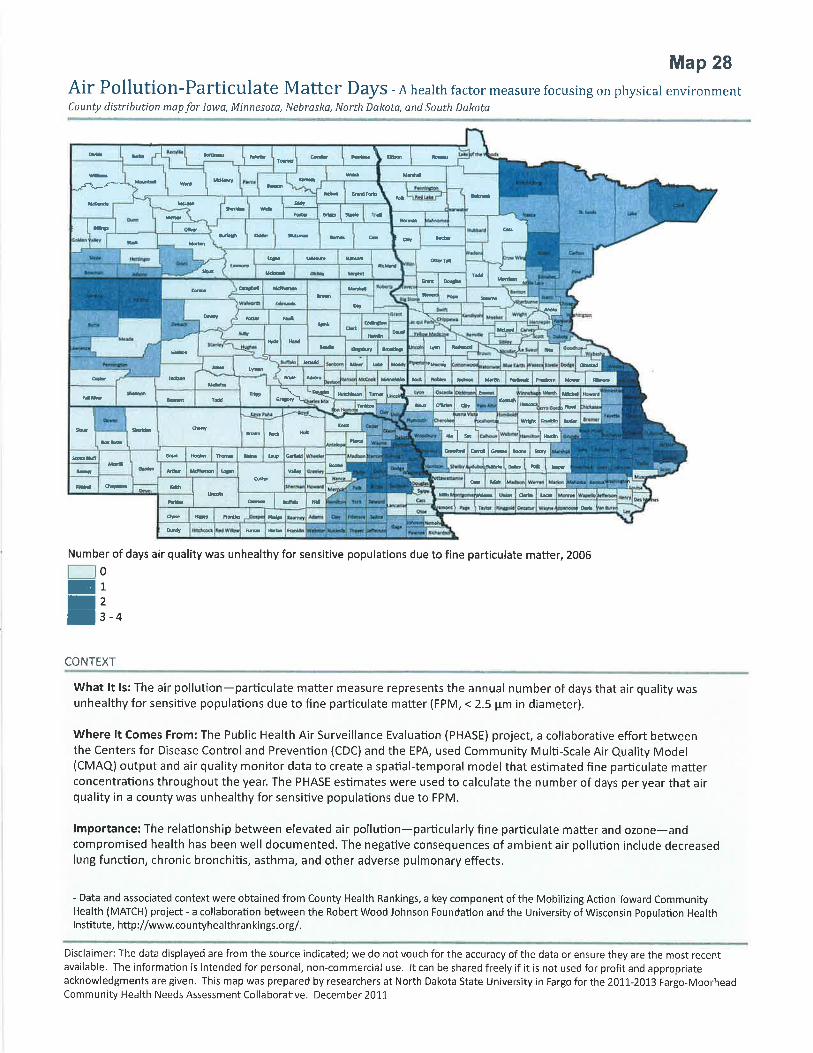


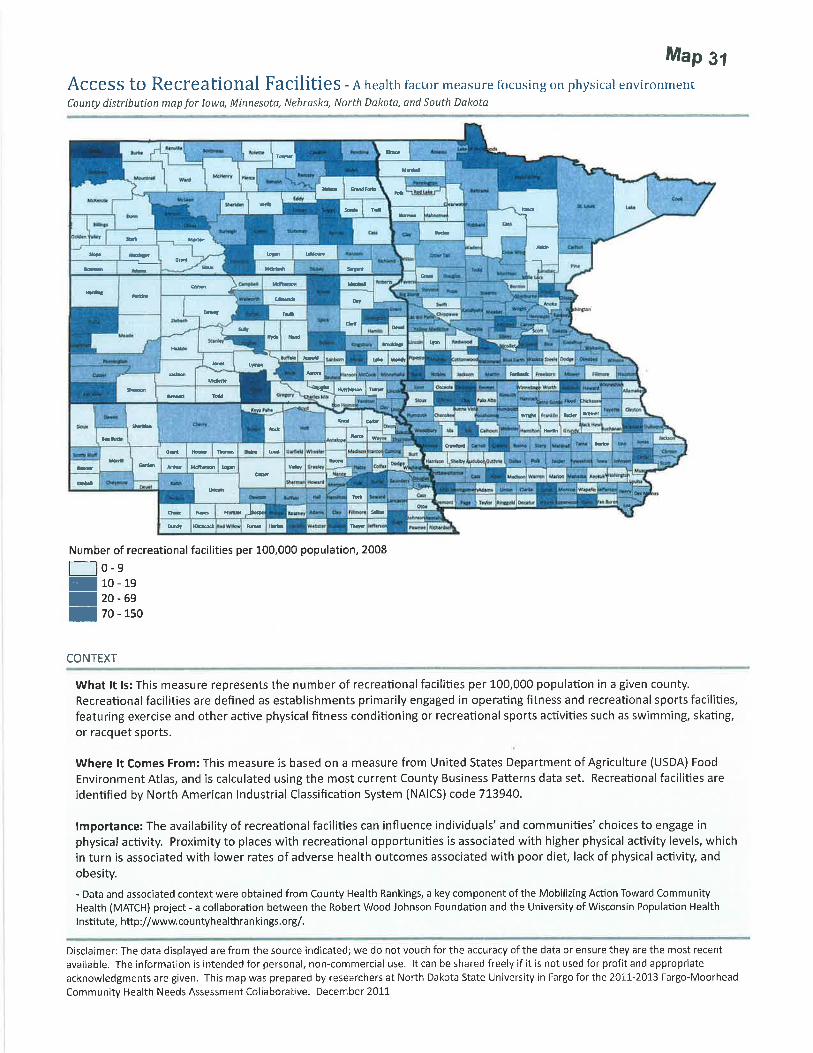

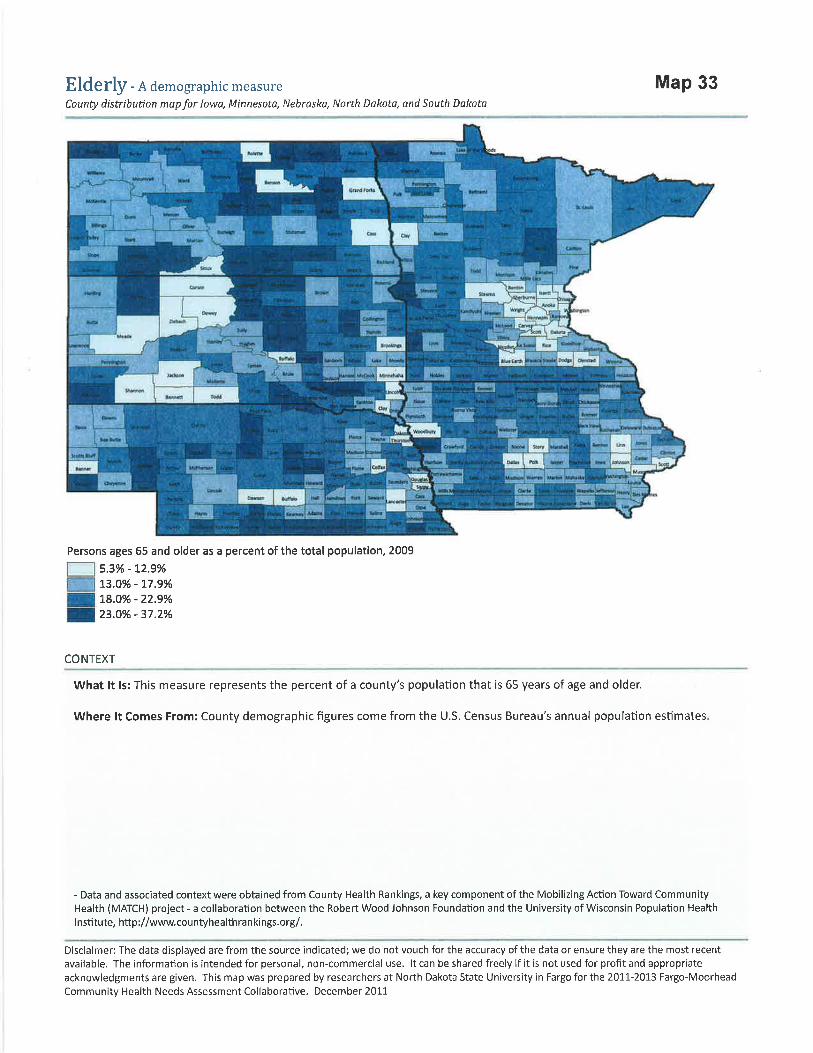

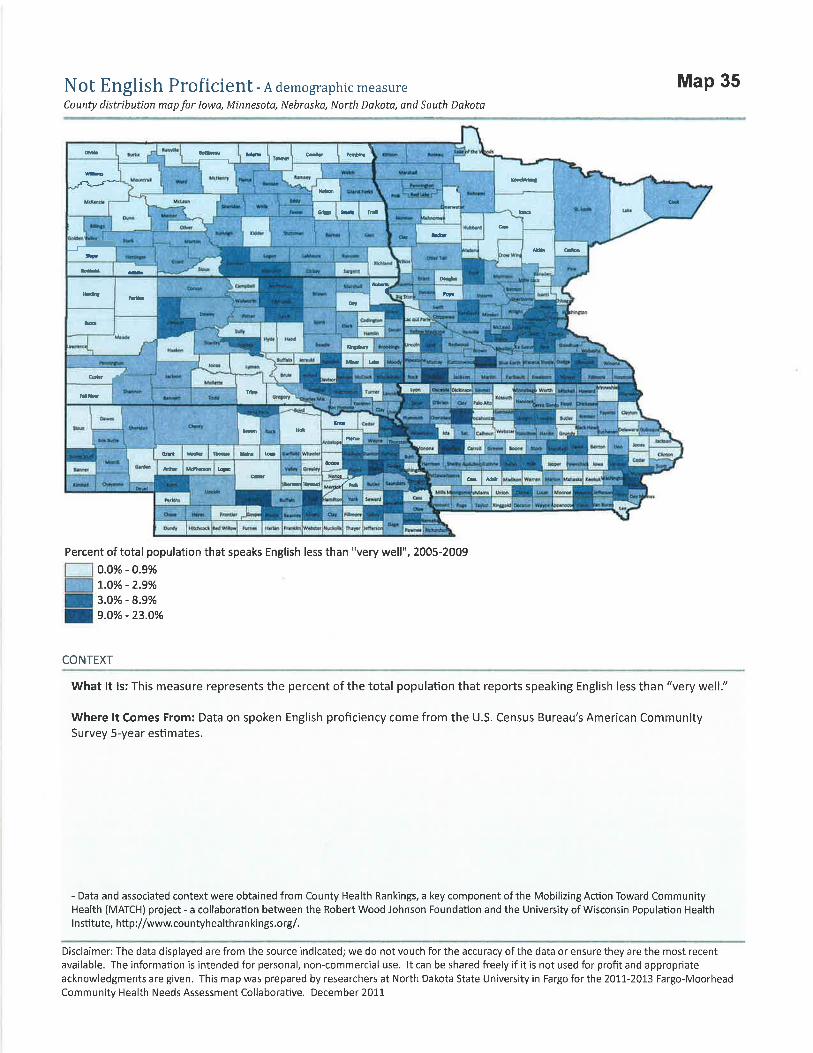


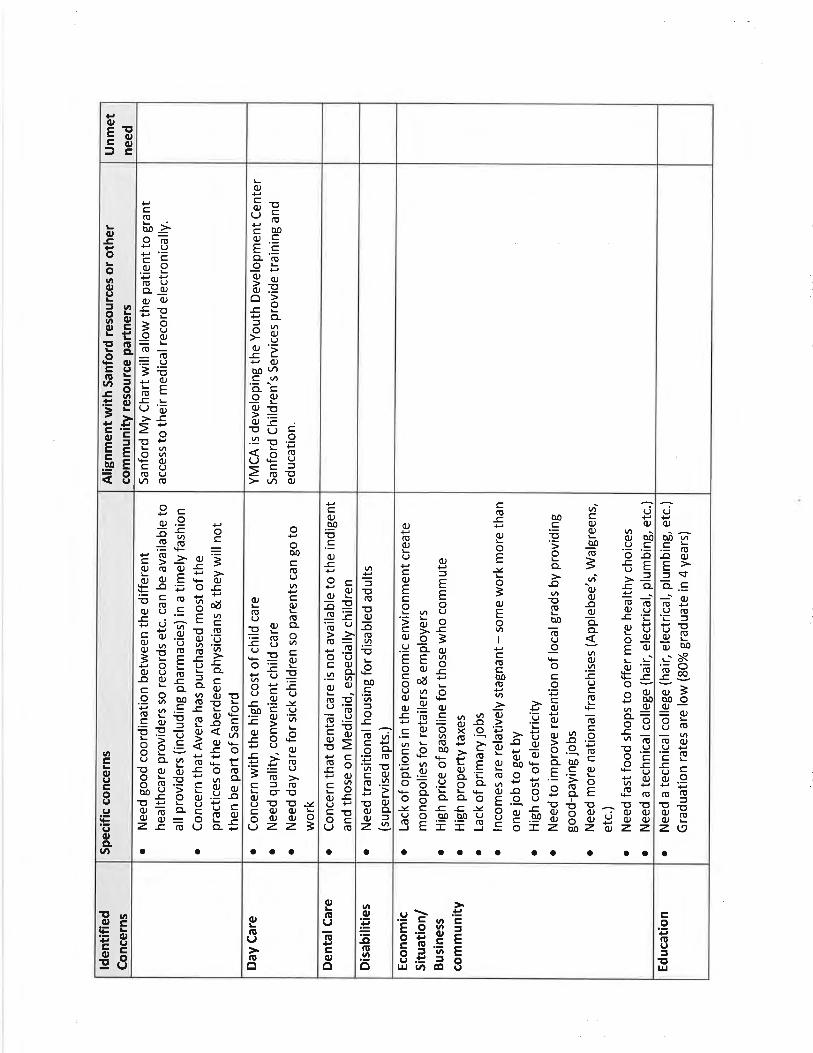

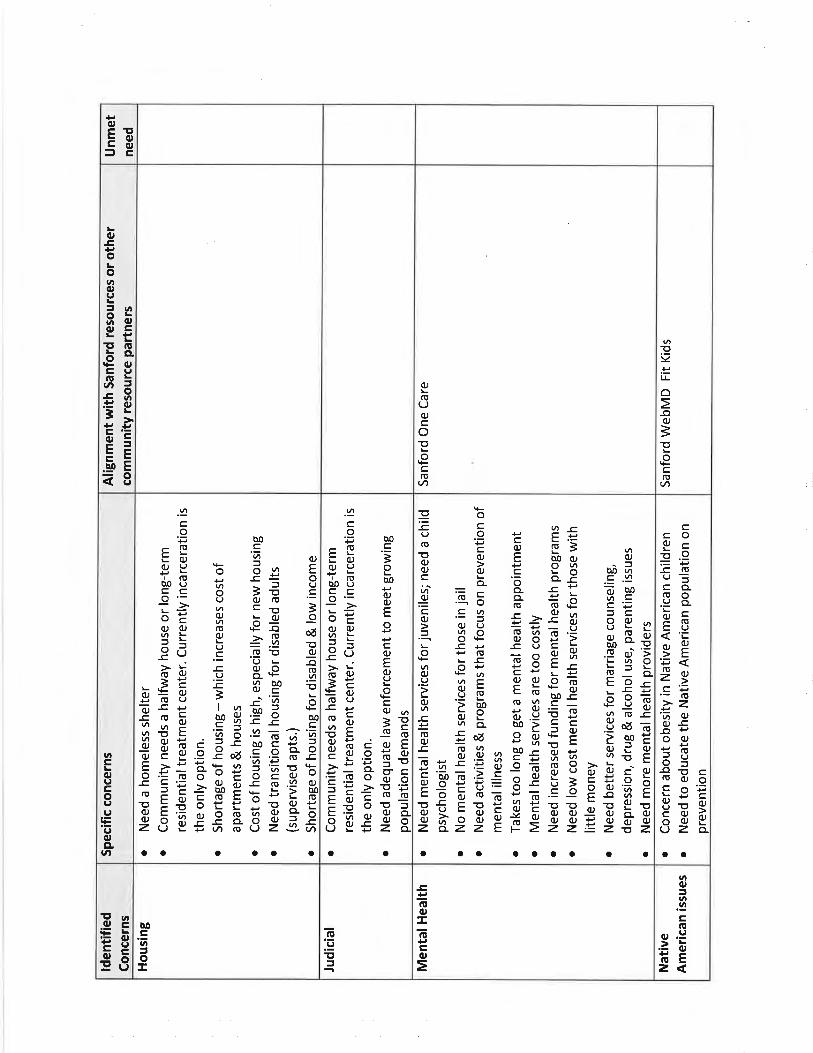


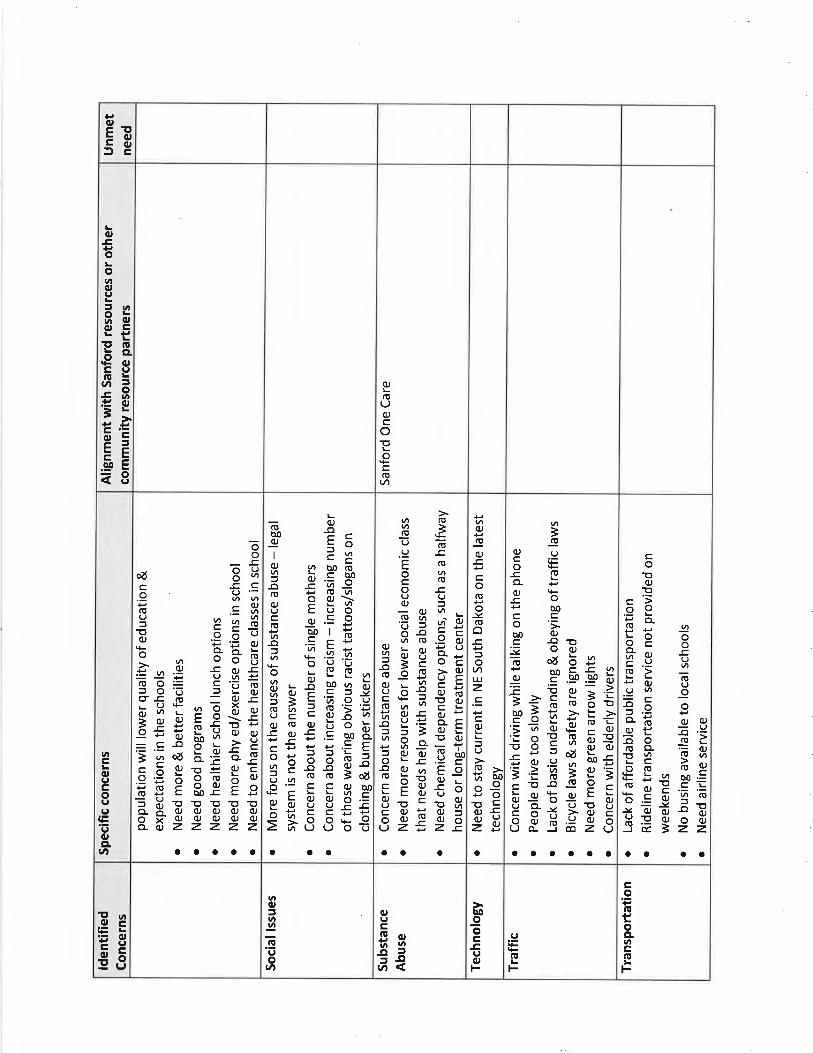


100-
1031
9-00
08 R
ev. 2
/13