COMMUNITY HEALTH NEEDS ASSESSMENT - Archbold
21
COMMUNITY HEALTH NEEDS ASSESSMENT 2019–2020 KEY HEALTH ISSUES AND IMPLEMENTATION PLAN THOMAS COUNTY
Transcript of COMMUNITY HEALTH NEEDS ASSESSMENT - Archbold

COMMUNITY HEALTH NEEDS ASSESSMENT
2019–2020
K E Y H E A LT H I S S U E S A N D I M P L E M E N TAT I O N P L A N
T H O M A S C O U N T Y

• 2 •
2019–2020 Community Health Needs Assessment and Implementation Plan
THIS PUBLICATIONAs part of a leading regional healthcare provider operating the largest acute care hospital in the region (Archbold Memorial Hospital), we take the lead in trying to improve the health of the residents in the communities we serve.
This publication highlights:
• what we’ve identified as the top health-related needs in Thomas County, Georgia
• our measured progress since the 2016–2017 CHNA was published
• our path forward for the 2019–2020 CHNA
We encourage everyone in the community to work together to improve the health status of our community and we hope that this overview of community needs helps provide a road map for those efforts. For additional information on key health needs in our community or outreach programs, please contact Mark D. Lowe, Vice President of Planning and Marketing, at 229.584.5520 or [email protected].
COMMUNITY BENEFIT: A CORE VALUE OF ARCHBOLDArchbold has six core values: Quality, Employee Satisfaction, Patient Experience, Financial Stewardship, Growth and Community Benefit.
Our core values are not only the concepts we believe in, but also how our success is measured. Our leadership team is evaluated by measurable goals under each core value, including Community Benefit.
COMMUNITY BENEFIT MEANS MEETING HEALTH RELATED NEEDSWe are dedicated to protecting the health and well-being of our communities by providing healthcare to the insured, underserved, uninsured and underinsured. It is our commitment to these communities that enabled us to provide $49,124,639 in community benefit during 2018.
A very important part of our work is to serve those who do not always have access to healthcare
because of transportation and financial barriers. Often, we take our
programs and services where our patients need them
most, in the communities in which they live and
work.
Community partnerships are a key to reaching people successfully. We’ve typically worked closely with health departments,
community non-profits, YMCAs,
local schools, law enforcement, churches,
senior services and resource centers, and in this CHNA we
follow up on the new, bolder approach to partnerships and
improving the health of our community we outlined in the
2016–2019 CHNA—Live Better.
DEFINING THE COMMUNITYWe define the communities we serve
as where we operate hospitals within County borders. In Thomas County,
our flagship hospital, Archbold Memorial Hospital, is in Thomasville.
• 3 •
2019–2020 Community Health Needs Assessment and Implementation Plan
35.8 Thomas
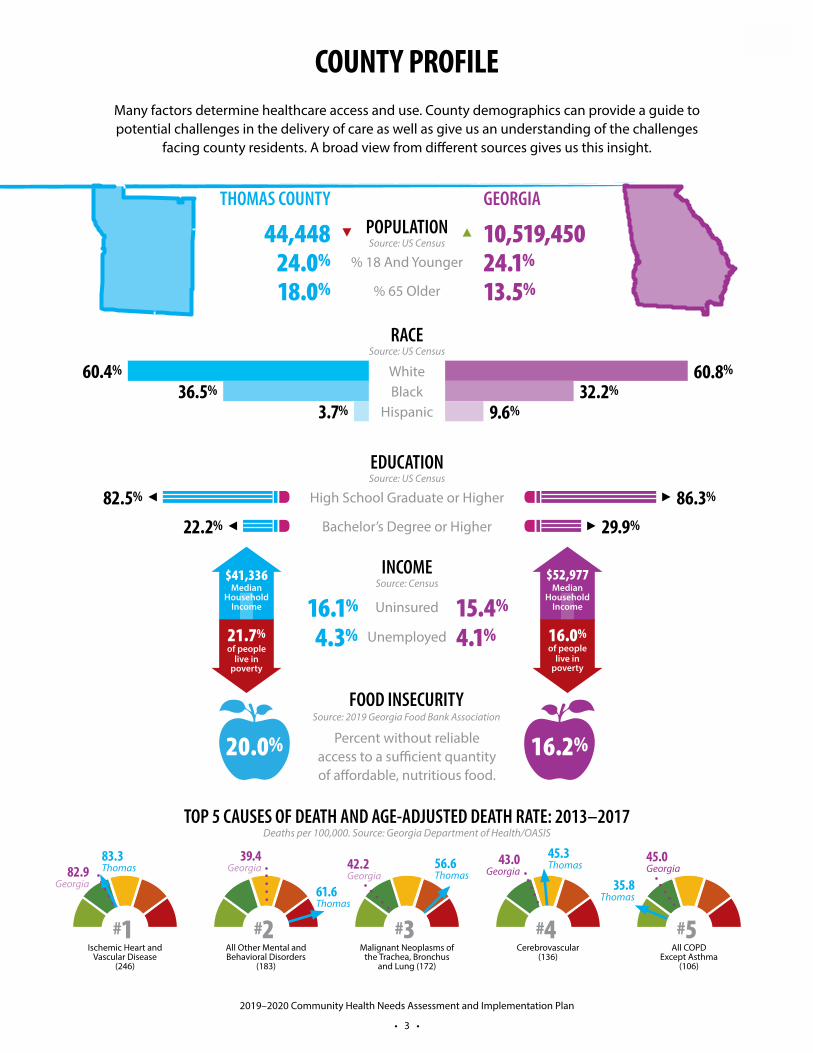
Source: 2019 Georgia Food Bank AssociationFOOD INSECURITY
Percent without reliable access to a sufficient quantity of affordable, nutritious food.
16.2%20.0%
COUNTY PROFILEMany factors determine healthcare access and use. County demographics can provide a guide to potential challenges in the delivery of care as well as give us an understanding of the challenges
facing county residents. A broad view from different sources gives us this insight.
High School Graduate or Higher
Bachelor’s Degree or Higher
82.5%
22.2%
86.3%
29.9%
EDUCATION Source: US Census
36.5%60.4% White
Black3.7% Hispanic
32.2%
9.6%
60.8%
RACE Source: US Census
INCOME Source: Census
Uninsured
Unemployed
16.1%
4.3%15.4%
4.1%
$41,336Median
Household Income
of people live in
poverty
21.7%
$52,977Median
Household Income
of people live in
poverty
16.0%
TOP 5 CAUSES OF DEATH AND AGE-ADJUSTED DEATH RATE: 2013–2017Deaths per 100,000. Source: Georgia Department of Health/OASIS
82.9 Georgia
39.4 Georgia 42.2
Georgia43.0
Georgia45.0 Georgia
83.3 Thomas
61.6 Thomas
56.6 Thomas
45.3 Thomas
POPULATION Source: US Census 10,519,450
THOMAS COUNTY GEORGIA
24.1%
13.5%24.0%
18.0%
% 18 And Younger
% 65 Older
44,448
#1 #2 #3 #4 #5Cerebrovascular
(136)All COPD
Except Asthma (106)
All Other Mental and Behavioral Disorders
(183)
Ischemic Heart and Vascular Disease
(246)
Malignant Neoplasms of the Trachea, Bronchus
and Lung (172)

• 4 •
2019–2020 Community Health Needs Assessment and Implementation Plan
ASSESSING THE NEEDS OF THE COMMUNITYIn order to maximize our impact and operate efficiently, we determine the health needs in the communities we serve through analysis of quantitative federal, state and local data, as well as seeking qualitative input from members of the community, especially the underserved/underestimated. We have found it very effective to assess the health needs of the community through a combination of approaches. These include:
• utilizing assessments conducted by other organizations
• review of federal and state community health status data
• review of internal data such as patient volumes and screening outcomes
• participating in community organizations that identify needs
• responding to requests from the community
COMMUNITY INPUTEach year, new information is considered and previously identified needs are validated as the organization sets priorities for outreach efforts. Although annual review of needs sometimes identifies something new, Archbold’s prioritized efforts are directed toward needs that have been consistent over time. These include high rates of certain diseases as compared with the United States and the rest of Georgia and a need to improve access for underserved/underestimated citizens.
Input from community members representing the broader interests of the county was gathered through a combination of written surveys, telephone interviews and in person meetings. These efforts yielded information that will be used in addressing barriers, allocating resources and assets and determining opportunities to support. Input was considered in determining gaps in
services and to identify whether developing new relationships and partnerships was necessary to meet the needs of the community. We expanded our written surveys for this CHNA than in the 2016–2017 CHNA to further understand factors affecting those in the community we serve. Survey questions included multiple choice and open-ended answers.
Input was gathered from the following sources from February 28–June 6, 2019:
• Magnolia High School Alumni Association Group Meeting and Written Surveys
• Boston Community Screen Written Surveys
• Archbold Hospital Health Talk Written Surveys
• Thomas County Family Connection Written Surveys
• Thomas County Health Department Typically representing low-income/minority/medically underserved population; Written Surveys and Telephone Interview
On the following page are our survey responses.
Qualitatively, the greatest medical needs according to community perception included:1. High Blood Pressure 2. Diabetes3. Heart Disease4. Obesity5. Cancer
6. Back/Joint Pain7. Mental Health Issues8. Drug Addiction9. Lung Disease/
Alcohol Abuse/Stroke
A quantitative analysis of some of the health issues we face every day is included in the Key Health Needs section of Access to Care. Evaluating both qualitative and quantitative information, we chose areas to focus our efforts on where we were best suited to have impact.
On the following page are our survey responses.

2019–2020 Community Health Needs Assessment and Implementation Plan
• 5 •
COMMUNITY HEALTH NEEDS SURVEY RESPONSES
Which of the following describes your current
type of health insurance?
28.4% Medicare
14.4% Employer Provided Insurance
9.3% Dental Insurance
2.3% Government—VA, Champus
16.7% Medicare Supplement or
Medicare Advantage Plan
10.2% Eye/Vision Insurance
1.9% Health Savings/Spending Account1.4% I don’t have health insurance
7.9% I don’t have dental insurance
2.8% Individual/Private Insurance/
Market Place/Obamacare
4.7% Medicaid
During the past 7 days, how many
times did you eat fruit or vegetables?
31.4%
32.4%
17.7%
7.8%5.9%
3.9%
0.9%
KEY
I did not eat fruit or vegetables during the past 7 days
1–3 times during the past 7 days
4–6 times during the past 7 days
1 time per day
2 times per day
3 times per day
4+ times per day
Do you have a primary care
physician?95.2% Yes No 4.8%

Community Health Needs Survey Responses
2019–2020 Community Health Needs Assessment and Implementation Plan
• 6 •
No health insurance
Lack of income
Cannot afford co-pay
No primary care physician
Lack of transportation
Level of Education
Preventative health care not a priority
High Blood Pressure
Diabetes
Heart Disease
Overweight/Obesity
Cancer
Back or Joint Pain
Mental Health Issues
Drug Addiction
Lung Disease
Alcohol Abuse
Stroke
What do you think are the top three health challenges
you feel people face in this community?5.8%
3.6%
22.0%
17.8%
13.6%
7.8%
21.4%
1.6%
3.2%
What do you think is the greatest
barrier for those in this community who do not seek or
receive routine health care?
26.9%
10.8%
7.7%
2.3%
4.6%
10.0%
37.7%
What do you think are the top three unhealthy habits that influence the overall health of this community?
30.2%
29.2%
15.3%
11.2%
7.5%6.8%
Lack of exercise
Poor diet
Tobacco Use
Overuse of prescription
drugs
Alcohol use
Illegal drugs
KEY
KEY
KEY

Community Health Needs Survey Responses
2019–2020 Community Health Needs Assessment and Implementation Plan
• 7 •
KEY
Physician Office
Urgent Care Walk-in Clinic
Emergency Department
Health Department
Do not seek healthcare
Clinic in a drug store
Where do you think most people in this community
go for routine healthcare?
45.7%
9.5%
20.7%
16.4%
6.9%
0.9%
Where do you go for routine
healthcare?
92.9%
5.1%
1.0%
What other health services need to be offered to meet health challenges in this community?• Nutrition
• More doctors for rural areas
• More health education
• Free/low cost clinics
• Medicare expansion
• Stress importance of checkups
• Cancer health talks
• Drug abuse education
• Exercise programs
• Lower cost medications
• Skin care education
• Kidney disease education
• Childhood cancer education
• Need another pulmonary MD
• Open heart surgery
• Less ED wait time
• Legs for life
• Support groups

• 8 •
2019–2020 Community Health Needs Assessment and Implementation Plan
ACCE
SS TO
CARE
Access to care is an issue that typically impacts all of the other community health needs on our list. It is the degree to which individuals and groups are able to obtain a broad range of healthcare without excessive economic strain. Interestingly, as of this CHNA, it is the first time the issue hasn’t been identified as a major health challenge in our qualitative surveys. Quantitatively, lack of insurance, previously a large barrier, appears to be less of an issue. Nationally, the percent of uninsured under age 65 is at 10.2%. Comparatively, county and state percentages are below.
Cancer is the second-leading cause of death among all diseases, both nationally and in Georgia. Some specific types of cancer are on the rise, but a review of all ages and all cancers reveal Thomas County’s incidence rate between 2013–2017 (456.1) is higher than Georgia’s rate, which is higher than the national rate, despite the fact that Thomas County’s rate slightly declined from the last CHNA. When comparing cancer death rates, African-Americans had higher rates for both males and females, regardless of gender. Non-Hispanic White females had a lower death rate from 2013–2017 than the Georgia average, 129.6 to 133.3, comparatively.
CANCER INCIDENCE SNAPSHOT: 2013–2017All Cancer Sites, All Ages, All Races, Both Sexes. Source: State Cancer Profiles, National Cancer Institute, CDC
CANC
ERTHE KEY HEALTH ISSUES OF THOMAS COUNTY
UNINSURED, UNDER AGE 65: 2016–2018Source: University of Wisconsin Population Health Institute
Perc
ent o
f Pop
ulat
ion 21.0
18.016.0
20.0 19.016.0
2016
2017
2018
2016
2017
2018
Georgia Thomas County
5
10
15
20
30
25
0
UNIT
ED ST
ATES
GEOR
GIA
THOM
AS CO
UNTY
441.2 454.6 456.1
Inci
denc
e pe
r 100
,000
2013–2017
100
200
300
400
500
0
Upward trend when compared to previous years
Stable trend when compared to previous years
Downward trend when compared to previous years

The Key Health Issues of Thomas County
2019–2020 Community Health Needs Assessment and Implementation Plan
• 9 •
CARD
IOVA
SCUL
AR D
ISEA
SE
More than 30 million Americans have diabetes, and another 84 million US adults have prediabetes, a serious health condition in which blood sugar levels are higher than normal but not high enough yet to be diagnosed as type 2 diabetes. A person with prediabetes is at high risk of type 2 diabetes, heart disease and stroke. A person with diabetes is at high risk of heart disease, stroke and other serious complications, such as kidney failure, blindness and amputation of a toe, foot, or leg. In the last 20 years, the number of adults diagnosed with diabetes has more than tripled as the US population has aged and become more overweight.
The diagnosed diabetes rate in Thomas County exceeds both state and national rates.
DIAGNOSED DIABETES RATE: 2014–2016Age adjusted. Source: CDC, National Diabetes Surveillance System, County Health Rankings and Roadmaps
DIAB
ETES
MAJOR CARDIOVASCULAR DISEASES MORTALITY: 2015–2017All ages. Source: OASIS, CDC
According to the American Heart Association (AHA), about 610,000 people die of heart disease in the United States every year—that’s one in every four deaths. Heart disease is the leading cause of death for both men and women. Coronary heart disease (CHD) is the most common type of heart disease, killing over 370,000 people annually. High blood pressure, high cholesterol and smoking are key risk factors for heart disease. About half of Americans (47%) have at least one of these three risk factors. Obesity and diabetes also are major risk factors.
Thomas County ranks among the counties with the highest mortality levels in Georgia, yet in recent years a lower cardiovascular disease rate than in Georgia has been observed.
Mor
talit
y pe
r 100
,000
168.5 165.5 165.0
235.8 240.5 236.2
188.1
256.5
215.8
2015
2016
2017
2015
2016
2017
2015
2016
2017
United States Georgia Thomas County
50
100
150
200
250
300
0
Perc
ent o
f Pop
ulat
ion
0
5
10
15
20
9.1 9.1 9.5
2014
2015
2016
10.0
2014
11.0
2015
11.0
2016
14.0
2014
15.0
2015
14.0
2016
United States Georgia Thomas County

The Key Health Issues of Thomas County
2019–2020 Community Health Needs Assessment and Implementation Plan
• 10 •
176.0
213.9
KIDN
EY D
ISEA
SEChronic Kidney Disease (CKD) affects an estimated 30 million people, or 15% of US adults. When the kidneys stop working, dialysis or kidney transplant is needed for survival. Kidney failure treated with dialysis or kidney transplant is called end-stage renal disease (ESRD).
Two of the main causes of CKD are diabetes and hypertension—potentially reversible conditions with proper diet and exercise. It is very difficult to make statistically consistent comparisons of CKD on a national, state and local level because variances within specific data sets are so complex and specific enough that attempts to compare would be highly estimated, and perhaps inaccurate. And so, we are choosing to focus on comparable local and state statistics.
DIABETES MORBIDITY: 2015–2017Deduplicated Discharges and Age-Adjusted Rate. Source: Oasis
HYPERTENSION MORBIDITY: 2015–2017Deduplicated Discharges and Age-Adjusted Rate. Source: Oasis
Dis
char
ges
per 1
00,0
00
50
100
150
200
250
0
135.5 137.0
170.4150.2
Georgia Thomas County
Dis
char
ges
per 1
00,0
00
40
20
60
80
100
80.3
61.4
32.1
Georgia Thomas County
82.0
23.232.5
2015
2015
2016
2016
2017
2017
2016
2015
2016
2015
2017
2017
0
OBES
ITY
OBESITY PREVALENCE: 2015–2017Source: CDC-BRFSS, University of Wisconsin Population Health Institute
Obesity is a national epidemic, causing higher medical costs and a lower quality of life. In every state, more than 15% of adults are obese, and in nine states, over 30% of adults are obese. Obesity is a preventable, yet contributing cause of many other health problems, including heart disease, stroke, diabetes and some types of cancer, some of the leading causes of death in the country. Southwest Georgia has some of the higher obesity rates nationally.
Perc
ent o
f Pop
ulat
ion
0
5
10
15
35
20
25
3028.9 29.6 30.1 29.0 29.0 30.0 31.0
33.0 34.0
2015
2016
2017
2015
2016
2017
2015
2016
2017
United States Georgia Thomas County

The Key Health Issues of Thomas County
2019–2020 Community Health Needs Assessment and Implementation Plan
• 11 •
STRO
KE
STROKE MORTALITY: 2015–2017Source: CDC, Oasis
Someone in the United States has a stroke every 40 seconds. Every 4 minutes, someone dies of stroke. Stroke is the fifth leading cause of death for Americans, but the risk of having a stroke varies with race and ethnicity. Risk of having a first stroke is nearly twice as high for blacks as for whites, and blacks have the highest rate of death due to stroke. Though stroke death rates have declined for decades among most races/ethnicities, Hispanics have seen an increase in death rates since 2013. High blood pressure, high cholesterol, smoking, obesity and diabetes are leading causes of stroke—1 in 3 US adults has at least one of these conditions or habits. By far, the country’s highest death rates from stroke are in the southeastern United States.
Mor
talit
y pe
r 100
,000
United States Georgia Thomas County
10
20
30
40
50
0
37.6 37.6
2015
37.3
2016
2017
43.9 44.2 43.4
2015
2016
2017
33.139.0
48.1
2015
2016
2017
RESP
IRAT
ORY D
ISEA
SE
CHRONIC LOWER RESPIRATORY DISEASES MORTALITY: 2015–2016Age adjusted. Source: GA Oasis, CDC
More than 25 million people in the United States have asthma. Approximately 14.8 million adults have been diagnosed with COPD, and approximately 12 million people have not yet been diagnosed. Lung cancer is by far the leading cause of cancer death among both men and women. Each year, more people die of lung cancer than of colon, breast and prostate cancers combined. All represent major chronic respiratory diseases, and many cases can be prevented by not smoking.
Smoking clearly has a direct impact on respiratory diseases, one reason why Archbold continues to offer free smoking cessation classes to the community. And it’s necessary: the 2019 County Health Rankings and Roadmaps report estimates the smoking rate among adults in Thomas County is at 20%, compared to 18% in Georgia and 14% nationally.
Mor
talit
y pe
r 100
,000
41.6 40.6
2015
2016
80.5 80.420
15
2016
85.1
67.8
2015
2016
United States Georgia Thomas County
20
40
60
80
100
0
The 2016–2017 Implementation Plan and Progress
2019–2020 Community Health Needs Assessment and Implementation Plan
• 12 •
LOOKING BACK: FROM WORDS TO ACTIONIn the 2016–17 CHNA, we introduced the newly launched Live Better initiative—an Archbold-led effort of key community leaders and partners focused on improving the overall health of the citizens of Thomas County.
Live Better was formed as part of a challenge from our President and CEO, Perry Mustian, for Archbold to do even more to improve the health of our community. Archbold has always had some form of clinical outreach, most often offered in the form of early identification efforts such as free screenings, prevention efforts such as our branded Health Talks, or interventional education like breastfeeding or smoking cessation classes. While those efforts have had positive impact, they really haven’t moved the needle substantially on the overall health of our community or the major prevalent diseases that exist.
We began to research current population health literature and what other hospitals were doing, which included an American Hospital Association publication that listed some of the hospitals with noteworthy efforts and apparent best practices. There was a common theme with several of the hospitals—they had reached out to leaders in key segments of the community to figure out a way to work together to improve the health of their communities. Most often, a hospital would partner with a municipality, or a school, or a large business in some way. That’s really when the Live Better concept started to form. We decided that making an effort to change the environment we live in was really going to be a key to actually making a difference.
To decide what to focus on, we consulted our 2016–2017 Community Health Needs Assessment. Qualitatively, obesity ranked #2 on our top ten perceived health issues. Co-morbidities related to obesity filled out six of the nine remaining places.
Quantitatively, according to the CDC and the University of Wisconsin Population Health Institute, our county obesity rate in 2013 (34%) was higher than Georgia (30.3%) and the U.S. (29.4%). Along
with the prevalence of chronic disease, these averages are generally rising, and the impact on our families and businesses are profound. After we reviewed the measures, we realized we had an opportunity to create very focused, simple goals. Instead of focusing on all our disease states separately, we needed to concentrate on the one condition that could achieve the greatest value and affect the most disease states—obesity. By focusing on obesity, we were addressing high blood pressure, diabetes, heart disease, cancer and many other correlated health conditions.
We thought: What if we found not just one large partner in the effort, but several key partners to form an alliance? If we leveraged the strengths of each entity on board, we stood a much better chance of improving health than if the hospital tried to do it alone or with just one partner. And so, alongside Archbold’s vice president of planning and marketing and clinical outreach manager, we formed an advisory board of chief decision-makers that would represent each of the major sectors of our community (local government, education, business and the media).
Three years after inception, our advisory board continues to collaborate, problem-solve and put into action solutions that involve what each member organization and our growing list of community partners can offer. We have measurable goals, and make data-based decisions to adjust our strategies until we find what works best. To further validate our efforts, the Georgia Hospital Association awarded Archbold and Live Better the 2017 Community Leadership Award.
MEASURING PROGRESS One way we create legitimacy and accountability in every aspect of the program is to create measurable goals. Creating separate goals for adults and children—especially younger students—is necessary, given that it takes different approaches to find success for different groups.

The 2016–2017 Implementation Plan and Progress
2019–2020 Community Health Needs Assessment and Implementation Plan
• 13 •
As a group, we decided not to focus on epidemiological data (self-reported, smaller sample size), as we couldn’t measure our efforts until years later, negating any opportunity to quickly adjust our strategies and tactics if we see indicators of unsuccessful approaches. Instead, we measure goal progress using near real-time data.
For our adults, we use data from a large primary care practice as well as a Federally Qualified Healthcare Center to ensure we included input from a practice that primarily focused on the underserved. Between the two practices, we were able to capture BMI data for approximately 7,500 patients.
For children, we continue to focus on K–5 students as our sample group. Our two school superintendent board members helped us craft the goals for this group.
For the 2016–17 CHNA and years immediately following CHNA plan implementation, our goals to address obesity, and, in turn, the disease states that obesity impacts were:
Increase the number of students in grades K–5 who fall within the Healthy Fitness Zone by 3%, as measured by the BMI using the Fitness Gram assessment, during each school year (Measure using real-time school data)
Results: In our K–5 population, we had mixed results.
Healthy Fitness Zone: K–5
Decrease the average of percent of adults in morbidly obese and obese BMI categories in a sample population of over 7,500 Thomas County residents by 1%, from 50% to 49% each year (Measure using real-time EHR data sample)
Results: We have seen some modest decreases in obesity in our adult population, as evidenced in the chart below. These decreases helped us meet our adult goal in the most recent period.
BMI: Obese Adults
Perc
ent o
f Pop
ulat
ion
5
10
25
20
15
Year 1 Year 2 Year 3
30–34.9
35–39.9
40–44.9
Greater than 50
45–49
BMI21.82
14.85
8.66
4.35
3.81
0
3 YEAR LOW
3 YEAR LOW
3 YEAR LOW
3 YEAR LOW
We are actively working with our advisory group members on specific projects in each of the sectors of the community they represent, as well as our own:
Business—Recruiting restaurant partners to identify healthy choices on their menus, as well as create specific Live Better-endorsed meals, working with grocery stores to display Live Better Buys for sale-priced healthy foods, further researching how to address food deserts and food insecurity
We knew early on it would take even broader collaboration beyond our Live Better Board to achieve long-term success. We created a Live Better “partner” level so that businesses and organizations in the community could actively support the goals by leveraging the strengths of their organizations, big or small.
When we began this process, we had a handful of partners. To date, 35 community businesses have now signed agreements to be Live Better partners. We have 14 local restaurants that make it easier for patrons to choose healthier meals by highlighting “Live Better” menu items that meet nutrition criteria developed by our registered dietitians, six gyms, two banks, Thomas University, Southern Regional Technical College, the Thomas County Library several other local businesses. All community partners have committed in
0
2016
–201
7
2017
–201
8
2017
–201
8
2016
–201
7
Perc
ent o
f Pop
ulat
ion
6062
58
63
55
60
65
City Schools County Schools

The 2016–2017 Implementation Plan and Progress
2019–2020 Community Health Needs Assessment and Implementation Plan
• 14 •
Live Better Partners Lewis Produce, Thomas County Library, Thomas University
Live Better inclusion in City of Thomasville’s Blueprint 2028 Comprehensive Plan
writing as to how they will contribute to improving the health of the community.
Government—Inclusion on city and county planning committees to address community exercise paths and making Thomas County more walk/bike/run-friendly through policy and public events
One of the earliest, impactful wins was the opportunity to improve the physical space in which our citizens live. Many communities across the country have been designed for the needs of automobiles rather than human health, and the decline in our overall health has been well-documented and partially attributed to this fact.
As a result of efforts seen across the community, Archbold’s vice president of planning and marketing was appointed to the City of Thomasville’s Planning and Zoning Commission. Having a seat at the table, able to participate and vote, has helped reshape three parks, begin work on a 16-mile community trail and improve Thomasville’s main traffic corridor. Of particular note is the addition of sidewalks and bicycle lanes, a direct focus on transforming the built environment to help improve the health and safety of our community.
As a result of the positive momentum and health strategy Live Better created, the City of Thomasville specifically recommended continued involvement with Live Better in the city’s 10-year Comprehensive Plan, their strategic roadmap for the next decade.
The 2016–2017 Implementation Plan and Progress
2019–2020 Community Health Needs Assessment and Implementation Plan
• 15 •
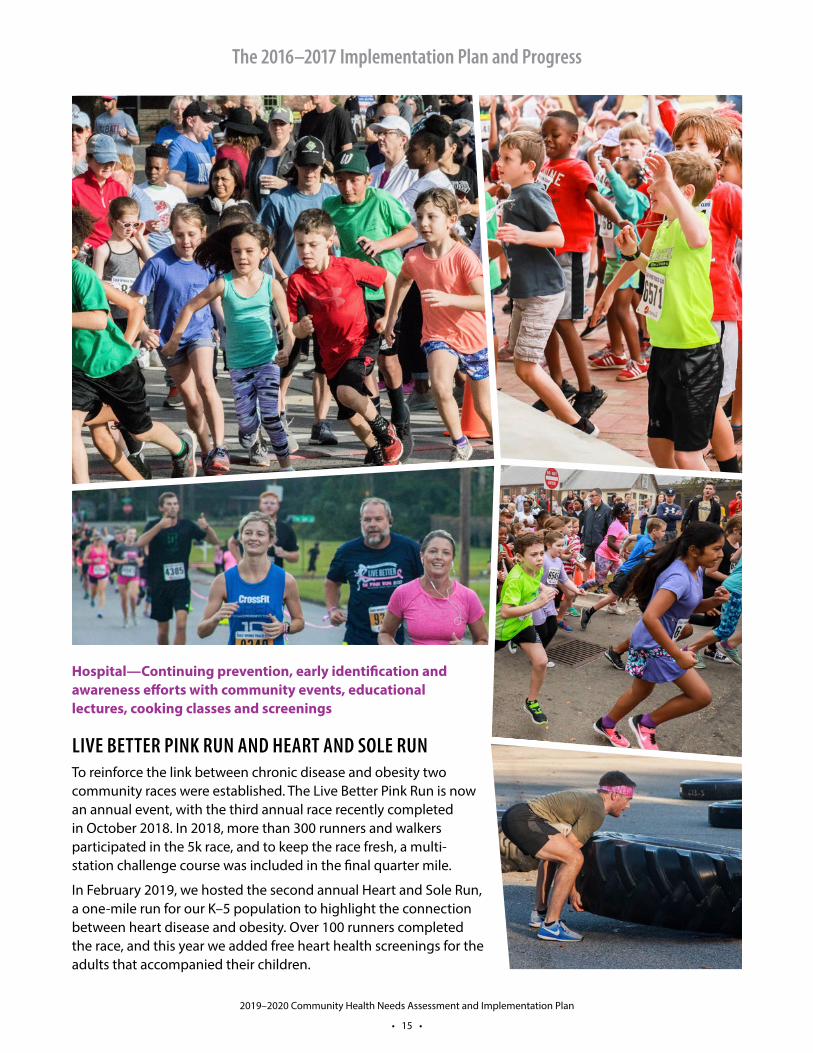
Hospital—Continuing prevention, early identification and awareness efforts with community events, educational lectures, cooking classes and screenings
LIVE BETTER PINK RUN AND HEART AND SOLE RUN To reinforce the link between chronic disease and obesity two community races were established. The Live Better Pink Run is now an annual event, with the third annual race recently completed in October 2018. In 2018, more than 300 runners and walkers participated in the 5k race, and to keep the race fresh, a multi-station challenge course was included in the final quarter mile.
In February 2019, we hosted the second annual Heart and Sole Run, a one-mile run for our K–5 population to highlight the connection between heart disease and obesity. Over 100 runners completed the race, and this year we added free heart health screenings for the adults that accompanied their children.

The 2016–2017 Implementation Plan and Progress
2019–2020 Community Health Needs Assessment and Implementation Plan
• 16 •
TEAM LIVE BETTER Team Live Better is a three-month program for Team Lean participants to continue their journey toward weight loss or weight maintenance and help them transition from the eight-week weight-loss competition to a long-term healthy lifestyle. As part of Team Live Better, the YMCA has committed to developing one-on-one relationships with participants to provide the accountability and support that is needed to help participants reach their immediate and long-term goals. The YMCA also offers weekly health challenges and ongoing weight checks. Our hospital staff is contributing additional resources, including special community-based health talks and cooking classes for participants.
Live Better, the Archbold-led collaborative of key community leaders and partners focused on improving the overall health of the citizens in Thomas County, recently kicked off the Live Better Fit program. The Live Better Fit program is a 25-week wellness program, where ten participants chosen by the six Live Better partner gyms learn how to lead healthier lifestyles.

The 2016–2017 Implementation Plan and Progress
2019–2020 Community Health Needs Assessment and Implementation Plan
• 17 •
EAT bet ter. Live Bet ter. Wellness Wednesday
Food is fuel for our bodies
and more is not always better.
ENJOY YOUR FOOD, BUT EAT LESS!
Archbold-LiveBetter-WellnessWedesdays-EatLess-Feb2019.indd 1 1/21/19 8:00 AM
SUPERFOOD:SUPERFOOD:
Sweet PotatoSweet Potato
Archbold-LiveBetter-SuperfoodPoster-SweetPotato-Nov2018.indd 1 10/13/18 3:19 PM
LEMON HERB SALMON
INGREDIENTS2 Tbsp lemon juice 11/2 Tbsp fresh parsley, chopped1/4 tsp salt1/4 tsp black pepper 11/2 lb salmon, fresh or frozen, ~4 oz. portions3 Tbsp canola oil
METHODThaw fish, if frozen. In a
small bowl, mix together oil, lemon juice, parsley, salt
and freshly ground black pepper. Pour marinade
over fish and let marinate for at least 15–30 minutes.
Cook fish in one of 3 ways: Bake: Preheat oven to 400°F,
remove fish from marinade and place on a sheet pan in a single layer. Cook in
oven about 10–15 minutes until cooked through.
Pan sauté: Preheat 1–2 Tbsp oil on medium heat in a non stick sauté pan.
Remove fish from marinade and add to pan. Pan sear
fish until cooked through, about 3 minutes per side.
Grill: Preheat grill. Grill fish until cooked
through, about 3 minutes per side.
Archbold-LiveBetter-WellnessWedesdays-Seafood-Nov2018.indd 210/18/18 9:24 PM
Schools—Creating and delivering educational curriculum for grades K–5 to supplement existing health education
MY PLATE AND TRY DAYS My Plate and ChooseMyPlate.gov is the United States Department of Agriculture’s effort that redefined the traditional food pyramid, transforming the pyramid concept of food groups to categories represented visually on a plate. Live Better decided to use My Plate as the centerpiece of addressing our K–5 goals.
We anually purchase thousands of My Plates and My Plate placemats for every K–5 student in Thomas County. We work with school nutrition directors to plan a grade-specific My Plate curriculum for all K–5 students for integration into their health education courses. Students are encouraged to take the contents of their lunches and put the foods in the appropriate sections on the My Plate to visually see how to make a My Plate meal. We have committed to continuing funding these purchases as part of our long-term strategy.
At the end of the 2017–18 school year, we sought feedback from the school administrators and teachers. We used this
feedback to modify our wellness curriculum to create an even higher-profile focused approach for use in the 2018–19 school year. Students only have so much control over choices related to wellness, so we needed to reach parents with our Live Better messages as well. To help reinforce our school wellness curriculum, we created and provided Live Better print materials to go home on a cyclical basis to parents of each K–5 student. One added piece is “Wellness Wednesday” health tips. Each Wednesday during the school year, a Live Better health tip is shared during the morning announcements at school and a corresponding Live Better handout goes home to parents. We also developed a Superfood of the Month series, working with the school nutrition directors to select superfoods to highlight and incorporate
Modified Push-up
Power Move of the Month
Train bet ter. Live Bet ter. Wellness Wednesday
Archbold-LiveBetter-WellnessWedesdays-ModPushup-Feb2019.indd 11/21/19 7:22 AM
EAT bet ter. Live Bet ter.
Wellness Wednesday
LEAN PROTEINALL ABOUT
LEAN PROTEINALL ABOUT
Seafood, like fish, is not
only a good source of
protein, but it also provides
our body with Omega-3 fatty acids like DHA and
EPA. Research has shown that
Omega-3 fatty acids play
important roles in growth
and development and may
also be heart protective.
MyPlate Recommendation:
Choose seafood as a protein at least twice a week.
Archbold-LiveBetter-WellnessWedesdays-Seafood-Nov2018.indd 110/18/18 9:24 PM
Superfood Poster
“Wellness Wednesday” health tips

The 2016–2017 Implementation Plan and Progress
2019–2020 Community Health Needs Assessment and Implementation Plan
• 18 •
into the school cafeteria menu each month. As part of our Superfood of the Month series, Superfood posters are delivered to each school for display in the cafeteria during the respective months. We also design and print Superfood newsletters that go home to parents each month that include Superfood nutritional benefits, preparation tips and recipes.
The Superfood series also includes Superfood “Try-Days” provided by our hospital food and nutrition team at all Thomas County elementary schools. Try-Days give students a chance to taste the Superfood of the Month in a recipe prepared by our hospital chef. The recipe is sent home with each student, as well. Students who taste the superfood receive an “I am a Superfood Hero, I tried something new today” sticker and are able to enter their name for door prize drawings. We visited each of the seven Thomas County elementary schools, where approximately 4,000 K–5 students had the opportunity to taste a Superfood. Over 98% of the students present at Try-Days tried a Superfood. For most of the students it was either the first time they tasted that particular superfood or the first time they tasted it prepared in such a way.
OTHER HEALTH PROGRAMSThirty community screenings were held, recording blood pressure, pulse, BMI, Height/Weight, lipid panels and glucose levels. Head, neck and colon cancer screens were available at some screenings as well. Screening participants with elevated levels or areas of concern were directed to follow up with their primary care physician. If the participant didn’t have a primary care physician, attempts were made to connect the participant with a provider that was a good fit. Sometimes this included steering the participant to the Federally Qualified Health Center in their community.
Educationally, we continued to offer monthly free smoking cessation classes and childbirth education. Two maternity and infant care educational events were also held for the community. Seventeen health talks were held on a wide range of topics including heart disease, Alzheimer’s Disease, women’s health, organ donation, obesity, preventative medicine, healthy eating, back pain and cancer.Try-Days
I’m a
Superfood Hero
I TR IE D SOMETHING NEW T
ODAY
!

• 19 •
2019–2020 Community Health Needs Assessment and Implementation Plan
$126,916
Free screenings,
health information and related
services
$49,124,639TOTAL COMMUNITY
BENEFIT 2018
$14,32 5,874
Cost of care not fully
reimbursed by Medicaid
$21,676,777Cost to support trauma care and subsidize other
healthcare services
$11,861,909Cost of
free or reduced-fee care based
on ability to pay
$1,133,163
Scholarships and on-site
training support for
all healthcare careers
COMMUNITY BENEFITCommunity Benefit is measured in different forms, some highly visible, some behind the scenes. In sum, Archbold’s efforts to live up to the core value of Community Benefit represents a massive
investment, as represented below. Each area shows deep investment in the communities we serve, consistently aligned with the spirit of our existence for nearly 95 years.

• 20 •
2019–2020 Community Health Needs Assessment and Implementation Plan
ADDRESSING FUTURE HEALTH NEEDS: MOVING FORWARD
NEEDS NOT ADDRESSED Not all health needs are easily addressed by Archbold. Further, keeping too broad of a focus will dilute the impact we can have on each health need. These are some of the primary reasons we aren’t addressing some health needs in our implementation plan. Our biggest opportunity is to help with improving disease states by addressing obesity, remaining available for assistance with other health needs as requested and as time and finances permit. We will address mental health issues, but more from our psychiatric service line than through clinical outreach/community benefit.
SETTING PRIORITIES Three years after the launch of Live Better, we have reached more children, established new alliances, had the opportunity to further influence city planning, and develop new methods of clinical outreach. We have a more engaged community coming together around a common theme: Live Better.
Success in significantly reducing the obesity rate in our county is realistically going to take many years, perhaps a generation, and is likely to meet setbacks. It is too early to tell whether our postive gains are cause-and-effect, but we’re pleased with the progress we’ve made thus far. What we’re trying to accomplish will likely happen incrementally, but we must continue our path and not let up.
We believe that as Live Better gains more partners, performs more outreach, expands programs and events and grows in influence, living healthy will be the norm, not the exception. Having these measurable goals will help us be accountable, and we believe accountability will make the difference between well-intentioned efforts versus efforts that are sustainable and yield positive outcomes.
We have witnessed that a) group effort yields buy-in, and buy-in strengthens the chance for success; and b) we must be relentless in the pursuit of these goals to overcome the obstacles we face. We believe Archbold’s continued efforts to sustain Live Better is an outstanding community-based contribution to improve the health status of the entire community. We have created a meaningful, measurable and highly accountable endeavor, taking great steps to ensure
Live Better doesn’t exist “in name only.” Further, we believe our approach is innovative and in many ways unique—we know of no other effort that is meeting identified community health needs to advance health status and reduce health disparities precisely as we are doing. The efforts have also instilled within our community a greater sense of affiliation with Archbold and a better understanding of the role we play in the vitality of the community.
As we continue our effort to permanently reduce the obesity rate in our community, we have observed awareness and enthusiasm increase. While our focus is local, our blueprint might be global, and we would like to continue a path to making our methods a best practice for others to adopt.
As noted earlier, Live Better won the 2017 Georgia Hospital Association Community Leadership award. This submission is testimony to moving pilot ideas to hardwired processes, having initial participants to now reaching thousands, creating a concept that is actually changing our community—and the potential foundation of a best practice.
For the 2019–2020 CHNA, our plan is to build on the early successes of Live Better by:
1. Continue to advance K–5 My Plate school curriculum
2. Plan for expansion of school involvement by creating Live Better Ambassador Program, creating student leaders that lead peers to implement ways to reduce obesity in student populations
3. Add more community partners that pledge to leverage the strengths of their organization to reduce obesity in the community at large
4. Explore population health initiatives that address reducing obesity
5. Support City of Thomasville Comprehensive Plan initiatives and projects that change the built environment which lead to reducing obesity
6. Continue screenings and/or education for key health issues as noted in this CHNA, with priority on disease states where reducing obesity can have a positive impact.