
Community Health Index for Online Communities
18
community health index for online communities
-
Upload
lithium -
Category
Technology
-
view
1.363 -
download
0
Transcript of Community Health Index for Online Communities

community health index for online communities

2
share this whitepaper
we help companies unlock the passion of their customers. The Lithium Social Customer Suite allows brands to build vibrant customer communities that:
lithium.com | © 2012 Lithium Technologies, Inc. All Rights Reserved
contents
1 executive summary
2 intro
3 defining health factors for online communities
5 using community health factors to drive action
7 using the community health index as a community standard
11 conclusion
12 defining the CHI health factors
15 computing the community health index

1
share this whitepaper
executive summary
In the current economic climate, companies are discovering that
their online communities have become a powerful and cost-
effective vehicle for interacting with customers. For example,
a consumer electronics community that runs on the Lithium
platform recently reported 1.4 million deflected support calls,
resulting in an annual estimated savings of $10 million.
Savings like these have clearly transformed online customer
communities into vital enterprise assets, which makes
monitoring their health increasingly important to corporate
wellbeing. However, until now there has been no simple,
common way to do so effectively, no standard by which to
evaluate or take action on the myriad of metrics used to
capture every aspect of community activity and performance.
Imagine a discussion of credit-worthiness before the
introduction of the FICO® score.
Lithium, the leading provider of Social Customer solutions
that deliver real business results, offers a solution. Lithium
has recently completed a detailed, time-series analysis of
up to a decade’s worth of proprietary data that represents
billions of actions, millions of users, and scores of
communities. This research, coupled with our acknowledged
expertise in planning, deploying, and managing customer
communities, enabled us to identify and calculate key factors
that contribute to a new standard for measuring community
health: the Community Health Index.
By analyzing hundreds of metrics from communities of
varying types, sizes, and ages, we identified the diagnostic and
predictive metrics that most accurately represent key attributes
of a healthy community: growth, useful content, popularity,
responsiveness, interactivity, and liveliness. Although we
uncovered other metrics that proved to be even more predictive
of community health, the ones we selected as the basis for
calculating the Community Health Index are readily available
for most online communities across the industry.
Smoothed and normalized for community purpose, size,
and age, the Community Health Index provides a single
representation of community health. Deconstructed, its
constituent health factors enable community managers to take
specific action and measure the results. This paper describes
these health factors and explains how to use them to calculate
a Community Health Index. Although the source community
data is proprietary, Lithium freely offers the results of our
research toward a common standard for the industry.

2
share this whitepaper
intro
Online customer communities have come a long way in the
thirty years since a handful of hobbyists posted messages on
the first public bulletin boards. For an increasing number of
companies, they have become an important tool for engaging
with their customers and driving sales.
In a recent study published in the Harvard Business Review,
researchers found that community participants at an online
auction site both bought and sold more, generating on
average 56% more in sales than non-community users.
This increased activity translated into several million dollars
in profit over the course of a year. Likewise, a community
running on the Lithium platform recently reported both a 41%
increase in sales by community members and an $8 million
savings in support costs.
Results such as these demonstrate the return on investment
for healthy and successful communities: customers are
getting what they need from the communities, which, in turn,
allows the communities to meet the goals of the companies
that sponsor them. The ROI that online communities
are capable of delivering makes it all the more essential
that companies be able to measure the health of their
communities and take action to keep them healthy.
Measurement, however, has proved to be a challenge because
of the missing component: a single industry standard—like
the FICO score, Body-Mass Index, or standardized test scores,
for example—that allows communities to gauge their health
in absolute objective terms. As the result of a massive data
analysis project, Lithium has developed such a standard, the
Community Health Index. The development of the Community
Health Index is based on data aggregated from a wide range
of communities representing more than 15 billion actions
and 6 million users. In order to make it universally applicable,
the Community Health Index is normalized for community
purpose, size, and age.
Like a low FICO score or high BMI, a low Community Health
Index value points to the need for a change in behavior. And,
like the components of standardized tests, deconstruction
of the Community Health Index into specific health factors
points to specific areas within the community that require
corrective action. This deconstruction even extends to
different levels within a community, where we can identify the
less healthy subdivisions and the conditions that are affecting
their health. With information such as this, a company can
target its efforts and resources to make the specific changes
most likely to further improve the community’s health.
In the spirit of Mr. Fair and Mr. Isaac, the National Institutes of
Health, and generations of high school English teachers, we
offer the Community Health Index as an open measurement
for community health.

3
share this whitepaper
defining health factors for online communities
Good health and good sense are two of life’s greatest blessings. -Publius Syrus, Maxim 827
Health in an online customer community, like health in
an individual, is spread across a broad spectrum. And as
Charles Atlas and the 97-pound weakling illustrate, some
communities are stronger and healthier than others. But,
no matter how good we look or how robust we feel at the
moment, there is always room for improvement.
Humans enjoy the benefit of sophisticated diagnostic and
preventive medicine, which tells us where we need to
improve. In order to get the most out of online communities,
we need similar diagnostics to help us make better use of the
data currently available for measuring community activity and
performance. Armed with the right data and with standards
that allow us to evaluate that data objectively, we can then
formulate a plan for improving community health.
Based on our continuous engagement with successful online
communities, we were able to identify a common set of
characteristics shared by healthy communities of all types,
sizes, and ages: they are growing, useful, popular, responsive,
interactive, lively, and positive. Furthermore, analysis of the
vast body of data available to us allowed us to then define
specific health factors that most accurately represent
each characteristic.
The characteristics of healthy communities and their
corresponding health factors are:
Growing = Members. After an initial surge of registrations
characteristic of a newly-launched community, membership
in a healthy community continues to grow. Although mature
communities typically experience a slower rate of growth,
they still add new members as the company’s customer base
grows. The traditional method for measuring membership is
the registration count.1
Useful = Content. A critical mass of content posted on an
online community is clearly one of its strongest attractions to
both members and casual visitors. In support communities,
the content enables participants to arrive at a general
understanding or get answers to specific questions. In
engagement (enthusiast or marketing) communities, it serves
as a magnet to attract and engage members. In listening
communities, the content posted by community members
gives the company valuable input from the customers who
use their products or services.
A steady infusion of useful content, then, is essential to the
health of a community.2 The traditional metric for measuring
content is number of posts. This metric alone, however, gives
no indication of the usefulness of the content, especially in
communities that do not use content rating or tagging. In
order to model content usefulness instead of sheer bulk, we
consider page views as a surrogate for marketplace demand,
but then dampen their effect to reduce the likelihood of
spurious inflation.

4
share this whitepaper
Popular = Traffic. Like membership, traffic in a community—
page views or eyes on content—is one of the most frequently
cited metrics for community health. In deriving the Traffic
health factor, we started with the standard page view metric,
but then mitigated the effect of robot crawlers in order to
diminish their impact.
Responsiveness. The speed with which community members
respond to each other’s posts is another key metric for
determining community health. Participants in support
communities, for example, are only willing to wait for
answers for a limited amount of time. The same is true for
engagement and other types of communities. If there is too
much of a lag between posts and responses, conversations
peter off and members start looking elsewhere.
The traditional response time metric counts the number
of minutes between the first post and the first reply. That
first post might be anything—a question, a blog article, an
idea, a status update. Because our analysis of community-
member behavior has revealed the importance of subsequent
responses, we have enhanced the traditional response time
metric to account for all of the responses in a topic.
Interactive = Topic Interaction. Interaction between
participants is one of the key reasons that online communities
exist. The traditional metric for measuring interaction is
thread depth3 , where threads are topics of discussion and
their depth is the average number of posts they contain. This
way of looking at interaction, however, does not consider the
number of individuals who are participating. As a result, a
topic with six posts by the same participant would have the
same depth as one with six different contributors. Because
our experience with online communities has led us to
understand that the number of participants in an interaction
is even more important than the number of posts, we have
added the dimension of unique contributors to our calculation
of Topic Interaction.
Liveliness. Although most people would be hard-pressed
to define it, they recognize and respond to liveliness or buzz
when they encounter it. Research has shown that participants
are not only attracted to but are also motivated to return and
contribute in communities that feel animated and vibrant.4
We find that liveliness can be best measured by tracking
a critical threshold of posting activity that experience and
analysis have shown us characterizes healthy communities. In
calculating the Liveliness factor, we look not only at the number
of posts but also at their distribution within the community. We
have identified the critical threshold at between five and ten
posts per day in each community segment. Segments include
discussion boards, forums, blogs, idea exchanges, and so forth.
Lopsided distributions indicate a need to balance out the hot
and cold spots in the community.
In addition to these key factors, a positive atmosphere, civil
behavior, and a degree of trust among members is essential
to the success of online communities. Abusive language
and harassment have no place in any community—online or
otherwise—particularly one sponsored by an enterprise.
The opinions expressed by community members need not
all be positive—in fact, one sign of a healthy community is
the freedom members feel to express their opinions about
a company or its products. More important to community
health, however, is the way in which those opinions are
expressed. In our experience and that of other community
experts, healthy communities rely on moderators and active
community members to maintain a positive atmosphere
and keep the anti-social behavior at bay.5 As a result, the
Community Health Index is already normalized for moderator
control of atmosphere.

5
share this whitepaper
Further examination of health factor data from scores
of communities reveals strong correlations between two
groups of factors. The first group consists of Members,
Content, and Traffic, which are closely aligned to traditional
registration, posting, and page view metrics. These factors
are strongly affected by community size. We refer to them as
diagnostic indicators because they reflect the current state
of the community.
Fluctuations in a community’s diagnostic factors typically
correspond to specific events and serve as a record of their
impact on the community. This correlation allows community
managers to use diagnostic factors to gauge the effectiveness
of tactics designed to boost registrations or page views, such
as contests, participation incentives, or outreach campaigns.
Activities such as these appear as inflection points in the
community’s diagnostic health factors.
The remaining group of factors—Responsiveness, Interaction,
and Liveliness—are less susceptible to the effects of
community size, more indicative of patterns of behavior
within the community, and tend to be predictive indicators
of community health. They are, in effect, an early warning
system for aspects of community health that may require
attention or intervention before their effects become
apparent. Not only are the predictive factors interesting in and
of themselves, but community managers can learn a great
deal by looking at the interplay between predictive factors.
Take the case of a hypothetical software publisher based on
communities that run on the Lithium platform. Concerned
about the response rate in its support community, the
company recruits staff experts to provide answers to
members’ questions. Although the Responsiveness health
factor improves significantly as a result of this infusion, the
Interaction factor, which is based in part on the number
of unique participants in a thread or topic, begins to drop.
Community members’ questions are being answered, but
the interactions between participants that give it the feel of a
community fall off significantly, as does the Liveliness factor.
Instead, community members begin to view their community
as just another support channel. Armed with this information,
community managers can take action: setting out to identify
and encourage home-grown experts from within the
community to replace the staff experts. Over time, this will
lead to more participants, increased interaction levels, and
ultimately to a renewed interest in the community.
using community health factors to drive action
6 1
5 2
4 3A
6 1
5 2
4 3B6 1
5 2
4 3C
1. Members - 2. Content - 3. Traffic - 4. Liveliness 5. Interaction - 6. Responsiveness

6
share this whitepaper
In addition to monitoring the community as a whole,
community managers can correlate community health
factors with usage metrics for specific community features
to reveal the effects of these features on the community.
Lithium customers, for example, can see the effects of
critical engagement features such as Tagging, Kudos, Chat,
or Accepted Solutions. This enables community managers to
determine which features have the most positive impact on
community health and to implement features or make other
changes that have predictable effects on community health.
Interaction
Liveliness
Responsivieness
A B CNov.05
Dec.05
Jan.06
Feb.06
Mar.06
Apr.06
Jun.06
Jul.06
Aug.06
Sep.06
Oct.06
Nov.06
Dec.06
Feb.07
Mar.07
Apr.07
May.07
Jun.07
Jul.07
Sep.07
Oct.07
Nov.07
Dec.07
Jan.08
Feb.08
Mar.08
May.08
Jun.08
4
3.2
2.4
0
0.8
1.6
S1 Predictive Health Factors
Company StaffIntroduced
Superuser IncentiveProgram Initiated

7
share this whitepaper
using the community health index as a community standard
As noted earlier, community health factors provide diagnostic
and predictive information useful in measuring community
health. Viewed either as a snapshot or mapped over time,
these factors reveal a great deal about an online community.
To account for factors such as community size, age, and
volatility, we apply a series of smoothing and normalization
algorithms to enable communities of all types to use a single
formulation of the Community Health Index.
The three Community Health Index (CHI) compass diagrams
below show healthy communities with the distinctly different
profiles that are characteristic of support, engagement, and
listening communities. Listening communities include both
support and engagement elements. Although their profiles
are different, all are healthy communities. These diagrams
present a snapshot of health factors for a given period (in this
case one week) as a relative percentage of the community’s
highest scores. For the purposes of illustration, the Predictive
and Diagnostic factors are normalized separately to make the
different profiles easier to identify.
The Community Health Index is on a scale of 0 to 1000. The higher the number, the healthier the community and the more likely it will accomplish the goals of the members and the company. Regardless of a community’s score, there is always room for improvement and the individual health factors tell you exactly where to focus.
In the sample support community (S1), the three predictive
factors—Responsiveness, Interaction, and Liveliness—are
balanced. In the sample, engagement (E1) and listening (L1)
communities, Interaction and Liveliness are characteristically
higher than Responsiveness.
Simple CHI trend analysis, coupled with the ability to drill
down to the individual health factors, provides an early
warning of potentially serious problems within a community.
It is important to note that a single health factor, like a single
metric, doesn’t present the whole picture. Instead, community
managers should consider the Community Health Index in
conjunction with the individual health factors. As the graphs
that follow show, a community can weather the decline in
one or two health factors and remain healthy when the other
factors are stable or improving.
6 1
5 2
4 3S1
6 1
5 2
4 3E16 1
5 2
4 3L1
1. Members - 2. Content - 3. Traffic - 4. Liveliness 5. Interaction - 6. Responsiveness

8
share this whitepaper
For example, the graphs below show diagnostic factors,
predictive factors, and the health trend for a support
community (S1).
0
0.7
1.4
2.1
2.8
3.5
Nov
.05
Dec
.05
Jan.
06Fe
b.06
Mar
.06
Apr
.06
Jun.
06Ju
l.06
Aug
.06
Sep.
06O
ct.0
6N
ov.0
6D
ec.0
6Fe
b.07
Mar
.07
Apr
.07
May
.07
Jun.
07Ju
l.07
Sep.
07O
ct.0
7N
ov.0
7D
ec.0
7Ja
n.08
Feb.
08M
ar.0
8M
ay.0
8Ju
n.08
SS11 PPrreeddiiccttiivvee HHeeaalltthh FFaaccttoorrss
Interaction Liveliness Responsiveness
0
360
720
1080
1440
1800
Nov
.05
Dec
.05
Jan.
06Fe
b.06
Mar
.06
Apr
.06
Jun.
06Ju
l.06
Aug
.06
Sep.
06O
ct.0
6N
ov.0
6D
ec.0
6Fe
b.07
Mar
.07
Apr
.07
May
.07
Jun.
07Ju
l.07
Sep.
07O
ct.0
7N
ov.0
7D
ec.0
7Ja
n.08
Feb.
08M
ar.0
8M
ay.0
8Ju
n.08
SS11 DDiiaaggnnoossttiicc HHeeaalltthh FFaaccttoorrss
Members Content / 60 Traffic / 3000
9
share this whitepaper
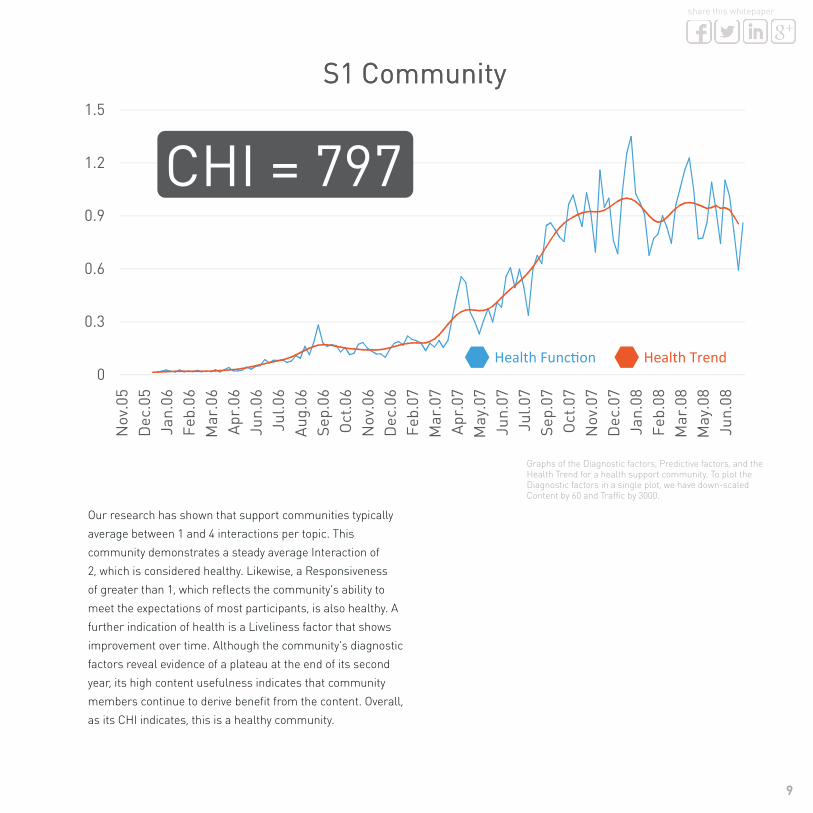
Our research has shown that support communities typically
average between 1 and 4 interactions per topic. This
community demonstrates a steady average Interaction of
2, which is considered healthy. Likewise, a Responsiveness
of greater than 1, which reflects the community’s ability to
meet the expectations of most participants, is also healthy. A
further indication of health is a Liveliness factor that shows
improvement over time. Although the community’s diagnostic
factors reveal evidence of a plateau at the end of its second
year, its high content usefulness indicates that community
members continue to derive benefit from the content. Overall,
as its CHI indicates, this is a healthy community.
0
0.3
0.6
0.9
1.2
1.5N
ov.0
5D
ec.0
5Ja
n.06
Feb.
06M
ar.0
6A
pr.0
6Ju
n.06
Jul.0
6A
ug.0
6Se
p.06
Oct
.06
Nov
.06
Dec
.06
Feb.
07M
ar.0
7A
pr.0
7M
ay.0
7Ju
n.07
Jul.0
7Se
p.07
Oct
.07
Nov
.07
Dec
.07
Jan.
08Fe
b.08
Mar
.08
May
.08
Jun.
08
SS11 CCoommmmuunniittyy
Health Function Health Trend
CHI = 797
Graphs of the Diagnostic factors, Predictive factors, and the Health Trend for a health support community. To plot the Diagnostic factors in a single plot, we have down-scaled Content by 60 and Traffic by 3000.

10
share this whitepaper
The graphs above show health factors for an older and larger but less robust community. This community is more than
10 times the size of S1, but its diagnostic factors demonstrate wildly fluctuating yearly cycles with little actual improvement over
time. The diagnostic factors show that the community experienced a spike in registrations toward the end of 2006, but was unable
to capitalize on the infusion of new members. Responsiveness and Interaction are stable and within norms for support
communities, but S2 shows a troubling decline in its Liveliness factor, which can often be remedied by adjusting the community’s
structure, something that other large communities routinely do on an ongoing basis. Although still large, this community is
stagnant, with a low CHI for its size.
0
0.7
1.4
2.1
2.8
3.5
Dec
.03
Feb.
04M
ay.0
4Ju
l.04
Sep.
04N
ov.0
4Ja
n.05
Mar
.05
May
.05
Jul.0
5Se
p.05
Nov
.05
Jan.
06M
ar.0
6M
ay.0
6Ju
l.06
Oct
.06
Dec
.06
Feb.
07A
pr.0
7Ju
n.07
Aug
.07
Oct
.07
Dec
.07
Feb.
08A
pr.0
8Ju
n.08
Aug
.08
SS22 PPrreeddiiccttiivvee HHeeaalltthh FFaaccttoorrss
Interaction Liveliness Responsiveness
0
2000
4000
6000
8000
10000
Dec
.03
Feb.
04A
pr.0
4Ju
n.04
Aug
.04
Oct
.04
Nov
.04
Jan.
05M
ar.0
5M
ay.0
5Ju
l.05
Sep.
05O
ct.0
5D
ec.0
5Fe
b.06
Apr
.06
Jun.
06A
ug.0
6O
ct.0
6N
ov.0
6Ja
n.07
Mar
.07
May
.07
Jul.0
7Se
p.07
Oct
.07
Dec
.07
Feb.
08A
pr.0
8Ju
n.08
Aug
.08
SS22 DDiiaaggnnoossttiicc HHeeaalltthh FFaaccttoorrss
Members Content / 40 Traffic / 650
Graphs of the Diagnostic factors, Predictive factors, and the Health Trend for a health support community. To plot the Diagnostic factors in a single plot, we have down-scaled Content by 40 and Traffic by 650.
0
0.3
0.6
0.9
1.2
1.5
Jan.
04Fe
b.04
Apr
.04
Jun.
04Ju
l.04
Sep.
04O
ct.0
4D
ec.0
4Fe
b.05
Mar
.05
May
.05
Jul.0
5A
ug.0
5O
ct.0
5N
ov.0
5Ja
n.06
Mar
.06
Apr
.06
Jun.
06Ju
l.06
Sep.
06N
ov.0
6D
ec.0
6Fe
b.07
Apr
.07
May
.07
Jul.0
7A
ug.0
7O
ct.0
7D
ec.0
7Ja
n.08
Mar
.08
Apr
.08
Jun.
08A
ug.0
8
SS22 CCoommmmuunniittyy
Health Function Health Trend
CHI = 208
11
share this whitepaper
lithium.com | © 2012 Lithium Technologies, Inc. All Rights Reserved
Lithium social solutions helps the world’s most iconic brands to build brand nations—vibrant online communities of passionate social customers.Lithium helps top brands such as AT&T, Sephora, Univision, and PayPal build active online communities that turn customer passion into social media marketing ROI. For more information on how to create lasting competitive advantage with the social customer experience,visit lithium.com, or connect with us on Twitter, Facebook and our own brand nation – the Lithosphere.
conclusion
Although existing community metrics yield a tremendous
amount of data, the industry has been unable until now to
use that data to achieve a meaningful measure of community
health. With the introduction of the Community Health Index,
companies and community experts have a way to organize
and compare this data against both the past performance of
the community itself and against other similar communities.
In fact, we see communities using the Community Health
Index in multiple ways: as a metric to objectively measure the
health of a community, as a means to validate the perceptions
of community moderators and other community experts, and
as diagnostic and prescriptive drivers to help communities
meet ROI and business objectives.
Companies have the data, and now they have a standard to
compare it against.
resources1Butler, B. S. (2001). Membership Size, Communication Activity, and Sustainability: A Resource-Based Model of Online Social Structures. INFORMATION SYSTEMS RESEARCH, 12(4), 346-362. 2Soroka,V., & Rafaeli,S (2006). Invisible Participants: How Cultural Capital Relates to Lurking Behavior. Proceedings of the 15th international conference on World Wide Web (pp163-172). 3Preece, J. (2001). Sociability and usability in online communities: determining and measuring success. Behaviour and Information Technology, 347-356
4Ackerman, M. S., & Starr, B. (1995). Social activity indicators: interface components for CSCW systems. In Proceedings of the 8th annual ACM symposium on User interface and software technology (pp. 159-168). 5Cosley, D., Frankowski, D., Kiesler, S., Terveen, L., & Riedl, J. (2005). How oversight improves member-maintained communities. In Proceedings of the SIGCHI conference on Human factors in computing systems (pp. 11-20). Portland, Oregon, USA: ACM

12
share this whitepaper
defining the CHI health factors
Our goal in introducing the Community Health Index (CHI)
is to provide a standard of measurement that all online
communities can use. To that end, this section describes the
representation of the six health factors as well as a formula
for combining them.
Members
The standard measure for Members is the registration
metric that all communities track. In the formulas that follow,
Members is represented by μ.
Content The two standard metrics that contribute to calculating content
utility are posts and page views. Posts (represented by 𝑝) is the
number of posts added to the community over a period of time.
We use page views to represent consumer demand because
we have found that page views provides an accurate reflection
of the relative usefulness of the posts. However, we also
observed that highly viewed pages tend to draw more random
views, resulting in a snowball effect that could spuriously
inflate the estimate of consumer demand. To dampen this
effect, we take the log of page views as a surrogate for user
demand, and thus the usefulness of the posts. We therefore
express Content Utility (represented by U) as:
Traffic Traffic is typically measured using the standard page
views metric. Because the page view metric can be heavily
contaminated by robot crawlers, it is important to discount
the effects of robots and use only human contributed page
views when computing CHI. Traffic is represented by 𝑣𝒉.
Responsiveness The traditional time-to-response metric is the starting
point for calculating Responsiveness. Time-to-response is
generally defined as the number of minutes between the
first message in a message thread and the first response
to that message. However, this metric does not consider
the intervals between the first response and the second
response, and so on. Therefore, we have defined a more
robust health factor, called Responsiveness (denoted by
𝑅). This health factor is computed in three steps. First,
we compute the average response time (denoted by 𝑡𝑅) by
averaging the response time for all messages within a topic,
and then averaging that over all topics. If denotes the
response time for the 𝑘𝑡𝒉 message posted in thread θ, then
the average response time may be expressed as
where Θ is the total number of threads and 𝑚θ is the number
of messages in thread θ.
(1)
(2)

13
share this whitepaper
Unlike page views and registrations, which are purely
numeric, 𝑡𝑅 is a measure of time, so its value can change
depending on the unit at which is measured. When
measured in days, the response time for a hypothetical
community may be 𝑡𝑅 = 1 day. However, if it is measured in
hours, 𝑡𝑅 = 24 , and if in minutes, 𝑡𝑅 = 1440. Therefore, the
second step involves converting 𝑡𝑅 into a unit-less numeric
value. This can be done by defining a constant, called the
expected response time (𝑡𝑒), which defines the time that a
user would be willing to wait before receiving a response.
Since it is another measure of time, it should have the same
unit as 𝑡𝑅. Taking the ratio of 𝑡𝑅 to 𝑡𝑒 would then cancel
out the units and render the ratio a unit-less measure of
response time with an expected value of 1. Because we have
found that response time is inversely related to community
health, with a shorter response time typically pointing to a
healthier community, the final step simply computes the
inverse of the ratio 𝑡𝑅/𝑡𝑒. Therefore Responsiveness can be
written as:
Interaction The conventional metric for measuring interactivity is thread
depth, the average number of messages in a topic. However,
this number does not consider the number of participants.
Therefore, we calculate Topic Interaction (denoted by 𝐼) as a function of two terms: the number of unique users
participating in a thread (denoted by 𝑢θ) and the number of
messages in a thread, 𝑚θ. The minimum unit of interaction
is achieved when there are two messages between two
distinct users. Furthermore, since we do not want the level
of interaction to be biased by extremely long threads, we
use the function to dampen their effect. Based on these
requirements, Topic Interaction can be written as:
Liveliness Although online communities furnish users with many
activities, the most obvious action is posting. Therefore, we
calculate the Liveliness of a community (represented by 𝐿) as
a function of the average number of posts per forum or other
community division.
where B is the total number of publicly accessible boards,
and 𝑝𝒆 is the expected number of posts per board (a constant
explained later). The arctan function with the parameter
0.07 is used to give a linear behavior near the origin and a
slow saturation as its argument increases. This prevents the
indefinite inflation of liveliness by continuously reducing the
number of forums or other community divisions.
(3)
(4)
(5)

14
share this whitepaper
Combining Health Factors After defining the health factors, the next step is to derive
the functional form of the health function, 𝐻𝒐 , in terms of its
factors. Since the factors are defined in such way that they
are directly proportional to community health, combining the
health factors simply requires multiplying them together. We
also take the square root of the product to make the health
function more robust against large fluctuations in any one
health factor that is not correlated with the other factors.
Therefore, the final form of the health function is:
(6)
15
share this whitepaper
computing the community health index
Although equation (6) defines the health function (𝐻𝒐it does not
describe how we actually compute it. This section fills in the
technical details that make it possible. The basic steps are:
• Choose a window for data aggregation.
• Assign values to the free parameters.
• Smooth the health function to more easily see the trend.
• Normalize the health function for community size, age,
and type for comparison purposes.
Choosing a Window for Data Aggregation The first step in computing the health function is to choose
a window for data aggregation. The aggregation window
gives context to the variable in the definition for the health
factors. For example, it is understood that θ is the thread
count within the period of one aggregation window, and B is
the cumulative board count up to and including the current
window of interest. The aggregation window is typically
set to be one month or one week. It is not advisable to use
windows smaller than one week, because online behaviors
of community users show strong weekly cyclic variation. We
used a one week aggregation window for all our calculations.
Assigning Values for Free Parameters Grouping the messages via their post date into weekly
windows, the health factors for each week can be computed
using only data within and prior to the week of interest.
Subsequently, all the health factors are plotted and examined
over time. We usually discard the health factors for the first
and the last window to avoid edge effects.
To compute the predictive health function, we need to choose
a value for the expected response time (𝑡𝑒) and the expected
number of posts per board (𝑝𝒆).Based on our analysis,
we found healthy communities generally have an average
response time of 1000 minutes or less. On average, they
also have 50 posts per forum per week. Therefore, we set 𝑡𝑒
equal to 1000 minutes and 𝑝𝒆 equal to 50 posts per forum
for a one week aggregation window. With these parameters,
we can compute the health function for any community over
time via equation (6). This will give us the whole history of the
community’s health.
Smoothing The Health Function to View a Trend Once we have the health function (𝐻𝒐), the remaining
computations involve smoothing and normalizing the health
function. These computations are not difficult, but they do
involve certain mathematical literacy. Depending on the
application, they may or may not be necessary. Smoothing
is often desirable, because it removes extraneous noise in
the data to give a better indication of the health progression
for the community. Normalization is only necessary when
comparing the health between
different communities.
To accurately portray the health of a community, we require
the smoothing algorithm to use the latest data effectively as
they are most important for determining the current state
of health. Although a moving average will use the most
recent data efficiently, it introduces a lag that is undesirable.
Kernel smoothing can track the trend in the bulk of the data
very accurately, but performs poorly at the two ends of the

16
share this whitepaper
data series because it does not use that data efficiently. We
developed a hybrid approach that takes advantage of both
types of smoothing algorithms by using a weighted average
between the two algorithms. The latest data near the end of
the series are smoothed primarily with a weighted moving
average. Earlier data are smoothed primarily with kernel
smoothing that uses a Hanning window as its kernel function.
The smoothed health function is called the health trend
(denoted by without any subscript).
Normalizing CHI for Comparisons The health trend will give a good indication of the community’s
health throughout its history, so we can objectively compare
the health condition of a community between any two points
in time. However, the health trend is derived from the un-
normalized health function, so we cannot directly compare
the health between different communities. In applications,
such as benchmark studies, that require comparison of health
across communities, we must normalize the health function.
There are many different ways to normalize the health function
depending on what aspect of the communities we like to
compare. For benchmark studies, we normalized the health
function by the following steps:
1. First we compute the smoothed derivative of
the health function to reveal all the positive and
negative health trends throughout the history of the
community. (This operation is mathematically equivalent
to taking the derivative of the health trend, because the
smoothing operator commutes with the differential operator).
2. We also weight the smoothed derivative with an exponential
decay that has a decay time constant of 50 weeks. This
will attenuate the effect of long past health trends on the
community’s current health condition.
3. We compute the definite integral of the weighted derivative
to obtain the “net health” of the community.
4. We take into account the volatility of CHI by dividing the
net health by the square root of the weighted mean absolute
deviation of the health function’s derivative. The weighting
function is the same as the one we used in step 2 of this
normalization procedure.
5. Because the weighted net health has a very large range
of values, we apply the “signed-logarithm” function to the
weighted net health so that its value is more linear. Here, the
signed-logarithm is defined by
6. Finally, to calibrate the result into a more commonly used
scale, we shift the reference point by adding a constant 𝐶𝒐
to the result from step 5 and then multiplied by a scaling
constant, 𝐶𝑠. The result is the community health index
(denoted by the Greek letter χ).
Mathematically , the sequence of operations for computing
CHI can be written as where
𝐻𝒐 is the health function, 𝐻 is the health trend, 𝑡 represents
time measured in weeks, and 𝑡𝒐 is the current time in weeks.
The notation ⟨∙⟩𝑡represents the sample average that takes
averages over the time variable, .
(7)


![Interactions in an online community in ergonomics: from ... · with research on online communities, in particular online epistemic communities [6] or communities of practices [18,](https://static.fdocuments.in/doc/165x107/607174269d3bb803a55d02a2/interactions-in-an-online-community-in-ergonomics-from-with-research-on-online.jpg)