COMMUNITY HEALTH ADVISORY & INFORMATION NETWORK (CHAIN) PROJECT NYC HIV PLANNING COUNCIL Needs...
26
COMMUNITY HEALTH ADVISORY & INFORMATION NETWORK (CHAIN) PROJECT NYC HIV PLANNING COUNCIL Needs Assessment Committee Angela Aidala April 1, 2008
-
Upload
horatio-jordan-wilson -
Category
Documents
-
view
221 -
download
0
Transcript of COMMUNITY HEALTH ADVISORY & INFORMATION NETWORK (CHAIN) PROJECT NYC HIV PLANNING COUNCIL Needs...

COMMUNITY HEALTH ADVISORY & INFORMATION NETWORK
(CHAIN) PROJECT
NYC HIV PLANNING COUNCIL Needs Assessment Committee
Angela Aidala April 1, 2008

Introduction: Planning Questions
What services do HIV+ persons need?
Where do they go for care?
What are their unmet needs/ service gaps?
What populations are underserved?
What works well, what doesn’t work?
What are the barriers and access issues?
WHERE SHOULD WE PUT OUR MONEY?

CHAIN PROJECT GOALS
To provide a profile of PLWH/A in New York City and the Tri-County Region
To assess the system of HIV care – both health and social services – from the perspective of people living with HIV
To report on unmet needs, service utilization trends, and outcomes to the Planning Council and its Committees

History of CHAIN Initially developed in 1993 as one of the Planning
Council’s evaluation resources
Contract with Columbia University Public Health
Over time CHAIN has recruited 3 representative cohorts of PLWH/A- NYC I (1994-2002, n=968)
- NYC II (2002-present, n=693)
- Tri-County (2001-present, n=298) A Technical Review Team (TRT) which includes
representatives of the Planning Council, Public Health Solutions, NYCDOHMH and WDOH oversees CHAIN

CHAIN Studies
CHAN Adult Cohort I
1994-2001
Adolescent Study
1995
Tri-County Cohort
2001 - 2007
The Unconnected
1995 & 1998 & 2003
Ancillary Service, 1999
Social Comorbidities, 2000
Ryan White Impact, 2001
Personnel Needs
1995 - 1996
CHAN Adult Cohort II
2002 - present

14 Year Highlights (1994-2008)
7,566 interviews with 2,176 respondents 850-item questionnaire 112 trained interviewers 100+ reports Multiple presentations to Planning
Council, Council Committees, PPG, HAWG, provider and community groups, professional conferences

Steps in the Process
Develop a research strategy Consult with stakeholders Develop research infrastructure Implement strategy Analyze & report on research findings Re-evaluate strategy Consult with stakeholders

The CHAIN Cohorts are Probability Samples
60,000 – 75,000 HIV+ adults in care
in NYC
(1994)

60,000 – 75,000 HIV+
adults in care in NYC
CHAIN = 700 PLWH
(1994)

Selecting CHAIN ParticipantsA 2-Step Process
1st step: random selection of service sites from listing of all agencies serving HIV clients• Medical and Social Service
• All Boroughs (or Counties)
• RW Funding vs. no RW
2nd step: agency staff help with random selection of clients• Random selection from client rosters
• Sequential enrollment

Recruiting CHAIN ParticipantsUnconnected to Care
Unconnected: Aware, no medical care, no case mgmt for 6+months
• Referrals from CHAIN agency recruited participants
• Accompany Outreach Workers
• Open recruitment and screening in street and community settings

Collecting Data
Comprehensive in-person interview Follow-up interviews annually Interviews in homes or agency settings Community-based interviewing team $25 incentive for every interview + referral
resource High retention rate: 80% - 95% of eligible
participants at each wave

Topics Covered
Current health & mental health status Family, housing, work, resources Outlook on life Risk behaviors – sex & drugs History and use of medical services History and use of social services Needs, satisfaction, barriers
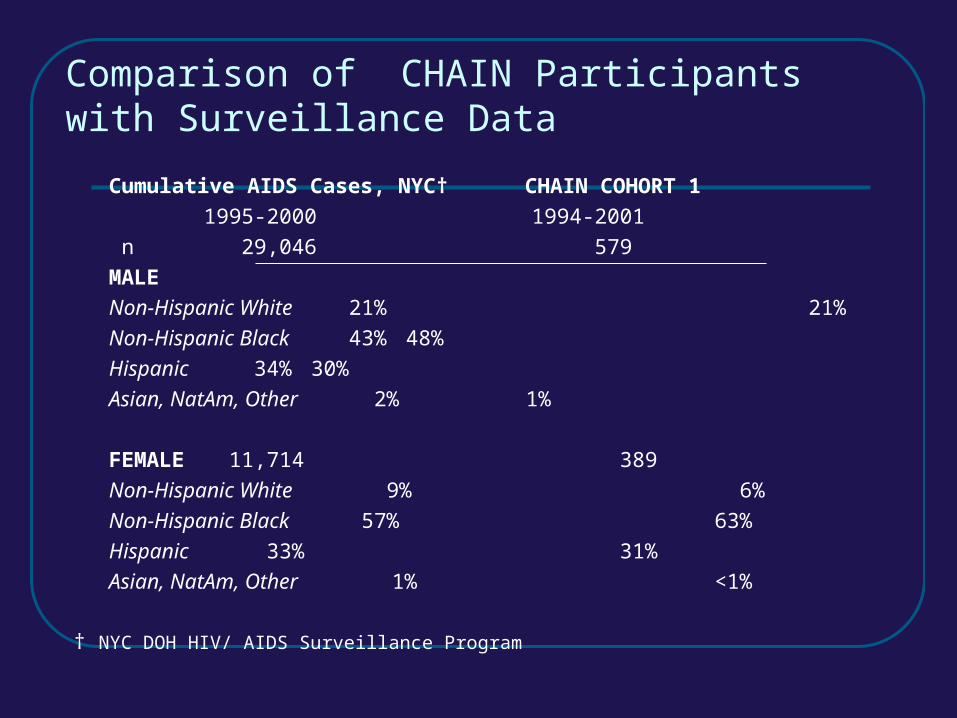
Comparison of CHAIN Participants with Surveillance Data
Cumulative AIDS Cases, NYC† CHAIN COHORT 1
1995-2000 1994-2001
n 29,046 579
MALE
Non-Hispanic White 21% 21%
Non-Hispanic Black 43% 48%
Hispanic 34% 30%
Asian, NatAm, Other 2% 1%
FEMALE 11,714 389
Non-Hispanic White 9% 6%
Non-Hispanic Black 57% 63%
Hispanic 33% 31%
Asian, NatAm, Other 1% <1%
† NYC DOH HIV/ AIDS Surveillance Program

NYC Persons Livingwith HIV,
as of 6/30/03 11
Ryan White CAREAct Encounters, 3/2001 - 2/2002 22
CHAIN 2002 Cohort
6/2002-6/2004
Female Male Female Male Female Male33
Total N 10,104(35%)
18,995(65%)
10,765(39%)
16,962(61%)
278(40%)
415(60%)
White 8% 30% 9% 8% 6% 10%
Black 58% 36% 53% 53% 62% 47%
Latino 31% 30% 37% 37% 31% 41%
Other 3% 4% 2% 2% <1% (1) 2%1 HIV Epidemiology Program DOHMH2 HIV CARE Services.
Comparison of CHAIN Participants with Surveillance & RW Encounter Data

Analyze & Report
Prepare data for analysis Work with Council & staff to define topics Consult with stakeholders
- What emerging issues should be investigated?
- What subgroup comparisons?
Prepare draft of reports and get feedback Disseminate final reports

Ways of classifying PLWH/A
Gender• Male / female / transgender
Race / Ethnicity• White / Black / Latino / Other
HIV risk exposure group• MSM / PDU / MSM + PDU / Hetero & Other
Stage of illness• AIDS / HIV symptomatic / HIV asymptomatic
Age• 20-34/ 35-49/ 50+

Types of Analyses Descriptive (rates, percentages, trends
geomapping)
Analytical
• Are there group differences?
• Do certain models of care, interventions, or policies make a difference?
Multivariate analyses – considering the effects of many factors taken together

Assessing the System of Care
Trend data Outcome measures Individual factors associated with
outcomes Systemic factors associated with
outcomes
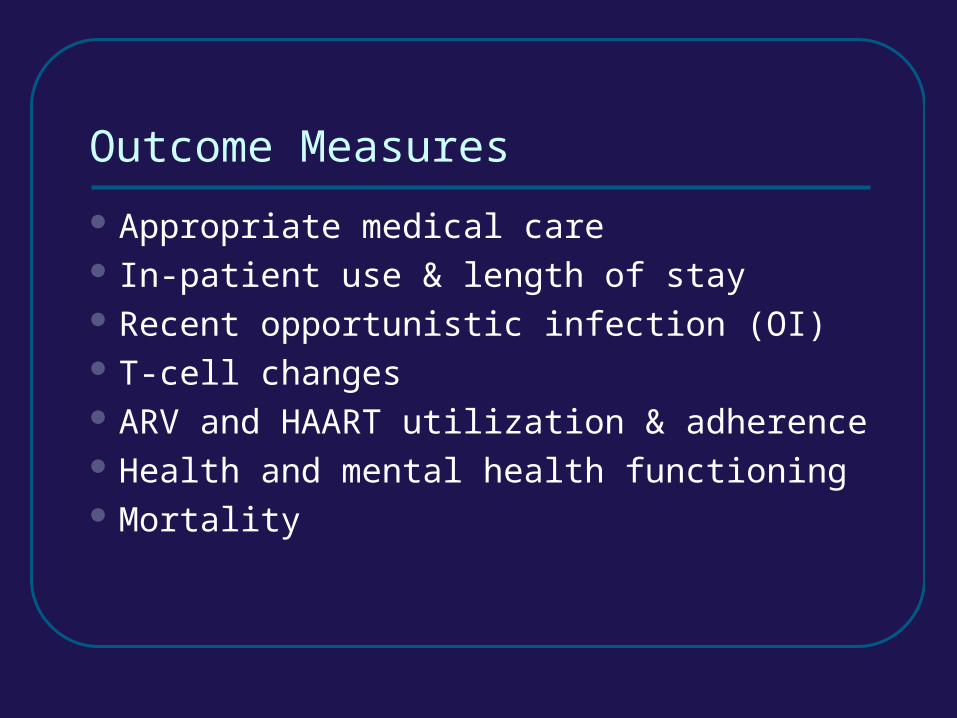
Outcome Measures
Appropriate medical care In-patient use & length of stay Recent opportunistic infection (OI) T-cell changes ARV and HAART utilization & adherence Health and mental health functioning Mortality

Individual Factors
Sociodemographics: gender, race/ethnicity, age, education, income, poverty area
Health: self-reported physical and mental health status, t-cell, OI, ARV, HAART
Risks: HIV risk behavior, drug use, unstable housing
Medical care: provider type, primary care characteristics, insurance coverage

Example:
Medicaid Trends by Provider
0
20
40
60
80
100
W1 W2 W3 W4 W5 W6 W7 W8
Priv MD
Desig AIDS Ctr
CHC
Percent of Respondents with Medicaid by Wave of Interview, 1994-2001

40
43
38
43
45
40
46
41
42
58
46
35
44
39
15 20 25 30 35 40 45 50 55 60 65
Bronx (n=149)
Brooklyn (n=157)
Manhattan (n=120)
Queens (n=83)
Staten Island (n=29)
Hetero (n=186)
MSM/PDU (n=39)
PDU (n=234)
MSM (n=100)
White (n=33)
Latino (n=213)
Black (n=304)
Female (n=218)
Male (n=335)
ETHNICITY**
GENDER
BOROUGH
HIV RISK
** significant (p<0.01)Percent reporting need
Example:
Estimating Mental Health Needs
Avera
ge

0
0.5
1
1.5
2
2.5
3
3.5
4
Primary Care
Self Perceived Need
Unstable Housing
Housing Services
Ever Drugs Weekly
Used Drugs 12m
Prof Drug Tx
Self-Help Drug Tx
Case Mgmt SSvc
No Insurance
Example:
Increasing the Odds of Accessing MH Services among Clients with Service Need

The Value of CHAIN Patterns and proportions we see in the
sample can be used as estimates for the broader HIV+ population
Over time data can show changes in needs as well as effects of services and system wide interventions
Provides broad range of evidence about service needs and outcomes from the point of view of persons living with HIV/AIDS

ACKNOWLEDGMENTS
A Technical Review Team (TRT) provides oversight for the CHAIN Project. In addition to Peter Messeri, PhD, Angela Aidala, PhD, Gunjeong Lee, PhD, and Maria Caban, MA, of Columbia University’s Mailman School of Public Health, TRT members include Mary Ann Chiasson, DrPH, Public Health Solutions, Inc. (Chair); Jan Carl Park, MPA, Nina Rothschild, DrPH, Office of AIDS Policy and Community Planning; Clarissa Silva, MSW, Daniel Weglein, MD, and Fabienne Laraque, MD, Office of Evaluation and Quality Assurance; Ellen Wiewel, PhD, HIV Epidemiology and Field Services Program and JoAnn Hilger, Director, Ryan White Services, New York City Department of Health and Mental Hygiene; Julie Lehane, PhD, Westchester County Department of Health; Jennifer Irwin, MPH, Roberta Scheinmann, MPH, Public Health Solutions.
CHAIN reports are solely the responsibility of the researchers and do not necessarily represent the official views of the U.S. Health Resources and Services Administration, the City of New York, or Public Health Solutions. I