Community Controlled Forests, Carbon Sequestration and … · Environment for Development...
29
Environment for Development Discussion Paper Series March 2013 EfD DP 13-07 Community Controlled Forests, Carbon Sequestration and REDD+ Some Evidence from Ethiopia Abebe D. Beyene, Randall Bluffstone, and Alemu Mekonnen
Transcript of Community Controlled Forests, Carbon Sequestration and … · Environment for Development...
Environment for Development
Discussion Paper Series March 2013 EfD DP 13-07
Community Controlled Forests, Carbon Sequestration and REDD+
Some Evidence from Ethiopia
Abebe D. Beyene , Ran dal l B l u f fs t one , and Al em u Mekonnen
Environment for Development
The Environment for Development (EfD) initiative is an environmental economics program focused
on international research collaboration, policy advice, and academic training. It supports centers in Central
America, China, Ethiopia, Kenya, South Africa, and Tanzania, in partnership with the Environmental
Economics Unit at the University of Gothenburg in Sweden and Resources for the Future in Washington, DC.
Financial support for the program is provided by the Swedish International Development Cooperation Agency
(Sida). Read more about the program at www.efdinitiative.org or contact [email protected].
Central America Research Program in Economics and Environment for Development in Central America Tropical Agricultural Research and Higher Education Center (CATIE) Email: [email protected]
China Environmental Economics Program in China (EEPC) Peking University Email: [email protected]
Ethiopia Environmental Economics Policy Forum for Ethiopia (EEPFE) Ethiopian Development Research Institute (EDRI/AAU) Email: [email protected]
Kenya Environment for Development Kenya Kenya Institute for Public Policy Research and Analysis (KIPPRA) University of Nairobi Email: [email protected]
South Africa Environmental Economics Policy Research Unit (EPRU) University of Cape Town Email: [email protected]
Tanzania Environment for Development Tanzania University of Dar es Salaam Email: [email protected]
Discussion papers are research materials circulated by their authors for purposes of information and discussion. They have
not necessarily undergone formal peer review.
Community Controlled Forests, Carbon Sequestration and REDD+:
Some Evidence from Ethiopia
Abebe D. Beyene, Randall Bluffstone, and Alemu Mekonnen
Abstract
REDD+ (Reduced Emissions from Deforestation and Forest Degradation, “plus” afforestration) is a tool
that supports forest carbon-enhancing approaches in the developing world in order to mitigate and hopefully
reverse climate change. A key issue within REDD+ is to appropriately bring in the almost 25% of developing
country forests that are effectively controlled by communities. Many authors have discussed the social aspects
of appropriateness, but there is limited analysis of the actual carbon sequestration potential of better-managed
community controlled forests (CCFs). Drawing on an analytical framework that relies heavily on the common
property and social capital literatures, our paper contributes to closing this research gap and sheds light on
whether community forest management structures should be given serious consideration as REDD+ partners in
the battle to mitigate climate change. Using household and community level data from four regional states in
Ethiopia, we examine whether CCFs with design features known to be associated with better management
appear to sequester more carbon than community systems with lower levels of these characteristics. The
empirical analysis suggests that the quality of local level institutions may be important determinants of carbon
sequestration. Developing country CCFs may therefore play a positive role within the context of REDD+ and
other carbon sequestration initiatives. However, because of the nature of our data, results should be considered
indicative. Better and smarter data combined with innovative techniques are needed to conclusively evaluate
linkages between CCFs, carbon sequestration and REDD+.
Key Words: carbon stock, local institutions, REDD, rural Ethiopia
JEL Codes: Q23, Q54.
Contents
Introduction ............................................................................................................................. 1
REDD+ and Community Controlled Forests ....................................................................... 4
Analytical Framework, Data and Empirical Methods ........................................................ 5
Results .................................................................................................................................... 10
Conclusions and Policy Implications ................................................................................... 13
References .............................................................................................................................. 15
Figures and Tables ................................................................................................................ 20
Appendix ................................................................................................................................ 25
Environment for Development Beyene, Bluffstone, and Mekonnen
1
Community Controlled Forests, Carbon Sequestration and REDD+:
Some Evidence from Ethiopia
Abebe D. Beyene, Randall Bluffstone, and Alemu Mekonnen
Introduction
Although international negotiations on climate change have yielded little agreement, and
atmospheric carbon concentrations and global average temperatures continue to increase,1 there
has been some agreement on the need to reduce emissions from deforestation and forest
degradation in developing countries. Loss of forest biomass through deforestation and forest
degradation makes up 12% to 20% of annual greenhouse gas emissions (Saatchi et al., 2011; van
der Werf, 2009), which is more than all forms of transport combined. Total carbon stored in
forests is estimated at 638 Gt (UNFCCC, 2011), with about 247 gigatons stored in Latin
America, Sub-Saharan Africa and Southeast Asia. About 80% is stored above ground (Saatchi et
al., 2011).
The idea behind REDD (Reduced Emissions from Deforestation and Forest Degradation)
is that providing financial and technical support to developing countries can reduce deforestation
and therefore sequester more carbon. The “plus” in REDD+ incorporates afforestration and other
activities to enhance forest carbon stocks.2 This approach may effectively compete with other
climate investments as part of a cost-effective climate policy (McKinsey & Company, 2010;
Kindermann et al, 2008).
Abebe D. Beyene, Environmental Economics Policy Forum for Ethiopia, P.O. Box. 2479, Addis Ababa, Ethiopia,
(tel) 251-1-15523564, email: [email protected]. Randall Bluffstone (corresponding author), Portland State
University, Department of Economics, P.O. Box 751 Portland, Oregon, USA, 97207-0751, (tel) 503-725-3938, (fax)
503-725-3945, email: [email protected]. Alemu Mekonnen, Department of Economics, Addis Ababa University,
P.O. Box 1176, Addis Ababa, Ethiopia, e-mail: [email protected]. The authors acknowledge with thanks
the financial support obtained for data collection and analysis from Sida through the Environment for Development
(EfD) initiative and the EfD Center in Ethiopia, called the Environmental Economics Policy Forum for Ethiopia
(EEPFE), at the Ethiopian Development Research Institute (EDRI).
1 As of October 2012, there have been 17 conferences of the parties to the UN Framework Convention on Climate
Change (UNFCCC). Most mitigation activities are local or regional. (Agrawal et al., 2011). The focus on forest-
related sequestration in developing countries began with COP 13, held in Bali, Indonesia in 2007
2 Resources assembled to support these efforts include the World Bank Forest Carbon Partnership Facility (FCPF)
and UN-REDD, which is a United Nations-implemented initiative funded by the Government of Norway.
Environment for Development Beyene, Bluffstone, and Mekonnen
2
Using household and community data from 22 communities in four regional states in
Ethiopia, we provide one of the few assessments of whether better social coordination around
common forest management to reduce forest degradation sequesters more carbon than less well-
coordinated systems. In examining this question, we respond to Agrawal and Angelsen (2009),
who suggest this issue can be relevant to REDD+. We find that the quality of local institutions
may be important determinants of carbon sequestration.
Although our results are strongly indicative, they should be considered preliminary
because of potential endogeneity. We analyze the challenging case of management in
community-controlled forests (CCFs). CCFs are an example of institutions and property rights
over forests – formal, informal, written or unwritten3– that are vested in a group of people. CCFs
can be considered a type of common property regime that is intermediate between private
property, where rights and responsibilities are with individuals, households and firms, and state
property, where rights and responsibilities are vested in governments. Such institutions are not
purely exogenous treatments. Indeed, going back at least to Heltberg (2001), CCFs have been
modeled as emerging from endogenous processes.
As yet, there is little empirical evidence on whether community forest management
structures are institutions that should be given serious consideration as REDD+ partners in the
battle to mitigate climate change. We therefore attempt to shed light on whether CCFs with
design features known to be associated with better management appear to sequester more carbon
than community systems with lower levels of these characteristics.
An exception to this lack of evidence is Chhatre and Agrawal (2009), who examine
tradeoffs between climate and forest livelihood benefits. Using a worldwide data set, they
conclude that, in general, these goals are complementary. In their paper, however, forest quality
is measured fairly coarsely and the CCF design principles used are highly aggregated. Indeed,
one of the key conclusions of the paper is that more detailed analysis is needed.
Our paper builds on and extends the approach of Chhatre and Agrawal (2009) by
incorporating detailed estimates of forest areas, supported by on-the-ground measurements and
combined with much more comprehensive and nuanced measures of CCF design principles. We
better characterize design and effectiveness using detailed common property design elements
that are well established in the literature (Ostrom, 1990, 2000, 2009; Agrawal 2000, 2001;
3 Property rights refer to the right to the stream of benefits from forests and also the right to control forests.
Environment for Development Beyene, Bluffstone, and Mekonnen
3
Agrawal et al., 2008; Shyamsundar, 2008). Using 14 specific measures of CCF institutional
elements, we explicitly incorporate the multi-dimensionality and continuity of such institutions
that have been part of the recent literature (e.g. Agrawal et al., 2008; Bluffstone et al, 2008;
Mekonnen and Bluffstone, 2008).
Understanding the role of CCF management in reducing climate change is important for
at least three reasons. First, perhaps 25% of developing country forests are under some type of
community control (World Bank, 2009; Economist, 2010b) and the portion in low-income
countries is no doubt much higher. If forests are a key source of greenhouse gas emissions and
CCFs are about a quarter of world forests, it is difficult to imagine addressing climate change
without bringing CCFs into REDD.
Second, CCFs are critical assets to people in rural areas of low-income countries, but the
livelihood potential of forests has yet to be even partially tapped, because so many benefits are
non-marketed. A key challenge for developing country forestry is therefore to extract value from
forest lands without overharvesting timber or converting forest land to other uses, such as
agriculture and pasture (Hyde et al, 1996). Meeting this challenge to improve the economic
conditions of poor people and preserve forests has proven to be difficult.
Third, in most low-income developing countries, forests provide people a variety of
products that are essential to daily life, including fuel wood, forest fruits and vegetables, building
materials and animal fodder (Cooke et al. 2008). For example, grazing and fodder benefits
derived by communities in Kenya are estimated to be about $33 per hectare per year (Guthiga,
2008). In a country with PPP GDP per capita of $1800 per year, forest benefits are therefore
important for villagers.
The reliance of rural households on forest resources has critical climate change
ramifications. For example, over two billion people around the world cook with biomass on a
regular basis and most of this comes from forests. Though fuel wood is in principle carbon
neutral, the black carbon from biomass fuels for cooking and heating is known to be a key
contributor to climate change. CO2 emissions cause 40% of anthropogenic climate change, but
black carbon is second with an 18% contribution (Rosenthal, 2009).
In the next section, we provide a brief discussion of the literature at the intersection of
REDD+ and CCFs. Our data and methodology are discussed in the section that follows. Next,
the findings are presented. The concluding section highlights areas for further work.
Environment for Development Beyene, Bluffstone, and Mekonnen
4
REDD+ and Community Controlled Forests
REDD+ refers to reducing emissions both from deforestation and forest degradation and
incorporates the role of conservation, sustainable forest management and enhancement of forest
carbon stocks in developing countries (UN-REDD, 2010). REDD+ is the focus of the 2010 –
2015 UN-REDD Programme. While most developing country forests are on paper government
owned, in practice about one-quarter of forests are actually controlled to important degrees by
communities (Agrawal et al, 2008). Since the early 1980s, there has been a worldwide trend in
developing countries toward various types of community control and management of forests, at
least partly because privately owned and government structures have often proved infeasible.
This process may take the form of devolving either ownership and control of forests or only user
rights to local users (Sunderlin et al, 2008; Agrawal et al, 2008).
A critical literature for our paper discusses CCF design principles and attempts to
disaggregate CCF components. This work suggests that effective CCF systems contribute to
better natural resource management (Shyamsundar, 2008) when they empower communities and
have clear access and extraction rules, fair and graduated sanctions, public participation, clear
quotas and successful monitoring (Ostrom, 1990; Agrawal, 2000, 2001). Recent work also
emphasizes the need to analyze the details of CCFs rather than treating CCF as a binomial
variable (Jodha, 2008; Shyamsundar, 2008; Agarwal, 2010), but evidence is limited on whether
CCF design elements have mainly independent effects or are synergistic. Bluffstone et al. (2008)
and Mekonnen and Bluffstone (2008) estimate that design elements are viewed by households as
a package rather than having independent effects.
Linking CCFs and REDD+ is seen by many as a natural extension of the worldwide trend
toward forest devolution and the development of regional and voluntary carbon markets (e.g.
Peskett et al., 2008). For example, the Regional Community Forest Training Center, in
collaboration with the Global Alliance for Community Forestry, noted that “Community-based
forest management (CBFM) provides a sound framework through which REDD can provide
financial and livelihood benefits to forest-dependent communities and indigenous peoples, by
acknowledging their essential role in the long-term, sustainable management of forest
ecosystems” (RECOFT, 2008, p.1).
Phelps et al. (2010) argue that the scope of REDD should be broadened to include
“incentivizing conservation among direct forest managers, including forest-dependent
communities....” Venter et al. (2009) agree and argue that particularly biodiverse areas should be
targeted for REDD+ payments. Cronkleton et al. (2011) echo Agrawal and Angelsen (2009) and
Environment for Development Beyene, Bluffstone, and Mekonnen
5
note that REDD+ outcomes could be achieved through the adoption of common property design
principles, including secure property rights and strong institutions for forest governance.
Though not directly related to our analysis, an important strand of the literature has raised
social concerns about linking REDD+ with CCFs. A particular worry is that local people in
developing countries will end up paying the cost of climate change mitigation, rather than
benefiting from REDD+ payments (Dyer and Counsel, 2010). Ratsimbazafy et al. (2011) studied
the livelihood dimensions of REDD+ in eastern Madagascar. They found that socioeconomically
disadvantaged individuals are the most dependent on forests and are the most affected by
restrictive measures intended to avoid deforestation and forest degradation. They find that the
compensation offered is not enough to recover opportunity costs.
There is particularly limited empirical literature that addresses the question of whether
CCFs that include better design principles actually sequester more carbon (Chazdon 2008;
Ranganathan et al. 2008). An important analytical challenge in answering this question is
effectively dealing with leakage. For example, people living in areas with CCFs that include
better design principles and perhaps related REDD+ contracts may simply gather forest products
from uncontrolled areas (Robinson and Lokina, forthcoming). To our knowledge, no
retrospective empirical studies of CCFs measure and adjust for leakage. We are, unfortunately,
also unable to address this issue, though the nature of our data makes leakage unlikely. As
already noted, our contribution focuses on effectively measuring forests and suggesting ways to
integrate CCF design elements with REDD+ by incorporating a nuanced and contemporary view
of CCFs.
Analytical Framework, Data and Empirical Methods
For resources held in common, the literature views better collective action as an
important step toward improving natural resource management, and in our case, carbon stocks.
The analytical framework we use draws heavily on this body of knowledge and supposes that
communities with more social capital are better able to develop natural resource management
systems, leading to higher quality natural resources. We do not directly observe social capital,
but we instead observe better management and can effectively interpret it, because a large
literature has analyzed the components of better community management. We therefore expect
better managed CCFs to sequester more carbon.
We are not able to exclude all possible confounding factors, but, as discussed below, we
adjust for the major confounders considered in the literature. Reverse causality is always a
Environment for Development Beyene, Bluffstone, and Mekonnen
6
potential problem and we are not confident that we have good instruments for CCF management.
We view reverse causality as unlikely, however, because communities have little reason to invest
in better social organization when forests are abundant (Hyde et al, 1996); if there is reverse
causality, we therefore expect to find exactly the opposite of our hypothesis that better collective
action is associated with more forest carbon.
Finally, though we cannot exclude all possibilities, it is unlikely that a common
exogenous variable affects both CCF collective action and carbon stocks. For example, more
effective community natural resource management and the social capital that we and the
literature believe underpins it are particularly difficult to create from the outside and are instead
much more likely to emerge from complicated processes (Ostrom, 2009; Agrawal, 2007) that
have very little to do with larger carbon stocks. Indeed, it is difficult to even think of a
reasonably likely exogenous shock or stimulus that would affect both forest carbon and social
organization. With careful choice of conditioning variables that are potential confounders, we are
therefore confident that our analysis adds to the literature.
The data used for this study were collected in 2009 in the Amhara, Oromiya, Southern
Nations Nationalities and People (SNNP), and Tigray regional states. These states include all
those with sufficient rainfall to support forests and stretch from Kenya to the Eritrean border.
The kebeles within these regional states are chosen based on certain criteria such as variation in
agro-ecology, forest cover, ethnic group and forest management.4
Ethiopia currently has an estimated closed canopy forest cover of 4.6% compared with a
baseline of perhaps 40% in the 16th
century (EFAP 1994; Tumcha 2004). It also has a 0.8%
annual deforestation rate and 83% of the 80 million people live in rural areas (World Bank,
2005). Since the year 2000, Ethiopia has increasingly recognized that forest size and quality is
important for economic performance and has therefore made increased forest cover a policy
priority. For example, a forest proclamation was issued in 2007 and the first-ever federal forest
policy was approved the same year. Both of these documents allow for a variety of institutional
arrangements for investment in forests, including CCFs, private woodlots, and on-farm trees.
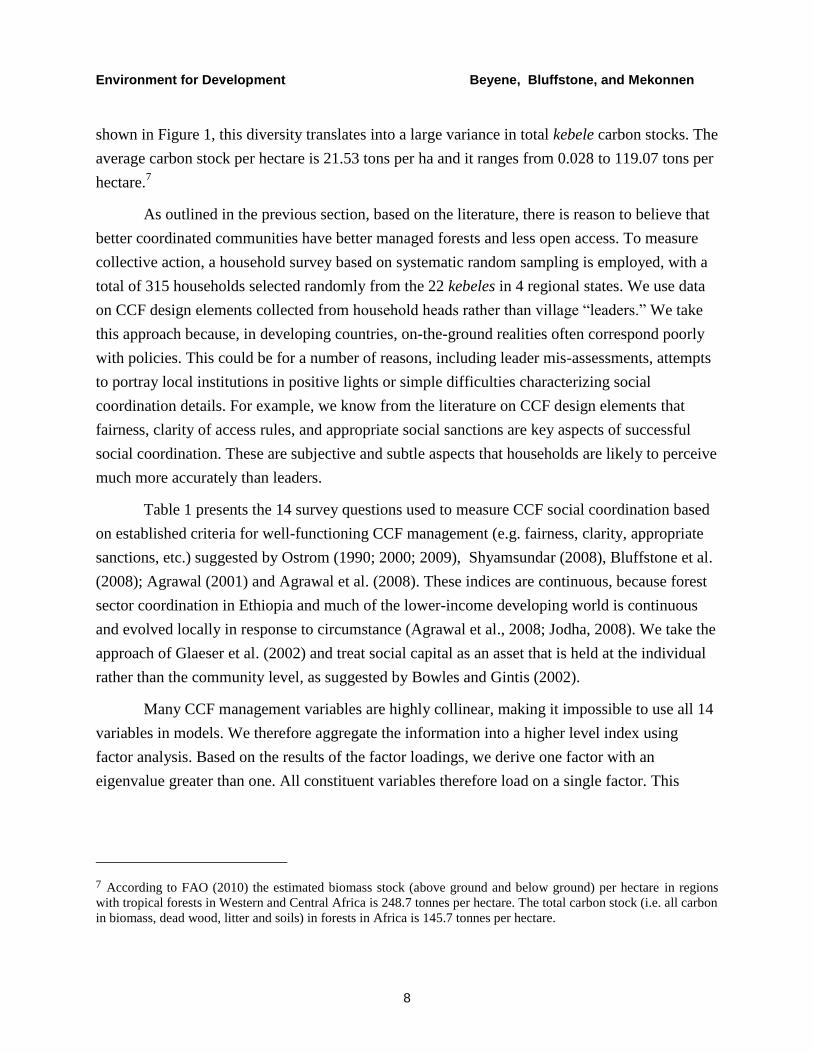
Three types of data are used in this paper. The first data are 15 m2 ASTER (Advanced
Spaceborne Thermal Emission and Reflection Radiometer) satellite images purchased to derive
natural and plantation forests within each kebele boundary. Second, community characteristics
4 Kebele is the lowest administrative unit, sometimes called peasant association.
Environment for Development Beyene, Bluffstone, and Mekonnen
7
were collected from secondary data sources and kebele officials. Third, a household survey was
conducted to collect household perceptions of CCF management that we believe are superior to
previous attempts.
Kebele forest area is estimated based on analysis of satellite imagery and includes both
natural and plantation (e.g. eucalyptus) forests. Above ground biomass is then estimated using
on-the-ground sampling of average tree height, average diameter at breast height, and species
composition within each of the kebele forests. With information about the species composition of
kebele forests, wood density is estimated using the global wood density database (Zanne et al.
2009; Chave et al. 2009). Above ground biomass is estimated using Equation 1, which was
developed for tropical countries by Brown et al. (1989) and proposed in Chavan et al. (2010) and
Brown (1997). This function is used because of its relative sophistication compared with other
allometric approaches that estimate biomass based only on diameter at breast height. The
approach of Brown et al. (1989) therefore has the ability to capture characteristics of a variety of
ecosystems.
1)Y = exp-2.409+0.9522 ln(D2*H*S)
Where Y=the aboveground biomass (kg)5, H=height of the trees in m, D=Diameter at
breast height (cm), and S= the wood density (gm/cm3). In accord with Brown et al. (1989), above
ground carbon is a linear function of and assumed to be half the total biomass. This approach is
acknowledged to be simplistic in a world where carbon inventory methodologies are themselves
fields of study. As we are interested mainly in differences across kebeles rather than carbon
levels, we believe this approach to be reasonable.6
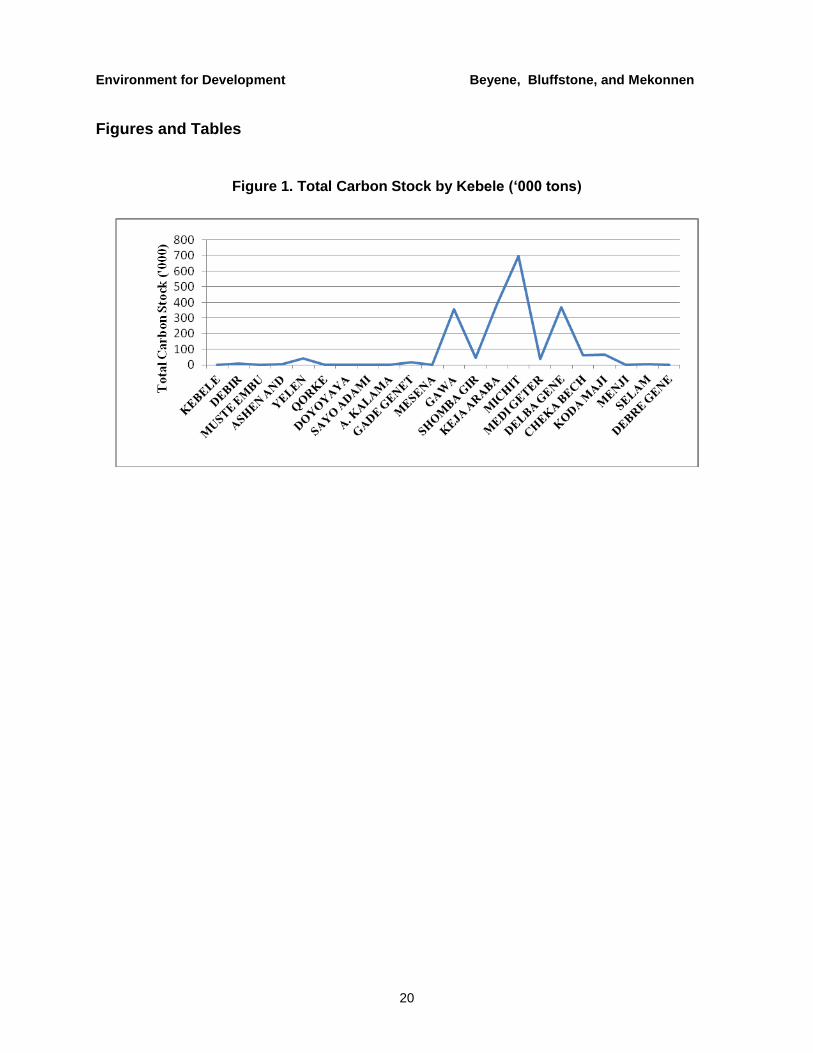
Because our sample areas come from different regional states in the country, they
represent a diversity of populations, forest sizes, social and ecological systems. We normalize
our carbon estimates for population (carbon per capita) and forest area (carbon per hectare) and,
as already noted, take explicit account of forest species diversity in our biomass calculations. As
5 Biomass is defined as “organic material both above-ground and below-ground, and both living and dead, e.g.,
trees, crops, grasses, tree litter, roots etc.” Above-ground biomass (AGB) consists of all living biomass above the
soil, including stem, stump, branches, bark, seeds, and foliage.
6 We would have preferred to estimate village rather than forest area, because it is more closely tied to households.
Unfortunately, villages in Ethiopia are not recognized administrative districts. The lowest analyzable level using
satellite imaging is the kebele. A positive aspect, though, is that by measuring forests at the kebele level, leakage is
very unlikely. Very few households simultaneously collect from two or more forests.
Environment for Development Beyene, Bluffstone, and Mekonnen
8
shown in Figure 1, this diversity translates into a large variance in total kebele carbon stocks. The
average carbon stock per hectare is 21.53 tons per ha and it ranges from 0.028 to 119.07 tons per
hectare.7
As outlined in the previous section, based on the literature, there is reason to believe that
better coordinated communities have better managed forests and less open access. To measure
collective action, a household survey based on systematic random sampling is employed, with a
total of 315 households selected randomly from the 22 kebeles in 4 regional states. We use data
on CCF design elements collected from household heads rather than village “leaders.” We take
this approach because, in developing countries, on-the-ground realities often correspond poorly
with policies. This could be for a number of reasons, including leader mis-assessments, attempts
to portray local institutions in positive lights or simple difficulties characterizing social
coordination details. For example, we know from the literature on CCF design elements that
fairness, clarity of access rules, and appropriate social sanctions are key aspects of successful
social coordination. These are subjective and subtle aspects that households are likely to perceive
much more accurately than leaders.
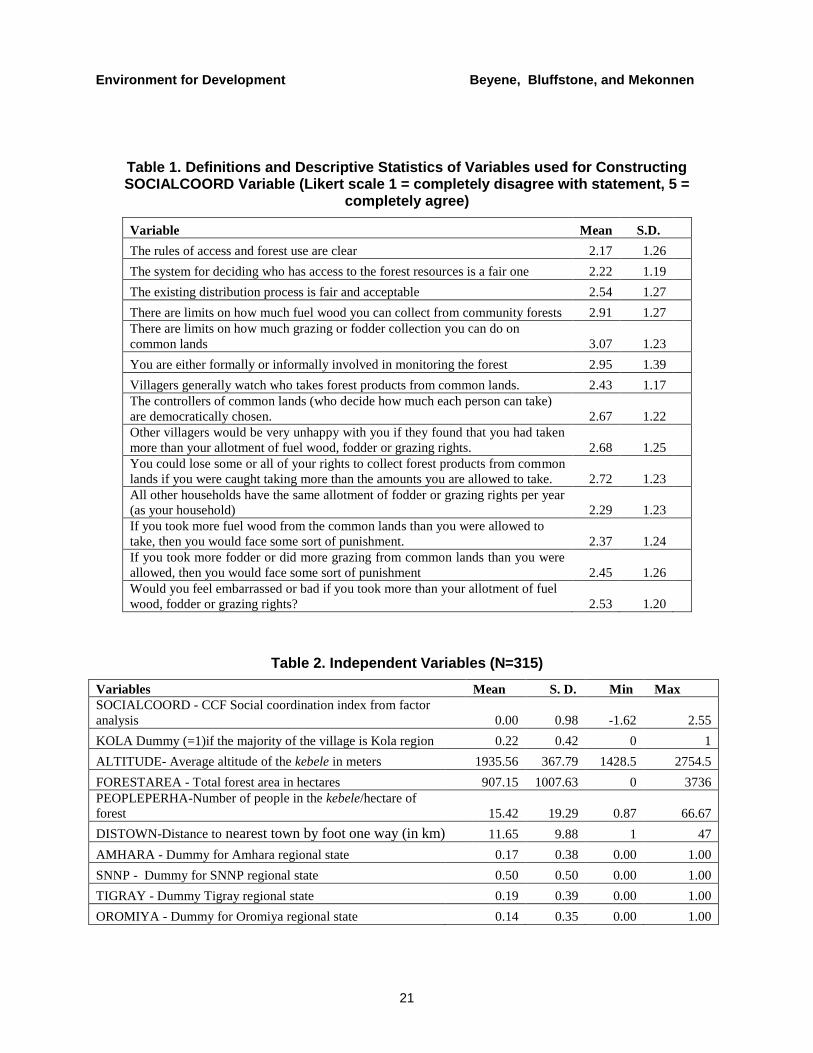
Table 1 presents the 14 survey questions used to measure CCF social coordination based
on established criteria for well-functioning CCF management (e.g. fairness, clarity, appropriate
sanctions, etc.) suggested by Ostrom (1990; 2000; 2009), Shyamsundar (2008), Bluffstone et al.
(2008); Agrawal (2001) and Agrawal et al. (2008). These indices are continuous, because forest
sector coordination in Ethiopia and much of the lower-income developing world is continuous
and evolved locally in response to circumstance (Agrawal et al., 2008; Jodha, 2008). We take the
approach of Glaeser et al. (2002) and treat social capital as an asset that is held at the individual
rather than the community level, as suggested by Bowles and Gintis (2002).
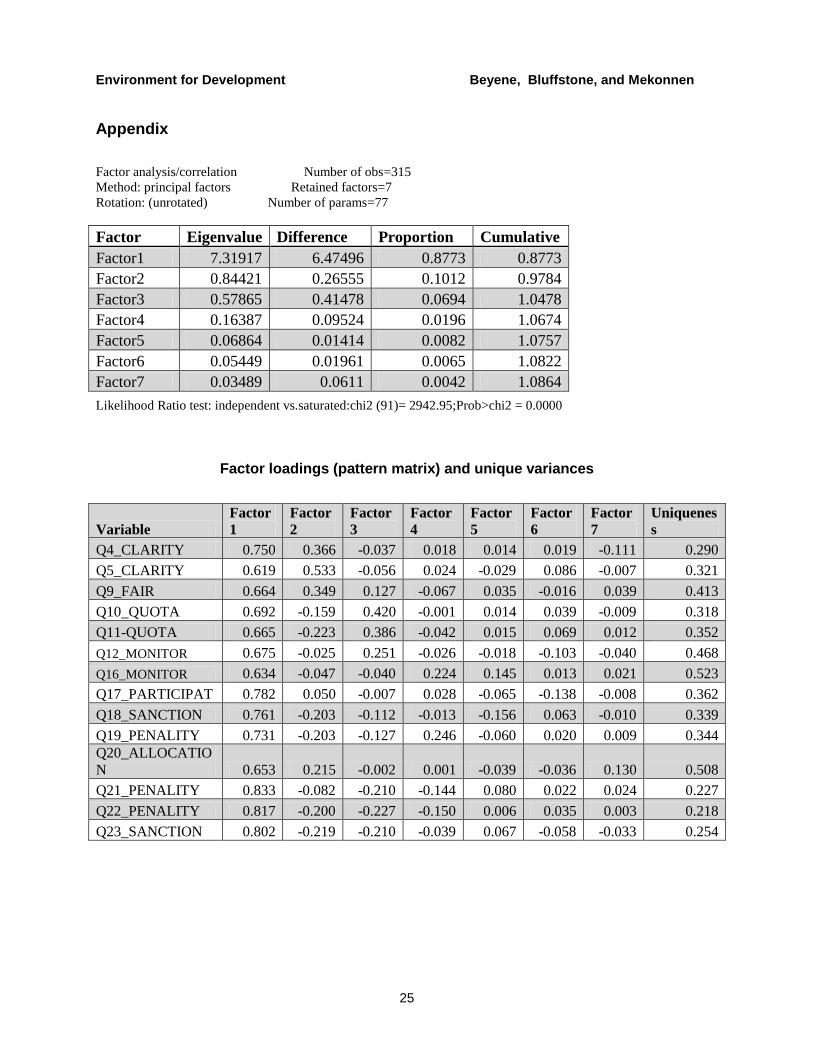
Many CCF management variables are highly collinear, making it impossible to use all 14
variables in models. We therefore aggregate the information into a higher level index using
factor analysis. Based on the results of the factor loadings, we derive one factor with an
eigenvalue greater than one. All constituent variables therefore load on a single factor. This
7 According to FAO (2010) the estimated biomass stock (above ground and below ground) per hectare in regions
with tropical forests in Western and Central Africa is 248.7 tonnes per hectare. The total carbon stock (i.e. all carbon
in biomass, dead wood, litter and soils) in forests in Africa is 145.7 tonnes per hectare.
Environment for Development Beyene, Bluffstone, and Mekonnen
9
single factor explains 87.7% of the variation, indicating that households appear to treat CCF as a
package with several components.8
Social coordination is at the household level. So is distance from households to nearest
roads, a critical measure of transport costs and market access9and a potential confounder. These
features imply that our analysis must also be at the household level. Households within kebeles
are assumed to have equal access to carbon per capita and carbon per hectare in kebele forests.
We believe this approach is reasonable, because forests are held in common and, as discussed in
literature dating back to Gordon (1954), in such situations average stocks are the correct metric.
Households extract forest products from these common forests subject to management rules
and/or norms. Extraction of biomass by villagers reduces carbon stocks, which are observed
along with CCF management features.
Carbon stored in natural and plantation forests is likely affected not only by institutional
elements that we hypothesize are important, but also community and ecological variables
(Chaiyo et al., 2011). We therefore follow the lead of Chhatre and Agrawal (2009) and include
several other variables. These independent variables are listed in Table 2. Physical isolation,
because of increased transport costs and reduced market opportunities, is expected to be
associated with less extraction of biomass by villagers and therefore more carbon sequestration.
This is consistent with the von Thunen model of deforestation (Hyde et al., 1996) and a large
literature on geography and development that finds isolation reduces economic activity and
therefore development (e.g. Gallup, Sachs and Mellinger, 1999). It is also possible that more
isolated kebeles have systematically different levels of social coordination than more proximate
ones, making isolation a potential confounding factor. Because distance to roads can vary widely
within kebeles, the average value is not terribly meaningful. As already noted, this variable is
therefore measured at the household level.
We use three explicitly ecological variables. Forest carbon is affected by forest altitude
and the type of ecosystem, because of variations in temperature, rainfall and resulting densities
and species composition. We therefore include average kebele altitude and whether kebele
8 Bluffstone et al (2008) also found that respondents in the Bolivian highlands view CCF design elements as a
bundle of characteristics rather than as completely distinct components. Mekonnen and Bluffstone (2008) found
similar results for a sample of households in Amhara Regional State of Ethiopia. The factor analysis details can be
found in the Appendix. 9 E.g. see Yesuf and Bluffstone (2009) and Fafchamps and Hill (2005).
Environment for Development Beyene, Bluffstone, and Mekonnen
10
ecosystems are classified as Kola, which are relative lowlands between 500 and 1500 meters in
our models.
Population pressures, because of the need to access direct use values important for
subsistence (e.g. fuelwood, fodder and grazing) rather than other forest values should be
associated with lower carbon stocks. It is also a potential confounding factor if, for example,
more competition for natural resources makes social coordination more difficult. More people
per hectare of forest, which is the variable we measure, implies more population pressure on
forests, and we therefore expect smaller carbon stocks. We also include total area of forests,
because, all else equal, larger forests have more carbon combined with fewer livelihood
tradeoffs.
Of course, unobserved regional factors will also influence carbon sequestration in kebele
forests. A key such factor is average kebele rainfall. Such data are not available, however,
because outside Ethiopian cities there are very few meteorological stations. To capture this and
other unobservables, we include regional state fixed effects, with Oromiya Regional State the
omitted regional state.10
As discussed below, these dummy variables also are likely to pick up
unobserved social variables, such as social capital and coordination not captured by our CCF
management factor analysis.
Results
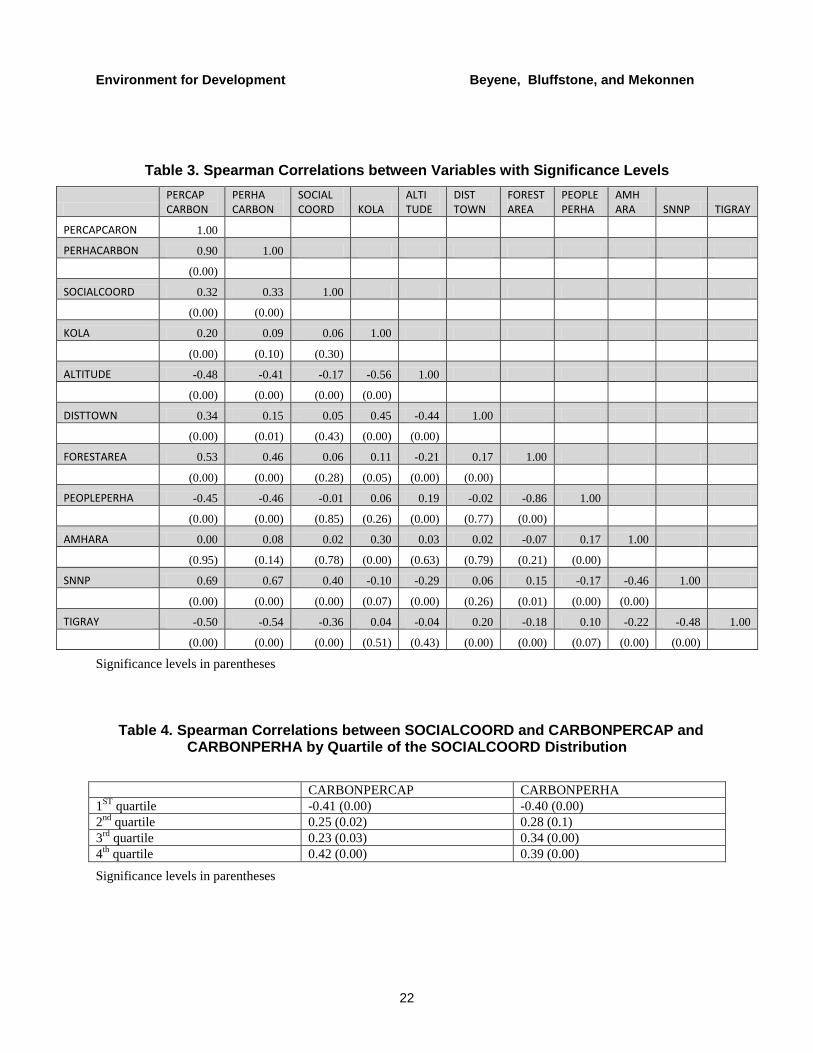
We begin our results discussion with an analysis of bivariate Spearman correlations that
provide empirical support for our regression models. These are presented in Table 3.
We see that, with the exception of the Amhara Regional State dummy, all variables in our
models are significantly associated with our two measures of carbon (PERCAPCARBON and
PERHACARBON). SOCIALCOORD, which is the result of factor analysis of our 14 CCF
management variables, is positively correlated with forest carbon and significant at greater than
the 1% level for both carbon measures (ρ=0.32 and 0.33). Other variables have expected
correlations. Households living in more remote areas (DISTOWN ρ= 0.34 and 0.15) and in kola
regions (ρ=0.20 and 0.09) have higher carbon forests, as do those with larger forest areas (ρ=0.53
and 0.46). Households living in kebeles with higher average altitudes have less carbon in their
forests (ρ=-0.48 and -0.41) as do those living in areas with greater population pressures (ρ=-0.45
10 Altitude and agro-ecological zone also capture rainfall effects.
Environment for Development Beyene, Bluffstone, and Mekonnen
11
and -0.46). The SNNP Regional State dummy is highly positively correlated with forest carbon
(ρ=0.69 and 0.67), reflecting the wetter, more tropical ecological characteristics and larger forest
stocks than in hilly regions. Tigray, which is a low rainfall, mountainous regional state in the
north of the country, is highly negatively associated with carbon stocks (ρ=-0.50 and -0.54).
Our main interest is in SOCIALCOORD. We see in Table 3 that, in general, other
independent variables are either insignificantly correlated with SOCIALCOORD or have
correlations close to zero. Only the SNNP and Tigray Regional State dummies are highly and
significantly correlated with SOCIALCOORD, with households in SNNP Regional State likely
to perceive high levels of CCF social coordination (ρ=0.40) and those in Tigray low levels of
SOCIALCOORD (ρ=-0.36). These two regional states have very different social norms, ethnic
groups and economies, which appear to be reflected in key unobservable differences in CCF
social capital and social coordination. From an econometric standpoint, we need not worry about
multicollinearity between SOCIALCOORD and any variables except two regional dummies.
Examining the whole distribution of PERCAPCARBON, PERHACARBON and
SOCIALCOORD can mask details. We therefore break the distribution of SOCIALCOORD
down into quartiles of 79 observations each and examine correlations and significance levels.
These results are presented in Table 4. We see that in all quartiles SOCIALCOORD is
significantly correlated with forest carbon. The first quartile is highly negatively correlated with
PERCAPCARBON and PERHACARBON (ρ=-0.41 and -0.39). The middle two quartiles are
positively associated with forest carbon (ρ=0.23 to 0.34) and the top quartile of the
SOCIALCOORD distribution is highly positively correlated with PERCAPCARBON and
PERHACARBON (ρ=0.42 and 0.39). This pattern is in accord with our analytical framework in
which more social capital leads to higher quality collective action and better environmental
outcomes.
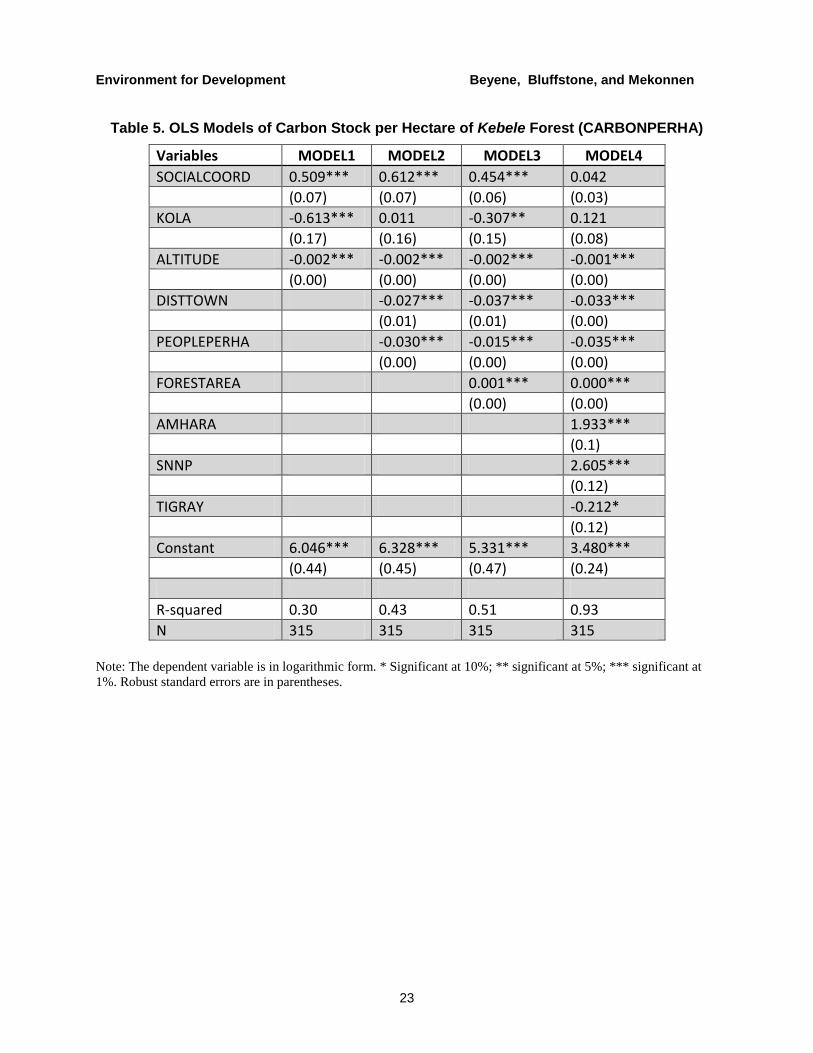
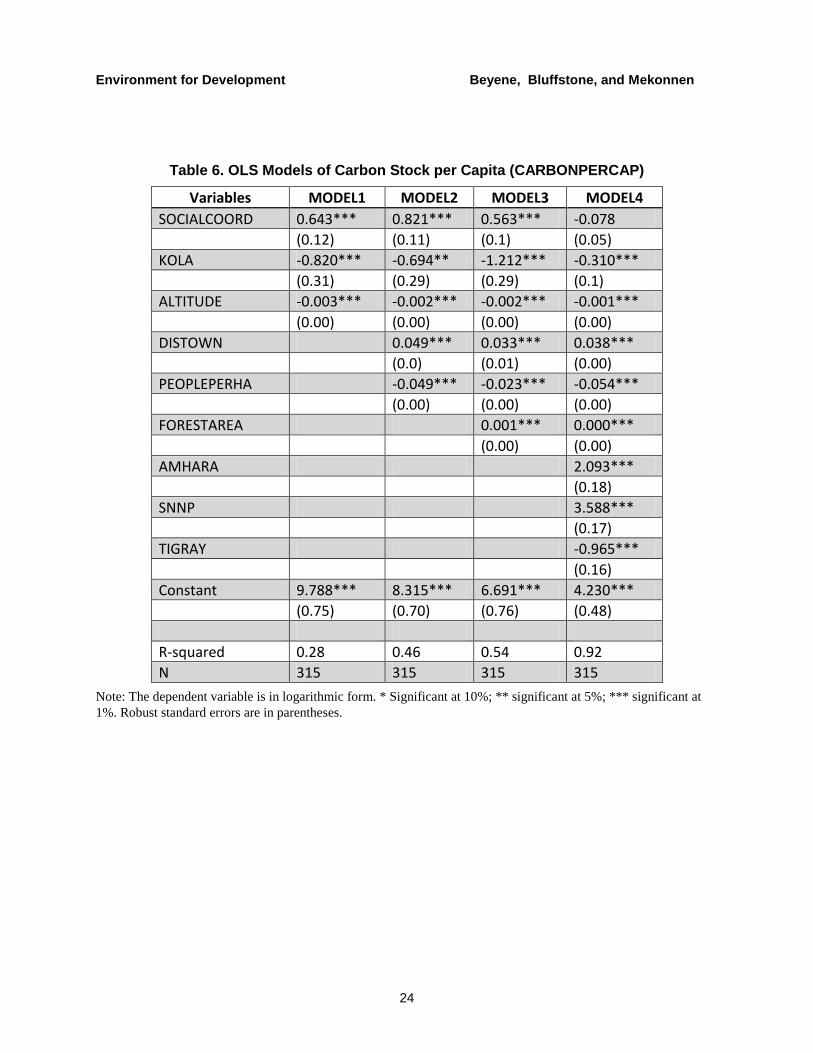
Though these results are indicative that CCF social coordination leads to better
management and more forest carbon, it is possible that effects are spurious. We therefore present
the results of four OLS regression models for each forest carbon measure, all of which include
SOCIALCOORD, our variable of interest. The first set of models includes ecological variables.
The second adds DISTOWN and PEOPLEPERHA, which are both measures of pressure on
forests. The third set of models brings in FORESTAREA and the final model adds regional state
dummies. In the final model, due to very high collinearity (R2 values approaching 1.0)
FORESTAREA needed to be dropped. The results are presented in tables 5 and 6. All dependent
variables are in logs and standard errors are robust standard errors estimated using the method of
White (1981).
Environment for Development Beyene, Bluffstone, and Mekonnen
12
The regression models explain a large portion of the variance in carbon. Even with only
three variables, we estimate R2 of about 0.30, rising to 0.92 with regional state fixed effects.
These are very high values for cross sectional data. The models therefore appear to be reasonable
characterizations of key forest carbon correlates.
Our variable of interest is SOCIALCOORD. We see that, with both definitions of carbon,
SOCIALCOORD is positively and significantly correlated with carbon, as long as regional state
dummies are excluded. An approximately one standard deviation change in SOCIALCOORD is
estimated to increase carbon per capita and per hectare by 45% to 82% depending on the
definition of carbon stock and the model. These results hold when any one regional state dummy
is included and for PERCAPCARBON when any two regional state dummies are included.
SOCIALCOORD is not significantly correlated with carbon when all regional state fixed
effects are included, because SNNP and Tigray dummies are so highly correlated with both
carbon and SOCIALCOORD. We believe there are unobserved social capital variables captured
by the dummy variables that explain this correlation. Our empirical model, which focuses on
CCF management, does not capture all aspects of our analytical framework, because it does not
attempt to analyze the relationship between social capital variables and carbon. Our analytical
framework proposes that exogenous social capital variables, such as trust, reciprocity, etc., affect
observed CCF management, but it does not attempt to directly analyze the effect of those
variables on carbon.
The regional state dummies are likely capturing aspects of social capital that correlate
with SOCIALCOORD as well as factors unrelated to SOCIALCOORD, such as rainfall. As we
are not interested in analyzing these details, however, we do not view this issue as a problem.
We, of course, cannot rule out the possibility that the strong empirical effect of the regional state
dummies is because of confounders outside our analytical framework. As was already mentioned
in our analytical framework discussion, however, it is very difficult to envision exogenous
factors that strongly affect both social coordination and forest carbon.
Conditioning variables in general have the expected signs. Increasing average kebele
altitude by 100 meters from the average of about 1900 meters is estimated to reduce carbon by
10% to 20%, and an increase in forest area of 100 hectares is estimated to increase
CARBONPERHA and CARBONPERCAP by about 10%. Carbon is especially sensitive to
population pressure, with an increase in population per forest hectare of 10 people associated
with reduced carbon of 15% to 50%. More remote areas also tend to have more carbon, with an
Environment for Development Beyene, Bluffstone, and Mekonnen
13
increase in distance to town of 1 kilometer associated with a 3% to 5% increase in carbon.
Amhara and SNNP Regional State fixed effects are associated with 200% to 300% more carbon
than that associated on average with households in Oromiya Regional State. Tigray kebeles have
less than 80% of the carbon of counterparts in Oromiya. KOLA, like SOCIALCOORD, is
sensitive to inclusion of the regional state dummies.
Conclusions and Policy Implications
Mitigating and hopefully reversing climate change is one of the key challenges facing
humanity today. REDD+, which supports a variety of forest carbon-enhancing approaches in the
developing world, is one of the tools under development to try to meet this challenge. A key
issue within REDD+ is to appropriately bring in the almost 25% of developing country forests
that are effectively controlled by communities. There is limited analysis of the actual carbon
sequestration potential of better-managed CCFs. Using an analytical framework that draws
heavily on the common property and social capital literatures, satellite imagery combined with
on-the-ground carbon estimates, an innovative detailed measure of CCF management, and an
empirical model partially inspired by Chhatre and Agrawal (2009), our paper attempts to help
close this gap.
We are unable to conclusively say that what the literature has clearly identified as better-
managed CCFs sequesters more or less carbon, because of the nature of our data (cross-
sectional). As we have indicated, conclusions should therefore be drawn that take account of data
limitations. Using two measures of carbon, however, we find strong evidence that better
managed CCFs sequester more carbon. Indeed, a one standard deviation increase in our measure
of social coordination is associated with 45% to 80% larger carbon stocks, depending on the
carbon definition and model.
These findings are not completely robust to inclusion of regional state dummies, which
are highly correlated with our measure of CCF management. We believe this result indicates that
location dummies capture key unobserved aspects of social capital like trust, experience with
cooperation, family linkages and village ties that are consistent with our analytical model. Our
inability to control for all key aspects of social capital in our 14 CCF management factor
loadings is not unexpected and we argue that this finding does not provide evidence of
confounding.
The results of the empirical analysis suggest that the quality of local level institutions
may be important determinants of carbon sequestration. Developing country CCFs may therefore
Environment for Development Beyene, Bluffstone, and Mekonnen
14
play a positive role within the context of REDD+ and other carbon sequestration initiatives.
Many, many questions are left for the future and for others. Behavioral economists and others are
likely to be interested in making explicit links between the key elements of social capital (e.g.
trust) and carbon sequestration. This paper does not address these issues. Also of keen interest is
to better understand the set of behaviors actually engaged in by households living in areas with
better CCF management. For example, in areas with more controls on forest access and use,
households will need to reduce CCF extractions. Where do they get those products, what
investments are made, what substitutions occur and what hardships are endured are critical
questions that need to be answered if we are to better understand whether CCFs and REDD+ can
be appropriately linked.
Better and smarter data combined with a variety of innovative techniques are needed to
conclusively evaluate the linkage between CCFs, carbon sequestration and REDD+.
Experimental methods should be used whenever possible to more effectively construct
counterfactual scenarios. Socioeconomic and precisely measured forestry panel data that helps
control for unobservables are also critical to answering some of the above questions. As we
precisely link households with particular forests, careful adjustments for leakage will also be
critical.
Environment for Development Beyene, Bluffstone, and Mekonnen
15
References
Agrawal, B. 2010. “Gender and Green Governance: The Political Economy of Women’s
Presence within and beyond Community Forestry.” Oxford: University Press.
Agrawal, A. 2007. “Forests, Governance, and Sustainability: Common Property Theory and Its
Contributions.” International Journal of the Commons 1(1): 111–36.
Agrawal, A. 2001. “Common Property Institutions and Sustainable Governance of Resources.”
World Development 29 (10): 1649–72.
Agrawal, A. 2000. “Sustainability on the Commons.” Paper presented at the 8th
Biennial
Conference of the International Association for the Study of Common Property.
Bloomington, IN, USA, May 30–June 4, 2000.
Agrawal, A., D. Nepstad, and A. Chhatre. 2011. “Reducing Emissions from Deforestation and
Forest Degradation.” Annual Review of Environment and Resources 36: 373-396.
Agrawal, A., A. Chhatre, and R. Hardin. 2008. “Changing Governance of the World’s Forests.”
Science 320: 1460-1462.
Agrawal, A. and A. Angelsen. 2009. “Using Community Forest Management To Achieve
REDD+ Goals.” A. Angelsen (ed.) Realising REDD+: National Strategy and Policy
Options. Bogor, Indonesia: Centre for International Forestry Research.
Angelsen, A., M. Brockhaus, M. Kanninen, E. Sills, W. D. Sunderlin, and S. Wertz-
Kanounnikoff (eds.) 2009. Realising REDD+: National Strategy and Policy options,
CIFOR. Bogor, Indonesia.
Bluffstone, R., M. Boscolo, and R. Molina. 2008. “Does Better Common Property Forest
Management Promote Behavioral Change? On-Farm Tree Planting in the Bolivian
Andes.” Environment and Development Economics 13: 137–70.
Bowles, S. and H. Gintis. 2002. “Social Capital and Community Governance.” The Economic
Journal 112 (483): F419-F436.
Brown, S., A. J. R. Gillespie, and A. E. Lugo. 1989. “Biomass Estimation Methods for Tropical
Forests with Applications to Forest Inventory Data.” Forest Science 35(4):881- 902.
Brown, S. 1997. “Estimating Biomass and Biomass Change of Tropical Forests: A Primer.” FAO
Forestry Paper 134. Food and Agriculture Organisation of the United Nations. Rome,
Italy.
Environment for Development Beyene, Bluffstone, and Mekonnen
16
Chaiyo, U., S. Garivait, and K. Wanthongchai. 2011. “Carbon Storage in Above-Ground
Biomass of Tropical Deciduous Forest in Ratchaburi Province, Thailand.” World
Academy of Science, Engineering and Technology 58.
Chavan, B. L., R. Ambedkar, G. B. Rasal. 2010. “Sequestered Carbon Stock in Selective Tree
Species Grown in University Campus at Aurangaband, Maharashtra, India.” International
Journal of Engineering Science and Technology 2(7): 3003-3007.
http://www.ijest.info/docs/IJEST10-02-07-133.pdf Accessed date: May 19, 2011.
Chave J., D. Coomes, S. Jansen, S. L. Lewis, N. G. Swenson, A. E. Zanne. 2009. “Towards a
Worldwide Wood Economics Spectrum.” Ecology Letters 12: 351-366.
doi:10.1111/j.1461-0248.2009.01285.x
Chazdon, R. 2008. “Beyond Deforestation: Restoring Forests and Ecosystem Services on
Degraded Lands.” Science 320: 1458-59.
Chhatre, A. and A. Agrawal. 2009. “Tradeoffs and Synergies between Carbon Storage and
Livelihood Benefits from Forest Commons.” Proceedings of the National Academy of
Sciences 106 (42): 17667-17670.
Cooke, P., G. Köhlin, and W. F. Hyde. 2008. “Fuelwood, Forests and Community Management
– Evidence from Household Studies.” Environment and Development Economics 13:
103-135.
Cronkleton, P., D. B. Bray, and G. Medina. 2011. “Community Forest Management and the
Emergence of Multi-scale Governance Institutions: Lessons for REDD+ Development
from Mexico, Brazil and Bolivia Forests.” 2: 451-473.
Dyer, N. and S. Counsel. 2010. “McREDD: How McKinsey “Cost Curves‟ are Distorting
REDD.” Rainforest Foundation UK Climate and Forests Policy Brief. November 2010.
Economist. 2010c. “Not a Small Problem: Will REDD Trample on the Rights of Traditional
Forest Folk?” The Economist September 25, 2010.
EFAP (Ethiopian Forestry Action Program). 1994. The Challenge for Development. Vol. II.
Addis Ababa, Ethiopia: EFAP.
Fafchamps, M. and R. V. Hill. 2005. “Selling at the Farmgate or Travelling to Market.”
American Journal of Agricultural Economics 87 (3):717-734.
FAO. 2010. Global Forest Resources Assessment – main report. FAO Forestry Paper No. 163.
Rome, Italy.
Environment for Development Beyene, Bluffstone, and Mekonnen
17
Gallup, J. L., J. D. Sachs, and A. D. Mellinger. 1999. “Geography and Economic Development.”
In B. Pleskovic and J. E. Stiglitz (eds.), Annual World Bank Conference on Development
Economics: 127–172. Washington, DC: World Bank.
Gordon, H.S. 1954. “The Economic Theory of a Common-Property Resource: The Fishery.”
Journal of Political Economy 62(2): 124–42.
Heltberg, R. 2001. “Determinants and Impacts of Local Institutions for Common Resource
Management.” Environment and Development Economics 6 (2): 183–208.
Hyde, W., G. Amacher, and W. Magrath. 1996. “Deforestation and Forest land Use: Theory,
Evidence and Policy Implications.” The World Bank Research Observer Vol. 11. (1996).
Jodha, N. S. 2008. “Some Places Again: A Restricted Revisit to Dry Regions of India.” In R.
Ghate, N. S. Jodha, and P. Mukhopadhyay (eds.) Promise, Trust, and Evolution:
Managing the Commons of South Asia, Oxford University Press, Oxford.
Kinderman, G., B. Obersteiner, J. Sohngen¸ K. Sathaye, E. Andrasko, B. Rametsteiner, B.
Schlamadinger, S. Wunder, and R. Beach. 2008. “Gloost Estimates of Reducing Carbon
Emissions through Avoided Deforestation.” Proceedings of the National Academy of
Science. 105:30 (10302-10307).
McKinsey and Company. 2010. “Impact of the Financial Crisis on Carbon Economics: Version
2.1 of the Global Greenhouse Gas Abatement Cost Curve.”
http://www.mckinsey.com/clientservice/sustainability/pdf/Impact_Financial_Crisis_Carb
on_Economics_GHGcostcurveV2.1.pdf Accessed January 8, 2011.
Mekonnen, A. and R. Bluffstone. 2008. “Is There a Link between Common Property Forest
Management and Private Tree Growing? Evidence of Behavioral Effects from Highland
Ethiopia.” RFF Discussion Paper EfD 08-29. Washington, DC: Resources for the Future
and Environment for Development.
Ostrom, E. 1990. Governing the Commons: The Evolution of Institutions for Collective Action.
New York: Cambridge University Press.
Ostrom, E. 2000. “Collective action and the Evolution of Social Norms.” Journal of Economic
Perspectives 14 (3): 137 - 158.
Ostrom, E. 2009. “A General Framework for Analyzing Sustainability of Social-Ecological
Systems.” Science 325(5939): 419-422.
Environment for Development Beyene, Bluffstone, and Mekonnen
18
Peskett, L., D. Huberman, E. Bowen-Jones, G. Edwards, and J. Brown. 2008. “Making REDD
Work for the Poor.” Briefing paper prepared on behalf of the Poverty Environment
Partnership (PEP). Oveseas Development Institute, London.
Phelps, J., M. C. Guerrero, D. A. Dalabajan, B. Young and E. L. Webb. 2010. “What Makes a
REDD Country?” Global Environmental Change 20: 322-332.
Ratsimbazafy, L. C., K. Harada, and M. Yamamura. 2011. “Forest Conservation and Livelihood
Conflict in REDD: A Case Study from the Corridor Ankeniheny Zahamena REDD
Project, Madagascar.” International Journal of Biodiversity and Conservation 3(12):
618-630.
Ranganathan, J., K. Bennett, C. Raudsepp-Hearne, N. Lucas, F. Irwin, M. Zurek, N. Ash, and P.
West. 2008. “Ecosystem Services: A Guide for Decision Makers.” Washington, DC :
World Resources Institute. http://www.wri.org/publication/ecosystem-services-a-guide-
for-decision-makers.
RECOFT. 2008. “Community-based Forest Management: A Key Element of Effective REDD
Methodologies.” Submission to the Subsidiary Body for Scientific and Technical Advice
(SBSTA) to the UNFCC meeting in Poznan, Poland. Available at
unfccc.int/resource/docs/2009/smsn/ngo/110.pdf
Robinson, Elizabeth J. Z. and Razack B. Lokina. 2011. “Efficiency, Enforcement, and Revenue
Trade-offs in Participatory Forest Management: An Example from Tanzania.”
Environment and Development Economics. Available on CJO 2011
doi:10.1017/S1355770X11000209.
Rosenthal, E. 2009. “Soot from Third-World Stoves is New Target in Climate Fight.” The New
York Times April 16, 2009, Vol. 54,647.
Saatchi, S., M. Harris, S. Brown, M. Lefsky, E. Mitchard, W. Salas, B. Zutta, W. Buermann, S.
Lewis, S. Hagen, S. Petrova, L. White, M. Silman, and A. Morel. 2011. “Benchmark Map
of Carbon Forest Carbon Stocks in Tropical Regions across Three Continents.”
Proceedings of the National Academy of Sciences Vol. 108 (24): 9899-9904.
Shyamsundar, P. 2008. “Decentralization, Devolution, and Collective Action – A Review of
International Experience.” Promise, Trust, and Evolution: Managing the Commons of
South Asia. R. Ghate, N. S. Jodha and P. Mukhopadhyay (eds.) Oxford: Oxford
University Press.
Environment for Development Beyene, Bluffstone, and Mekonnen
19
Sunderlin, W., J. Hatcher, and M. Liddle. 2008. “From Exclusion to Ownership? Challenges and
Opportunities in Advancing Forest Tenure Reform.” Rights and Resources Initiative.
Washington, D.C.
Tumcha, B. 2004. “The Vision of Ministry of Agriculture on Natural Resources of Ethiopia by
2025.” In Proceedings of the Public Meetings on Integrated Forest Policy Development
in Ethiopia, edited by Seyoum Mengistou and Negussu Aklilu, 1-11. Addis Ababa,
Ethiopia: Forum for Environment and Interchurch Organization for Development
Cooperation.
UNFCCC. 2011. “Fact sheet: Reducing Emissions from Deforestation in Developing Countries:
Approaches to Stimulate Action.” Available
athttp://unfccc.int/files/press/backgrounders/application/pdf/fact_sheet_reducing_emissio
ns_from_deforestation.pdf
UN-REDD. The UN-REDD Programme Strategy 2010 – 2015. UN-REDD Programme 5th
Policy Board Meeting. Washington, DC, November 4-5, 2010.
van der Werf, G. R., D. C. Morton, R. S. DeFries, J. G. J. Olivier, P. S. Kasibhatla, R. B.
Jackson, G. J. Collatz, and J. T. Randerson. 2009. “CO2 Emissions from Forest Loss.”
Nature Geoscience 2: 737 – 738. White, 1981.
World Bank. 2009. Forests Sourcebook: Practical Guide for Sustaining Forests in International
Cooperation. World Bank: Washington, D.C.
World Bank. 2005. The Little Green Data Book. Washington, DC: World Bank.
Yesuf, M. and Randall A. Bluffstone. 2009. "Poverty, Risk Aversion, and Path Dependence in
Low-Income Countries: Experimental Evidence from Ethiopia." American Journal of
Agricultural Economics 91(4):1022-1037.
Zanne, A. E., G. Lopez-Gonzalez, D. A. Coomes, J. Ilic, S. Jansen, S. L. Lewis, R. B. Miller, N.
G. Swenson, M. C. Wiemann, and J. Chavez. 2009. “Towards a Worldwide Wood
Economics Spectrum.” Dryad Digital Repository. doi:10.5061/dryad.234
Environment for Development Beyene, Bluffstone, and Mekonnen
20
Figures and Tables
Figure 1. Total Carbon Stock by Kebele (‘000 tons)
Environment for Development Beyene, Bluffstone, and Mekonnen
21
Table 1. Definitions and Descriptive Statistics of Variables used for Constructing SOCIALCOORD Variable (Likert scale 1 = completely disagree with statement, 5 =
completely agree)
Variable Mean S.D.
The rules of access and forest use are clear 2.17 1.26
The system for deciding who has access to the forest resources is a fair one 2.22 1.19
The existing distribution process is fair and acceptable 2.54 1.27
There are limits on how much fuel wood you can collect from community forests 2.91 1.27
There are limits on how much grazing or fodder collection you can do on
common lands 3.07 1.23
You are either formally or informally involved in monitoring the forest 2.95 1.39
Villagers generally watch who takes forest products from common lands. 2.43 1.17
The controllers of common lands (who decide how much each person can take)
are democratically chosen. 2.67 1.22
Other villagers would be very unhappy with you if they found that you had taken
more than your allotment of fuel wood, fodder or grazing rights. 2.68 1.25
You could lose some or all of your rights to collect forest products from common
lands if you were caught taking more than the amounts you are allowed to take. 2.72 1.23
All other households have the same allotment of fodder or grazing rights per year
(as your household) 2.29 1.23
If you took more fuel wood from the common lands than you were allowed to
take, then you would face some sort of punishment. 2.37 1.24
If you took more fodder or did more grazing from common lands than you were
allowed, then you would face some sort of punishment 2.45 1.26
Would you feel embarrassed or bad if you took more than your allotment of fuel
wood, fodder or grazing rights? 2.53 1.20
Table 2. Independent Variables (N=315)
Variables Mean S. D. Min Max
SOCIALCOORD - CCF Social coordination index from factor
analysis 0.00 0.98 -1.62 2.55
KOLA Dummy (=1)if the majority of the village is Kola region 0.22 0.42 0 1
ALTITUDE- Average altitude of the kebele in meters 1935.56 367.79 1428.5 2754.5
FORESTAREA - Total forest area in hectares 907.15 1007.63 0 3736
PEOPLEPERHA-Number of people in the kebele/hectare of
forest 15.42 19.29 0.87 66.67
DISTOWN-Distance to nearest town by foot one way (in km) 11.65 9.88 1 47
AMHARA - Dummy for Amhara regional state 0.17 0.38 0.00 1.00
SNNP - Dummy for SNNP regional state 0.50 0.50 0.00 1.00
TIGRAY - Dummy Tigray regional state 0.19 0.39 0.00 1.00
OROMIYA - Dummy for Oromiya regional state 0.14 0.35 0.00 1.00
Environment for Development Beyene, Bluffstone, and Mekonnen
22
Table 3. Spearman Correlations between Variables with Significance Levels
PERCAP CARBON
PERHA CARBON
SOCIAL COORD KOLA
ALTI TUDE
DIST TOWN
FOREST AREA
PEOPLE PERHA
AMH ARA SNNP TIGRAY
PERCAPCARON 1.00
PERHACARBON 0.90 1.00
(0.00)
SOCIALCOORD 0.32 0.33 1.00
(0.00) (0.00)
KOLA 0.20 0.09 0.06 1.00
(0.00) (0.10) (0.30)
ALTITUDE -0.48 -0.41 -0.17 -0.56 1.00
(0.00) (0.00) (0.00) (0.00)
DISTTOWN 0.34 0.15 0.05 0.45 -0.44 1.00
(0.00) (0.01) (0.43) (0.00) (0.00)
FORESTAREA 0.53 0.46 0.06 0.11 -0.21 0.17 1.00
(0.00) (0.00) (0.28) (0.05) (0.00) (0.00)
PEOPLEPERHA -0.45 -0.46 -0.01 0.06 0.19 -0.02 -0.86 1.00
(0.00) (0.00) (0.85) (0.26) (0.00) (0.77) (0.00)
AMHARA 0.00 0.08 0.02 0.30 0.03 0.02 -0.07 0.17 1.00
(0.95) (0.14) (0.78) (0.00) (0.63) (0.79) (0.21) (0.00)
SNNP 0.69 0.67 0.40 -0.10 -0.29 0.06 0.15 -0.17 -0.46 1.00
(0.00) (0.00) (0.00) (0.07) (0.00) (0.26) (0.01) (0.00) (0.00)
TIGRAY -0.50 -0.54 -0.36 0.04 -0.04 0.20 -0.18 0.10 -0.22 -0.48 1.00
(0.00) (0.00) (0.00) (0.51) (0.43) (0.00) (0.00) (0.07) (0.00) (0.00)
Significance levels in parentheses
Table 4. Spearman Correlations between SOCIALCOORD and CARBONPERCAP and CARBONPERHA by Quartile of the SOCIALCOORD Distribution
CARBONPERCAP CARBONPERHA
1ST
quartile -0.41 (0.00) -0.40 (0.00)
2nd
quartile 0.25 (0.02) 0.28 (0.1)
3rd
quartile 0.23 (0.03) 0.34 (0.00)
4th
quartile 0.42 (0.00) 0.39 (0.00)
Significance levels in parentheses
Environment for Development Beyene, Bluffstone, and Mekonnen
23
Table 5. OLS Models of Carbon Stock per Hectare of Kebele Forest (CARBONPERHA)
Variables MODEL1 MODEL2 MODEL3 MODEL4
SOCIALCOORD 0.509*** 0.612*** 0.454*** 0.042
(0.07) (0.07) (0.06) (0.03)
KOLA -0.613*** 0.011 -0.307** 0.121
(0.17) (0.16) (0.15) (0.08)
ALTITUDE -0.002*** -0.002*** -0.002*** -0.001***
(0.00) (0.00) (0.00) (0.00)
DISTTOWN -0.027*** -0.037*** -0.033***
(0.01) (0.01) (0.00)
PEOPLEPERHA -0.030*** -0.015*** -0.035***
(0.00) (0.00) (0.00)
FORESTAREA 0.001*** 0.000***
(0.00) (0.00)
AMHARA 1.933***
(0.1)
SNNP 2.605***
(0.12)
TIGRAY -0.212*
(0.12)
Constant 6.046*** 6.328*** 5.331*** 3.480***
(0.44) (0.45) (0.47) (0.24)
R-squared 0.30 0.43 0.51 0.93
N 315 315 315 315
Note: The dependent variable is in logarithmic form. * Significant at 10%; ** significant at 5%; *** significant at
1%. Robust standard errors are in parentheses.
Environment for Development Beyene, Bluffstone, and Mekonnen
24
Table 6. OLS Models of Carbon Stock per Capita (CARBONPERCAP)
Variables MODEL1 MODEL2 MODEL3 MODEL4
SOCIALCOORD 0.643*** 0.821*** 0.563*** -0.078
(0.12) (0.11) (0.1) (0.05)
KOLA -0.820*** -0.694** -1.212*** -0.310***
(0.31) (0.29) (0.29) (0.1)
ALTITUDE -0.003*** -0.002*** -0.002*** -0.001***
(0.00) (0.00) (0.00) (0.00)
DISTOWN 0.049*** 0.033*** 0.038***
(0.0) (0.01) (0.00)
PEOPLEPERHA -0.049*** -0.023*** -0.054***
(0.00) (0.00) (0.00)
FORESTAREA 0.001*** 0.000***
(0.00) (0.00)
AMHARA 2.093***
(0.18)
SNNP 3.588***
(0.17)
TIGRAY -0.965***
(0.16)
Constant 9.788*** 8.315*** 6.691*** 4.230***
(0.75) (0.70) (0.76) (0.48)
R-squared 0.28 0.46 0.54 0.92
N 315 315 315 315
Note: The dependent variable is in logarithmic form. * Significant at 10%; ** significant at 5%; *** significant at
1%. Robust standard errors are in parentheses.
Environment for Development Beyene, Bluffstone, and Mekonnen
25
Appendix
Factor analysis/correlation Number of obs=315
Method: principal factors Retained factors=7
Rotation: (unrotated) Number of params=77
Factor Eigenvalue Difference Proportion Cumulative
Factor1 7.31917 6.47496 0.8773 0.8773
Factor2 0.84421 0.26555 0.1012 0.9784
Factor3 0.57865 0.41478 0.0694 1.0478
Factor4 0.16387 0.09524 0.0196 1.0674
Factor5 0.06864 0.01414 0.0082 1.0757
Factor6 0.05449 0.01961 0.0065 1.0822
Factor7 0.03489 0.0611 0.0042 1.0864
Likelihood Ratio test: independent vs.saturated:chi2 (91)= 2942.95;Prob>chi2 = 0.0000
Factor loadings (pattern matrix) and unique variances
Variable
Factor
1
Factor
2
Factor
3
Factor
4
Factor
5
Factor
6
Factor
7
Uniquenes
s
Q4_CLARITY 0.750 0.366 -0.037 0.018 0.014 0.019 -0.111 0.290
Q5_CLARITY 0.619 0.533 -0.056 0.024 -0.029 0.086 -0.007 0.321
Q9_FAIR 0.664 0.349 0.127 -0.067 0.035 -0.016 0.039 0.413
Q10_QUOTA 0.692 -0.159 0.420 -0.001 0.014 0.039 -0.009 0.318
Q11-QUOTA 0.665 -0.223 0.386 -0.042 0.015 0.069 0.012 0.352
Q12_MONITOR 0.675 -0.025 0.251 -0.026 -0.018 -0.103 -0.040 0.468
Q16_MONITOR 0.634 -0.047 -0.040 0.224 0.145 0.013 0.021 0.523
Q17_PARTICIPAT 0.782 0.050 -0.007 0.028 -0.065 -0.138 -0.008 0.362
Q18_SANCTION 0.761 -0.203 -0.112 -0.013 -0.156 0.063 -0.010 0.339
Q19_PENALITY 0.731 -0.203 -0.127 0.246 -0.060 0.020 0.009 0.344
Q20_ALLOCATIO
N 0.653 0.215 -0.002 0.001 -0.039 -0.036 0.130 0.508
Q21_PENALITY 0.833 -0.082 -0.210 -0.144 0.080 0.022 0.024 0.227
Q22_PENALITY 0.817 -0.200 -0.227 -0.150 0.006 0.035 0.003 0.218
Q23_SANCTION 0.802 -0.219 -0.210 -0.039 0.067 -0.058 -0.033 0.254