COMMUNITY-BASED RANGELAND AND … based rangeland...Executive Summary CBRLM Sub-Activity Final...
150
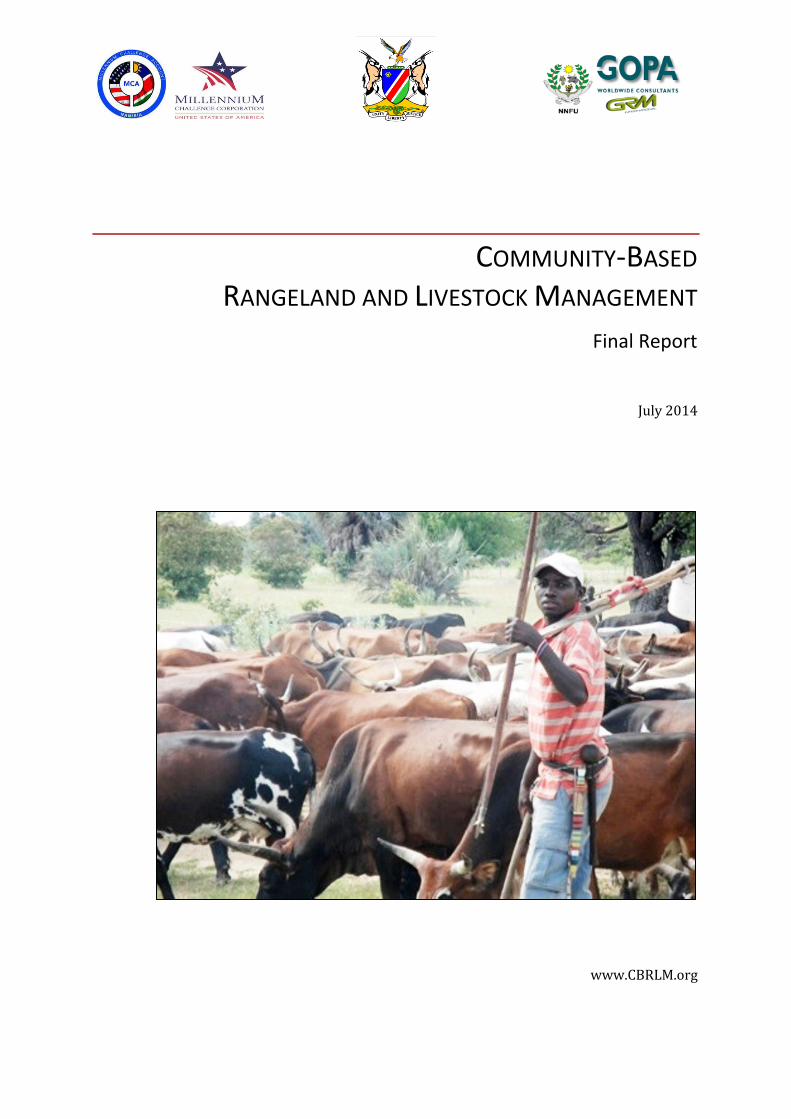
COMMUNITY-BASED RANGELAND AND LIVESTOCK MANAGEMENT Final Report July 2014 www.CBRLM.org
Transcript of COMMUNITY-BASED RANGELAND AND … based rangeland...Executive Summary CBRLM Sub-Activity Final...
COMMUNITY-BASED RANGELAND AND LIVESTOCK MANAGEMENT
Final Report
July 2014
www.CBRLM.org
GOPA Consultants Hindenburgring 18
61348 Bad Homburg Germany
Phone: +49-6172-930-0 Fax: +49-6172-930-100
Email: [email protected] www.gopa.de
CBRLM SUB-ACTIVITY FINAL REPORT July 2014
Community-Based Rangeland and Livestock Management Sub-Activity
www.CBRLM.org
implemented by GOPA Consultants
commissioned by the Millennium Challenge Account Namibia
with funding from the Millennium Challenge Corporation
Table of Contents CBRLM Sub-Activity Final Report
Page | iii
Contents
List of Acronyms ....................................................................................................................... v
Executive Summary ................................................................................................................ vii
1 Introduction ...................................................................................................................... 1
1.1 Rangeland and Livestock Situation in the NCAs ....................................................... 1
1.2 General Context of Rangeland and Livestock interventions .................................... 3
1.2.1 Previous Rangeland and Livestock Projects in the NCAs .................................. 5
1.3 The CBRLM Project ................................................................................................... 9
1.4 Report Outline ........................................................................................................ 13
2 Project Implementation ................................................................................................. 14
2.1 Implementation History ......................................................................................... 14
2.1.1 Original Terms of Reference and Underlying Assumptions ........................... 14
2.1.2 Evolution of Project Scope and Implementation ........................................... 15
2.1.3 GA-Level Activity............................................................................................. 19
2.2 CBRLM Project Components .................................................................................. 21
2.2.1 Rangeland Management ................................................................................ 21
2.2.2 Water Infrastructure Development ................................................................ 30
2.2.3 Community Development .............................................................................. 35
2.2.4 Training ........................................................................................................... 43
2.2.5 Livestock Management .................................................................................. 53
2.2.6 Marketing ....................................................................................................... 72
2.2.7 Public Outreach .............................................................................................. 77
2.3 Monitoring and Evaluation ..................................................................................... 80
2.3.1 Internal Monitoring ........................................................................................ 80
2.3.2 External Evaluation ......................................................................................... 87
3 End-Of-Project Status ..................................................................................................... 90
3.1 Output Indicators ................................................................................................... 90
3.2 Outcomes and Sustainability .................................................................................. 92
3.2.1 GA Performance ............................................................................................. 92
3.2.2 GA Sustainability ............................................................................................. 95
3.3 CBRLM Handover to MAWF ................................................................................... 98
3.4 Implementation Successes ..................................................................................... 99
Table of Contents CBRLM Sub-Activity Final Report
Page | iv
3.5 Implementation Challenges and Shortcomings ................................................... 102
4 Conclusions ................................................................................................................... 107
4.1 Lessons Learned ................................................................................................... 108
4.1.1 Implementer ................................................................................................. 108
4.1.2 Evaluator....................................................................................................... 109
4.1.3 Donor ............................................................................................................ 109
4.2 Recommendations ............................................................................................... 110
4.3 The Way Forward ................................................................................................. 111
References ............................................................................................................................ 115
Annex .................................................................................................................................... 117
A 1 CBRLM GA Performance and Sustainability ............................................................... 118
A 2 CBRLM Grazing Area Maps ................................................................................... 121
A 3 CBRLM In- and Outputs ........................................................................................ 125
A 3.1 Water Infrastructure ........................................................................................... 125
A 3.4 Training ................................................................................................................ 130
A 3.2 Rangeland ............................................................................................................ 131
A 3.3 GA Fund ............................................................................................................... 132
A 3.5 Livestock Management and Livestock Schemes ................................................. 133
A 4 CBRLM Deliverable Timetable .............................................................................. 139
A 5 CBRLM Stakeholders and Contact Details ............................................................ 140

List of Acronyms CBRLM Sub-Activity Final Report
Page | v
LIST OF ACRONYMS
ADC Agriculture Development Centre
AET Agriculture Extension Technician
CAHA Community Animal Health Assistant
CBRLM Community-Based Rangeland and Livestock Management
CLS Communal Land Support
CPP Country Pilot Partnership
DART Directorate of Agricultural Research and Training
DCD Division of Cooperative Development
DRFN Desert Research Foundation of Namibia
DVS Directorate of Veterinary Services
DWSSC Directorate of Water Supply and Sanitation Coordination
EDF European Development Fund
EU European Union
FF Field Facilitator
FIRM Forum for Integrated Resource Management
FMD Foot and Mouth Disease
FSP Farmer Support Program
GA Grazing Area
GALA Grazing Area Livestock Agent
GDP Gross Domestic Product
GIS Geographic Information System
GIZ Gesellschaft für Internationale Zusammenarbeit
GOPA Gesellschaft für Organisation, Planung und Ausbildung
GPS Global Positioning System
GRN Government of the Republic of Namibia
IFAD International Fund for Agricultural Development
IPA Innovations for Poverty Action
LCE Lund Consulting Engineers
LMC Livestock Marketing Cooperative
LMP Livestock Management Plan
LPF Livestock Producer Forum
M&E Monitoring and Evaluation
MCA-N Millennium Challenge Account Namibia
MCC Millennium Challenge Corporation
MLR Ministry of Lands and Resettlement
MoU Memorandum of Understanding
NASSP National Agricultural Support Services Project
NBC Namibia Broadcasting Corporation
List of Acronyms CBRLM Sub-Activity Final Report
Page | vi
NNFU Namibia National Farmer´s Union
NOLIDEP Northern Regions Livestock Development Project
NRM Natural Resource Management
NRMPS National Rangeland Management Policy and Strategy
NTA National Training Authority
OLDP Oshikoto Livestock Development Project
PGCH Planned Grazing and Combined Herding
RCT Randomised Controlled Trial
RIA Rangeland Intervention Area
SARDEP Sustainable Animal and Rangeland Development Project
SSPOS Small Stock Pass-On Scheme
SSSCF Small Stock Seed Capital Fund
TA Traditional Authority
ToR Terms of Reference
UNCCD United Nations Convention to Combat Desertification
VCF Veterinary Cordon Fence
Executive Summary CBRLM Sub-Activity Final Report
Page | vii
EXECUTIVE SUMMARY
The Community-Based Rangeland and Livestock Management Project (CBRLM) worked with
communal farmers to enhance the productivity and sustainability of the livestock sector in
the Northern Communal Areas (NCA) of Namibia through improved rangeland resource and
livestock management. The project was implemented by the Gesellschaft für Organisation,
Planung und Ausbildung (GOPA), commissioned by Millennium Challenge Account Namibia
(MCA-N) and funded by the Millennium Challenge Corporation (MCC). The project was a
sub-activity of MCA-N´s wider agriculture project.
The CBRLM project was launched in March 2010 and ended in July 2014. It worked with
communities in a total of 58 grazing areas across all regions of the NCAs except Zambezi
region. The project targeted the whole chain of livestock production from rangeland
management over livestock production management to livestock marketing. Improved
rangeland and livestock management would result in an increase in wealth from livestock
farming and was to be achieved through a series of interventions, including enhanced
community-based land use planning for rangelands, the introduction of technologies and
skills to improve grasses and thereby productivity of livestock, animal husbandry best
practices and improved entrepreneurial skills.
The present CBRLM final report aims at providing the reader with a clear understanding of
the main interventions introduced by the CBRLM project and how these interventions were
implemented. In addition, the intention is to provide a critical analysis of successes and
weaknesses of CBRLM implementation in order to draw out lessons for future related
initiatives in the Northern Communal Areas of Namibia.
The CBRLM project built on previous initiatives in the NCAs and was designed as a pilot
project to test innovative approaches to rangeland and livestock management. Project
implementation was organised in different components. The main feature that
distinguished the CBRLM project from major previous projects such as SARDEP and
NOLIDEP was the approach to rangeland management, which had been developed during a
previous initiative by the Namibian non-profit organisation Integrated Rural Development
and Nature Conservation in Kunene region. This approach promotes community-based
rangeland management through planned grazing and combined herding. A precondition for
the latter is the availability of adequate water delivery. The CBRLM project thus included a
large water infrastructure component, through which significant water infrastructure
improvements at 70 different sites were provided in the NCAs, including the provision of 39
new water points.
Mobilisation of communities and facilitation of community-based structures required for
improved rangeland and livestock management were streamlined in a community
development component. It introduced and supported community-based structures like
grazing area committees and corresponding management tools.
Executive Summary CBRLM Sub-Activity Final Report
Page | viii
Livestock management was organised in another component which next to intensive
training interventions at different levels mainly relied on adapted classic approaches like
refined community-based bull and small stock schemes.
Delivery of all 5 CBRLM components to the participating communities was accompanied by
a series of training sessions as well as continuous on-the-ground facilitation.
While all previous components took place essentially at the grazing area level, livestock
marketing rather took place at the regional level. It focussed on the establishment of and
support to six regional livestock marketing cooperatives as well as major initiatives to
explore livestock markets in Zimbabwe and Angola.
Through these implementation components, the CBRLM project managed to reach,
establish and deliver essential services to 58 community-managed “farms” across a vast
area in the NCAs. In terms of meeting its contractual obligations, the CBRLM project
successfully delivered all expected outputs and exceeded some of its contractual targets. A
few targets were not met entirely, but the achievements were only slightly below the
defined target value. In addition, most components in the original terms of reference were
significantly expanded in scope and cost and additional complementary (sub-) components
were added to enhance overall project performance.
The actual impact the CBRLM project had in the target communities with regards to its
declared objectives is to be determined by an external rigorous impact evaluation. The
findings of this external evaluation are expected in 2016.
Experience made during project implementation and information collected through internal
evaluations nevertheless allows the implementer to give some indications related to
project outcomes. Being a community-based project, CBRLM outcomes critically depend on
thorough buy-in, serious commitment and active participation by the target communities.
As such, the picture at project end is varying. According to an internal assessment (see
section 3.2.2), 26% of all 58 communities showed strong commitment and full participation
and were thus able to seriously implement CBRLM principles. These communities will likely
continue CBRLM activities in future with minimal support. Another 33% of all GA
communities were assessed to be able to reasonably implement CBRLM principles if given
substantial further support. The lowest 41% of all GA communities, however, were not
really convincing in their commitment and their ability to implement CBRLM. The reasons
for that are manifold and are described in detail in the full report. In general, CBRLM
experts agree that the behavioural change required cannot take place sustainably on a
large scale in a single project period where implementation time per GA community
averages less than two years, but is a process that needs to be supported over an extended
period of time. There is agreement that all communities need further external support to
varying degree in order to sustain and consolidate improved rangeland and livestock
management practices.
The CBRLM project has made considerable achievements at all stages of the livestock
production chain and initiated and furthered a concept that is in line with the National
Rangeland Management Policy and Strategy and – if pursued, supported and applied
Executive Summary CBRLM Sub-Activity Final Report
Page | ix
rigorously – might be a way for communal farmers to significantly increase the productivity
of both their rangeland and livestock while keeping them under communal management.
Based on lessons learned during CBRLM implementation, the implementer can make the
following main recommendations:
1. Continuation of support to grazing area communities is required. However, the
project should not be extended into other areas until such time as land rights
legislation is in place that enables communities to protect rangeland improvement
gains made within the boundary of their grazing area.
2. Legislation to enable the enforcement of grazing rules is required.
The establishment of group rights and local by-laws that can be enforced by
imposing fines is crucial to the success of the rangeland sector. Synergies with
Community Forests and Communal Conservancies need to be developed so that
management of these resources at various scales can be done effectively. An
integrated land use and development planning process would be recommendable
to undertake on the conservancy and community forest level. Here a co-operation
with the Ministry of Lands and Resettlement is crucial.
3. In order to implement CBRLM with combined herding and planned grazing in the
NCAs, it is necessary to invest substantially in the upgrading of water supply. In
order to avoid negative impacts through mismanagement, future water
infrastructure provision should entail dedicated livestock-only water points which
could be (temporarily) closed by the responsible entity in case of non-compliance
to management rules. Legislation could make sound rangeland management
compulsory and bring forward corresponding enforcement mechanisms.
4. In North Central and Eastern regions future interventions should recognize and
work with the mixed farming agricultural conditions of most communal farmers.
Working more consciously on the interface between crop and livestock production
poses opportunities for shorter term results (e.g. increased crop yield through the
use of temporary mobile kraals for crop field fertilisation) that can help to motivate
commitment to rangeland management strategies that produce outcomes over the
longer term.
5. Functioning institutions are critical for development. The established agricultural
cooperatives in the NCA need further support to become viable on their own and to
potentially play a role in the NCAs that is comparable to the role AGRA is playing in
Namibia south of the VCF. In this respect a continued partnership with
MAWF/Division of Cooperative Development (DCD)/DVS/DEES) is important.
6. The baseline rangeland monitoring sites that were established during the contract
are appropriate, easy to use and need to be expanded to new sites and existing
sites monitored for change over time.
7. Fire breaks that were established by over-trampling and overgrazing routes to and
from grazing areas seem to be effective in stopping fires according to reports from
the field. This practise needs to be further entrenched as does the development of
fire breaks at the regional, constituency and national level.
Introduction CBRLM Sub-Activity Final Report
Page | 1
1 INTRODUCTION
The Community-Based Rangeland and Livestock Management (CBRLM) Sub-Activity worked
with farmer communities in the Northern Communal Areas (NCA) of Namibia. The CBRLM
Sub-Activity was part of the Agriculture Project of the Millennium Challenge Account
Namibia (MCA-N) and will be referred to as “CBRLM project” throughout this report. The
following sections will put the CBRLM project into context. As a brief project rationale,
section 1.1 will describe the situation in the NCAs with regards to livestock farming and
highlight the main challenges associated with rangeland and livestock. Afterwards, the
CBRLM project, its approach and major implementation strategies will be introduced.
1.1 RANGELAND AND LIVESTOCK SITUATION IN THE NCAS
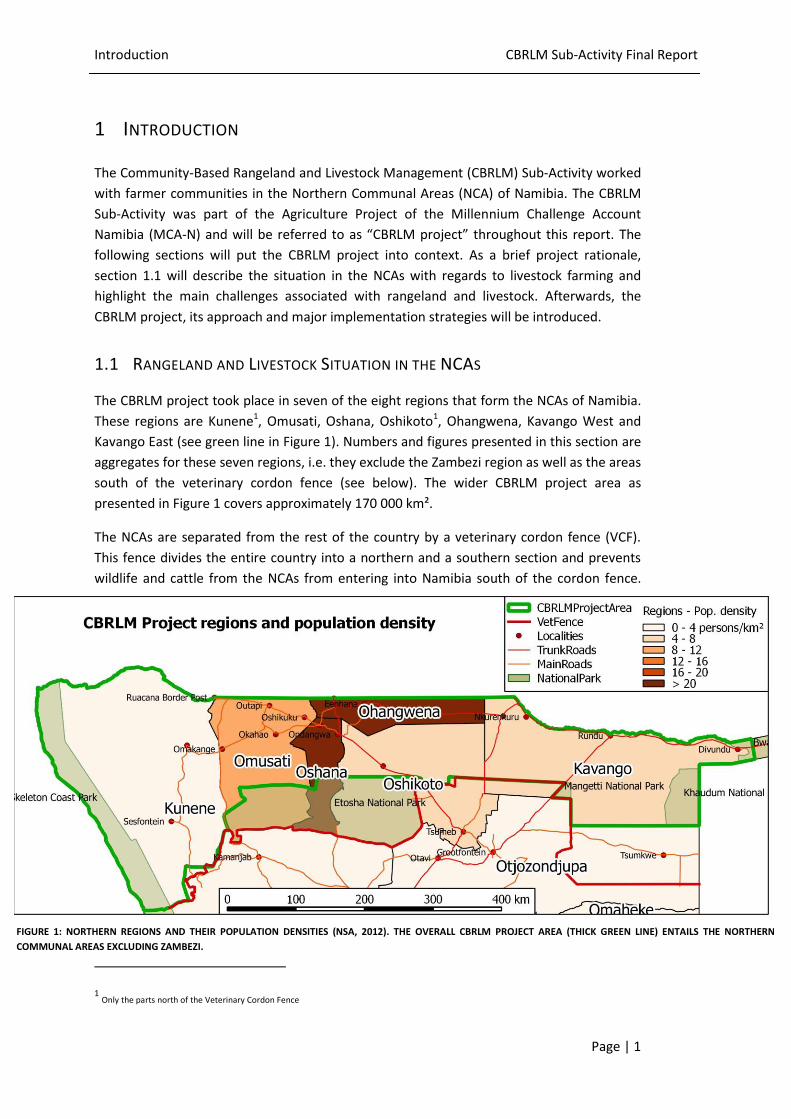
The CBRLM project took place in seven of the eight regions that form the NCAs of Namibia.
These regions are Kunene1, Omusati, Oshana, Oshikoto1, Ohangwena, Kavango West and
Kavango East (see green line in Figure 1). Numbers and figures presented in this section are
aggregates for these seven regions, i.e. they exclude the Zambezi region as well as the areas
south of the veterinary cordon fence (see below). The wider CBRLM project area as
presented in Figure 1 covers approximately 170 000 km².
The NCAs are separated from the rest of the country by a veterinary cordon fence (VCF).
This fence divides the entire country into a northern and a southern section and prevents
wildlife and cattle from the NCAs from entering into Namibia south of the cordon fence.
1 Only the parts north of the Veterinary Cordon Fence
FIGURE 1: NORTHERN REGIONS AND THEIR POPULATION DENSITIES (NSA, 2012). THE OVERALL CBRLM PROJECT AREA (THICK GREEN LINE) ENTAILS THE NORTHERN
COMMUNAL AREAS EXCLUDING ZAMBEZI.
Introduction CBRLM Sub-Activity Final Report
Page | 2
The VCF was erected due to a history of prevalence of foot and mouth disease (FMD) and
other bovine diseases in the NCAs, particularly in the north-eastern region of Zambezi
(formerly Caprivi). While nowadays only the Zambezi region is considered an FMD-infected
zone, all other regions north of the VCF rather constitute a buffer zone between areas
south of the VCF and the high-FMD-risk associated with Angola (Thomson & Venter, 2012).
The NCAs accommodate 1.2 million of Namibia´s 2.1 million inhabitants (55%). This makes
the NCAs Namibia’s most densely populated part (with the exception of Kunene region)
with an overall average population density of 4.8 persons/km² as compared to the national
average of 2.6 persons/km². Particularly, the central northern regions are very densely
populated compared to the rest of the country (Mendelsohn, Jarvis, Roberts, & Robertson,
2002). According to the latest population and housing census carried out in 2011 by the
Namibia Statistics Agency (NSA, 2012), there are 220 000 households located in the NCAs.
80% of these households are located in rural areas (national average: 57%).
Livestock and crop farming constitutes the main source of income for 28% of households in
the NCAs (national average 16%). Another 28% draw their main income from wages and
salaries (national average 48%). In addition, 22% (national average 15%) indicated that their
main source of income is pension, 12% (national average 12%) is from non-farming business
and 5% (national average 5%) from cash remittances (NSA, 2012).
According to livestock data captured by the Directory of Veterinary Services (DVS) through
tagging campaigns between 2011 and 2013 (Directorate of Veterinary Services, 2014), there
are more than 1.4 million cattle in the part of the NCAs that was targeted by CBRLM. While
this figure corresponds to about half the cattle in Namibia, this area covers only slightly
more than 20% of the total area of Namibia. According to the World Bank, 47% of
Namibia´s land area is agricultural land, i.e. land that is arable, under permanent crops or
under permanent pasture. The non-title deed areas or communal areas constitute 31.8% of
the agricultural land in Namibia (Land, Environment and Development (LEAD) Project,
2005). The figure for the CBRLM project area is below that, since Zambezi region and other
communal areas outside the NCAs were not targeted by the project. It is estimated that
between 20% and 25% of Namibia's total agricultural land lie in the CBRLM project area (or
about 80,000 km² – 100,000 km²). In turn, this means that the 18 CBRLM rangeland
intervention areas (total 18,000 km²) cover about 20% of the agricultural land in the wider
project area.
Most of the land in the NCAs is under communal management, meaning that the land is
owned by the state and people only have use rights over the land. In theory, this setting
allows everyone in the community to access and use the common land and offers good
opportunities for transhumance to mitigate climatic variability. In practice, however, factors
like population pressure, sedentarisation, illegal fencing as well as the prevailing farming
mentality have undermined these benefits (Matambo & Seely) and led to a situation often
termed a typical “tragedy-of-the-commons” problem. This situation is characterised by
overutilisation and degradation of the common rangeland resource. A major contributor to
rangeland degradation in the NCAs is uncontrolled- and over-grazing by livestock. However,
note that there is no evidence that the communal land use system per se is a root cause of
land degradation. In Namibia, land degradation is not limited to the NCAs, but also takes
Introduction CBRLM Sub-Activity Final Report
Page | 3
place on the commercial privately-owned farms south of the VCF. The CBRLM approach is
built on the assumption that if communal farmers change their ways and practices
regarding rangeland and livestock management, there will be a reversal of recurrent
rangeland degradation and a sustainable increase in productivity of both the rangeland and
livestock.
A study funded by MCC found that the Namibian agricultural sector supports some 70% of
the population directly or indirectly through income and employment (Millenium Challenge
Corporation, 2008). Still, according to data published by the Namibia Statistics Agency on its
website (Namibia Statistics Agency, 2014), the agricultural sector contributed only 5.1%
(livestock farming 3.5%) to the overall GDP in 2012. In a speech delivered in 2011, the
Namibian Minister of Agriculture, Honourable John Mutorwa, said by citing the National
Development Plan 4 that “the livestock production accounts for about 76% contribution to
overall agricultural output value of which 70% is from the commercial areas and 6% from
communal areas.”(MAWF, 2012). These figures suggest that, while the NCAs accommodate
the country’s biggest populations of humans and livestock, the economical benefits from
NCA livestock are disproportionately low.
Together with the arid climatic conditions (Namibia is the most arid African country south
of the Sahel), a feature of which are recurrent droughts, the above factors have brought
communal livestock farmers in the NCAs into a precarious situation with regards to both
the condition of the rangeland and the productivity and profitability of livestock farming.
The CBRLM project has been addressing these grievances by promoting and facilitating
sound management of the whole chain of livestock production, ranging from the
sustainable management of the rangeland resource to herd health and production
management for improved productivity and the creation and reinforcement of livestock
marketing structures in the NCAs.
1.2 GENERAL CONTEXT OF RANGELAND AND LIVESTOCK INTERVENTIONS
The historical experience of livestock and rangeland development interventions in Africa
has been dismal (Roe, 1989). By 1990, there was a general consensus among scientists,
economists, anthropologists, governments and international agencies that, over the
previous thirty years, projects aimed at improving livestock productivity and arresting land
degradation had mostly failed (World Bank, 1987). This failure was so widespread that
major development agencies were by then contemplating withdrawal from the African
livestock sector all-together (Janke, 1982).
The conventional livestock and rangeland project in Sub-Saharan Africa had the following
typical features. The project was typically staffed by a team of technical assistance experts,
often expatriate and including a range ecologist, an animal production specialist, and
smallstock and water development specialists thrown in for good measure. The
intervention “carrots” were livestock husbandry training, improved livestock prices,
improved marketing, water infrastructure and sometimes ranch development credit. The
“stick” was the threat of destocking in order to conform to an identified carrying capacity.
One development expert commented that the failed US$600 million of aid invested in

Introduction CBRLM Sub-Activity Final Report
Page | 4
livestock projects in Africa between 1965 and 1980 was clearly far ahead of the basic
science and applied knowledge base (Eicher, 1985).
In response to this dearth of knowledge, the United Nations Convention to Combat
Desertification (UNCCD) set up information networks in 1994 with the overall goal to
identify proven and accepted natural resources management practices for sustaining
human livelihoods. One of these networks focused on rangeland and was given the title:
“Rational use of rangelands and promotion of fodder crops”.
In a review of the findings of this network it was concluded that the conventional “carrying
capacity” model, based on an equilibrium ecological view where potential carrying capacity
can be predicted, was being challenged by a new model of range ecology (Nouala, 2012).
This new model or ‘new range ecology’ asserts that most rangelands in Africa are in non-
equilibrium environments, characterized by fluctuations in climatic parameters such as
rainfall and the associated fluctuations in plant biomass. Thus the aim of non-equilibrium
rangeland management is to support the ability of livestock farmers to respond to their
unpredictable environments.
The cornerstone of this approach is participation by target populations. Participation
facilitates accurate understanding of problems and their nature leading to collective action
that is better informed (Holmes-Watts & Watts, 2008). Active participation of pastoralists
and agro-pastoralists was seen to be essential in sustaining rangeland management and
improvement. This led to increasing interest in community-based approaches to the
management of natural resources in Africa (Fortmann.et.al., 2001) (Guyo.et.al., 2003).
A number of lessons have been distilled from the experience of community-based
approaches to date:
For the community-based approach to be successful, it must be demand-driven,
socially acceptable and create an enabling policy and institutional environment.
The inclusion of the poor requires very careful project planning and design. It has
been observed that local associations and cooperatives tend to be dominated by
the richer members of the community and this can further promote inequality
rather than equity.
Active participation in decision making, planning and implementation is rarely
achieved even where it is explicitly outlined in the project design.
Promotion of effective learning and exchange of information and experiences on
good practices is an important strategy in promoting uptake of best practices, e.g.
pastoralist to pastoralist information exchange.
Successful local-level management of natural resources requires investment in
community-level capacity building and empowerment in the areas of organization,
financial management and NRM. Experience shows that this usually requires more
time than is provided by most projects.
Introduction CBRLM Sub-Activity Final Report
Page | 5
1.2.1 PREVIOUS RANGELAND AND LIVESTOCK PROJECTS IN THE NCAS
1.2.1.1 SARDEP
The first livestock and rangeland project in Namibia after independence was the
Sustainable Animal and Rangeland Development Project (SARDEP). SARDEP was a 13-year
(1991-2004) German-funded rangeland development project implemented by GIZ (then
GTZ) under the auspices of MAWF (MAWRD at that time). It was implemented in pilot areas
which had up to three test areas and was strictly community-based. SARDEP had local
committees that encouraged and motivated communities to adopt sustainable livestock
and rangeland principles. The project was implemented in communal areas both north and
south of the VCF.
The SARDEP project focused on community development, women empowerment, capacity
building in MAWF, capacity building of SARDEP staff, sound documentation of project
principles, the concept of commercial farmers supporting communal farmers, national
policy and strategy development, demand-driven service delivery, rangeland management
and animal husbandry, project integration into DEES and farmers’ access to credit.
The characteristic of this project was that it was grounded in the conventional “carrying
capacity” model from a technical perspective. However, it embraced the “participatory”
approach to a greater extent than had been done in the past. Thus, community meetings
were held to discuss rangeland management options. Committees were formed to
implement the management regimes decided on. Field facilitators worked with the local
communities to support implementation of the rangeland management plans. These plans
were essentially based on the “carrying capacity” model, although incorporating concepts
of rotational grazing and resting.
1.2.1.2 NOLIDEP
The second major livestock project in the north of Namibia was the Northern Regions
Livestock Development Project (NOLIDEP). NOLIDEP was one of the first to be implemented
by MAWF (then MAWRD) with external donor support. The project was jointly financed by
the Namibian government (GRN), an IFAD loan, the Belgian Survival Fund grant and a
Luxembourg government grant with a total volume of US$ 15.5 million. Inception of project
activities was in May 1995 and the project closed in December 2003.
The project worked across the then seven northern regions. Its objective was to improve
the economic and social well-being of the rural population of the NCAs through the
promotion of increased livestock production, greater productivity and off-take, while
ensuring the development of a more sustainable range management system. The strategy
for supporting sustainable rangeland development in the communal areas was to focus on
achieving a better balance between livestock numbers and the availability of grazing
through an extension of access to grazing into under-utilised areas based on water point
development and the encouragement of community-based grazing management. This was
to involve: (i) provision of water infrastructure with a 10% cost contribution from the
community, (ii) training farmers to adopt environmentally sound range management
practices and to control stocking rates, (iii) promoting community-based organisations
which would develop the framework for providing essential services, notably extension and
Introduction CBRLM Sub-Activity Final Report
Page | 6
credit; and (iv) strengthening the institutional and policy framework for the sustainable
development of the NCAs. Subsequently, some two years after inception, the project
underwent a major reformulation. The main changes were to introduce more participatory
methodologies, increase the emphasis on farmer and staff training and to respond to the
development challenge in the NCA through two distinct phases of implementation. The
First (Pilot) Phase aimed to: (i) develop and test participatory methodologies in about 20
communities that had already become associated with the project; and (ii) fully integrate
the project within the line administration of MAWF.
The major findings from an interim evaluation of NOLIDEP in 2001 (IFAD, 2002) were
summarised as follows:
Despite [...] gains, there are doubts about the replicability of activities in a larger number of
communities across a wider geographic area through operational procedures that place
heavy reliance on MAWF implementation capacity and budgetary resources. Likewise, the
benefits secured over the short-term through several of the project’s interventions call for
complementary strengthening in order to ensure sustainability. For example, there are
dangers of negative environmental effects in the vicinity of water points in the absence of
parallel attention being given to systems of livestock management. Similarly, short-term
gains from the expanded ownership of animals under the SSSCF [Small Stock Seed Capital
Fund] may be in jeopardy as a result of inadequate attention to aspects of animal
husbandry and health care, both prior to and after the introduction of animals.
The key lessons from the implementation of NOLIDEP include (IFAD, 2002):
a) the need to give adequate emphasis, time and resources to the community
mobilisation process, which should not be compromised by aspirations to meet pre-
set physical targets and/or to speed up project fund disbursement rates. A longer-
term, programme perspective would be beneficial for future investments operating
in a similar context;
b) that poorer members of rural society can be reached through specifically designed
and targeted measures and need not rely entirely on a ‘trickle down’ effect or
gaining benefit along with the rest of their community in initiatives directed
towards the community as a whole;
c) that project objectives and anticipated outputs should be realistically set in relation
to: the operational context; aspects that the project as designed (i.e. its components
and activities) can be expected to influence; the resources available (human and
financial); and the time allocated;
d) the constraints, in terms of project performance and effectiveness, that can arise for
want of adequate implementation guidelines as an aid to maintaining focus on
project aims and directives and measuring project impact in relation to stated
outputs and objectives. In the case of NOLIDEP, the lack of formal guidelines caused
insufficient attention to be given to achieving the intended complementarity and
potential synergy between components;
e) the benefits to be derived from operational collaboration between MAWF and other
development partners and the scope which exists to build on and expand such
initiatives in the future; and
Introduction CBRLM Sub-Activity Final Report
Page | 7
f) the importance of fostering a common understanding and interpretation of
underlying development themes and principles at policy and implementation levels
among project/programme stakeholders if frustrations and false expectations
during implementation are to be avoided.
1.2.1.3 OLDP
A more recent project is the Oshikoto Livestock Development Project (OLDP) implemented
under the National Agricultural Support Services Project (NASSP). OLDP was implemented
between 2004 and 2006. The implementation strategy was built on existing structures in
each of the nine constituencies in the region, i.e. farmers associations or cooperatives. In
each of the selected community structures, the FIRM (Forum for Integrated Resource
Management) approach was established. In this approach farmers were trained to identify
and express their own needs and they were empowered to convey and negotiate these
needs to service providers as well as to higher authorities. OLDP was implemented by
various role players under NASSP namely:
The Desert Research Foundation of Namibia (DRFN) (as a contracting partner for
OLDP),
the Directorate of Veterinary Services (DVS) (Partner institution: OLDP and
NamlLITS)
The Directorate of Extension Services (DEES) (Partner institution: OLDP) and the
Meat Board of Namibia (Implementing agent for the Bull scheme).
They were supported by the Directorate Agricultural Research and Training (DART)
(Partner institution: OLDP) and Meatco (Voluntary partner; Marketing).
One component of OLDP was livestock distribution to stockless farmers. The livestock
distribution component was implemented by DRFN. Each of 63 recipients received either 4
heifers or 50 goats. Following from the NOLIDEP experience it was initially planned for
recipients to contribute 10% of the cost of the livestock. Instead of taking the 10%
contribution, OLDP returned it to the beneficiaries with the express stipulation that it be
used to care for the animals, including buying medicine where needed. At the same time
veterinary kits containing the most relevant drugs were distributed to animal health
workers. Farmers were trained in all aspects of animal husbandry and health. Unlike
NOLIDEP, there was no expectation that beneficiaries would pass on livestock to other
community members when their herds expanded.
1.2.1.4 IRDNC
Integrated Rural Development and Nature Conservation (IRDNC) has operated in the
Kunene Region since the early 1980’s. Its focus was primarily wildlife and tourism and it was
a key player working together with the MET to pioneer the Communal Conservancy
Program. In 2003, funds were raised to expand these activities into the rangeland sector as
this was seen as a major factor that conservancy residents depended on for the future of
wildlife, tourism as well as their main livelihood activity, namely livestock.
A Holistic Rangeland Management (HRM) pilot project was developed and implemented
initially in the northwest and later the north east of Namibia. The focus was largely
improved rangeland management. The project was conducted in partnership with MAWF.

Introduction CBRLM Sub-Activity Final Report
Page | 8
Exchange visits were conducted to South Africa and Zimbabwe to learn from farmers who
had applied sound management that had resulted in doubling or tripling the recommended
stocking rate over time whilst making good profits.
Influential local farmers from target grazing areas as well as women, traditional authorities
and herders and support staff visited these farms and were exposed to key principles and
learnt lessons from these farmers. On their return, grazing area meetings were held with all
livestock owners and stakeholders to discuss the findings of the trip and plan their
responses to these principles. From this process the concept of planned grazing and
combined herding was developed.
IRDNC raised funds for water provision and more than ten boreholes were drilled and water
points upgraded to enable improved grazing management as well as improved flow of
water to troughs. This enabled livestock to walk shorter distances each day, thereby
improving body condition score as well as enabling livestock to spend more time grazing
before being kraaled each night. This had the added benefit of reducing losses of livestock
to theft and predators. The problem of grass poaching from outside grazing areas that were
not herding was experienced. In response, famers impounded livestock wandering around
and added them to their herd. The owners were informed and the livestock would be
collected.
Before CBRLM started there were more than 12 active GAs in Kunene region alone. The
IRDNC HRM project was a precursor of the CBRLM project, and IRDNC provided significant
support to the MCA-CBRLM sub activity by dedicating staff and vehicles to work in all six
target regions for the period of the compact. One grazing area, in particular, was used as a
training ground for all GOPA support staff, including experts. More than a dozen exchange
visits were hosted by IRDNC at the Erora GA to train farmers, herders and senior decision-
makers from other regions. This process of exchange visits sped up the process of learning
and adoption by communal farmers who were sharing their experience and benefits.
1.2.1.5 RELEVANCE OF PRIOR EXPERIENCES FOR CBRLM
The point of the above review of past experiences with livestock and rangeland
development projects internationally and within Namibia is to summarise what is already
known. This is important for two reasons:
1) To build on previous experience and move forward into new areas of work and
knowledge
2) To be able to assess the extent to which the lessons from the CBRLM experience
add new insight or merely reinforce lessons gained from previous experience.
We can be clear that the CBRLM concept does embrace the “new range ecology” paradigm
and moves away from the conventional “carrying capacity” model. In this respect, it is
building on work of IRDNC in Kunene Region and breaking new ground in relation to
livestock and rangeland development projects in the other NCAs regions. The previous
projects of SARDEP, NOLIDEP and OLDP all had involved the alignment of stocking rates to
carrying capacity as the major strategy for achieving sustainable range management.
Instead, the CBRLM message and promise was that appropriate grazing planning can enable
more grass to be grown. Potentially then, all lessons in this area are likely to generate new
Introduction CBRLM Sub-Activity Final Report
Page | 9
knowledge and experience. The legitimate knowledge question here is: “Does this approach
work in practice in the Northern Communal Areas of Namibia?”
The CBRLM approach also necessitated the adoption of participatory methods of working
with communities. As we have seen, this is an important element of the new range ecology
model. However, it is not new to livestock development projects in the NCAs. Both SARDEP
and NOLIDEP used community-based approaches. NOLIDEP’s community participation was
around the management of new infrastructure (water points, crush pens), while SARDEP’s
community participation was more related to planning and implementation of herd and
range management. New lessons to be learned here will be related to comparing the
effects of differences in methods of mobilisation and engagement between the community
and the project. The legitimate knowledge question here is: “Has community participation
been facilitated differently than before and, if so, have these differences improved
outcomes?”
Most of the other components of the CBRLM project are not different either from the old-
style livestock projects in Sub-Saharan Africa of the 1960’s to 1990’s, or from the
predecessor projects in Namibia. The provision of water facilities, technical livestock
husbandry training, provision of vet kits, bull schemes, goat distribution schemes,
promotion of auctions, work with cooperatives have all been implemented before. The new
lessons to be drawn out here are in relation to how the context in which they have been
delivered differs from previous projects. The legitimate knowledge question here is: “Has
the context in which these conventional interventions were delivered resulted in better or
different outcomes?”
1.3 THE CBRLM PROJECT
The Community Based Rangeland and Livestock Management (CBRLM) project, which was
launched in 2010 and came to an end in July 2014, had the overarching goal of improving
quality of life in the Northern Communal Areas (NCA) of Namibia through the promotion of
sustainable management of rangeland and livestock. The CBRLM project was implemented
by the Gesellschaft für Organisation, Planung und Ausbildung (GOPA), commissioned by
Millennium Challenge Account Namibia (MCA-N) and funded by the Millennium Challenge
Corporation (MCC). The CBRLM project was a sub-activity of MCA-N’s wider Agriculture
Project.
The project worked in project implementation areas which throughout this report will be
referred to as grazing areas (GAs). While communities were mobilised to participate in the
project in almost a hundred GAs, 58 GA communities participated actively and received
substantial implementation2. The GAs are dispersed over the six northern regions of
2 The final set of GAs that was agreed upon in late 2012 to receive substantial implementation comprised 58 GAs. After an internal evaluation of
GA performance in late 2013, it was decided in February 2014 to discard for the final implementation months two GAs that were showing
insufficient commitment and performance. While the latest CBRLM quarterly report thus refers to 56 GAs, it was decided to report on the full
set of 58 GAs in this final report.
Introduction CBRLM Sub-Activity Final Report
Page | 10
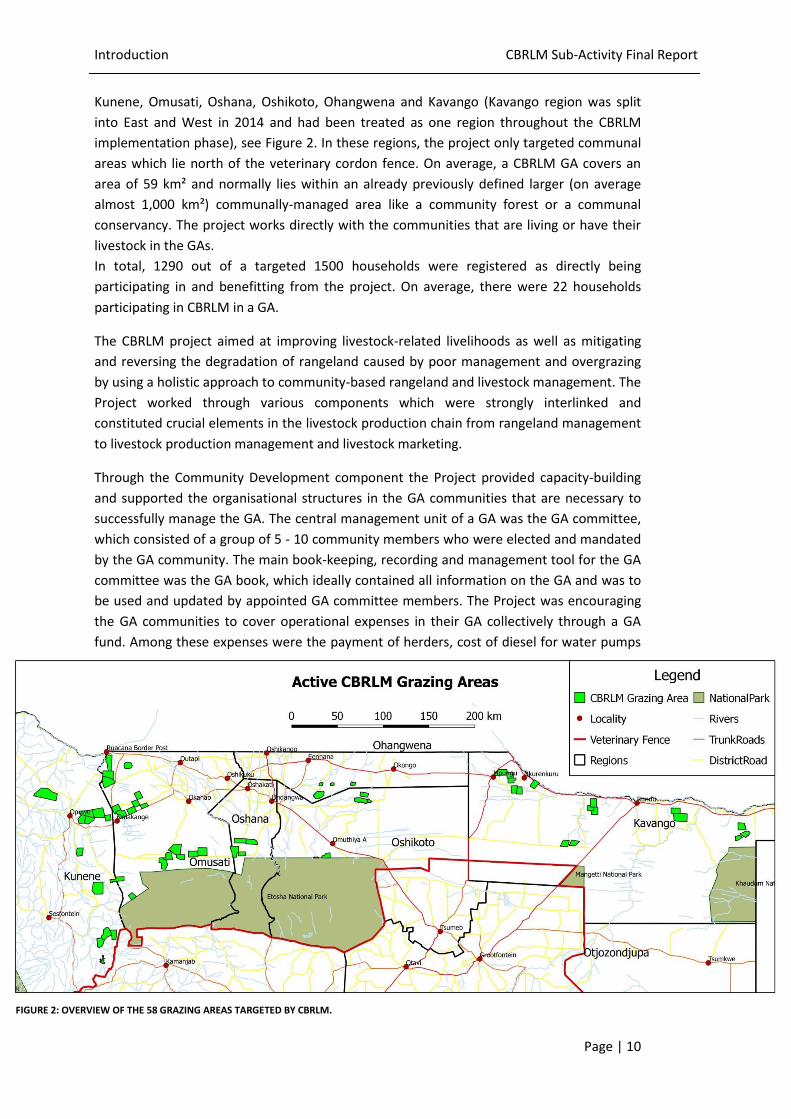
Kunene, Omusati, Oshana, Oshikoto, Ohangwena and Kavango (Kavango region was split
into East and West in 2014 and had been treated as one region throughout the CBRLM
implementation phase), see Figure 2. In these regions, the project only targeted communal
areas which lie north of the veterinary cordon fence. On average, a CBRLM GA covers an
area of 59 km² and normally lies within an already previously defined larger (on average
almost 1,000 km²) communally-managed area like a community forest or a communal
conservancy. The project works directly with the communities that are living or have their
livestock in the GAs.
In total, 1290 out of a targeted 1500 households were registered as directly being
participating in and benefitting from the project. On average, there were 22 households
participating in CBRLM in a GA.
The CBRLM project aimed at improving livestock-related livelihoods as well as mitigating
and reversing the degradation of rangeland caused by poor management and overgrazing
by using a holistic approach to community-based rangeland and livestock management. The
Project worked through various components which were strongly interlinked and
constituted crucial elements in the livestock production chain from rangeland management
to livestock production management and livestock marketing.
Through the Community Development component the Project provided capacity-building
and supported the organisational structures in the GA communities that are necessary to
successfully manage the GA. The central management unit of a GA was the GA committee,
which consisted of a group of 5 - 10 community members who were elected and mandated
by the GA community. The main book-keeping, recording and management tool for the GA
committee was the GA book, which ideally contained all information on the GA and was to
be used and updated by appointed GA committee members. The Project was encouraging
the GA communities to cover operational expenses in their GA collectively through a GA
fund. Among these expenses were the payment of herders, cost of diesel for water pumps
FIGURE 2: OVERVIEW OF THE 58 GRAZING AREAS TARGETED BY CBRLM.
Introduction CBRLM Sub-Activity Final Report
Page | 11
and maintenance of water infrastructure, financing of collective livestock vaccination
campaigns and any other collective expenses that would support the operation of the GA.
The Project supported every GA fund with a matched subsidy, i.e. for every dollar the
community raised for its GA fund, the Project would pay another dollar into the GA
community’s bank account. The matched subsidy was limited by a ceiling amount which
was determined by the estimated number of livestock in a GA. The GA fund was managed
by GA committee members.
The CBRLM Rangeland component promoted and facilitated sound rangeland management
in the GAs. The approach was based on the rangeland principles included in the National
Rangeland Management Policy and Strategy (NRMPS). Farmers were exposed to the
principles of sound rangeland management and solutions sought to apply these. This new
knowledge enabled farmers to understand the root cause of rangeland degradation, obtain
an understanding of the needs of plants and the soil surface and based on this take action
to reverse this degradation. Most farmers opted for planned grazing and combined herding
(PGCH). Participating livestock owners were encouraged to combine their individual
livestock (herding their individual herds as one big herd) and herd them daily according to a
grazing plan. The idea is that in the non-growing season combined herding treats and
prepares the soil for the upcoming growing season by breaking soil capping and increasing
soil cover. By doing planned grazing, over-grazing as well as over-rest of the grasses can be
avoided. During the growing season the grass is given the time necessary to recover from
grazing. Furthermore, combining livestock into one herd improves exposure of cows to
bulls and hence the pregnancy and calving rates of the entire herd. Finally, if the livestock is
being attended continuously by herders, livestock loss due to theft or predators is reduced
significantly. Grazing plans were developed by technical staff together with farmers,
herders and GA committees. Field staff then supported the GA to apply the principles of
sound rangeland management and follow the grazing plan. The Project facilitated the
development and updating of this grazing plan in a participatory way and provided
corresponding map material.
The Livestock component aimed at the improvement of livestock management, health,
production and productivity by building capacity regarding livestock husbandry as well as
optimising the herd structure and genetic material of the combined herds in the GAs. The
latter was supported by the bull scheme, through which the CBRLM Project offered the GA
communities the opportunity to collectively buy certified breeding bulls at a subsidised
price. The GA communities were to repay the bulls either in cash or in kind by giving goats.
The goats collected in this process fed into the “Small Stock Pass-On Scheme” (SSPOS),
through which disadvantaged and vulnerable GA households selected by the respective GA
communities were provided with goats and hence turned into livestock owners. In order to
reduce herder turnover, herders who did not own livestock were also among the preferred
SSPOS beneficiaries.
Through the Water Infrastructure component, the Project provided or upgraded water
infrastructure at a total of 70 sites in the NCAs. The rationale for this component was to
ensure that every active GA would have access to a water point which provides water at a
rate which is sufficient for the entire combined herd to be watered within as short a space
of time as possible. This was considered a precondition for the feasibility of combined
Introduction CBRLM Sub-Activity Final Report
Page | 12
herding as it would maximise the time spent by the herd grazing in a combined manner.
Furthermore, improved water distribution decreases distances covered per day by the
animals and thus an improved animal body condition. Water infrastructure improvement
ranged from minor upgrades like water tanks and drinking troughs to the installation of
diesel and solar pump systems as well as to the drilling and installation of boreholes, the
construction of pipelines, deep wells and and even a large earth dam.
Finally, the CBRLM Marketing component aimed at the improvement of livestock marketing
in the Northern Communal Areas. While livestock farmers at the GA-level would be
particularly sensitised towards marketing needs and opportunities, this component
essentially took place at the regional level. CBRLM facilitated the formation of regional
livestock marketing cooperatives in all six project regions and supported these cooperatives
financially and through capacity building. With support from the Project, these cooperatives
have been organising numerous livestock auctions throughout the Northern Communal
Areas. Between March 2013 and March 2014 alone, the cooperatives organised 71
livestock auctions.
The CBRLM main office was located in Oshakati, Oshana region. Routine GA-level field work
was carried out by CBRLM field facilitators (FF) who were clustered in four regional teams.
Regional offices were located in Opuwo (responsible for Kunene region), Outapi (Omusati
and Oshana regions), Onhuno (Oshikoto and Ohangwena regions) and Rundu (Kavango East
and West). Component-specific GA-level trainings, capacity-building workshops and other
services were carried out and supported by the CBRLM component leaders and other
experts.
For further reading with regards to the CBRLM approach and concept, please visit
www.cbrlm.org 3.
³For detailed information on the CBRLM approach download the “Background CBRLM Reader” at http://www.cbrlm.org/content/skills-
infrastructure/trainingdocumentation
Introduction CBRLM Sub-Activity Final Report
Page | 13
1.4 REPORT OUTLINE
This report constitutes the final contractual deliverable by the implementer of the CBRLM
sub-activity, GOPA Consultants. The goal of the report is not only to provide an overview of
what has been done and how it has been implemented, but also – even more importantly –
to draw lessons learned from the project in order to formulate recommendations for
policy-makers and future implementers of similar initiatives.
Section 2 of the report will describe in detail the implementation of the CBRLM project. In
subsection 2.1, the implementation history of the project will be recalled, which saw
considerable changes to both the contractual framework as well as the scope of
implementation during its 4-year implementation period.
After that, the section will give the reader an insight into what has been implemented
during CBRLM, for what reasons it has been done and how it has been done. For every
CBRLM component, the respective rationale and implementation strategies will be
presented.
Section 3 will summarize the implementation status and overall situation at the end of the
project. It will start by presenting the end-of-project status measured against contractual
monitoring indicators, i.e. project outputs. Subsequently, the section will discuss issues
related to project outcomes and sustainability, based on internal monitoring information
and the outcomes of an internal evaluation exercise. Subsequently, specific implementation
strategies that were either particularly successful or challenging will be identified.
Based on the experiences made by the implementer during CBRLM implementation,
Section 4 will attempt to provide the lessons drawn from CBRLM as a range of clear
recommendations to stakeholders of potential future projects similar to CBRLM. The
section will conclude by outlining the immediate way forward and formulating the major
principles that should be guiding future initiatives.
Comprehensive GA-specific information will be provided in the report annex.
Project Implementation CBRLM Sub-Activity Final Report
Page | 14
2 PROJECT IMPLEMENTATION
This section will present in detail the implementation of the CBRLM project. Section 2.1 will
recall the history of alterations and adjustments with regards to the scope, strategies and
intensity of implementation throughout the course of the CBRLM project. Subsequently, for
every CBRLM component, the respective rationale and implementation strategies will be
presented.
2.1 IMPLEMENTATION HISTORY
2.1.1 ORIGINAL TERMS OF REFERENCE AND UNDERLYING ASSUMPTIONS
According to the Terms of Reference (ToR), the overarching goal of the CBRLM activity was
to enhance the productivity and sustainability of the livestock sector in the NCAs through
improved rangeland resource and livestock management that would result in an increase in
income from livestock farming. Improved rangeland and livestock management would be
achieved through a series of interventions, including enhanced community-based rangeland
use planning, the introduction of technologies and skills to improve grasses and thereby
productivity of livestock, animal husbandry best practices, and improved entrepreneurial
skills.
The CBRLM objectives would be achieved based on the following key actions to be
conducted by the implementer:
INCREASING HOUSEHOLD INCOME FOR THE SELECTED COMMUNITIES, WITH A SPECIFIC FOCUS ON:
Improving the rangeland and livestock management practises of the targeted
communities through an integrated support system comprised of land tenure
security, land use planning, infrastructure support and capacity building. To that
end, the Consultant4 will be required to enhance the productivity and sustainability
of land-based resources in the NCAs through the introduction and implementation
of community-based rangeland and livestock management practices.
Raising the livestock-related income in the targeted communities, by maximizing
the value of the livestock in a sustainable manner, adopting strategies to stop and
reverse the resource depletion currently underway, and maintaining stocking levels
that are appropriate to the existing grazing and water supplies.
BUILDING CAPACITY TO IMPROVE RANGELAND AND LIVESTOCK OUTCOMES, WITH A SPECIFIC
FOCUS ON:
Strengthening the transfer of natural resources management (NRM) from the
Traditional Authorities and Land Boards to NCA communities. Such a transfer is
based on authorizing local communities to implement the CBRLM process and
4 Referred to throughout this report as “the implementer”.
Project Implementation CBRLM Sub-Activity Final Report
Page | 15
move towards sustainable communal management of rangeland and livestock
resources. The process of seeking this authorization will also motivate the
community to define or strengthen its organizational structure, which should be
based upon democratically chosen leadership that can work in a consultative
manner to arrive at consensus regarding use of communal resources.
Developing a Grazing Plan, a key step in the CBRLM process that includes all
community stakeholders. The plan will incorporate actions that identify land uses,
communally managed natural resources and infrastructure, and infrastructure
needs. The result will be a practical road map that empowers communities to utilize
and manage their resources - rangeland, water and livestock in the NCA - as well as
interface effectively and sustainably with other land uses.
Implementing the rangeland, livestock and business management programmes and
developing the institutional capacity within the communities to determine the
“rules of the game” and ensure compliance by all users.
Facilitating the formation of a rangeland management committee to effectively
manage access and use of rangeland.
Providing the necessary technical capacity and supporting infrastructure such as
boreholes, crush pens or loading ramps.
Providing technical assistance and training in the three core areas of rangeland
management, livestock improvement and business and marketing skills
development to facilitate the transfer of skills and knowledge to improve rangeland
and livestock productivity of community members.
Supporting the transfer of knowledge between communities via farmer exchange
visits and related training actions focused on skills development.
The CBRLM strategic framework will serve as a way for households, communities and
regions to gain control of and manage their rangeland, water and livestock resources in
ways that allow them to produce a sustainable income. CBRLM is based on the principle of
empowering people to manage the natural and material resources that are critical to their
community and regional success, combined with increased capacity and expertise in natural
resource management, and viable alternatives to uncontrolled resource depletion. CBRLM
is also based on the premise that local populations have a greater interest in the
sustainable use of their natural resources than more distant populations and public or
private organizations, and they also have the knowledge of local ecosystems which allows
them to manage their resources effectively if given the proper incentives, such as increased
land tenure security.
2.1.2 EVOLUTION OF PROJECT SCOPE AND IMPLEMENTATION
This section does not attempt to provide a detailed catalogue of activities undertaken by
the project and their timelines. These can be obtained from other reports, particularly the
quarterly reports of the project of which 17 have been produced as specified in the ToR. In
the context of this final report, which attempts to draw out the major lessons from the
project, it is more important to reflect on how project implementation evolved over time
Project Implementation CBRLM Sub-Activity Final Report
Page | 16
and the extent to which some of the original terms of reference were amended and
superseded by other activities and objectives.
From section 2.1.1 above, it is clear that the CBRLM project was based on the following
main assumptions:
Viable range management techniques exist that can stop and reverse resource
depletion in rangeland and livestock systems of the NCAs.
Exposing farmers to these natural resource management techniques would
empower them to manage their resources effectively and sustainably. Control
mechanisms would need to be developed to allow the “rules of the game” to be
established and to enable compliance by all users.
By so doing, and in conjunction with other livestock management and
entrepreneurial skills, livestock productivity would be improved, marketing would
increase and communal farmers’ wealth would be increased over time.
These assumptions led to the major components of the project:
Mobilisation of communities to be committed to combined herding and planned
grazing (PGCH).
Provision of knowledge and technical and material support needed for
communities to implement PGCH.
Complementary training on livestock management and entrepreneurial skills.
Limited water infrastructure support at selected sites.
Given that the project was to cover six regions across the north of Namibia and to involve at
least 50 communities, implementation was phased and training of facilitators in each region
was adopted as the main strategic approach. The first phase of mobilisation and
implementation started in a limited set of rangeland intervention areas (Phase 1 RIAs)
before extending to the Phase 2 RIAs later on. Commitment to planned grazing was always
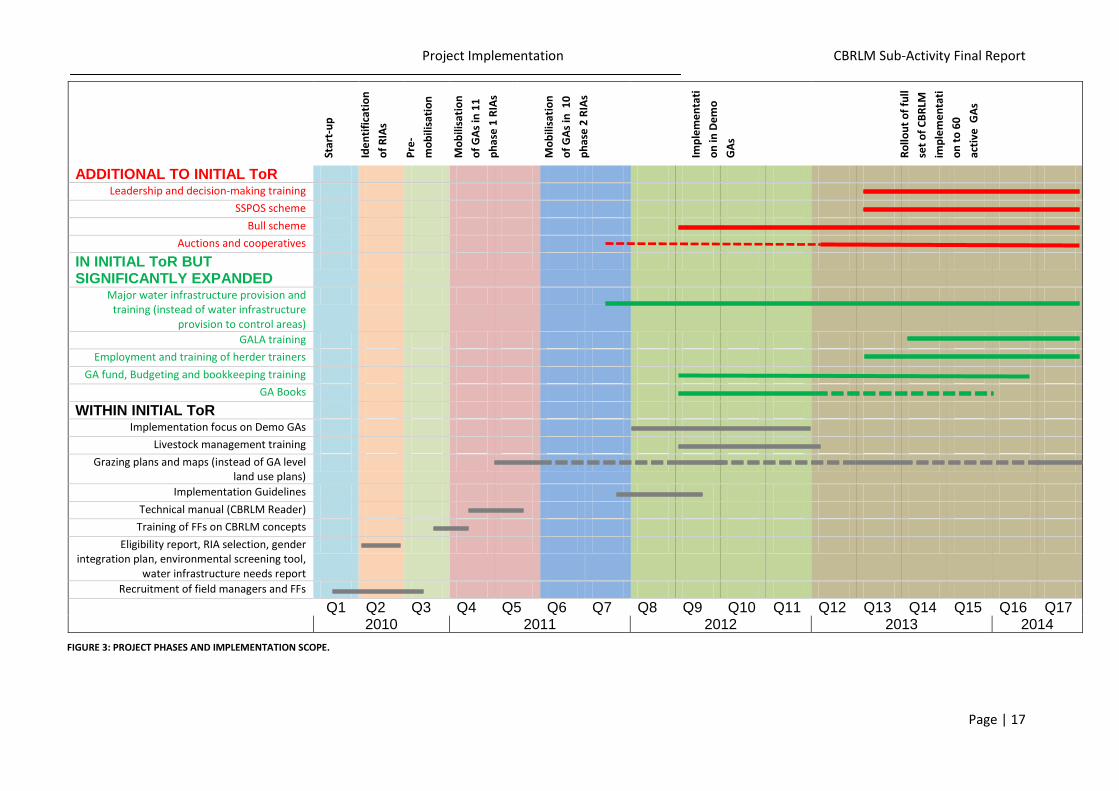
sought first and this was followed by component related activities. Figure 3 below
illustrates the relation between implementation phases and major component activities
undertaken.
Project Implementation CBRLM Sub-Activity Final Report
Page | 17
Star
t-u
p
Ide
nti
fica
tio
n
of
RIA
s
Pre
-
mo
bili
sati
on
Mo
bili
sati
on
of
GA
s in
11
ph
ase
1 R
IAs
Mo
bili
sati
on
of
GA
s in
10
ph
ase
2 R
IAs
Imp
lem
en
tati
on
in D
em
o
GA
s
Ro
llou
t o
f fu
ll
set
of
CB
RLM
imp
lem
en
tati
on
to
60
acti
ve G
As
ADDITIONAL TO INITIAL ToR Leadership and decision-making training
SSPOS scheme Bull scheme
Auctions and cooperatives
IN INITIAL ToR BUT SIGNIFICANTLY EXPANDED
Major water infrastructure provision and training (instead of water infrastructure
provision to control areas)
GALA training Employment and training of herder trainers
GA fund, Budgeting and bookkeeping training GA Books
WITHIN INITIAL ToR Implementation focus on Demo GAs
Livestock management training Grazing plans and maps (instead of GA level
land use plans)
Implementation Guidelines Technical manual (CBRLM Reader)
Training of FFs on CBRLM concepts Eligibility report, RIA selection, gender
integration plan, environmental screening tool, water infrastructure needs report
Recruitment of field managers and FFs
Q1 Q2 Q3 Q4 Q5 Q6 Q7 Q8 Q9 Q10 Q11 Q12 Q13 Q14 Q15 Q16 Q17 2010 2011 2012 2013 2014
FIGURE 3: PROJECT PHASES AND IMPLEMENTATION SCOPE.
Project Implementation CBRLM Sub-Activity Final Report
Page | 18
The main phases of the project are depicted by coloured bars on the horizontal axis of
Figure 3. There were seven major distinct phases of project implementation.
1. Project start-up (March to May 2010)
2. Identification of RIAs and eligibility report (June to August 2010)
3. Pre-mobilisation meetings at TA and RIA level to identify potential GA communities
(September to December 2010)
4. Mobilisation, rangeland training and water needs assessment of GAs in 11 phase 1
RIAs (January to July 2011)
5. Mobilisation, rangeland training and water needs assessment of GAs in 10 phase 2
RIAs (July to December 2011)
6. Full project scope implementation in 12 Demo GAs (January to December 2012)
7. Rollout of full implementation to about 60 “active” GAs (January 2013 to June
2014)
Mobilisation was split into two phases, with 11 Phase 1 RIAs being identified as those
having higher social cohesion, ease of collaboration and readiness for early
implementation. Within these phases there was initiation and concentration of a number of
project activities. These activities have been divided into three groups:
those that were clearly included in the original ToR (grey bars in Figure 3)
those that were in the initial ToR, but at lower levels of emphasis and resource
intensity than were employed in the actual implementation (green bars)
those that were not included in the initial ToR, but were highly resource-intensive
(red bars)
The associated bars indicate when in the project history the activities were most
prominent. Dashed lines indicate the activity was undertaken at the relevant time, but at a
relatively low level of intensity.
The major point that can be seen in Figure 3 above is that in the latter half of the project
there was strong emphasis on elements that were either expected to be minor parts of the
project or on elements that were not envisaged as being project components at all. This
change in component emphasis in not necessarily a bad thing, but it needs to be recognised
in assessing the impact of the project against its original objectives.
The first 18 months of the project focused on the planned components:
community mobilisation for undertaking PGCH
development of training materials and training of trainers
facilitating the adoption of PGCH and supporting communities in its
implementation, including developing grazing plans and maps and livestock
management training.
In recognition of the intensive support required for the above, it was decided to focus
implementation on twelve Demo GAs, where the components of PGCH, livestock
management and business training were brought together into a “combined CBRLM
management plan”, encapsulated in the GA book.
Project Implementation CBRLM Sub-Activity Final Report
Page | 19
It was also recognised that in order to implement PGCH a major investment in upgrading
water facilities (including new installations) was required in most GAs. This led to a six-fold
increase in the budget allocation for water infrastructure and concomitant increase in
project resources required to implement the corresponding deliverable (4 million US$ were
spent on water infrastructure compared to the original 0.7 million USD).
Inevitably, GA communities began to link CBRLM participation with major incentives like
water upgrades and it became less clear about the motivations that communities had for
joining the CBRLM project. The GA fund became another incentive to join the project, with
GOPA matching community contributions into the fund.
The finding that lack of bulls was probably a major drag on livestock productivity led to the
bull scheme and the arrangements for repaying the costs of bulls led to the Small Stock Pass
on Scheme. These livestock schemes were further incentives to join the project.
For the project to deliver major components over and above the original terms of reference
is a major implementation achievement. However, it is important to assess whether these
additional implementation successes have supplemented the original objectives of the
project to “stop and reverse resource degradation”, or even detracted from them. In this
regard one important element of the original ToR that does not seem to have been
addressed satisfactorily is the empowerment of communities to ensure compliance by all
users to grazing rules within the boundaries of their GAs. Work with MCA-N’s Communal
Land Support (CLS) Sub-Activity was done in this regard and some promising results were
evident only at the end of the project when CLS developed a viable approach to group
rights that was complementary to CBRLM.
2.1.3 GA-LEVEL ACTIVITY
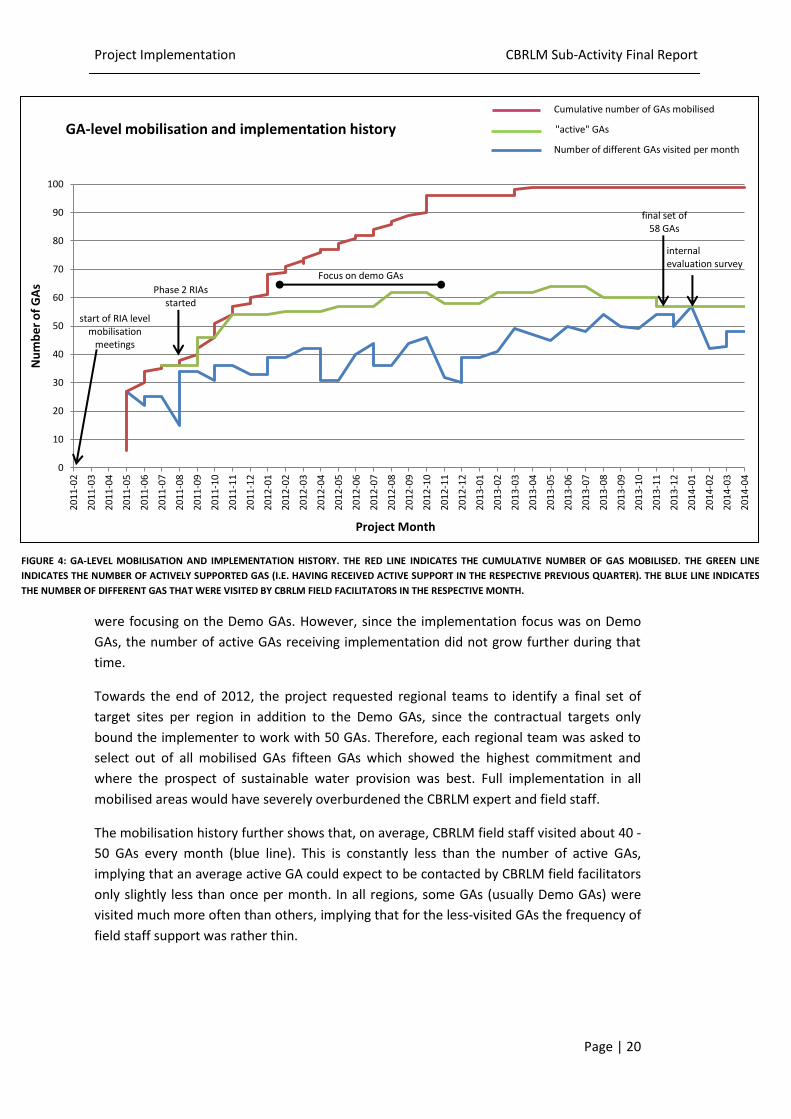
Figure 4 below shows the pattern of GA contacts made by field facilitators from the first
field mobilisation sessions where interest was shown by specific GAs to be involved in the
CBRLM project. It shows that over the three years from May 2011, almost 100 GAs have
been engaged with CBRLM field facilitators, at least to the stage of committing to
implementing CBRLM principles of combined herding and planned grazing (red line).
The number of new GA communities engaging with the CBRLM project increased steadily
until October 2012 with a total of 96 GAs communities had held mobilisation meetings with
CBRLM field staff. However, from about a year before this, the number of “active” GAs had
stabilised at between 56 and 64 (green line). The gap between the cumulative GAs (red line)
and active GAs (green line) represents the number of mobilised GAs communities that no
longer participated in CBRLM. Between November 2011 and October 2013, there was
steady attrition (i.e. the gap was widening).
Throughout 2012, the CBRLM field facilitators spent most of their time working in the so-
called Demo GAs. These Demo GAs were GAs that had been identified as promising and
motivated cases during the previous GA mobilisation phase and were supported intensively
in order to serve as examples for other communities. Substantial implementation for most
other GAs only started in early 2013. New GAs were still mobilised while field facilitators
Project Implementation CBRLM Sub-Activity Final Report
Page | 20
0
10
20
30
40
50
60
70
80
90
100
20
11
-02
20
11
-03
20
11
-04
20
11
-05
20
11
-06
20
11
-07
20
11
-08
20
11
-09
20
11
-10
20
11
-11
20
11
-12
20
12
-01
20
12
-02
20
12
-03
20
12
-04
20
12
-05
20
12
-06
20
12
-07
20
12
-08
20
12
-09
20
12
-10
20
12
-11
20
12
-12
20
13
-01
20
13
-02
20
13
-03
20
13
-04
20
13
-05
20
13
-06
20
13
-07
20
13
-08
20
13
-09
20
13
-10
20
13
-11
20
13
-12
20
14
-01
20
14
-02
20
14
-03
20
14
-04
Nu
mb
er
of
GA
s
Project Month
GA-level mobilisation and implementation history
Cumulative number of GAs mobilised
"active" GAs
Number of different GAs visited per month
Focus on demo GAs
Phase 2 RIAs started
start of RIA level mobilisation
meetings
final set of 58 GAs
internal evaluation survey
were focusing on the Demo GAs. However, since the implementation focus was on Demo
GAs, the number of active GAs receiving implementation did not grow further during that
time.
Towards the end of 2012, the project requested regional teams to identify a final set of
target sites per region in addition to the Demo GAs, since the contractual targets only
bound the implementer to work with 50 GAs. Therefore, each regional team was asked to
select out of all mobilised GAs fifteen GAs which showed the highest commitment and
where the prospect of sustainable water provision was best. Full implementation in all
mobilised areas would have severely overburdened the CBRLM expert and field staff.
The mobilisation history further shows that, on average, CBRLM field staff visited about 40 -
50 GAs every month (blue line). This is constantly less than the number of active GAs,
implying that an average active GA could expect to be contacted by CBRLM field facilitators
only slightly less than once per month. In all regions, some GAs (usually Demo GAs) were
visited much more often than others, implying that for the less-visited GAs the frequency of
field staff support was rather thin.
FIGURE 4: GA-LEVEL MOBILISATION AND IMPLEMENTATION HISTORY. THE RED LINE INDICATES THE CUMULATIVE NUMBER OF GAS MOBILISED. THE GREEN LINE
INDICATES THE NUMBER OF ACTIVELY SUPPORTED GAS (I.E. HAVING RECEIVED ACTIVE SUPPORT IN THE RESPECTIVE PREVIOUS QUARTER). THE BLUE LINE INDICATES
THE NUMBER OF DIFFERENT GAS THAT WERE VISITED BY CBRLM FIELD FACILITATORS IN THE RESPECTIVE MONTH.
Project Implementation CBRLM Sub-Activity Final Report
Page | 21
2.2 CBRLM PROJECT COMPONENTS
2.2.1 RANGELAND MANAGEMENT
2.2.1.1 RATIONALE
At a national level it had been acknowledged that rangelands are deteriorating in the
private and communal lands as well as in the national parks. The number of cattle on
private farms has approximately halved since the 1950’s, largely as a result of rangeland
degradation. The livestock producers association recognised this and facilitated the
development of the National Rangeland Management Policy and Strategy (NRMPS). This
innovative policy recognises the importance of ecological literacy and lists the key principles
of sound rangeland management. Adjusting animal numbers in relation to the amount of
fodder produced each year is one key principle that is a shift in thinking from fixed carrying
capacity and fixed stocking rates. The grazing plan accommodates Namibia´s dry and
variable climates and encourages management to respond to these changes between and
within seasons. The NRMPS recognises the need to change management practices in the
communal areas and encourages planned grazing and combined herding as one means of
achieving this. This approach has the ability to apply the principles of sound rangeland
management at low cost whilst sustainably creating jobs. It is culturally acceptable in most
areas and was practiced in all areas in the recent past. In most cases the demise of this
combined herding coincides with the decline in the resource base. Planned grazing is a
possible solution for a sustainable future of livestock in the NCAs.
The rangeland management component was the core component of CBRLM, around which
the other components were built. It built on lessons from NOLIDEP as well as the successes
of Namibian-developed and grown initiatives by IRDNC and MAWF in the northwest and
northeast of the country. A major difference to previous projects is the appointment of
local staff to lead the facilitation process at the local and regional levels. This strategy was
supposed to move away from the need to have experts in control of all activities but would
rather allow the process to unfold in different ways in different regions based on the need.
This approach would pave the way for a continued Namibian-lead initiative to take forward
the progress made in this Sub-Activity.
The overall objective of the rangeland component was to empower communities to
manage their rangeland in a way that sustainably increases rangeland productivity. This
would be achieved by the strategy of planned grazing and combined herding and by
continuously adjusting livestock numbers to available fodder. Implementation of PGCH
would require strong collaboration within the communities, the definition of distinct GA
boundaries for grazing planning and the enforcement of grazing rules, the payment and
capacity-building of herders and the availability of appropriate water infrastructure.
Adjustment of livestock numbers would require the establishment and enhancement of
livestock marketing options and sensitisation of NCA farmers towards these. The
philosophy behind the rangeland component is the main distinguishing feature of CBRLM as
compared to previous approaches to the improvement of rangeland and livestock
management in the NCAs and will be outlined in the following. For more detailed
information, refer to the CBRLM reader.
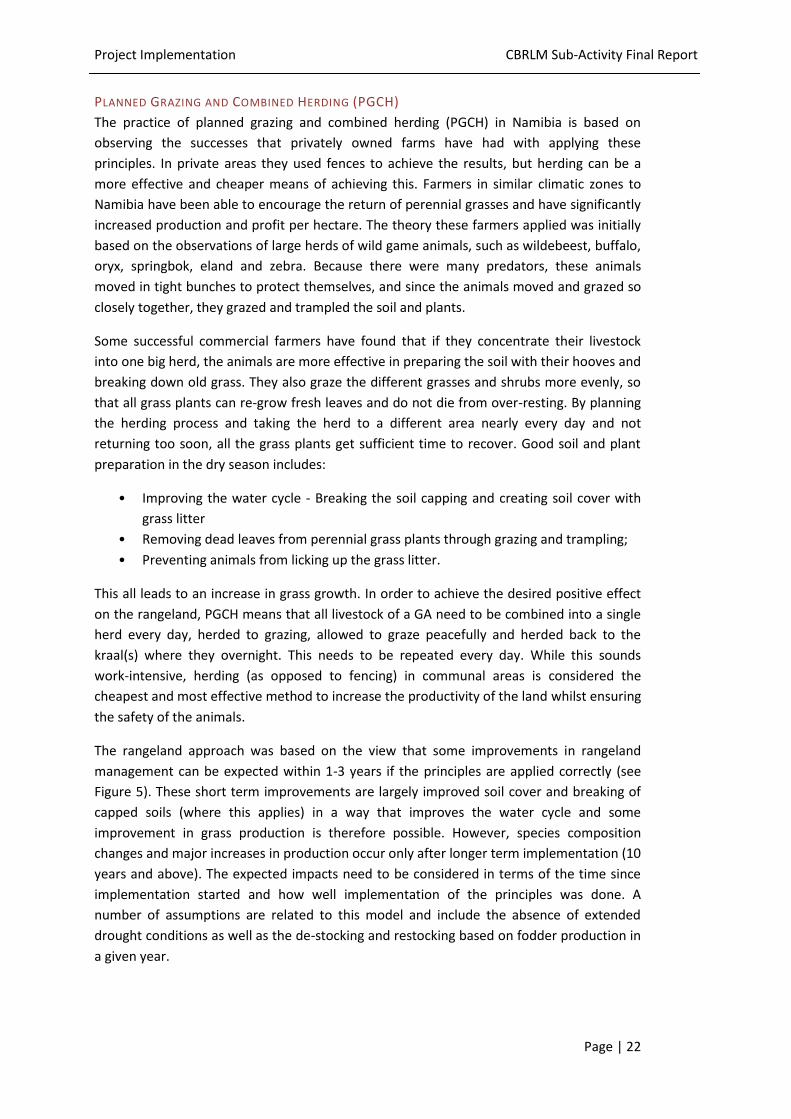
Project Implementation CBRLM Sub-Activity Final Report
Page | 22
PLANNED GRAZING AND COMBINED HERDING (PGCH)
The practice of planned grazing and combined herding (PGCH) in Namibia is based on
observing the successes that privately owned farms have had with applying these
principles. In private areas they used fences to achieve the results, but herding can be a
more effective and cheaper means of achieving this. Farmers in similar climatic zones to
Namibia have been able to encourage the return of perennial grasses and have significantly
increased production and profit per hectare. The theory these farmers applied was initially
based on the observations of large herds of wild game animals, such as wildebeest, buffalo,
oryx, springbok, eland and zebra. Because there were many predators, these animals
moved in tight bunches to protect themselves, and since the animals moved and grazed so
closely together, they grazed and trampled the soil and plants.
Some successful commercial farmers have found that if they concentrate their livestock
into one big herd, the animals are more effective in preparing the soil with their hooves and
breaking down old grass. They also graze the different grasses and shrubs more evenly, so
that all grass plants can re-grow fresh leaves and do not die from over-resting. By planning
the herding process and taking the herd to a different area nearly every day and not
returning too soon, all the grass plants get sufficient time to recover. Good soil and plant
preparation in the dry season includes:
• Improving the water cycle - Breaking the soil capping and creating soil cover with
grass litter
• Removing dead leaves from perennial grass plants through grazing and trampling;
• Preventing animals from licking up the grass litter.
This all leads to an increase in grass growth. In order to achieve the desired positive effect
on the rangeland, PGCH means that all livestock of a GA need to be combined into a single
herd every day, herded to grazing, allowed to graze peacefully and herded back to the
kraal(s) where they overnight. This needs to be repeated every day. While this sounds
work-intensive, herding (as opposed to fencing) in communal areas is considered the
cheapest and most effective method to increase the productivity of the land whilst ensuring
the safety of the animals.
The rangeland approach was based on the view that some improvements in rangeland
management can be expected within 1-3 years if the principles are applied correctly (see
Figure 5). These short term improvements are largely improved soil cover and breaking of
capped soils (where this applies) in a way that improves the water cycle and some
improvement in grass production is therefore possible. However, species composition
changes and major increases in production occur only after longer term implementation (10
years and above). The expected impacts need to be considered in terms of the time since
implementation started and how well implementation of the principles was done. A
number of assumptions are related to this model and include the absence of extended
drought conditions as well as the de-stocking and restocking based on fodder production in
a given year.
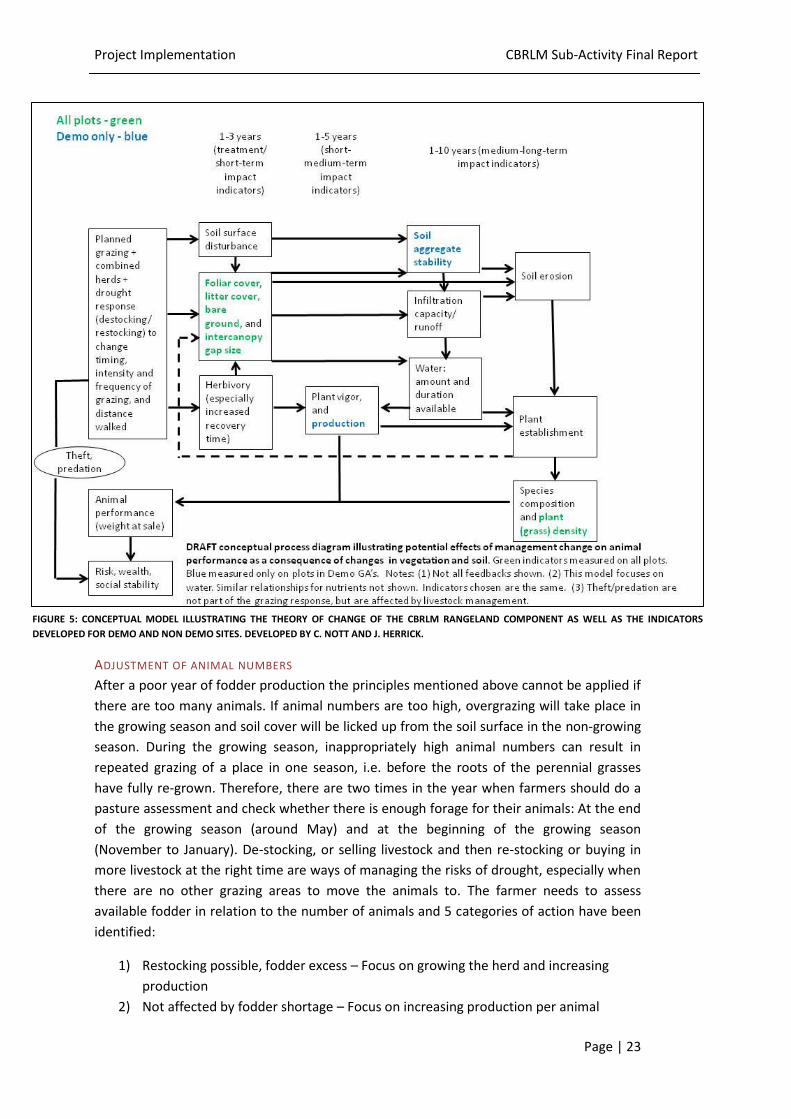
Project Implementation CBRLM Sub-Activity Final Report
Page | 23
ADJUSTMENT OF ANIMAL NUMBERS
After a poor year of fodder production the principles mentioned above cannot be applied if
there are too many animals. If animal numbers are too high, overgrazing will take place in
the growing season and soil cover will be licked up from the soil surface in the non-growing
season. During the growing season, inappropriately high animal numbers can result in
repeated grazing of a place in one season, i.e. before the roots of the perennial grasses
have fully re-grown. Therefore, there are two times in the year when farmers should do a
pasture assessment and check whether there is enough forage for their animals: At the end
of the growing season (around May) and at the beginning of the growing season
(November to January). De-stocking, or selling livestock and then re-stocking or buying in
more livestock at the right time are ways of managing the risks of drought, especially when
there are no other grazing areas to move the animals to. The farmer needs to assess
available fodder in relation to the number of animals and 5 categories of action have been
identified:
1) Restocking possible, fodder excess – Focus on growing the herd and increasing
production
2) Not affected by fodder shortage – Focus on increasing production per animal
FIGURE 5: CONCEPTUAL MODEL ILLUSTRATING THE THEORY OF CHANGE OF THE CBRLM RANGELAND COMPONENT AS WELL AS THE INDICATORS
DEVELOPED FOR DEMO AND NON DEMO SITES. DEVELOPED BY C. NOTT AND J. HERRICK.
Project Implementation CBRLM Sub-Activity Final Report
Page | 24
3) Moderately affected by fodder shortage – Focus on maintenance of production per
animal
4) Severely affected by fodder shortage – Focus on survival of core breeding unit
5) Extreme fodder shortage – Focus on survival of as many productive animals as
possible
Reducing the number of animals early in the dry season by selling them while they are in
good condition helps the farmer earn money from good quality cattle, and fewer have to be
sold. If the farmer waits until the end of the dry season when the forage is depleted, the
animals will by then have lost condition, and more animals would have to be sold before
they die.
2.2.1.2 IMPLEMENTATION
ORGANISATION AND STAFFING
The rangeland specialist on the CBRLM team was part of the drafting team of the NRMPS.
The principles of sound rangeland management included in the policy and strategy were
incorporated into the implementation phase of the CBRLM sub activity. This strategy of
planned grazing and combined herding was proposed as an option because it was
considered the most cost effective way of implementing the principles of sound rangeland
management and had various other benefits to the livestock and farmer. The cost
effectiveness allows this approach to be scaled up within the communal areas and beyond
and if applied properly increases in production and profit per hectare can be expected over
the medium term.
Initially, GOPA staff were supported on the ground by the rangeland expert and were
assisted in holding meetings and presenting the information required in a palatable and
effective manner. After this, staff developed their own techniques and methods that suited
their audience and unique challenges they faced. IRDNC continued to give ongoing support
to GOPA and MAWF staff and GAs with regard to rangeland and community mobilisation
and grazing planning for the duration of the project and contributed significantly to this
component. They also assisted with the mapping of most GA boundaries, the mapping of
the GA into paddocks and the development of annual grazing plans.
Herder training initially fell under the livestock component of the project. However, this did
not work out effectively, particularly when the work load of the livestock component
increased. Herder and low stress animal handling training was done under the rangeland
component in 2013. In 2013, six professional herders were appointed to assist field
facilitators who had become overburdened with all their responsibilities. The professional
herders received training of trainers and subsequently trained and supported other herders
in the GAs of their respective regions.
In mid 2013, Wiebke Volkmann and Usiel Kandjii were appointed to provide additional
support to grazing planning, herders and low stress livestock handling. Formal retraining of
staff was done. The documentation and mapping of herd grazing moves and the process of
gradual improvement became more of a focus.
Project Implementation CBRLM Sub-Activity Final Report
Page | 25
Field staff were divided into four regional teams. One team covered Kunene, the second
was responsible for Omusati and Oshana, the third was responsible for Ohangwena and
Oshikoto and the fourth responsible for Kavango region. Each of these teams had a regional
manager and several field facilitators as well as herder trainers. U. Kapi and Dave
Kangombe provided technical support to the rangeland component. Each regional team
developed quarterly and monthly plans to address the needs of each grazing area.
In late 2012 it was recognized that greater supervision of the regional project teams was
required and an expert was assigned to each of the four regional teams for dedicated
support and supervision. This approach was never rigorously applied, although some
progress was made in improving strategies and alignment of staff with skills and
aspirations. The most common feedback from field staff was that they were overburdened
with the amount of work required and felt they could not focus properly on any one issue.
Short-notice arrivals of CBRLM experts for component-specific activities as well as
unscheduled external visitors to the project also had a significant impact on work load.
The regional teams planned monthly with all stakeholders including DEES and involved the
regional councilors and Governor’s office regularly. This approach resulted in more time
being spent at the regional level to address the region-specific problems to the detriment
of GA-level planning. Limited full-chain-of-production planning was done at the GA level
and hence the level of inputs and buy-in was sometimes limited. Furthermore, there were
disagreements on various issues within the group of CBRLM experts which sometimes
resulted in mixed messages being received by the field staff and GAs.
GA-LEVEL STRATEGIES
All GA boundaries were mapped by the CBRLM field staff with the help of local farmers and
traditional leaders who identified the boundary points that were then plotted onto
orthophotographs. On these maps virtual camps were identified using land marks and other
features. Camps were named and numbered and given a quality rating during grazing
planning. During the grazing planning process farmers would identify at which time it would
make sense to have the animals in a particular camp. These reasons varied from the
occurrence of poisonous plants, prevailing wild fires, animal production reasons or the
need to have animals handled at a certain time of year. The entire herd of the GA was
allocated to a particular camp for a particular month. This formed the basis of the grazing
plan. Herding would then start according to the grazing plan. The plan could change for
various reasons – i.e. fodder in a camp was either overestimated or underestimated, water
infrastructure stopped working etc. Changes to the plan were fine, provided the principles
of sound rangeland management continued to be applied.
Fodder was also assessed in May each year in relation to the number of livestock on the
land and based on this the GA was categorised in terms of fodder availability. Fodder
availability assessments would result in discussions with farmers to restock, destock or
maintain current animal numbers. This approach proved useful during the three year
drought (in some north-western target areas) since a clear indication of the fodder
availability for the entire region could be assessed in a relatively cheap but effective
manner.
Project Implementation CBRLM Sub-Activity Final Report
Page | 26
The grazing plan was explained to ensure that animals did not return to the place first
grazed until the plants there had recovered and in the dry season the plan was to ensure
that some animal litter was left on the soil surface to improve the soil cover, water and
mineral cycle over time and hence increase production over time. Farmers, herders and
committees were shown these principles and with the support of field staff left to try and
apply them as best as possible. The approach is technically simple but socially very complex.
OUTCOMES
The distribution and condition of water points in the communal areas is mostly inadequate
from a rangeland and animal production perspective. There are arguably no commercial
farmers who would be able to manage their farms with one water point for livestock and
people. The need to have water well distributed across the farm and appropriately
developed to enable fast watering is critical for both sustained range management as well
as improved animal production. It is therefore important that communal farmers have the
ability to plan their ‘farms’ and are able to enforce rules related to water use. Additional
water points and the upgrade of existing water points is required to enable effective
rangeland and livestock management to be applied. CBRLM has been able to provide
significant improvements in water, although most of these came late into the
implementation phase of the project and this also coincided with extended drought
conditions in the western parts of the focal area which hampered adoption significantly.
Not enough progress has been made in improving the control and enforcement of rules
around these water points. Efforts were made to include these aspects in the
environmental screening tool but it was not possible to engage DRWSS sufficiently to have
these recommendations endorsed and applied. It is also important that rural residents can
decide on the type of installation to be fitted at cattle posts to ensure that "over-
engineered" installations are not designed and that infrastructure development is cost
effective.
The project has been very successful at giving out a consistent message related to the
importance of rangeland management as well as the strategies to facilitate. This has
allowed farmers and decision makers to understand the root causes of rangeland
degradation and grapple with solutions to address them. The extent to which rangeland
management practice has improved in the 58 GAs supported is variable. At the time of
writing, over 100 grazing plans have been done in a participatory manner with farmers,
herders, GA committees and TA. All 58 GAs that have been mobilized have come to the
realization that poor management is the root cause of the problem, that they as owners are
responsible for the decline in productivity and the livestock owners in the GA have made
the commitment to take collection action to improve the resource base. They have all
adopted PGCH as the preferred approach and have committed to appointing herders,
combining animals into one herd and to herd them according to a grazing plan to ensure
that the soil and grass needs are met. All GAs have made attempts to apply these plans and
have mobilized their farmers to combine herds and take action. The adoption of combined
herding and planned grazing is a complex social process that the project has successfully
embraced. This has enabled to make inroads into improved management of what is
essentially an open access system of grazing use.
Project Implementation CBRLM Sub-Activity Final Report
Page | 27
The project has begun to instill the need for a sense of ownership over an area and
identified an area and users that need to be involved in planning it to enable farmers to be
successful into the future. It will, however, still take many years of support to become fully
entrenched. In the absence of the ability to control a grazing plan, communities will likely
become frustrated and lose hope. At present, a minority of farmers in a GA can derail the
will and intent of the majority of farmers within a GA. The CBRLM project was based on the
small IRDNC pilot approach in Kunene Region, which entailed essentially only the rangeland
component, and expanded this approach to the full chain of production. This includes even
the development of livestock marketing cooperatives that may have huge potential to
impact significantly on the livestock sector of the NCAs.
Numerous communities and stakeholders and key decision makers have been exposed to
the ecological literacy required to improve rangelands. This may not have an impact now in
terms of behavior but an intervention of this nature needs to be long term and it is
expected that future interventions will build on this solid base of knowledge built up over
the project period. Some communities have not been able to apply this new knowledge. In
some cases, this was due to a part of the community who opposed the initiative. Others
have tried and failed, while other communities are still committed. The reasons for
dropping or staying with the process are varying, but invariably farmers are concerned
about the decline of their resource base and are interested to address the challenges that
lie ahead. However, the job of securing Namibia’s communal rangelands is by no means
done and the success of the sustainability plan that is supposed to take this initiative
forward will be vital to continue these efforts.
The project does not have evidence on significant adjustment of animal numbers in relation
to fodder availability. In Kavango region, farmers initially destocked because of concerns of
limited fodder but later realized that this was not necessary in this region. In the other
regions, mainly Kunene and Omusati, where severe fodder shortages were experienced,
destocking failed. This has been attributed to the collapse of the livestock market. The
nationwide drought in 2013 had made de-stocking an imperative and resulted in high sales
by commercial farmers throughout the country, feedlots in South Africa being filled,
decreased demand for livestock and livestock prices collapsing. Promises of lucrative
markets in Angola and Zimbabwe did not materialize and farmers were left with no market
options. A major lesson going forward is that markets need to prepare for a boom and bust
scenario. The current marketing facilities and strategies cannot cope with variable fodder
flow, which, however, needs to become the basis of the livestock industry in arid zones like
Namibia.
TABLE 1: REGIONAL OVERVIEW OF END-OF-PROJECT STATUS OF RANGELAND KEY INDICATORS.
Region Number of GAs
GAs with up-to-date grazing plan in place
GAs practicing combined herding
GAs practicing PGCH
Kunene 14 12 7 7
Omusati 15 7 8 5
Oshana 4 0 2 0
Oshikoto 5 5 5 5
Ohangwena 4 3 3 2
Kavango 16 14 13 8
Total 58 41 38 27
Project Implementation CBRLM Sub-Activity Final Report
Page | 28
2.2.1.3 RANGELAND CHALLENGES
There were several challenges experienced during implementation. Most were known prior
to the start of CBRLM from the implementation of previous projects. Under the current
implementation environment, where grazing area plans cannot be enforced by livestock
owners, the main challenge was and will continue to be the buy-in and active participation
and commitment from all livestock owners in a GA. As described previously, the rangeland
challenge means that all livestock need to be combined into a single herd every day and
herded to grazing allowed to graze peacefully and are herded back to the kraal (s) where
they overnight. This needs to be repeated every day. Some farmers do not participate,
some are not there on time and other livestock may influence the grazing plan from the
outside. The inability of farmers to enforce grazing plans and charge grass poachers is a real
issue that needs to be addressed. The group rights approach that is being pursued by MLR
that allows all the current resource use legislation to be tied together and grazing area
rights afforded to the group needs to be supported. This will allow a grazing plan to be
implemented and locally agreed rules to be enforced. This is the single most pressing issue
that needs to be addressed by MAWF and MLR and should be taken into account in the
long-awaited land use plans for all regions to be created by MLR. A degree of internal as
well as external control will be required to make this approach effective.
Uncontrolled fire is the second largest challenge that is outside the control of the farmer.
Fire control needs to be addressed at a local, regional and national level. Grazing areas
applying planned grazing and herding need to prevent fires. This will enable the water cycle
and mineral cycle to improve over time. Early burning is appropriate for areas that are not
practising planned grazing and herding and even here evidence of the long term impact of
early burning is not yet clear.
The lack of trained and dedicated herders and farm managers in the communal areas is a
real issue that needs to be addressed. Commercial farmers are more and more showing
interest in herding within existing paddocks or taking down internal fences and a herder
school will be required in future.
From a water provision perspective it is important that several issues be addressed as a
matter of urgency:
Any new water points that are provided in areas that have not previously had
permanent water must be accompanied by sound rangeland management – or else
these areas will degrade as well.
Grazing areas need to be able to plan their infrastructure needs including water.
They need to be able to zone areas as cattle posts where no settlement and
cropping is allowed. In addition, the water infrastructure at these sites may not
need to meet the current DRWSSC standards as they are not being used by a
community. Simple, high quality installations that may be removable will be more
appropriate for these situations. Construction and maintenance costs will be
reduced. The full maintenance costs of these cattle post areas should be borne by
the farmers.

Project Implementation CBRLM Sub-Activity Final Report
Page | 29
Water points need to be designed to enable joint GA kraals to be established
around them. This enables faster handling of animals in the mornings and evenings
and a reduced workload for herders.
Incentives need to be created that ensure or promote sound rangeland
management around them.
Water provision is vital to improved rangeland management but it is expensive and will do
damage to the environment if sound rangeland management is not put in place. Some
communities may have given the impression of commitment to planned grazing to get
water or to get any of the other incentives provided by GOPA (bulls, goats, matching GA
fund payments). The provision of these incentives allowed project targets to be met but
made disentangling real commitment from lip service very difficult. Reversing this
incentive-focused approach going forward will be a major challenge.
Project Implementation CBRLM Sub-Activity Final Report
Page | 30
2.2.2 WATER INFRASTRUCTURE DEVELOPMENT
For the purpose of this report, this subsection will only give an overview of the CBRLM
water infrastructure component. For further reading, the water infrastructure component
produced a report as a final deliverable in March 2014 with the title “Water Infrastructure
provided in CBRLM Grazing Areas”. This report provides much more detailed information
on the CBRLM water infrastructure component.
2.2.2.1 OVERVIEW AND RATIONALE
In the initial project planning stage, the water component was considered not a key
component of CBRLM. However, during the mobilization phases it was very soon realized
that water is a prerequisite to implement rangeland management effectively. GAs in the
majority of the nineteen targeted RIAs did not have adequate water infrastructure to
provide water in sufficient quantity and of sustainable nature to water livestock herds. In
the beginning, there was only a very limited budget for water infrastructure development.
Furthermore, the number and condition of existing water infrastructure of the Directorate
of Water Supply and Sanitation Coordination (DWSSC) were unknown. Possible needs with
regards to water infrastructure to enable planned grazing and combined herding to be
applied effectively were assessed by CBRLM field staff for all potential GAs.
A detailed water needs infrastructure report was submitted in November 2011 with the
help of Lund Consulting Engineers (LCE) coming up with an estimation of the total water
infrastructure costs in the magnitude of 35 million NAD. This budget was then approved by
MCC / MCA-N. The report was discussed with DWRSSC and a joint implementation was
agreed with MAWF taking over some boreholes to be drilled and equipped.
THE RATIONALE BEHIND THE IMPLEMENTATION OF THE WATER COMPONENT
The availability of water in sufficient quantities, of sustainable nature and of good
quality is a crucial factor for the improvement of rangeland management. DWSSC
water points focus on water supply for human consumption with little emphasis on
water supply for livestock drinking. The majority of DWSSC water points cannot
supply sufficient water to water large herds of livestock. However, this is exactly a
prerequisite to enable combined herding. Many DWSSC water points were found to
be old and not reliable and in need of upgrading and or replacement. Water
storage facilities, the number of drinking troughs and the water flow to drinking
troughs were found inadequate.
Farmers in the targeted GAs indicated that the availability of water is essential
before they can commit to apply PGCH. It was therefore important to make
improvements to existing water infrastructure or develop new water infrastructure
as early as possible to avoid momentum being lost in the mobilization phases.
Not all DWSSC water points are ideally located relative to grazing areas. Livestock
movement from the water point to grazing areas should preferably not be more
than 3.5 km.
The majority of DWSSC water points do not cater for wildlife drinking. Elephant
presence in some areas resulted in damage to corrugated iron ground reservoirs
and equipment due to limited water available for elephants. Elephants behave
Project Implementation CBRLM Sub-Activity Final Report
Page | 31
aggressive towards humans and livestock when water for drinking is not accessible.
Elephant-friendly water installations are more sustainable.
During visits to water sites it was noticed that very little storage water was
available at some places for livestock and human consumption. The water
shortages have a negative impact on PGCH. The reasons were that (a) the
communities cannot afford to buy enough diesel fuel to operate diesel engines on a
daily basis and (b) water sites are remote from businesses where diesel can be
bought and transport for diesel not always available. Solar-driven pump
installations would obviously solve this issue.
In most cases there were too few troughs and flow to these troughs was
inadequate. Furthermore, troughs were not placed within kraals to facilitate easy
watering.
STEPS UNDERTAKEN TO IMPLEMENT THE WATER COMPONENT
Under the lead of the rangeland expert, the implementer identified the GAs most
committed to PGCH and produced a list of water needs in these GAs. Lund
Consulting Engineers cc was appointed to cost these water needs and compile the
final needs assessment. The findings and recommendations were summarized in a
water infrastructure needs assessment report.
An environmental screening tool was developed that would allow for analysing and
mitigating potential negative environmental impacts resulting from the provision of
water infrastructure.
The water infrastructure needs assessment report was tabled in November 2011.
The report covered various water related issues and focused on assessments of
DWSSC water infrastructure, CBRLM water needs, recommendations for fast track /
long track improvements and an estimated budget figure for water infrastructure
development.
MCC made funds available through MCA-N for water infrastructure development.
MCA-N appointed an individual consultant to further investigate water sites, do
assessments based on the needs assessment report and local site conditions,
prepare tender documentation and supervise construction works by private
contractors.
2.2.2.2 IMPLEMENTATION
SELECTION OF TYPE OF WATER INFRASTRUCTURE IMPROVEMENT
Water infrastructure improvements must meet the CBRLM water needs. Water is
needed in sufficient quantities and of good quality to water livestock in accordance
with PGCH requirements. The provision of water infrastructure must meet the daily
water demand for livestock and human consumption and shall be of durable
nature.
Upgrade existing DWSSC water infrastructure to be reliable and sustainable
Connect water sites to DWSSC pipelines where possible
Investigate and construct earth dams and hand dug wells in areas where the drilling
of boreholes is not recommended due to poor ground water quality
Site and drill boreholes close to grazing areas
Project Implementation CBRLM Sub-Activity Final Report
Page | 32
Equip newly drilled boreholes with solar pumping systems.
Change existing DWSSC diesel driven borehole installations to solar driven borehole
installations where possible
Protect water infrastructure where there is elephant presence
IMPLEMENTATION STRATEGY
Experience prior to CBRLM showed that starting PGCH without short watering times
resulted in insufficient time spent grazing and thus a loss of animal body condition score
and demoralization of farmers. Improved water (distribution, capacity and flow to troughs)
is a management need to apply PGCH and not an incentive. These lessons were brought
forward into CBRLM and farmers and communities in the CBRLM GAs were not encouraged
to start PGCH until adequate water supply was in place. The following fast track and long
track measures were implemented to enable fast watering times and hence the application
of PGCH.
Fast Track:
Repairs to existing DWSSC water infrastructure
Procurement of materials and supplies for temporary water installations.
Temporary installation of additional water storage tanks and drinking troughs at
existing water points to supplement water supply for livestock drinking.
Temporary equipment of newly drilled boreholes with submersible pumps,
generator sets, water storage tanks, drinking troughs and pipelines.
Procurement and installation of trash pumps to dewater existing traditional hand
dug wells for livestock drinking
Long track:
Upgrade existing DWSSC water infrastructure
Construction of elephant-friendly water installations consisting of concrete ground
storage reservoirs for elephant drinking and stone walls to protect equipment
against elephant damage.
Site and drill boreholes in close vicinity to grazing areas and equip with solar
pumping systems
Investigation, design and construction of earth dam(s) in areas with poor ground
water quality not suitable for livestock drinking
Investigation, design and construction of pipeline extensions from DWSSC water
supply networks to bring water close to grazing areas
Construction of hand-dug wells and equipment with trash or solar pumps in areas
located within the identified Class D groundwater limits, i.e. where the drilling of
boreholes is not an option
Installation of trash or solar pumping systems, water storage tanks and drinking
troughs at existing rain water impoundments such as RA borrow pits etc.
Replacement of existing DWSSC diesel-driven borehole installations by solar-driven
borehole installations where possible
Project Implementation CBRLM Sub-Activity Final Report
Page | 33
2.2.2.3 RESULTS
IMPLEMENTATION
The full implementation of the CBRLM water component as planned was achieved to a
great extent in only 2.5 years implementation time and within the planned budget, but not
without challenges. Unsurprisingly, the introduction of solar pumping systems with zero
energy and low maintenance cost were welcomed by communities, since the operating and
maintenance costs of diesel pumping systems are very high in comparison. The
construction of elephant friendly water installations minimized the conflict between
elephants and humans as well as damage to water infrastructure.
WATER INFRASTRUCTURE IMPROVEMENTS
In total, 70 sites received new installations or upgrades.
Thirty-nine (39) new water installations were completed.
Several repairs to existing DWSSC water infrastructure resulted in more sustainable
water supply
Twenty-two (22) new boreholes were drilled and equipped with solar installations
across seven NCA regions inside or in close vicinity of grazing areas.
One (1) earth dam was constructed at Nghishongwa in the Epembe RIA,
Ohangwena Region, to impound 60 000 m³ of rain water for livestock drinking. The
dam is equipped with a solar pumping system, water storage tanks and drinking
troughs and has a safe water supply for 2 years. There are more than a hundred
households in neighbouring villages that will benefit from this dam.
Three (3) existing traditional hand-dug wells in the Oshiku Shithilonde East RIA,
Oshana Region, were equipped with a solar pumping system, water storage tanks
and drinking troughs.
One (1) newly constructed and four (4) existing traditional hand-dug wells in the
Ongandjera RIA, Omusati Region, were equipped with either a solar or trash pump
installation, water storage tanks and drinking troughs.
One (1) existing traditional hand-dug shallow well at Nghishongwa in Epembe RIA,
Ohangwena Region, was equipped with a trash pump installation, water storage
tank and drinking troughs.
Two (2) existing Roads Authority borrow pits that impound rain water in Epembe
RIA, Ohangwena Region, were equipped with trash pump installations, water
storage tanks and drinking troughs.
One (1) existing DWSSC earth dam that impounds rain water in Epembe RIA,
Ohangwena Region was equipped with trash pump installation, water storage tanks
and drinking troughs.
INFRASTRUCTURE COSTS
The total costs were kept below the estimated figure given in the water infrastructure
needs assessment report of 2011, which came up with an estimate of N$ 33 million. The
costs for professional services, MCA-N management overhead allocations and materials
and supplies for temporary improvements are excluded. A more detailed GA-specific table
on water infrastructure improvements and costs is given in Annex A 3.1.

Project Implementation CBRLM Sub-Activity Final Report
Page | 34
TABLE 2: WATER INFRASTRUCTURE COST PER REGION.
Kunene Region: N$ 8 663 856.00
Omusati Region: N$ 4 706 969.00
Oshana Region: N$ 1 229 347.00
Ohangwena Region: N$ 6 455 292.00
Oshikoto Region: N$ 4 347 222.00
Kavango Region (East and West): N$ 5 782 993.00
Total: N$ 31 185 680.00
2.2.2.4 WATER INFRASTRUCTURE CHALLENGES
The budget allocation for water infrastructure development was limited and
improvements at some GAs had to be dropped. GA communities that were late in
expressing their commitment to CBRLM could not be provided water infrastructure
anymore.
The procurement of materials and supplies as well as the services for private
contractors to do water installations were hampered and delayed by lengthy
procurement procedures and policies.
The water sites were work had to be performed are widely spread over seven
regions in the NCAs, sandy and rocky single track access roads and hence it took
longer for contractors to mobilise than anticipated.
Thirty (30) out of the seventy (70) new and upgraded water points do not meet the
daily water demand for livestock and human consumption due to water source
limitations. Underground water in the Kunene and Omusati Regions is limited and
borehole yields are low ( < 5 m³ / hr )
All water points had to be completed in a three (3) year time frame with a final
completion date July 2014. This is a short timeframe for the number of installations
to be done. However, it was still too long for some GA communities to have enough
time to receive sufficient PGCH support by the project after water infrastructure
provision.
The gap between the commitment of farmers to PGCH and the provision of water
infrastructure was long and some participating communities indicated to revert
back to old practices. Furthermore, the procurement process did not allow for the
development of water to be synchronised with the needs of the facilitation process.
Since some water needs at prioritised sites were only identified in the final year of
project implementation, some GAs only received water infrastructure towards the
very end of the project.
In some cases in Omusati, the provision of elephant-friendly water infrastructure
increased the presence of elephants in specific area to an extent that herders had
to abandon PGCH
Project Implementation CBRLM Sub-Activity Final Report
Page | 35
2.2.3 COMMUNITY DEVELOPMENT
2.2.3.1 RATIONALE
From the onset, the CBRLM project was designed to facilitate intense community
participation as a means to achieve buy in and sustainability. Therefore, community
development was a key component in the implementation of the project. To attain buy-in,
it was necessary for farmers to agree to work together and to be part of problem
identification, solution and the decision-making process required to sustainably improve
the rangeland and livestock within their grazing areas. Facilitation was therefore designed
to create a sense of ownership and build local capacity within the intervention areas for
good governance and to minimise conflicts. The community development component
administered the following aspects during the tenure of the project:
Community mobilisation, the set up and support of GA committees
GA Books
GA Fund and
Activities aiming at mitigating gender inequality and creating social awareness.
Community mobilisation was going to be the foundational stage before introduction of any
project activity so that the communities would gain understanding, deliberate on the
benefits and risks before making decision to commit themselves to the project or reject.
The GA committee, which would be the organization managing and coordinating GA
activities had to be capacitated to handle the day to day issues and matters arising from
herding and managing livestock as a group.
Grazing was to be done collectively under the PGCH system. All livestock-related expenses
were to be dealt with as a group. As such, there would be a need to facilitate the
application of democratic tools to foster community cohesion.
Gender mainstreaming and recognition of the role played by women and members of
vulnerable groups in the project was also attended to by the community development
component. An important issue that was to be addressed was the use of child labour in the
farming enterprise. In order to ensure compliance with international requirements on
children’s rights, CBRLM was therefore supposed to facilitate the process in such a way that
child labour would be discouraged.
2.2.3.2 MOBILISATION AND OPERATION OF THE GA COMMITTEES
IMPLEMENTATION STRATEGY
The CBRLM mobilisation process commenced early in the intervention and even prior to
identification and selection of grazing areas. At the onset, mobilisation was split into two
levels; the pre-mobilisation level and the GA mobilisation level.
Pre-mobilisation was the activity undertaken to introduce the project to the various levels
of the targeted wider rangeland intervention areas (RIAs). Introductory meetings were
carried out first with regional and senior local governance leadership. This process was
meant to authenticate the project and to earn top-level support before approaching
individual communities. It is a norm that is strictly adhered to by all local authority subjects
Project Implementation CBRLM Sub-Activity Final Report
Page | 36
in the NCAs that they are reluctant to entertain any stranger or strange idea without the
top traditional authorities endorsing the person or idea. Pre-mobilisation introduced the
entire CBRLM intervention and how it would benefit the communities. However, great care
was taken not to create false expectations regarding incentives. The project was aware of
possible false buy-in as beneficiaries would focus on the immediate incentives or benefits
rather than sustainable participation. It was the pre-mobilisation activity that helped
CBRLM to draw up the eligibility criteria where areas in which participation was unlikely
were discarded right at the onset. The pre-mobilisation process was also used to
collaborate with key stake holders such as MAWF, TAs and regional councillors as it was
necessary and needed for these branded institutions to display to communities that CBRLM
was a beneficial and needed intervention that had their support and to reduce initial
distrust among communities. Pre-mobilisation did not select specific GAs to work with, but
it identified possible areas. Communities in all eligible areas were left to decide what they
wanted and to revert to the project for support if they agreed that it was an approach
worth to try.
Following pre-mobilisation communities or GAs emerged that expressed intense interest in
the project. CBRLM did not select other GAs than those that came back to the project
following pre-mobilisation requesting further explanation and support. CBRLM then
commenced detailed GA level mobilisation where interested communities were given
rangeland ecological literacy which formed the basis of the intervention. The mobilisation
facilitated GAs forming governance structures called GA committees as an overall decision-
making body to oversee the implementation of the project by the GA community.
Mobilisation by CBRLM focused on democratic principles where communities were given
literacy on everybody’s right. Very important, particularly in the west (Kunene), was the
issue of gender equality. Gender integration was a key issue because culturally, women are
not equally participating in public decision making. Women rather have influence through
their husbands, but outside public arenas. The project attempted to facilitate a process to
have women involved without causing strife within the society. This integration has made
considerable progress in this regard in some concerned GAs, since through the project
women not only actively participated in meetings, but were also crucial office-bearers in
the GA committees.
GA committees were formed to act as the central management unit of the GA. The
committees were elected and mandated by the GA communities to administer all the GA
activities on behalf of the participating farmers. In a number of cases, water point
committees had existed before, enabling the farmers to better understand the expected
responsibilities and tasks of GA committees. In most of the GAs where the traditional
authority was present, she/he sat on the committee as an ex officio member. CBRLM field
facilitators provided ongoing support to support the outcome of strong and viable GA
committees. At times, general meetings with GAs were hold to discuss specific activities,
hence creating platforms of accountability. In cases where GA committees fell extremely
short of deliverables, facilitation was done to diagnose the cause which often would be the
ability of GA committees. Mitigation would follow the route of motivating the team,
reshuffling or at times complete change of certain committee members. A specific
leadership and decision-making training was provided to improve leadership and decision-
Project Implementation CBRLM Sub-Activity Final Report
Page | 37
making skills in the GA committees. Training and skill transfer programs were put in place,
including exchange visits. Although a formal constitution was adopted in only a few cases,
the roles and responsibilities of GA committee members were normally recorded in the GA
book.
OUTCOMES AND LESSONS
CBRLM emerged as a strong and respectable brand in GAs because of a strong and
dedicated mobilisation and implementation process. Throughout the project
implementation phase, some GAs created engravings and display boards expressing their
gratitude to the project. We also have reports from some GAs who appreciated CBRLM as
peace maker in their community that made it possible for former opponents to sit together
and respectfully listen to one another. On the other hand, many of the GAs that became
inactive or were not able to demonstrate consistent commitment were affected by
endemic social disparities that could not be adequately dealt with during the short time
available for a project with short time-bound deliverables.
The way GA committees performed and were perceived was varying strongly. Where office
bearers were poorer farmers, decision-making was often more difficult and ignored by
richer farmers who claimed they were not at the relevant meeting. On the other hand,
committees were more effective where headmen and/or teachers were included.
Committees tended to be stronger in Omusati cattle post GAs, where joint decision-making
had been taking place before and therefore had to build on their previous experiences. It
seems that functionality was also related to the strength of support from the respective FF.
On average, a GA committee had 6.9 members, 2.4 of whom were female. Most
committees indicated that they meet monthly, but regular documentation of these
meetings was scarce and in many cases it is doubtful whether the GA committees actually
met that regularly. By the end of the project, CBRLM field staff indicated that about a third
of all GA committees had major problems affecting their functionality. Where there were
absentee owners, it was often not possible for the GA committees to make binding
decisions.
The concept of management committees was not new to most communities. For example,
in over half the CBRLM GAs, a water point committee had operated previously or was
currently operating. Nevertheless, most committees needed further support to continue to
effectively manage grazing areas. In a number of cases GA committees had to be
reconstituted during the project implementation phase and new members elected. In some
cases the reason for this was that chairpersons did not fully understand or were not fully in
support of the CBRLM concept. Ongoing support and mentoring was and will still be
needed. A key issue for many GA committees was also the fact that capacity to manage a
process that had not only a social dimension but also technical challenges was often
lacking. In some GAs, notably in the Kunene and Kavango regions, GA committees were
comprised of the younger generation who sometimes did not have their own livestock. This
affected their confidence to make drastic decisions where it might have been necessary. At
times, they would make decisions, but then livestock owners would simply not act
accordingly, causing a sense of subordination and de-motivation among some of the
youthful committees.
Project Implementation CBRLM Sub-Activity Final Report
Page | 38
WHAT COULD BE DONE DIFFERENTLY
GA committees are groups that were built on the foundation of trust by communities that
they are responsible persons within the society. However, they work mostly on voluntary
basis for the public interest. This sometimes makes them not to prioritise GA activities and
interests over their own. Committee members need to be made more aware that they need
to be available on a regular and ongoing basis in order to manage more productive farming,
particularly if farming is to be more commercially oriented. Support would need to be given
to GAs to consider some form of remuneration once livestock farming has become more
profitable.
Leadership training needs to continue in order to reach a level where every committee
member know their responsibilities and where the communities are able to make job
description for the committee members and hold them accountable.
Committee members need a clear mandate from livestock owners. Maybe committees are
not the best or only form of organization to consider. Essentially farmers need to be aware
of the services to be provided by a “management” organization and then to decide what
form may be most suitable. It may be that other forms of organization are more
appropriate before committees are formed in particular under cattle post farming set up
where the livestock owners are few and live remotely.
In small farmer communities, a general assembly may be most appropriate. Individual
managers collectively appointed by the livestock owners might be most appropriate for
cattle post areas. However, in villages committees are probably the most appropriate
governance body.
Not enough could be done to empower GA committees to set and enforce grazing rules.
Opportunities from the CLS project running in parallel were integrated marginally into the
project only towards the end of implementation.
The imperatives of achieving project objectives militated against planning with
communities on the basis of their priorities. Thus, GA committees did not get experience
judging consequences of taking different courses of action. Future initiatives might want to
focus less on telling and giving advice and more on working with committees on risk
assessment of alternative actions.
2.2.3.3 GA BOOK AND GA FUND
IMPLEMENTATION STRATEGY
The idea of the preparation of a comprehensive GA book instead of only compiling the
rangeland plan, the livestock management plan and the marketing plan was borne when
working with the demo areas in 2012.
A GA book was introduced to record all activities and processes that happen in the GA. Its
purpose was to remind the community of the rationale for all aspects of CBRLM, especially
given that very little and unorganised record keeping used to happen in rural communities.
It also had the purpose to guide and document decision-making in and for the GA now and
beyond the CBRLM project. The GA book content is captured in local vernacular. This is
because the information was to be generated and used by the community. The book would
Project Implementation CBRLM Sub-Activity Final Report
Page | 39
be kept by the committee responsible for managing the GA and ideally updated by them
independently and only if necessary with the assistance of field facilitators. CBRLM was
responsible for translating GA books into English for the official use by the project, the
donor and all outside interested parties.
Also the idea of a GA fund came up during the trial period with the demo GAs. It was
thought that this financial instrument would render significant empowerment to the
communities. An existing budget line for community incentives was then used for the GA
fund subsidy scheme.
Since GA expenses were to be collectively administered, the management and maintenance
of a GA fund was one of the GA committees’ main tasks. Among some of the joint expenses
that were to be covered under the GA fund were salaries and allowances for herders, diesel
for pumping water, livestock medicines and vaccinations. The GA committees were
encouraged to open a bank account in line with the GA fund to enable transparent
appropriation of the community fund and, even more important, to allow the implementer
to carry out a GA fund subsidy scheme. The GA fund was introduced with the idea to allow
GA communities to make budgets and forecasts on their needs so they could do joint
fundraising to meet the GA common expenses.
CBRLM realised that GAs committees need support to manage all the GA budgetary needs
related to the GA fund. The introduction of the GA fund subsidy was to encourage and
incentivise contributions into and use of the GA fund and make a quick start of financial
management of GA expenses possible. Every month the GA committee would submit to the
FFs the total amount of contributions made, a list of farmers who contributed and the
general use of the funds. The implementer would then deposit an equivalent amount into
the GA fund bank account. Agreements on GA fund subsidy were finalised and signed by
participating GAs. The total annual eligible subsidy amount had a ceiling depending on the
livestock numbers of the specific GA.5
In May 2012, GA fund training was implemented in selected GAs. This revealed a lack of
skills and procedures needed to responsibly administer a GA fund for joint expenses,
especially if this included larger expenses like for the purchase of bulls. To overcome this, it
was decided to conduct dedicated workshops for the treasurers, secretaries and
chairpersons of GA committees. In these workshops the participating GA committee
members would learn to plan activities over a whole year and draw up a budget aimed at
prioritising expenses and investments as well as recording actual financial transactions.
OUTCOMES AND LESSONS
While the planned GA book content was complete in most GAs, by the end of the project
practical use of the GA books by GAs was rather limited, particularly with regards to the
intended record-keeping. For example, the internal evaluation found that in only 9% of GAs
the register of unproductive animals was up-to-date. By the end of the project, regional
5 The maximum eligible was 72000 NAD per year in case of a combined herd of more than 1500 cattle. The minimum was 24,000 NAD per year
in case of less than 500 cattle. Between 500-1000 cattle the amount was 36,000 and between 1000-1500 cattle the ceiling was 54,000 NAD.
Project Implementation CBRLM Sub-Activity Final Report
Page | 40
teams assessed that the GA book was not being used as a management tool to a significant
extent by almost two thirds of all 58 GAs. It seems that the level of utilisation depended on
the level of education of committee members (e.g. better where more educated persons
like teachers were involved) and on the intensity of facilitation of the respective FF.
Nevertheless, there are some common benefits of the GA books. In general it seems the
books helped to build a sense of pride in the community. They also can serve as a reference
for follow-up by potential future support organisations, e.g. DEES.
By the end of the project regional managers reported that the great majority of GAs had a
GA fund in place with a bank account. All these GA funds were functional in the sense that
the GA community had made joint contributions and subsequently claimed for matching
subsidy. However, according to CBRLM field staff, in only a third of all GAs there was a
strong commitment to making regular contributions by most GA members. In addition,
many GA committees found it difficult to persuade members to make contributions
according to the number of animals owned. Also, having a GA fund in place did not
necessarily mean that it followed a clear budget plan. According to field staff, a budget was
in place in slightly more than half of the GA communities. However, this does not
necessarily mean that this budget was also implemented.
It is clear that the offer of matching funding by the implementer served as a strong
incentive to make contributions into a common GA fund (and hopefully make joint
expenses). This also laid the foundation for practical experiential learning in book-keeping
and budgeting. However, even with this incentive, GA committees struggled to maintain a
consistent and equitable flow of fund contributions by all GA members. Therefore, it is
likely that after removal of this incentive by project end GA treasurers and chairpersons will
face big challenges in keeping GA fund contributions running, even with continuing external
support and mentoring.
WHAT COULD HAVE BEEN DONE DIFFERENTLY
GA books were introduced too fast and with too ambitious content. It would have been
better to focus on a core set of information and then to expand once this core set would be
consolidated.
The GA fund concept was a welcomed initiative, but not an easy one to implement because
of challenges of capacity in some GAs. In a number of very remote GAs, the idea of a bank
account became an inconvenience because they had to incur great transport expenses to
go and do banking if there was no town-based GA member who would travel to and from
the GA regularly. The GA fund enabled savings by certain communities to an extent that
some of them started using it for saving for bigger common expenses like bulls. The idea of
GA subsidy was a temporary initiative that was found to be useful to kick-start GA fund
contributions.
2.2.3.4 GENDER AND SOCIAL AWARENESS
The project established a gender integration plan to encourage the participation of women
in project activities. This included promoting the participation of women in relation to: GA
committee membership, training events, provision of services and goods, management of
Project Implementation CBRLM Sub-Activity Final Report
Page | 41
livestock planning and water maintenance as well as targeting women as direct
beneficiaries.
One of the project´s promises to achieve gender integration was training of GAs in small
stock management, since small stock has often been referred to as the “cattle of women”.
The SSPOS was a strategy that was primarily introduced to achieve integration of women
into livestock management and farming.
The inclusion of women in decision making with regards to livestock management was
targeted as a key intervention because women are more involved with household food
security and welfare and yet they generally have no say on livestock the very core resource
for family livelihood. For example, in Kunene women are the ones who milk the cows, girls
look after small stock and at times after cattle and yet ownership and decision-making
around this resource has culturally been dominated by men.
OUTCOMES AND LESSONS
The MCC Social and Gender Awareness department was very satisfied with the way the
CBRLM project had successfully integrated women. For example, under the Small Stock
Pass-On Scheme, 30% of beneficiaries are women. Of those attending formal training
events, 26% were women. Women played important roles in the main governance
structure of GAs. There were 137 female members of GA committees. In more than two
thirds of all cases, the FFs assessed that women played an important role in the running of
the GA, often as treasurer or secretary.
GA general meetings started with two separately sitting groups of men and women where
the men dominated and drove the agenda particularly in Kunene. Towards the closing of
CBRLM, meetings in the same were characterised by a more closely seating single group
that had equal voice. In other places like in the Kavango regions, women were already more
involved from the beginning. However, in general livestock issues were commonly male
dominated such that their involvement in livestock decision-making processes used to be
by design exclusive of female participation.
In terms of social awareness, the CBRLM SSPOS also broke the barrier in terms of giving of
livestock in Kunene where culturally they do not give livestock from their kraals to non-
family members. Aiming at overcoming barriers resulting from differences in social status,
the CBRLM pairing of primary and secondary beneficiaries was done on ranking irrespective
of a potential difference in status between the corresponding beneficiaries. In the central
northern regions, cattle used to be a male-exclusive affair, but CBRLM mobilised GA
communities to an extent that there are now both male and female herders and even some
female heads of herders.
CBRLM put significant effort into managing community cohesion and involvement in the
GAs to the extent of even healing some chronic relationships in some communities.
However, the rate of achievement was slowed down by the fact that facilitators needed to
be properly equipped and trained prior to being able to adequately address these issues.
The project has built a team of experienced facilitators for future community mobilisation
interventions.
Project Implementation CBRLM Sub-Activity Final Report
Page | 42
In most GAs where CBRLM failed to bring about community cohesion, social challenges
were chronic and could not be addressed timely by the project. It became apparent that
some GAs became inactive or failed to make democratic decisions because of issues that
were not related to the CBRLM approach, but were rather rooted in the social existence of
the people as a community. Any community-based approach built on the assumption that
the community as such is the appropriate unit to work with will inevitably be affected by
such issues.
Project Implementation CBRLM Sub-Activity Final Report
Page | 43
2.2.4 TRAINING
2.2.4.1 RATIONALE
The objectives of the CBRLM project were to be reached by creating behavioural change
amongst GA community members. The training approach adopted was to follow the
principles of experiential learning, which is an effective way of teaching adults and
communities. The approach links learning to real management situations identified in GAs
by communities themselves.
Building on the experience of past community-based projects, farmer-to-farmer exchanges
was identified as a key strategy that was to be adopted for spreading the concept of
CBLRM. While exchange visits were seen critical for the mobilisation of farmers, they had to
be followed up with experiential learning and other support in order to effect real
behavioural change within communities.
Rather than offering to farmers “only” training (i.e. knowledge and skills transfer) or advice
and mentoring (offering a soundboard for decision making, monitoring experiences and
“big picture” planning), a process of facilitation was adopted that would include both these
functions plus other support actions.
FFs who would come from or stay close to the target communities would be trained on-the-
job and supported by a team of technical experts/component leaders. Their role would also
be to liaise between stakeholders, with an intimate knowledge of local sociology, customs
and developmental needs and opportunities. This approach had been used successfully in
previous initiatives by the communal conservancy development movement.
2.2.4.2 DEVELOPMENT OF TRAINING MATERIALS
IMPLEMENTATION STRATEGY
The training component started with an out-sourced, contracted service for sourcing and
evaluating readily available training materials that capture the principles and processes of
CBRLM and experiential learning. Agra Professional Services (now Agra ProVision) and Earth
Wise Enterprise conducted and presented an assessment of internationally sourced
resource materials for experts as well as hand-out materials for farmers and manuals for
FFs. Printed, electronic and audio-visual materials were screened.
After a joint review, the group of experts and stakeholders felt that it would be worthwhile
to develop a new comprehensive background “CBRLM Reader” for facilitators. The
rationale was that a “manual” could easily lead to automatic repetition of a pre-scribed
facilitation procedure rather than encouraging as much as possible creativity and adaption
to specific circumstances. Facilitation principles and suggestions for presentation and
facilitation methodologies would be discussed, demonstrated and taught in practice.
The objective with the reader was to create a richly illustrated book, written in a non-
academic style and linking every day observations by farmers, their traditional practices,
the latest insights of science regarding ecological literacy as well as evidence and
experiences of farmers who have achieved on-going economic success and land restoration
Project Implementation CBRLM Sub-Activity Final Report
Page | 44
with the practices of combined herding, planned grazing and managing for herd
productivity.
Because there were already three suitable manuals for community animal health workers
and also a current manual on livestock marketing available, it was decided to focus the
livestock management and marketing section on the underlying principles as they relate
specifically to combined herding, planned grazing and herd productivity, while referring to
other manuals for technical details on disease management and livestock husbandry.
The training coordinator was commissioned to collate the CBRLM reader with input from
the component experts of the CBRLM team. The Country Pilot Partnership (CPP) team co-
sponsored the design and production of the reader, because they were interested in
training materials that would complement integrated rangeland and livestock local level
monitoring guidelines, subsequently also compiled the CBRLM training expert.
The writing and illustration work started in September 2010. Stakeholders and partners
(DEES, CPP, NNFU, mentorship programs of Agribank and of the Meat Board, private
consultants) were given drafts for comments and suggestions for improvements. Of the
final first draft 160 copies were printed in March 2011. The procurement of suitable
illustrations had been very difficult at the time and eventually some of them were re-done
to obtain a more coherent style. In mid 2011 the second print run of 1000 copies was
completed. The bulk of the books were distributed to DEES, all field facilitators and each GA
received a copy as well as other interested stakeholders. The mentors of the Meatboard
also received copies and GIZ bought 300 copies for distribution to participants of their
agricultural vocational training project. NGO’s, organizations workings with communal
farmers and the Polytechnic of Namibia also makes use of this book.
Following the reader was the production of Local Level Monitoring Guidelines for
Rangeland and Livestock Production. A number of DEES staff linked to the CPP program
were introduced to this tool.
Due to the emerging needs identified in the communities, the production of further written
training and facilitation materials went concurrently and sometimes even after actual
training of facilitators, the mobilization and support of communities had started. Initial
drafts were field tested before being produced in larger quantities. The approach was to try
and keep messages as succinct as possible so that they could be memorised, rather than
creating “text” books of written manuals which tend to be hardly read, considering the
general tendency among rural communities as well as students in Namibia.
During 2012, facilitators requested large size visual illustrations to help them explain the
principles of CBRLM. We discussed at length whether electronic, i.e. power point
presentations would be appropriate, or a hard copy form that is not dependent on
electricity and projection conditions. Finally, a series of full colour illustrations were
conceptualized with input from the team of experts and DEES chief extension officers and
produced with the help of professional illustrators and layout artists. They were ring-bound
to a self-supporting flipchart stand and key messages for each poster are printed to the
back of the previous poster – to guide less practiced facilitators. This aid was created to fast
track the development and confidence of field facilitators. Of course these illustrations can
Project Implementation CBRLM Sub-Activity Final Report
Page | 45
all be used as power point presentations as well. Guidelines for using (and not using) this
field flipchart were written and printed. These materials were mainly utilised for
mobilisation and grazing planning.
Guidelines for Community Mobilization and Facilitation for CBRLM field facilitators were
drafted and distributed in November 2011. During 2012 and 2013 case study materials and
various planning and record keeping forms were developed and translated into Otjiherero,
Oshindonga and Rukwangali to train facilitators and GA committees in planning and
financial record keeping.
OUTCOMES AND LESSONS
In general the training materials developed were fit for purpose. However, some of the
tools were not as widely used as hoped. For example the local level monitoring guide for
rangeland and livestock production was not used.
The guidelines for community mobilization and facilitation required to be supplemented by
various planning and record keeping forms. Implementation experience showed that these
guidelines need to be improved upon, especially since additional training needs were
identified, such as the establishment, management and administration of a GA fund for
joint expenses and structured decision making that helps integrate the components of
CBRLM.
2.2.4.3 TRAINING OF FACILITATORS
The overall strategy was that the component leaders/experts would equip field facilitators
with the necessary knowledge and skills and that the field facilitators in turn would
facilitate learning, planning and review sessions with the grazing area communities. The
original budget provided for three, at the most four training-of-trainers sessions, each three
to four days long, after which the facilitators would be ready to implement all the
components in the GAs. Because the majority of field facilitators had some academic
agricultural training, the project leadership perceived that this orientation would
sufficiently prepare them for their tasks of mobilizing and supporting GA communities.
At the end of 2012 the community development component and the training component
worked closely together in developing an approach for governance and joint planning that
would take care of the diverse social settings across the regions. We realised that
facilitators needed additional facilitation techniques and planning procedures that would
support and speed up the effective organisation, leadership and cohesion of GA
communities.
At the beginning of 2013, a new program of in-field training started: Sessions were led by
professional trainers with good experience in facilitation as well as integrated planning,
decision making, record keeping and all necessary aspects of rangeland and livestock
production i.e. who had a proven combination of subject matter knowledge and facilitation
skills and experience.
The objective of in-field training was to role-model the facilitation and training in real-life
circumstances – under a tree or local shelter, in any kind of weather, without electricity,
visiting participants and facilitators staying in tents, simple catering by residents from the
Project Implementation CBRLM Sub-Activity Final Report
Page | 46
village, the opportunity to observe and work with the livestock and land of the people in a
GA and adapting the training examples to these realities.
A preparatory planning and training session was held for the facilitators (including DEES
staff) from each cluster of regional teams to ensure that the logistical circumstances for
training in a GA would be conducive.
Formal assessment of field staff was conducted in 2012 and again in mid 2014 to ascertain
strengths and weaknesses and to identify remaining skills gaps. 18 successful GOPA-CBRLM
facilitators, 10 MAWF DEES AET’s and 2 IRDNC technical support staff were awarded project
specific certificates. National accreditation of these qualifications is not available yet. Both
professional trainers working for the CBRLM pilot project are actively engaged in the
development of Competency-Based Vocational Education and Training programmes and
unit standards.
OUTCOMES AND LESSONS
The training coordinator was engaged after the production of the CBRLM reader only.
There was no time for analysing training needs of both facilitators and farmers in a
systematic way. The skills development was not clearly aligned to a task analysis but was
informed by experience and recommendations of some component leaders and the
contracted training coordinator and the initial implementation plan and budget of the
implementer.
It was assumed that the experts/component leaders all had the same understanding of
CBRLM and how their component input would best contribute to the overall adoption of
CBRLM and the deliverables of the implementation contract. This turned out to be only
partially true and led to frustration on the part of some expert trainers.
Another assumption was that component experts would also be the best suited trainers or
facilitators of learning and new behaviour, without clarifying what underlying learning
theory and practical process each would use to convey messages and develop skills.
Right at the beginning, when there were some differences of approach and opinion on
technical aspects among the component leaders, outside experts, in this case
internationally leading livestock farmers and consultants for planned grazing, were engaged
to help explain herd production and the principles of decision-making that helps to address
root causes and compares the marginal reaction of various possible interventions and
investments over time.
2.2.4.4 EXCHANGE VISITS
Initially, it was a priority to develop a consistent set of messages and approaches across the
culturally and geographically diverse regions. FFs were taken on an exposure visit to Erora
GA in the Kunene region. With previous support from IRDNC, Erora GA had been practicing
PGCH for some years already and their success had convinced researchers, farmers and
support organizations of the multiple benefits and potential of CBRLM. The exposure visits
were always combined with practical presentations and discussion led by the component
experts. After two field facilitator training and planning sessions for facilitators from all
regions, also called “ToTs”, it was found more productive and logistically effective to split
Project Implementation CBRLM Sub-Activity Final Report
Page | 47
the group into two – the Western cluster of Omusati, Oshana and Kunene and the Eastern
cluster of Oshikoto, Ohangwena and Kavango regions and later sometimes even into three
or four clustered teams to allow for language specific training.
Other exposure visits to Erora GA were organized for groups of traditional leaders,
influential farmers and herders from the other regions. However, the cost and logistics
were big. In addition, some concerns by farmers in Kavango or Ohangwena were not
adequately addressed by the farmers from Kunene. Therefore, it was agreed to speed up
implementation and support to create regional “Demo GAs”. Visiting groups could travel to
and from these sites within one day – or possibly stay overnight at less logistical effort and
cost.
OUTCOMES AND LESSONS
While receiving massive support in terms of facilitation and other project inputs, the Demo
GAs were not utilized as intended. Many of them did not perform in a way that they could
be used as example sites. Due to the time pressure to deliver outcomes, some Demo GAs
served as demonstration sites of project outputs rather than evolving into an exemplary
site demonstrating potential project outcomes. Material and other support should not over-
ride the intrinsic motivation and own contribution by farmers in a GA. Any GA should be
considered to host exposure and exchange visits for specific reasons and specific times and
audiences rather than having to uphold a generalized standard. Hosting visits can give a GA
a motivational boost. However, using one GA as a host too often can also lead to fatigue.
Well-performing and more accessible GAs were selected to host “cluster trainings”, where
representatives from many GAs were brought together for a training session at a GA. At the
end of the project more emphasis was placed on this reduced form of “exchange visit”.
2.2.4.5 GA-LEVEL TRAINING
One of the key realisations was that “implementation” and training of farmers were
sometimes indistinguishable. Nearly all steps of the CBRLM process require learning new
information as well as changing current behaviour and customs. “Knowledge and skills
transfer” had to combine with “starting and running a new business or organization” in
order to address the adult learning needs. The facilitators effectively had to shift gears
between being mobiliser, trainer, on-the-job skills coach, mentor, mediator between
community members, event organizer, logistics person – as well as data collectors for the
project’s monitoring and evaluation component.
Community activators were employed in all regions to be the main point of contact
between the FFs and the communities. The role of community activators was to take over
some of the burden of liaison with communities, organizing meetings and events as well as
data collection. They were employed by the project until mid 2012. In Kavango, they were
even employed until the end of the project.
In 2012, the project started to structure planning and reporting for training and support
along the following 6 aspects:
Mobilization around CBRLM principles and getting commitment from farmers to
start CBRLM
Project Implementation CBRLM Sub-Activity Final Report
Page | 48
Combined Herding and Grazing Planning
Livestock Production and Management + Marketing of Cattle and Small Stock
through Grazing Area Livestock Agent (GALA) training and through livestock
management training to Agricultural Extension Agents
Grazing Area Leadership and Decision Making and Professional Herder training
Budgeting, Bookkeeping and Financial Monitoring
Water point Infrastructure design and maintenance
For the sake of logistical efficiency, some of the above topics were clustered differently to
the above groupings. Professional Herder (or herder trainer) training was conducted
sometimes in conjunction with grazing planning; Grazing Area Leadership and Decision
Making mostly in conjunction with budgeting and sometimes in conjunction with
bookkeeping.
Some training sessions, which were targeting only committee members or herders, were
held for clusters of GAs – again combining the power of exchange visits where farmers can
learn from other farmers with more structured learning.
During 2012 the need for more intensive training and coaching of herders was identified. It
was observed that in some GA’s there were effective head of herders and in others not. A
very able herder who had lost his job on a commercial farm when the farmer retired was
engaged and various options for capacitating and encouraging herders were looked at.
There was the challenge that FFs hardly stayed in one GA for more than one or two days
and during that time were mostly engaged in meetings and training sessions with GA
committee members and livestock owners. To address this challenge, herder trainers were
identified from among those GAs where combined herding was successfully and
consistently practiced. Those herders who were willing to further improve their
performance and who were prepared to leave their home GA were trained to visit other
GAs in their region for some days, role-modelling practical skills and attitudes and helping
to organize herding shifts, etc. They received follow-up training and participated in an
exchange workshop with herders from Kenya and Zimbabwe in October 2013.
An additional professional trainer was engaged on a daily contract basis from the beginning
of 2013 to help facilitate the training for GA Leadership and Decision Making, Budgeting
and Bookkeeping as well as the Professional Herder and Grazing Planning training.
Training for water point committees and for water point care takers was planned with all
the regional teams of the Directorate of Water Supply and Sanitation Coordination (DWSSC)
and their supervisor from the Windhoek head office. The CBRLM project covered the costs
of the clustered training workshops, but the training was conducted by DWSSC staff.
Apart from low-stress livestock handling and combined herding, all livestock-related
training to DEES AETs, CBRLM FFs and to specific GA Livestock Agents was planned and
conducted by the livestock expert independently from the rest of the training and
implementation program (see section 2.2.5.2 below).
Project Implementation CBRLM Sub-Activity Final Report
Page | 49
Once the regional livestock marketing cooperatives were revived and/or established in
2012 (see section 2.2.6.4 below), the training coordinator of CBRLM was asked to share her
experiences with a cooperative expert from USA to help link the production with the
marketing aspect into a whole-chain approach. The trainer introduced the decision-making
and budgeting processes that were successfully used with GA committees to the
cooperative boards and staff.
The training coordinator also responded to a need from the central cooperative secretariat
to conduct a skills gap analysis for segments of the cooperative staff, technical support
agencies and cooperative boards to help inform further training needs and approaches.
Based on this, a computer accounting program was identified and purchased for all the
cooperatives and training for the office administrators was organized. The professional
trainers and two former CBRLM support staff are being prepared to coach and mentor the
office administrators in administrative, financial control and planning tasks in future.
OUTCOMES AND LESSONS
The timing of contractual deliverables (distribution of bulls and goats, household
inventories, etc.) forced the implementation of some steps that did not flow with the
naturally evolving needs and capacity of both farming communities and also of facilitators.
This caused some delays in roll-out of training and planning to communities and/or the
need for repetition when the attention of participants was distracted.
One of the challenges was that this process of facilitation and its implications for general
project implementation was not understood in the same way by members of the
management team. While there was a positive openness to develop and extend facilitator
training and functions, their roles and responsibilities were often blurred, making it difficult
for them to prioritise.
Considered a separate component in the organisational structure of CBRLM, the training
component effectively required the integration of the other five components of CBRLM to
be effective when working with both facilitators and farmers. During the course of project
implementation it was often realized that the integration of the components would need to
improve. This challenge was taken up partly by integrating the components in the GA
leadership and decision-making and budgeting training.
There were advantages of having FFs who belong to GA communities in that they had
intimate knowledge of the community. However, it was also found that there were
disadvantages. Often being livestock owners and potential CBRLM beneficiaries themselves,
FFs who were community members were facing conflicts of interest and in some cases
might have influenced decisions to have their community benefit in particular rather than
in the best interest of the CBRLM project. Such conflicts of interest might be less of an issue
in projects where incentives in the form of material benefits play a less prominent role than
in CBRLM.
Project Implementation CBRLM Sub-Activity Final Report
Page | 50
2.2.4.6 TRAINING CHALLENGES AND RECOMMENDATIONS
Although some challenges were mentioned before, the following is a summary of
challenges that must be taken into account for future capacity-building initiatives:
Field staff needs time to digest and internalise material to build experience and
confidence and to be able to adapt to GA specific circumstances and to integrate all the
aspects of CBRLM. Coaching and mentoring of individuals must follow group training to
help develop individual potential. The “whole production chain” approach of CBLRM
requires individuals to have sufficient knowledge of a wide range of subjects and
practical skills. This requires a combination of training, coaching and mentoring.
Due to the diversity of the subject matter, knowledge and practical and facilitation skills
required by facilitators, some of the FFs may not adequately perform in all of these.
Strategic building of work teams where team members can complement one another
may be preferable in cases where individuals are not sufficiently good “all-rounders”.
There was not enough monitoring of how the FFs, or teams of FFs actually did their jobs
in the field.
While experiential learning and learning from seeing real results has been addressed in
the pilot phase of CBRLM, some of the benefits promised by the CBRLM approach take
too long to manifest in sufficiently tangible outcomes, such as the re-establishment of
perennial grass sward. Shorter-term outcomes, such as increased crop yield through
the use of temporary mobile kraals where livestock overnight on crop fields may
provide the opportunity to build familiarity and trust between the support agency and
the farmers and may also be more effective as an initial motivator for farmers to start
managing their operations more pro-actively and then working together as a group. An
alternative would be the facilitation of Namibia-specific Conservation Agriculture.
Absentee livestock farmers are difficult to reach and involve. More frequent and well-
written and well-presented contributions for the public media should be distributed.
This should become a national initiative, complemented by regional and local call-in
radio shows. More mobilisation and also more training and planning sessions should be
held in towns – both north and south of the veterinary cordon fence with all farmers
whose livestock is in an organized CBRLM GA. Recognising the real constraints and
production goals of livestock owners, this should help to build a closer bond and
collaboration between absentee farmers and residential farmers and herders.
Traditional authority and regional and local government personnel and leaders were
insufficiently involved in deepening their learning of new knowledge, skills and practical
strategies. Buy-in and governance support from political and community leaders across
the NCAs should be supported through real-life interaction with farmers who have
experience with CBRLM as well as through time-efficient presentation and well-
facilitated discussion forums.
Future training interventions should be preceded by a more structured skills gap
analysis, aided by a participatory job task analysis for the various role players in a
grazing area as well as in the support organizations serving them. This should be
complemented by a sound selection policy and process for identifying candidates for
learning and for hiring. This should apply to the selection of “learners” as well as
facilitators, coaches and mentors.

Project Implementation CBRLM Sub-Activity Final Report
Page | 51
One of the assumptions was that facilitators and regional managers and even expert
staff have all the required computer and internet skills and the ability to handle and use
other electronic equipment such as cameras and GPS. This was not always the case and
communications and record-keeping were negatively affected by this gap. Assessment
of real-life performance on computer and internet utilisation and maintenance should
be conducted and training should be arranged for those individuals who require it.
Training, coaching and mentoring interventions should be followed up with de-briefing
and review sessions where individuals and/or groups can reflect on what worked well
and what did not work well. This will help to customize approaches to geographic and
social conditions. Donors and support organizations must be prepared to allow for
variation in outcomes and in modalities and even in reporting formats.
Training of DEES staff in facilitation did not work well in some aspects of CBRLM. This
may be due to the current mode of information sharing by of AETs and their previous
training, which inclines them to regard themselves as advisers and technical experts,
rather than pro-active listeners and partners in developing solutions to problems.
However, some individual DEES staff showed consistent commitment and inspired
personal engagement and should be engaged by follow-up interventions.
Inconsistent participation of various GA committee members makes it difficult to build
on what was dealt with during an earlier learning and planning session. This may be
partly addressed by more consciously discussing and presenting career development
options that go beyond the immediate role people play in their GA. These career paths
could include professional herders and (communal) farm managers. Again, it is
important to balance an “organic” evolution of realizations, needs and opportunities
with a helpful overview of intervention activities – clearly stating the needs and
constraints of all, including the needs of support organizations and services.
Household and livestock inventories were taken without using that information enough
for real life planning and monitoring of GA management. The “component structure” of
the project sometimes limited the ability to integrate all skills into a complementary
application. Technical support staff, lead and professional trainers, coaches and
mentors that can link planning and hands-on livestock handling and production, grazing
planning, etc. are needed. Strategic marking of animals with their year of birth can
reduce the time and stress of doing regular inventories according to total number of
classes, rather than individual animal records. In the coming years the emerging
livestock marketing cooperatives are expected to further encourage the use of ear tags
and this may aid selective monitoring for specific purposes.
Livestock farming rarely provides the daily bread for people. Because it is a long term
investment, farmers are less directly and not immediately hurt by livestock losses from
poor management. In these cases, there is limited internal motivation to change
behaviour and habits. Integrated curricula or learning programs would help all target
groups to be more self-directed and recognizing collaboration opportunities. Direct
learning and planning should be combined with opportunities for individual and group
reflection, allowing the information to sink in and to be digested before having to make
commitments.
Most subsistence and residential farmers engage in mixed farming. The rapid expansion
of low-yield crop fields leads to diminished areas available for grazing livestock. Apart
Project Implementation CBRLM Sub-Activity Final Report
Page | 52
from this resource challenge, DEES often focus on crop production while the various
mentorship schemes focus on either livestock or crop or horticulture specific extension
services and there are times during the year where the various support services
compete for attention from farmers. Future training and facilitation should incorporate
training and planning interventions for crop- and livestock production and marketing.
Local review of failures and successes were not adequately utilised to improve
management and planning. Here there is an opportunity to put into action the readily
available Guidelines for Local Level Rangeland and Livestock Monitoring, produced for
the CPP in conjunction with the CBRLM reader.
It is recommended that FFs are selected who come from the local area. For
interventions like CBRLM that provide major incentives/material benefits to
communities, it might not be appropriate if the FFs are members of the GA
communities they work with, because of potential conflicts of interest. If conflicts of
interest can be ruled out, however, the employment of staff from the respective
communities seems a viable option. In CBRLM, employment of community activators
from the GA communities in Kavango regions did work well on balance by taking some
of the liaison and organizational work away from FFs.
Project Implementation CBRLM Sub-Activity Final Report
Page | 53
2.2.5 LIVESTOCK MANAGEMENT
2.2.5.1 BRIEF COMPONENT RATIONALE
The livestock management component was initially designed to provide livestock-related
training as the major intervention to achieve the intended results as expected in the
contract. It was assumed that the status quo of poor livestock management and low
productivity was behavioural and driven by ignorance on the side of communal farmers. It
was anticipated that appropriate training and participatory facilitation would be adequate
to attain expected deliverables.
The contract for CBRLM by the MCA-N recognized that the weight of cattle at the ideal
marketing age of two years was perpetually below acceptable levels of at least 300kg in
most cases. It was therefore the mandate of CBRLM to implement training interventions
that would help farmers produce 2 year old steers with a minimum of 300kgs of weight.
Secondly, the contract also required that CBRLM implement strategies that would assist
farmers within the GAs to attain reasonable calving and weaning percentages to allow them
to farm sustainably. A calving percentage of 60% and a weaning rate of 90% of these calves
were considered as minimum deliverables that will make farmers within the RIAs to farm
with livestock sustainably and commercially.
As a result, the intervention was targeting to achieve these deliverables through training
and mentoring of FFs to facilitate and mentor farmers into attaining these deliverables. The
training was expected to focus on the following areas:
Animal nutrition: seasonal needs, and supplementation options
Feeding and improvement of calving cycles
Breeding programs, controlled breeding
Improving calving percentages and reducing early mortality
Calving problems, assisted delivery techniques
Dehorning
Vaccination
Sickness diagnosis and treatment (e.g. internal parasites in small stock)
Herd management
Goats and poultry management
During the inception period, it was anticipated that training to this extent was possible and
that training was going to be demand-driven by farmers, delivered in the context of a
management plan and that it was going to be practically oriented, involving experiential
learning. Early into the intervention, the project defined a strategic approach to follow,
which would focus on five main strategic interventions namely:
1. General animal husbandry practices
2. Improved nutrition and health
3. Breeding and selection
4. Control of internal parasites in small stock
5. Improved poultry production
Project Implementation CBRLM Sub-Activity Final Report
Page | 54
Note that the last item of poultry production was discarded after realizing the extent of the
core livestock needs. This item was initially meant to be a gender integration approach.
Gender integration was instead addressed through other activities, for example by the
Small Stock Pass-On Scheme, which was added to the livestock component at a later stage
(see section 2.2.5.4).
2.2.5.2 TRAINING IN LIVESTOCK PRODUCTION AND MANAGEMENT
Livestock-related training was disaggregated into two levels namely intensive training and
coaching of FFs and Agriculture Extension Technicians (AETs) and secondly training and
facilitation of adoption of the appropriate technology of farmers within the GAs. These two
trainings were dealt with and implemented in slightly different ways.
However, both staff and farmer training was split in two modules (1 and 2). Module 1 was
comprised of
Low stress handling of livestock and herding;
General introduction to livestock management and production goals;
Livestock reproduction, selection and breeding;
Nutrition;
Herd production issues; and
Parasite management
Module 2 was comprised of:
Herd restructuring activities;
Detailed teaching on common diseases in the NCAs;
Zoonotic and notifiable diseases;
Techniques for assisted calving and kidding and the care of the new born;
Practical demonstration on management of internal parasites in small stock;
Demonstration of animal husbandry practices; and
Livestock management and production plan and how to implement it
TRAINING AND COACHING OF FFS AND AETS
Livestock training initially targeted FFs, AETs, GOPA-CBRLM experts and some livestock
mentors employed by the Meat-Board Livestock Producer Forum (LPF) and the Agribank
Farmer Support Program (FSP). The training was designed to have all these stakeholders
within the project area regions trained in livestock production, health and marketing issues
so that the message to farmers would be standardized. It was realized that one big
challenge preventing adoption of improved livestock production and management
technologies was the inconsistency of livestock-related messages given to the same farmer
by various development stakeholders.
Implementation of module 1 was done in two split groups and was carried out in the year
2011. The first was done to target all stakeholders in the western regions of Kunene,
Omusati and Oshana and was carried out in Opuwo in the Kunene region. The second
session was done in Rundu and included stakeholders working in Ohangwena, Oshikoto and
Kavango regions.
Project Implementation CBRLM Sub-Activity Final Report
Page | 55
The objectives of the training were:
To instil basic livestock management literacy;
To provide guidelines on how to facilitate and implement livestock management in
the GAs;
To give basic livestock marketing literacy and equip FFs to facilitate livestock
marketing issues;
To give basic information on the use of GPS to enable FFs to do mapping;
To train FFs on the recent updates on field data collection forms; and
To harmonize the message conveyed to farmers by the key stakeholders involved in
farmer mentorship and training with regard to livestock production and marketing
issues
Although the training was rated as successful and interesting, the diversity of topics was a
concern for assimilation. It was noted that more time was needed in order to do justice to
the topics particularly for the trainees that had scant back ground on agricultural science.
The training brought into picture the complete CBRLM approach and FFs were particularly
happy as they now had a full understanding of what was required of them in the facilitation
process. However, it was also a source of division among the different implementing
agencies (i.e. CBRLM versus FSP versus LPF) due to the disparity in agriculture science
knowledge and the main approach advocated. The LPF project in particular was using
successful farmers as mentors of the target groups in order to harness motivation based on
their success stories. They often were oblivious of some technology and or would advocate
and generalize anecdotal approaches that have little or no scientific basis as experienced
under their own farming environments. They were therefore transposing their experience
in totally different environments. As such, our attempts to create common integrated
messages for the target farmers did not happen as smoothly as anticipated. It was also one
of the reasons why different implementing agencies remained defragmented despite the
fact that they were all targeting the same farmer groups. In fact, during subsequent
trainings, mentors did not attend CBRLM trainings as expected. However, interaction in the
field during implementation grew especially with some FSP mentors who had strong
agricultural training background mixed with on-farm experience.
Among the FFs, the quality and speed of livestock production and management
implementation was also governed by the level of background training and ability to
simulate the subject matter. Even among those FFs that had stronger agriculture
background, many were found wanting in terms of their experience and confidence in
livestock management since their background was largely crop and forestry. This scenario
became a stumbling block and resulted in extra burden on the livestock experts, who were
needed more often on the ground to provide mentoring and at times even carry out
facilitation and mobilization on behalf of the FFs. As such it can be concluded that in all
areas where the FFs were grossly deficient regarding basic livestock management science,
implementation was expert-driven. During 2012, the livestock experts adopted a strategy of
doing actual implementation and training of farmers and use that platform to
simultaneously further train and mentor FFs and AETs.
Project Implementation CBRLM Sub-Activity Final Report
Page | 56
Module 2 training was carried out during 2013 and was split into four different sessions.
The increase from two groups (east and west) to four (according to CBRLM regional teams)
was necessitated by two factors. Firstly, the strategy aimed at keeping the group of
participants small (ideally not more than 20 participants) to ensure every individual
coaching, participation and practice during the practical training sessions. Secondly, the
number of participants had ballooned greatly following a request by the MAWF’s DEES
regional management that they needed all AETs to be adequately trained in livestock
production and management, irrespective of whether they were responsible for a CBRLM
intervention areas or not. Much value was foreseen in the training of the AETs by the DEES
management. They indicated that training of AETs was a main-streaming issue to
adequately equip the ministry to take over CBRLM activities beyond the MCA-N compact.
This resulted in a more expanded curriculum being used beyond the previous strategy of
module 1 and 2. The training was re-designed to take place over six continuous days, hence
the corresponding logistics were quite intense.
In order to make the training and skills transfer more relevant, the training sessions were
designed to take place in the grazing areas and not in lecture halls or towns. Thus the
training was a simulation of a real field situation that the AETs and FFs face on each day of
their work. This was found to be a success because there was no detraction for the
participants in the remote grazing areas such as mobile phone network and shops. The
absence of detractions and village setup also necessitated participants to carryout practical
demonstrations and practice early in the morning prior to livestock going for combined
grazing and herding. As such the training was appreciated by the GA livestock owners in
that interfered minimally with their routine planned grazing and combined herding
patterns. The training curriculum had a predefined structure, but was deliberately kept
open to deal with practical issues present in the GA or raised by the participants,
particularly the AETs. This approach was meant to ensure that mentorship and skills
transfer became largely demand-driven and relevant to the deficiencies within the
knowledge base of the participants.
Following the successful training and skill transfer, all the trainees acknowledged the
initiative and the empowerment. However they pointed towards the need for animal
husbandry kits for thorough empowerment. It was understood that under the MAWF
budget, there was no allowance made for them to procure these vital tools. CBRLM through
MCA-N responded and procured animal husbandry kits for every Agriculture Development
Centre (ADC) in the CBRLM project regions. A total of 70 animal husbandry kits were given
to 70 ADCs across all regions (see Table 3 for details). All tools were engraved with the
identification mark “CBRLM - MAWF”. Handover ceremonies were organized in every
region where by the respective regional councils were invited to witness the sustainable
empowerment of the AETs by the project. In all regions, there was great appreciation by
both the regional council and DEES management that the training coupled with the
provision of animal husbandry kits was real empowerment of the Ministry to ensure
takeover of CBRLM activities beyond the MCA-N compact.
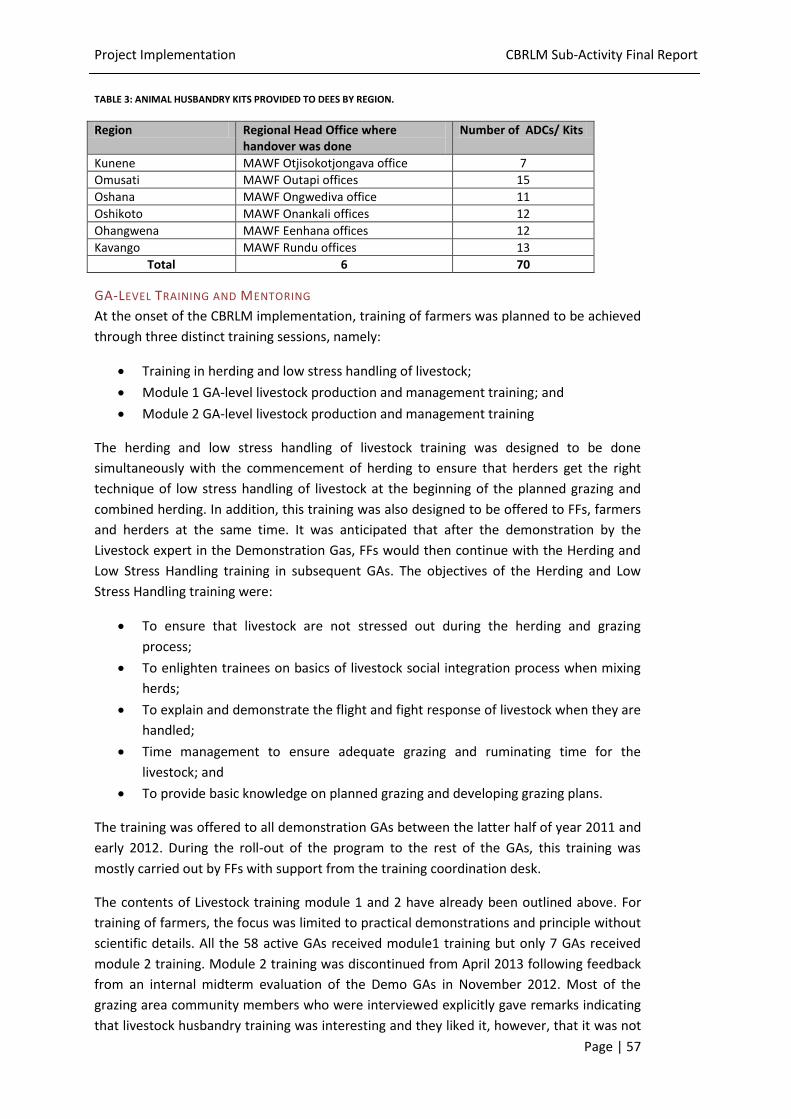
Project Implementation CBRLM Sub-Activity Final Report
Page | 57
TABLE 3: ANIMAL HUSBANDRY KITS PROVIDED TO DEES BY REGION.
Region Regional Head Office where handover was done
Number of ADCs/ Kits
Kunene MAWF Otjisokotjongava office 7
Omusati MAWF Outapi offices 15
Oshana MAWF Ongwediva office 11
Oshikoto MAWF Onankali offices 12
Ohangwena MAWF Eenhana offices 12
Kavango MAWF Rundu offices 13
Total 6 70
GA-LEVEL TRAINING AND MENTORING
At the onset of the CBRLM implementation, training of farmers was planned to be achieved
through three distinct training sessions, namely:
Training in herding and low stress handling of livestock;
Module 1 GA-level livestock production and management training; and
Module 2 GA-level livestock production and management training
The herding and low stress handling of livestock training was designed to be done
simultaneously with the commencement of herding to ensure that herders get the right
technique of low stress handling of livestock at the beginning of the planned grazing and
combined herding. In addition, this training was also designed to be offered to FFs, farmers
and herders at the same time. It was anticipated that after the demonstration by the
Livestock expert in the Demonstration Gas, FFs would then continue with the Herding and
Low Stress Handling training in subsequent GAs. The objectives of the Herding and Low
Stress Handling training were:
To ensure that livestock are not stressed out during the herding and grazing
process;
To enlighten trainees on basics of livestock social integration process when mixing
herds;
To explain and demonstrate the flight and fight response of livestock when they are
handled;
Time management to ensure adequate grazing and ruminating time for the
livestock; and
To provide basic knowledge on planned grazing and developing grazing plans.
The training was offered to all demonstration GAs between the latter half of year 2011 and
early 2012. During the roll-out of the program to the rest of the GAs, this training was
mostly carried out by FFs with support from the training coordination desk.
The contents of Livestock training module 1 and 2 have already been outlined above. For
training of farmers, the focus was limited to practical demonstrations and principle without
scientific details. All the 58 active GAs received module1 training but only 7 GAs received
module 2 training. Module 2 training was discontinued from April 2013 following feedback
from an internal midterm evaluation of the Demo GAs in November 2012. Most of the
grazing area community members who were interviewed explicitly gave remarks indicating
that livestock husbandry training was interesting and they liked it, however, that it was not
Project Implementation CBRLM Sub-Activity Final Report
Page | 58
easy for them to digest all the principles in an intensive short training. The level of the
training was found to be exceeding to their literacy in livestock principles. The training was
therefore changed to:
Give an overview (“helicopter view”) of principles that are mandatory for profitable
and sustainable livestock production. This training basically runs through the
livestock management plan highlighting why each of the principles in the
management plan is necessary and how it contributes to sustainable and profitable
livestock production.
Empower focal individuals who are directly involved with livestock management in
every grazing area to be perform basic husbandry activities with minimum external
facilitation in the GAs as well as helping surrounding communities with common
livestock production challenges.
Train and effectively transfer skills into FF and AETs to confidently advise farmers
on CBRLM livestock management. This was designed as an intensive scientific
principles review, demonstration and practical exposure to principles of sustainable
livestock husbandry. As it is envisaged that MAWF is the long term implementer of
CBLM it was found worth to spend time and resources in empowering them into
nurturing livestock extension.
GA-LEVEL OVERVIEW TRAINING
This training was offered to the whole GA community for every grazing area. The training
was also designed to take place during the late afternoon and into the night in order to
cater for the herders who spend most of the day herding livestock. Training was made
possible by using power point presentations. In order to ensure quality training, FFs
attended compulsory sessions that were led by the livestock expert and the assistant
livestock expert. Each FF attended at least two overview trainings before they were
considered ready to provide themselves the same training to other GAs. Practical sessions
were carried out in the morning following the power point presentation at night. These
trainings happened over two to three days, depending on the interest and demand for
practical demonstration by the communities.
All 58 GAs received the overview training of GA farmers and those who had intense interest
were identified as candidates for a deeper level training as described in the following.
GRAZING AREA LIVESTOCK ASSISTANTS (GALAS) TRAINING
All the 58 GAs were requested to identify and choose 2 to 3 people with intense interest
with livestock handling and management who were to undergo more practical, intensive
training and help the entire community to implement more technical activities in livestock
herd health, production and management. This training was called Grazing Area Livestock
Assistants (GALA) training. The GA communities were given factors to consider during the
selection of the candidates to be trained as GALAs. The criteria used in identifying GALAs
included:
Selection to be done by the whole GA community to ensure acceptance of the
GALAs.
Candidates were supposed to be resident within the community to ensure
availability in times of need.
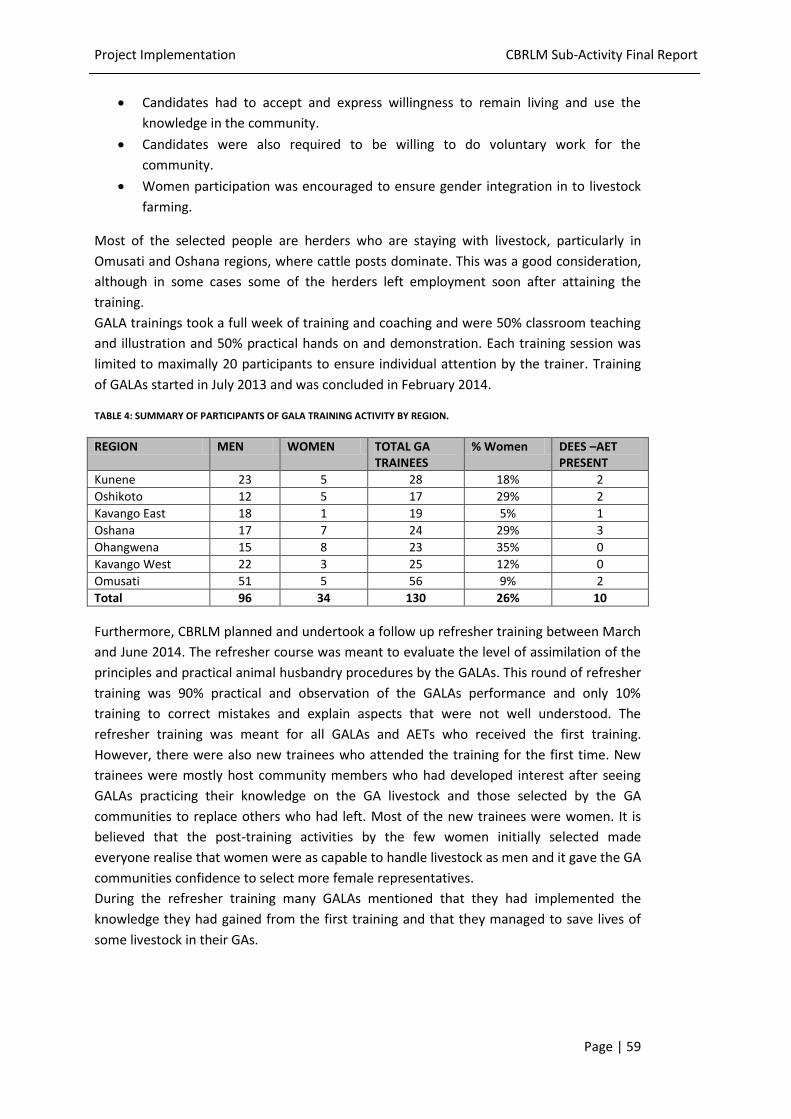
Project Implementation CBRLM Sub-Activity Final Report
Page | 59
Candidates had to accept and express willingness to remain living and use the
knowledge in the community.
Candidates were also required to be willing to do voluntary work for the
community.
Women participation was encouraged to ensure gender integration in to livestock
farming.
Most of the selected people are herders who are staying with livestock, particularly in
Omusati and Oshana regions, where cattle posts dominate. This was a good consideration,
although in some cases some of the herders left employment soon after attaining the
training.
GALA trainings took a full week of training and coaching and were 50% classroom teaching
and illustration and 50% practical hands on and demonstration. Each training session was
limited to maximally 20 participants to ensure individual attention by the trainer. Training
of GALAs started in July 2013 and was concluded in February 2014.
TABLE 4: SUMMARY OF PARTICIPANTS OF GALA TRAINING ACTIVITY BY REGION.
REGION MEN WOMEN TOTAL GA TRAINEES
% Women DEES –AET PRESENT
Kunene 23 5 28 18% 2
Oshikoto 12 5 17 29% 2
Kavango East 18 1 19 5% 1
Oshana 17 7 24 29% 3
Ohangwena 15 8 23 35% 0
Kavango West 22 3 25 12% 0
Omusati 51 5 56 9% 2
Total 96 34 130 26% 10
Furthermore, CBRLM planned and undertook a follow up refresher training between March
and June 2014. The refresher course was meant to evaluate the level of assimilation of the
principles and practical animal husbandry procedures by the GALAs. This round of refresher
training was 90% practical and observation of the GALAs performance and only 10%
training to correct mistakes and explain aspects that were not well understood. The
refresher training was meant for all GALAs and AETs who received the first training.
However, there were also new trainees who attended the training for the first time. New
trainees were mostly host community members who had developed interest after seeing
GALAs practicing their knowledge on the GA livestock and those selected by the GA
communities to replace others who had left. Most of the new trainees were women. It is
believed that the post-training activities by the few women initially selected made
everyone realise that women were as capable to handle livestock as men and it gave the GA
communities confidence to select more female representatives.
During the refresher training many GALAs mentioned that they had implemented the
knowledge they had gained from the first training and that they managed to save lives of
some livestock in their GAs.
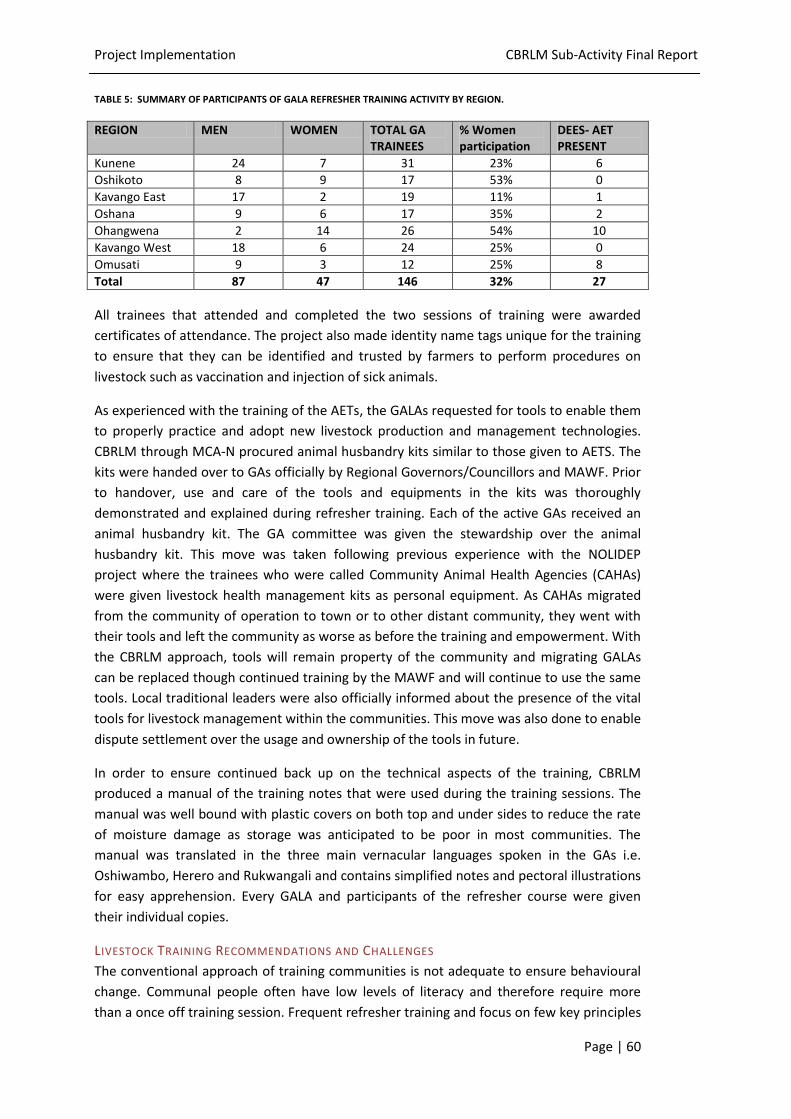
Project Implementation CBRLM Sub-Activity Final Report
Page | 60
TABLE 5: SUMMARY OF PARTICIPANTS OF GALA REFRESHER TRAINING ACTIVITY BY REGION.
REGION MEN WOMEN TOTAL GA TRAINEES
% Women participation
DEES- AET PRESENT
Kunene 24 7 31 23% 6
Oshikoto 8 9 17 53% 0
Kavango East 17 2 19 11% 1
Oshana 9 6 17 35% 2
Ohangwena 2 14 26 54% 10
Kavango West 18 6 24 25% 0
Omusati 9 3 12 25% 8
Total 87 47 146 32% 27
All trainees that attended and completed the two sessions of training were awarded
certificates of attendance. The project also made identity name tags unique for the training
to ensure that they can be identified and trusted by farmers to perform procedures on
livestock such as vaccination and injection of sick animals.
As experienced with the training of the AETs, the GALAs requested for tools to enable them
to properly practice and adopt new livestock production and management technologies.
CBRLM through MCA-N procured animal husbandry kits similar to those given to AETS. The
kits were handed over to GAs officially by Regional Governors/Councillors and MAWF. Prior
to handover, use and care of the tools and equipments in the kits was thoroughly
demonstrated and explained during refresher training. Each of the active GAs received an
animal husbandry kit. The GA committee was given the stewardship over the animal
husbandry kit. This move was taken following previous experience with the NOLIDEP
project where the trainees who were called Community Animal Health Agencies (CAHAs)
were given livestock health management kits as personal equipment. As CAHAs migrated
from the community of operation to town or to other distant community, they went with
their tools and left the community as worse as before the training and empowerment. With
the CBRLM approach, tools will remain property of the community and migrating GALAs
can be replaced though continued training by the MAWF and will continue to use the same
tools. Local traditional leaders were also officially informed about the presence of the vital
tools for livestock management within the communities. This move was also done to enable
dispute settlement over the usage and ownership of the tools in future.
In order to ensure continued back up on the technical aspects of the training, CBRLM
produced a manual of the training notes that were used during the training sessions. The
manual was well bound with plastic covers on both top and under sides to reduce the rate
of moisture damage as storage was anticipated to be poor in most communities. The
manual was translated in the three main vernacular languages spoken in the GAs i.e.
Oshiwambo, Herero and Rukwangali and contains simplified notes and pectoral illustrations
for easy apprehension. Every GALA and participants of the refresher course were given
their individual copies.
LIVESTOCK TRAINING RECOMMENDATIONS AND CHALLENGES
The conventional approach of training communities is not adequate to ensure behavioural
change. Communal people often have low levels of literacy and therefore require more
than a once off training session. Frequent refresher training and focus on few key principles
Project Implementation CBRLM Sub-Activity Final Report
Page | 61
at a time is needed to give fair level of understanding. Taking into account that CBRLM was
a paradigm shift with regards to livestock management, the time allocated for training and
coaching was not sufficient. For example, with the 58 grazing areas over 3 years of
implementation, the livestock experts spend on average 5 days and a maximum of 11 days
per GA. Given the extent of the livestock management and production curriculum, the
livestock experts had less than a day of interaction with the GA communities over the 3
years to discuss each of the main topics and principles around it as well as demonstrating
the practicality of each principle.
The assumption was that FF and AETs were able to properly do this. However, as stated
above, many of them were found wanting in this regard. The time spent for transferring
skills to these purported trainers was also inadequate given that they had a total of less
than 3 weeks of coaching over the 4 and half years of the project in livestock management.
Their time was divided among many other trainings and implementation i.e. rangeland
management, water infrastructure, financial management, community mobilisation and
facilitation, leadership training and M&E as well as administrative issues.
2.2.5.3 HERD (RE-) STRUCTURING, BULL SCHEME AND LIVESTOCK MANAGEMENT PLAN
When CBRLM livestock implementation started one of the challenges was to facilitate the
process of removal of non-productive animals. Previous project reports and surveys
reported that oxen were kept for too long without being removed from the herd leading to
undue herd growths, low productivity and poor meat quality when they are finally
marketed. It came apparent during the first year of our interaction that to change the herd
structure or composition of the GA herds was not going to be achieved by mere training of
principles of good livestock production and management training. An interactive strategy of
herd restructuring was therefore designed by the expert. This strategy was not easy to even
train FFs theoretically as it required understanding of every farmer’s reasons for keeping
their animals in a skew that did not support good productivity. The process is therefore
outlined here for clarity.
DEFINING PRODUCTION GOALS
Production goals were defined as the reasons why farmers keep animals. It was found out
that reasons for keeping livestock vary from region to region and from farmer to farmer.
Therefore, it was essential to engage all farmers within a given community to establish
common and individual livestock production goals. Farmers should feel that new
interventions are supporting rather than antagonising their way of farming. Therefore the
new interventions should be introduced as addressing the weak links in the community’s
livestock husbandry and production management to bring to full realisation of their
production goals. After listing GA common and individual production goals, facilitation was
carried out in order to align their thinking with the concept of production and productivity.
The concept of aligning production goals with production and productivity was achieved
using the concept of herd restructuring.
HERD RESTRUCTURING FOR EFFICIENT PRODUCTION AND PRODUCTIVITY
Herd restructuring is a process that was engaged in CBRLM to change the demographic
proportions of the different classes of livestock and that of non-productive versus the
productive animals. The restructuring process comes after livestock production literacy
Project Implementation CBRLM Sub-Activity Final Report
Page | 62
being demonstrated to the GA farmers. Farmers were made to realise that despite the
difference that they may have in terms of production goals, the common denominator is
that the breeding female must produce (e.g. cow must produce calves and doe must
produce kids) and that the more young ones a breeding female produces the more farmers
in the GA meet their production goals.
Removal of non-productive animals remains the only source to meet some of the expenses
associated with the production and creating a balance among the different classes (oxen,
steer, heifers, cows, bulls and calves). Non-productive animals were defined as broken
mouth breeding stock (old cows and bulls that have lost their teeth), steers and oxen (those
not earmarked for any production gaols such as draft animal power or cultural needs) and
heifers older than 3 years (because they should be carrying second pregnancy by that age).
This approach also enabled livestock marketing without following the traditional
approaches of telling farmers to sell their too many oxen which have created a stigma and
denial to market by many rural communities. An optimal proportion of a healthy cattle herd
was agreed upon as comprising circa 20% non-productive animals, 2% mature (active) bulls,
40-50% breeding females and 30-40% calves. Restructuring therefore looked at the level of
deviation of the prevailing herd structure from the model of a healthy productive herd
structure and analysis of the possible causes of the variation in order to address the actual
challenge. For example, not culling non-productive animals may cause the non-productive
category to increase or poor calving rate may cause artificial increase of the breeding
females.
Reproduction Assessment of Cows and Heifers
A huge challenge faced by CBRLM with regards to livestock management was the absence
of records that could be used to derive proper interventions for effective herd health and
production management. As such, the determination of livestock age in combination with
the historical knowledge of the farmers was used to build a baseline dataset and to
estimate the opportunity cost of the prevailing management system.
The entire herd was physically brought to the crush pen and all breeding females were aged
using their dentition status in combination with the historical knowledge of the number of
times each cow had calved. Other classes were also counted for the purpose of analysing
the herd structure. The implementation of this process followed the intensive training that
was given to FFs and AETs on ageing both cattle and small stock such that many of them
were able to accurately estimate the ages of cows up to the age of eight years with little
assistance. Although the process was very resource-intensive, it was necessary because it
created a number of desirable results:
Baseline information for future reference was created
Physical handling made farmers to develop a habit of hands on livestock
management
Demonstration and training to farmers on ageing was accomplished
Stock listing of high producing or non-productive animals was achieved and
understood easily by farmers without much explanation
Project Implementation CBRLM Sub-Activity Final Report
Page | 63
Health challenges were identified and some routine remedial procedures were
carried out simultaneously
However, note that this reproduction assessment was done only in roughly one third of all
CBRLM GAs. In other GAs, especially in Kavango and Ohangwena, the assessment technique
was only demonstrated to the community and discussions were held without
documentation. No comprehensive set of data is available from the reproduction
assessment activity, an activity on which considerable resources were spent. According to
the livestock expert, this is due to the overwhelming amount of work associated with all the
activities of the livestock component. It should be a lesson for the future that any kind of
such detailed on-the-ground assessments of livestock is extremely time- and work-intensive
and the effort required must not be underestimated.
Reproduction Assessment of Bulls
The bull reproduction assessment was designed to be done more critical than just looking
at age. Due to absence of records, a breeding soundness examination was performed with
all active and mature bulls in a GA herd. After the analysis, bulls were then categorised as
either potential good breeders or those that were inferior as bad breeders. In many
incidences, the findings tallied with general observations by the community although they
had never thought it as a problem. Most of the farmers took instant decisions to castrate all
bulls rated inferior as they could associate them with the low calving rates experienced.
BULL TO COW RATIO AND SUSTAINABLE HERD STRUCTURE
The next stage was to narrow down to the actual reasons why cows were actually not
showing calving rates for reasonable productivity levels. The data captured at the crush pen
was compiled to create an inventory and database for the entire GA combined herd. This
was of particular importance, since the wealthier members of the GA owned nearly all of
existing bulls in most GAs. These wealthier farmers always assumed to be fine in terms of
bulls without factoring in the breeding females of the poorer farmers in the same GA, while
the poorer farmers were in most cases relying on the rich for bull provision.
All bulls that were below acceptable levels of the breeding soundness examination were
categorise as non-productive animals and therefore they were not counted as bulls. All of
the 58 CBRLM GAs had insufficient numbers of bulls with the exception of two GAs. The bull
to breeding female ratio was therefore an area of critical concern, since the average ratio of
all GAs was 1:70 (ranging from 1:14 to 1:131). As such, cows were not harshly assed as non-
productive prior to correction of the bull to breeding female ratio.
The opportunity cost of remaining with inadequate bulls was compared with the possible
gain if the GA would purchase bulls to achieve an adequate bull to cow ratio of 1:25. The
exercise made GA farmers to realise that it was more expensive to farm with inadequate
bulls than to spend money on the procurement of perceivably expensive superior and
quality breeding bulls.

Project Implementation CBRLM Sub-Activity Final Report
Page | 64
BULL SCHEME
In order to improve their herd productivity, most of the GAs opted to acquire quality bulls
to address the insufficient bull to breeding female ratio. The choice to increase the number
of bulls in itself constituted a major herd restructuring measure in the majority of GAs
because
Introducing new bulls would bring a direct change to the herd composition.
Bulls are expensive and, therefore, to purchase them the farmers needed to sell
some livestock to raise the money. This also changed the herd composition.
Herd productivity literacy resulted in most GAs culling non-productive animals to
buy bulls thus correcting the anomalies of the proportions of the classes towards a
more desirable composition.
Undesirable and poor breeding bulls were culled from the herds and converted into
non-productive animals or draft animal power (change in productivity).
CBRLM also responded to ensure that this crucial aspect of livestock management is
achieved by introducing the bull scheme with generous support from MCA-N. However, the
allocated funds were insufficient to address the bull needs for all active GAs. Therefore,
bulls procured under the compact were going to be given to GAs on a cost recovery basis.
The money collected was then used to procure more bulls in a revolving fund scheme. The
compact procured an initial 90 bulls with the anticipation that CBRLM would also procure
an equivalent number of bulls or a minimum of 75 bulls. The implementation of the bull
scheme was a big undertaking that added to the burden of the livestock component
because it was not initially planned for. However, it was demand-driven and contributed a
great deal to CBRLM livestock component achieving the desired results (see Table 18 in the
Annex).
A total of 115 bulls were procured and distributed to a total of 41 GAs. As of the closing of
the CBRLM implementation, most GAs had paid for their bulls and a total of 73.95% of
agreed repayment amount was recovered. About 10% of the bulls were not paid for
because they either got lost or died with reasonable mitigation. This leaves just about
11.05% of the agreed repayment as defaulted by a minority of GAs, some of which obtained
the bulls very late into the implementation. For more details on the bull scheme see the
annex.
LIVESTOCK MANAGEMENT PLAN
The provision of bulls resulted in the development of a livestock management plan as GA
communities needed to have a definite plan towards addressing critical issues in their
productivity. It became necessary to know which animals were non-productive and could
be sold for value addition. Secondly, the issue of getting an organised market for better
pricing and easy sells resulted in the inclusion of a livestock marketing plan in the livestock
management plan. Monitoring and record keeping would ensure sustainability of the LMP.
A few crucial records were introduced to the GA communities to enable them to track and
measure the change in productivity.
Reproduction performance record
Body condition score record
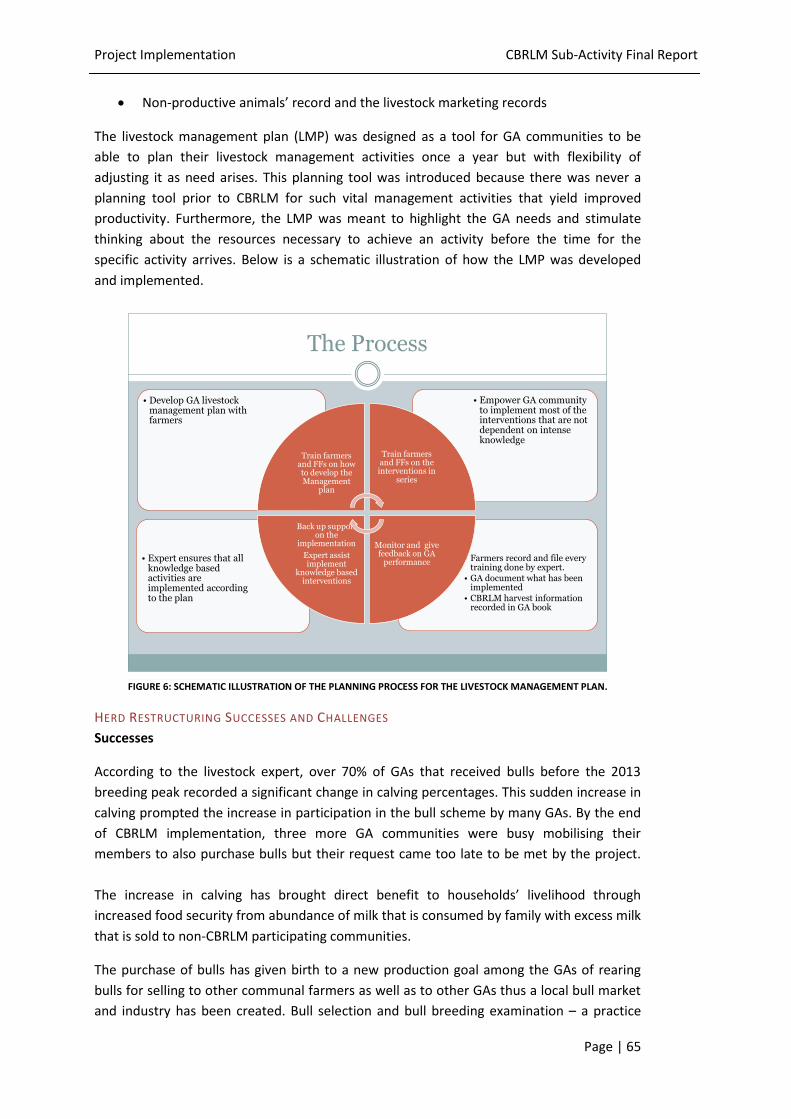
Project Implementation CBRLM Sub-Activity Final Report
Page | 65
Non-productive animals’ record and the livestock marketing records
The livestock management plan (LMP) was designed as a tool for GA communities to be
able to plan their livestock management activities once a year but with flexibility of
adjusting it as need arises. This planning tool was introduced because there was never a
planning tool prior to CBRLM for such vital management activities that yield improved
productivity. Furthermore, the LMP was meant to highlight the GA needs and stimulate
thinking about the resources necessary to achieve an activity before the time for the
specific activity arrives. Below is a schematic illustration of how the LMP was developed
and implemented.
The Process
• Farmers record and file every training done by expert.
• GA document what has been implemented
• CBRLM harvest information recorded in GA book
• Expert ensures that all knowledge based activities are implemented according to the plan
• Empower GA community to implement most of the interventions that are not dependent on intense knowledge
• Develop GA livestock management plan with farmers
Train farmers and FFs on how to develop the Management
plan
Train farmers and FFs on the interventions in
series
Monitor and give feedback on GA
performance
Back up support on the
implementation
Expert assist implement
knowledge based interventions
FIGURE 6: SCHEMATIC ILLUSTRATION OF THE PLANNING PROCESS FOR THE LIVESTOCK MANAGEMENT PLAN.
HERD RESTRUCTURING SUCCESSES AND CHALLENGES
Successes
According to the livestock expert, over 70% of GAs that received bulls before the 2013
breeding peak recorded a significant change in calving percentages. This sudden increase in
calving prompted the increase in participation in the bull scheme by many GAs. By the end
of CBRLM implementation, three more GA communities were busy mobilising their
members to also purchase bulls but their request came too late to be met by the project.
The increase in calving has brought direct benefit to households’ livelihood through
increased food security from abundance of milk that is consumed by family with excess milk
that is sold to non-CBRLM participating communities.
The purchase of bulls has given birth to a new production goal among the GAs of rearing
bulls for selling to other communal farmers as well as to other GAs thus a local bull market
and industry has been created. Bull selection and bull breeding examination – a practice
Project Implementation CBRLM Sub-Activity Final Report
Page | 66
that was regarded as impossible in the communal setup - is now a demand by farmers also
from non-CBRLM communities who heard about of this invaluable aspect of livestock
management.
Another debut success from the bull scheme is the revolving fund that has made it possible
for the project to procure more bulls. It has also birthed a success in the SSPOS (see below),
where a lot of beneficiaries are becoming livestock farmers unexpectedly.
The strategy of having a communal contribution through the revolving fund has achieved its
intended objective of creating community ownership of procured bulls. This is a real
success because when the bull scheme was launched the methodology of having
community ownership was a new thing that was thought to carry high risk for non-payment
and absence of stewardship towards the bulls. Communities have therefore demonstrated
that they can work together and are able to take responsibility for what gives them benefit.
As mentioned above 73.95% of the expected payment has been contributed by the GA
communities even among great financial and resource challenges brought about by the
drought.
Challenges
Introduction of the LMP was a paradigm shift (introduction of recording system, ageing of
animals, herd restructuring, defragmenting the herd into productiveand non-productive
animals) from the norm of farming in the GAs, as such it was characterised by challenges in
its implementation. Firstly, some GAs had low literacy level such that the process of doing
such a comprehensive plan was challenging. This challenge was alleviated when the project
decided to have the contents of the plan translated into the vernacular language that each
GA speaks. Secondly, some GAs completed the plan well but when it comes to
implementation the plan was not necessarily followed. Part of this non-implementation of
planned activities was also often due to absence of financial means to fund an activity like
vaccination. Other activities were not done due to absence of tools such as hoof cutting and
dehorning. This was one of the reasons why CBRLM motivated for the procurement of
animal husbandry kits for the GAs.
The three different records mentioned above were not sufficiently utilised by the GA
communities. In the Demo GAs, forms were almost always completed because the livestock
experts were making follow up. However, after the roll out to all other GAs, follow-up was
insufficient and GAs became irregular in completing the records. This activity would have
needed more time of facilitation so that it would become a habit for the GA communities.
GAs that managed to make full use of the livestock management plan became excited as it
offered solutions to their decision making process on the livestock management activities.
They used it as a mobilisation tool to set contribution target days for them to achieve the
implementation of the activities. They also realised that it was also a strong tool to monitor
the performance of the herd and even individual animals.
Herd restructuring was achieved mainly through the bull scheme. As the bull scheme was
an external measure provided by CBRLM, it is questionable whether the herd structure
improvements achieved through it are sustainable. Other vehicles of herd restructuring
that might yield a better prospect of sustainability, like creating and maintaining a
Project Implementation CBRLM Sub-Activity Final Report
Page | 67
documented herd restructuring plan and the subsequent sale of unproductive animals in
line with adjustment of animal numbers to fodder availability, were implemented only
marginally.
2.2.5.4 SMALL STOCK PASS-ON SCHEME (SSPOS)
The Small Stock Pass-on Scheme (SSPOS) is an intervention that was designed as a gender
integration tool to reduce wealth disparity and enhance female participation in CBRLM. In
almost all GAs where small stock exist, the CBRLM staff were confronted by women and
herders, requesting support in small stock farming in a scheme similar to that of the bull
scheme.
Women in communal areas of Namibia have been in many cases marginalised with regards
to traditional livestock and rangeland management practices, even though they are at the
forefront of livestock-raising and are also actively involved in rangeland management. A
significant number of households within registered GAs were not or only marginally
participating, mainly because they did not own any livestock. The SSPOS contributed to
integrate these households as fully acknowledged members participating in CBRLM. A
majority of SSPOS beneficiaries are women or from vulnerable groups.
Many of the grazing areas were continually challenged by the high turnover of herders,
since it is extremely difficult to implement an incentive that can retain herder in the maze
of limited resources and low productivity. The SSPOS was extended to herders to
encourage their continued participation in planned grazing and combined herding. Through
the SSPOS, herders in GAs where small stock forms part of PGCH were also included in the
list of beneficiaries. This was supposed to work as an incentive to reduce herder turnover,
especially in GAs that use services of hired labour. In addition, it was supposed to improve
the social status of herders by turning them into livestock owners.
The SSPOS promised to contribute to transforming the CBRLM communities’ livestock
production system by means of a single goat at a time. Goats are hardy, fertile and easy to
transport. This promises quick return and possibility of expanding the beneficiary
community with little investment. Goats are also one of the few animals that women can
traditionally own, making them a great animal to facilitate the empowerment of women.
The SSPOS therefore promised to help to:
Raise socioeconomic status of the vulnerable and poorest of the community by
giving them access to livestock as an asset and income source;
Improve nutrition of poor communities;
Improve gender equality;
Develop sustainable goat production practices;
Protect the environment from overgrazing;
Train GA communities to encourage long term project sustainability;
Harmonise the CBRLM with on-going initiatives by the Ministry of Agriculture,
Water and Forestry (MAWF) and other donor projects. It will enhance collaborative
efforts between CBRLM and MAWF;
It also motivated GAs that were not willing to herd small stock to do so and hence
reduced mobilisation efforts by CBRLM to get GAs to participating; and
Project Implementation CBRLM Sub-Activity Final Report
Page | 68
It offered incentive for herders to keep their jobs and is therefore reduced herder
turnover under the prevailing herder scarcity.
SYNERGIES BETWEEN SSPOS AND BULL SCHEME
A main reason for the introduction of the SSPOS was the challenge of GA communities
affording to pay for the bulls under the bull scheme. Farmers were passionate about having
bulls to increase their productivity while at the same time many had limited financial
resources to contribute. These farmers depended on disposing non-productive livestock to
pay for the bulls. However, in a significant number of GAs, there were insufficient or
absence of non-productive cattle to sell for the purpose of the bull payment, while there
was small stock in abundance. At the same time, CBRLM found it inappropriate to allow
farmers to get grant bulls as it was foreseen that this kind of approach would not be
sustainable without payment. Experience from GAs that had contributed showed a high
propensity of the community interacting to solve challenges caused by bulls such as
breaking into fields and houses.
CBRLM therefore converted the challenge of bull payment into an opportunity to empower
the poorest in the GAs by accepting goats in the repayment plan. CBRLM then called for
GAs to pay their bulls in the form of female goats aged between one and three years. A
uniform value was set at N$ 800 per goat to avoid double standards and disgruntlement.
This price was arrived at by looking at the market prices across the regions. In the western
regions prices were generally too high due to high demand created by Angolan buyers. The
payment of bulls using goats also made it possible to reach the expected recovery rate.
SSPOS STRATEGY
CBRLM laid down eligibility criteria to enable fair and equitable distribution of the small
stock under the SSPOS. Firstly, a GA became eligible if it was willing to include small stock
into PGCH. This move was done to strengthen the rangeland management component. The
selection of beneficiaries was supposed to be done by GA committees through a general GA
meeting. The livestock expert’s criteria of approving beneficiaries also required that
candidates should have been registered during the household inventory process and were
not members of livestock-owning households, except if they were fulltime herders. In fact,
they were meant to be households on their own right who did not own livestock (defined as
cattle, goats or sheep). The beneficiary list was supposed to be submitted to the livestock
expert for verification and acceptance. The beneficiaries were also required to have
undergone CBRLM training in small stock production and management. Herders who were
willing to remain in the GA for a prolonged period (minimum of two years) were also
included in the list of SSPOS beneficiaries. Furthermore, it was realised that there were
more beneficiaries than the number of possible goats to be obtained. As such, beneficiaries
were paired during the selection process into primary and secondary beneficiaries.
After receiving six female goats from CBRLM, the primary beneficiary was contractually
obliged to pass on the first six female kids to the paired secondary beneficiary. The number
of six female goats was chosen because the MCA-N compact’s definition of a livestock unit
equivalent was six small stock. One female kid will be passed on for every female goat
donated to a beneficiary. This implies that each beneficiary will be able to pass-on the first
six female kids within two years given the fact that goats kid three times in two years and
assuming a probability of 50% female kid being born. The reason of paring the beneficiaries
Project Implementation CBRLM Sub-Activity Final Report
Page | 69
was a strategy to make monitoring of the pass on to the next beneficiary easier, because
the secondary beneficiary is a member of the same community and will follow the breeding
process of the SSPOS goats. At the time of giving, the traditional authority representative,
the GA committee chairperson, the primary beneficiary and the secondary beneficiary all
signed and witnessed the handover of the goats from CBRLM to the primary beneficiary.
Traditional authorities were included because they are the legal entity of local governance
that would solve disputes over the pass on process in the event that a primary beneficiary
defaults.
The pass-on of the kids commenced in all GAs that received goats at the beginning of the
SSPOS because goats have short inter-kidding intervals. In GAs where bucks were
inadequate GAs received a maximum of two bucks that were procured from stud breeders
and they were given as a public good in a similar way as done with bulls6. Every goat
procured for the purpose of SSPOS was supposed to be adequately identified as a CBRLM
goat and given a unique tag number for individual identification among a herd of goats7.
The goats were also vaccinated against pulpy kidney and de-wormed against internal and
external parasites before being introduced to GAs. Participation in CBRLM by the
beneficiary was made a condition for keeping the donated small stock until the pass-on has
been done successfully. CBRLM has comprehensive documentation of the SSPOS activities,
which will enable MAWF staff to sustain and monitor the scheme.
Detailed information on the SSPOS is provided in Annex A 3.5.3.
2.2.5.5 LIVESTOCK HANDLING INFRASTRUCTURE
MOBILE CATTLE CRUSH PEN AND SCALES UNITS
Early in the CBRLM project, problems were experienced in performing livestock activities,
particularly in the practical handling of cattle. Many of the GAs did not have crush pens
within the GA to allow easy livestock handling. In order to expedite implementation, seven
mobile crush pens and scales were procured by MCA which were also used to avoid undue
delays and inconveniences in livestock husbandry activities. In each of the six project
regions Kunene, Omusati, Oshana, Oshikoto, Ohangwena and Kavango (West and East) a
trailer was used with the mobile crush pen and scale while the seventh unit was reserved
for use by the livestock and marketing experts in Oshakati. These units were also utilised by
the external evaluator Innovation for Poverty Action (IPA) during their cattle condition
baseline survey. They were also key infrastructure that enabled CBRLM to carry out
auctions, livestock husbandry training and herd restructuring activities in unlikely and
remote places.
6 The supply of bucks was only implemented in few GAs (Kaguni, Kaakuwa, Otjovatje and Wangolo) despite the demand by many GAs. The
limitation was the fact that bucks were considerably expensive and it would have been extremely limited the number of possible beneficiaries in
the absence of extra funding to supplement the revolving fund collections.
7 About 50 goats out of more than 1000 died in the relocation process and were replaced. The replacements received the same tag number of
the deceased predecessor. This means that the dead/missing goats appear as untagged animals in the database.
Project Implementation CBRLM Sub-Activity Final Report
Page | 70
Having realised the impact of these units as cattle-restraining infrastructure, CBRLM then
decided to construct more permanent crush pens in GAs that had the greatest challenge of
handling livestock. CBRLM mobilised and constructed 18 crush pens across all regions, a
figure above the initial target of 10. This was done through strong collaboration with DVS
who are the MAWF´s custodian of crush pen infrastructure. Six crush pens were
constructed in the Kavango regions, ten in Omusati and two in Kunene regions. Other GAs
proactively constructed their own crush pens after experiencing the great benefit from the
mobile crush pens.
As CBRLM closes, the mobile crush pen and scale units will have been serviced and
repaired. The implementer strongly recommends that these materials be handed over to
the six regional livestock marketing cooperatives that were created through the support of
CBRLM. The seventh unit could be utilised by the central secretariat of the cooperatives for
assisting where there is a need on ad hoc basis.
OUTCOMES
The mobile infrastructure made handling of livestock extremely convenient, particularly
through the enabling power of the neck clamp on the scale box. Conventional crush pens by
DVS pauses some risk of injury to persons working at the crush pen due to absence of neck
clamps. It is therefore recommended that DVS and future projects consider equipping
existing crush pens with neck clamps.
2.2.5.6 LIVESTOCK CHALLENGES AND RECOMMENDATIONS
CHALLENGES
The greatest challenge encountered by the livestock component was the 2012/2013
drought. There was total depletion of pastures so the issue of nutrition was an issue.
Supplementation became unpractical and too expensive. This, in turn, affected productivity
as malnutrition cause reproductive losses in form of production animals dying, abortions,
non-return to oestrous by cows and delayed onset in heifers due to retarded growth, bull
infertility etc. Attempts were made to avert this challenge through further thinning of
productive herds and marketing efforts being carried out by the CBRLM marketing
component.
A nutritional survey was conducted by the CBRLM livestock expert that indicates a general
shortage of key essential micro and macro minerals within the fodder available to the
animals. To assist in correcting this deficiency, bulls received supplements in particular
because they are a too big value investment for them not to perform.
Another challenge was the capacity available to effectively implement the component. It
should be born in mind that CBRLM started introducing a paradigm shift in livestock
management. Communities need a lot of mentorship and hands on assistance on a
continuous basis for an adequate period to adopt the changes as part of their daily
management practices. Considering the analogy of a commercial farming setup: farm
managers stay fulltime and supervise activities on a daily basis. CBRLM worked with 58 GAs
(“communal farms”) across great distances that all had to be covered by the CBRLM
livestock expert acting as “farm manager” since the technical knowledge of support staff
was limited. Travelling occupied a significant portion of expert time and took its toll on the
Project Implementation CBRLM Sub-Activity Final Report
Page | 71
planning and operations management time. This aspect has been to a certain extend
addressed through the skills transfer to FFs and AETs and it is hoped that they will still play
an increasingly important role in future for the GAs to progress.
Bulls have been a big expense for GAs but they are meant to be removed from the GAs
after serving for three years. First bull recipient GAs are approaching their third year with
the bulls thus have the risk of inbreeding becoming an issue. It was planned that during the
closing phase of the project (in particular Q16), efforts would be made to bring various GAs
together to negotiate bull swapping as a way to save cost while maintaining quality
breeding stock. This was only achieved in Kavango region during June 2014 when various
GAs were gathered together for the GALA refresher training. The greatest challenge was
time limitation. It is strongly recommended that MAWF and other future stakeholders
follow up on facilitating this process.
RECOMMENDATIONS
The Bull Scheme was viewed with mixed feelings from various livestock practitioners within
the industry. Important lessons derived were that the scheme contributed to communal
calving rates reaching an unimaginable scale. With this potential policy makers need to
rethink on how to approach the issue of genetic improvement and genetic material
preservation. CBRLM implemented based on the requests by farmers which enabled
farmers to gain pride in their bulls. The current thinking by many is that only the Nguni
breeds should be promoted in the NCAs. The implementer’s experience was that the fear of
Nguni breeds get extinct is far from reality as there was a balance of preference among
various breeds. One observation is the little roll played by the Breeders’ Association in
community education. Government should interact more and incur Breeders Associations
to engage in social responsibility and educate communal farmers particularly the Nguni
Breeders Association that only do annual events at research station. The Brahman Breeders
Association is the only one that the implementer observed to be doing a social outreach
action.
Another eye opener was the extent to which communities contributed to pay for the bulls
communally. Collective ownership has resulted in bulls being safe when they behave
rowdily in the community. In most cases the communal ownership brought unity and
cohesion. However, there were also cases where communities were split over the decision
of whether to procure bulls as well as who would have to contribute to repayment.
Although the issue of artificial insemination was not pursued, it would be a cheaper and
efficient way to introduce superior genetic material in the herds and should be interrogated
in future support efforts.
The SSPOS and support in small stock management brought revelation on how much
communal farmers are incurring huge opportunity cost in small stock management. Poor
production has made it to be placed low as a means of livelihood for the families. Ignorance
on small stock was found to be rampant among farmers to an extent that death in kids and
young goat is considered as normal. It is the implementer´s suggestion that targeted small
stock support projects such as housing of small stock should be considered. Poor housing of
small stock was found to be the major cause of loss in small stock, particularly in the
Kavango and Ohangwena regions, where the climate is more humid in summer. MAWF
Project Implementation CBRLM Sub-Activity Final Report
Page | 72
might want to consider a general campaign for sustainable parasite management in small
stock, as the experience of the implementer indicates that the focus on this significantly
increases productivity.
The concept of herd restructuring and identification of non-productive animals was found
to be a gateway to be coupled with initiatives of livestock market and off-take
improvement. However, it calls for external support other than the MAWF because of the
intensity of work and close follow-up that is required.
2.2.6 MARKETING
For the purpose of this report, this subsection will only give an overview of the CBRLM
marketing component. For further reading, the marketing component produced a report as
a final deliverable in May 2014 with the title “CBRLM Marketing Report”. This report
provides much more detailed information on the CBRLM marketing component.
2.2.6.1 RATIONALE
Despite the fact that a large number of livestock is found in the NCAs, productivity and
marketability in the NCAs has always been disproportionately low. The livestock sector
contributes 76% to the agricultural GDP. However, only 6% of this 76% comes from the
NCAs while the remaining 70% is derived from the commercial areas.(National Planning
Commission, 2013). This low marketing rate of livestock in the NCAs is directly linked to the
low commercial off-take rate, which in has been estimated for the NCAs to be between
1.2%8 or about 3.7% (Innovations for Poverty Action, 2011) compared to 25% in the
commercial areas (National Planning Commission, 2013). This is attributed to:
Production goals of NCA livestock farmers: The production goals for a livestock
farmer in the NCAs are hardly commercially oriented. Instead, they tend to focus on
status through the accumulation of livestock, self consumption (weddings, funerals
and other ceremonies), cultural symbolism, draft power and milk. The low
commercial off-take experienced in the NCAs is a result of the latter factors, not
necessarily price: Farmers are not adopting commercial livestock farming methods.
They often hold on to traditional ways of keeping livestock as symbols of status and
for security reasons.
Increased number of livestock (2.5 times higher than at Independence 1990) have
led to severe rangeland degradation resulting in poor quality of livestock presented
for marketing
Lack of functioning local livestock marketing institutions and infrastructure
Lack of diversity of livestock product marketing outlets
8 Verbal communication from Meat board Namibia, May 2014
Project Implementation CBRLM Sub-Activity Final Report
Page | 73
The formal market is supplied to over 50% by meat and cattle from sVCF and increasingly,
the traders who sell to the informal markets also buy their cattle in the south. Thus,
despite high livestock numbers, the NCAs are a net importer of meat and cattle9.
2.2.6.2 OBJECTIVES AND PLANNED INTERVENTION
Marketing was one of the five components of CBRLM. According to the initial terms of
reference (ToR) of the project, this component was to develop marketing plans and
increase off-take at the community level. However, just assisting the GA communities to
market their cattle would not address the core problem of marketing in the NCAs, which is
the lack of functioning marketing institutions in the agricultural sector.
In the course of the project the original objectives and activities of the Marketing
Component were therefore expanded to:
a) To increase the commercial livestock off-take at CBRLM Grazing Areas (GAs);
achieving this by facilitating farmers’ adoption of
i. Improvement of livestock production practices (e.g. herd restructuring,
identification and disposal of non-productive animals, understanding the
type of animals for marketing)
ii. Farming practices that allowed cattle attain market desired weight and fat
at an age of 2 to 3 years (e.g. weight of 400kgs and grades A, B and AB)
iii. Commercialization of livestock rearing (Harmonization of conflicts between
cultural livestock farming norms and new principles: commercial livestock
farming practices)
b) Institutionalization of six regional Livestock Marketing Cooperatives (LMC) in the
target regions with the core business of organising formalised auctions and to
receive a commission.
c) Capacity building for LMCs in a broad spectrum of business support with a final
objective to not only to develop and sustain livestock marketing but also to train
farmers on rangeland and livestock development activities beyond donor support.
d) Develop initiatives that would lead to NCA livestock and livestock products’ market
diversity.
i. Establishment of alternative markets for bone-in beef from the Northern
Communal Areas of Namibia in Angola and Zimbabwe
ii. Value addition for the predominantly Grade C beef originating from NCAs
2.2.6.3 GA LEVEL MARKETING
ACHIEVEMENTS
Marketing at the GA level was only sporadic. Some farmers disposed of some animals
identified as unproductive. However, there is no clear evidence that this constituted
increased off-take compared to non-project areas. However farmers reported that through
9Increasing numbers of cattle and beef products have been entering NCAs from the south (in 2013 the equivalent was 22 772 cattle) which is
two times the volume of exports from the NCA. This is a paradox situation given that more cattle and goats are residing in the NCA than sVCF.

Project Implementation CBRLM Sub-Activity Final Report
Page | 74
the increased calving rates brought by the project they will increase their marketing rates in
the future.
2.2.6.4 LIVESTOCK MARKETING COOPERATIVES
ACHIEVEMENTS
Starting from mid 2012 six livestock marketing cooperatives (LMC) were established in the
project regions. By the end of 2013, all six regional livestock marketing cooperatives were
provisionally registered, had functioning offices, developed a business plan and received
training on major cooperative issues. The cooperatives were acknowledged by the Minister
of the Ministry of Agriculture, Water and Forestry (MAWF), who co-signed together with
the MCA-N Director of Agriculture a memorandum of understanding (MoU) between the
CBRLM project and the cooperatives on 28 November 2013.
Each cooperative elected a board of directors. The board members were trained on issues
of cooperative governance. Millennium Challenge Account (MCA) engaged an experienced
consultant for cooperative development from the USA for training of these newly
developed business entities.
A cooperative forum consisting of the six LMC chairpersons was also established and has so
far met in a bi-monthly turns. In order to support and facilitate these newly established
cooperatives a secretariat was formed consisting currently of 5 persons.
The cooperatives have been receiving a subsidy of monthly 15,000 NAD to pay for staff and
regular expenses and also to purchase equipment. Matching capital funds up to 200,000
NAD were paid upon reaching a minimum amount of 100,000 NAD in membership shares
or if an approved business plan was received.
Total funds dispersed per cooperative are shown in Table 6.
TABLE 6: CBRLM SUBSIDY FUNDS AND MATCHING FUNDS TO 6 LIVESTOCK MARKETING COOPERATIVES
Activity Oshana Omusati Oshikoto Ohangwena Kavango Zakumuka Total N$
CBRLM Subsidy
Sept 2012 - June
2014
245,655 280,000 223,680 253,680 189,381 270,000 1,472,396
CBRLM matching
funds by May 2014 200,000 0 0 0 200,000 117,000 517,000
The board members, forum and secretariat were subjected to a sequence of training
sessions that would help them with more effective running of the cooperatives.
Auctioneers were also trained and they manage auctions conducted by LMCs. About 100 of
auctions were conducted by the CBRLM-supported Livestock Marketing Cooperatives
throughout the seven targeted regions of the NCAs since mid of 2012.
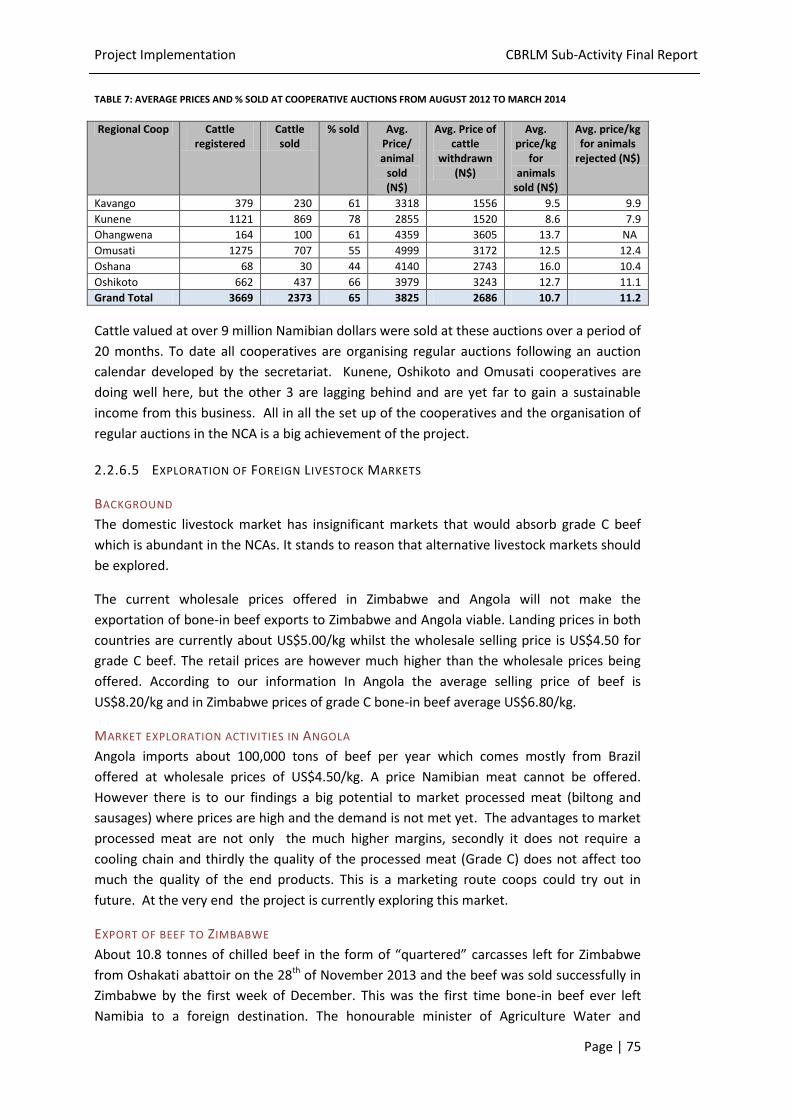
Project Implementation CBRLM Sub-Activity Final Report
Page | 75
TABLE 7: AVERAGE PRICES AND % SOLD AT COOPERATIVE AUCTIONS FROM AUGUST 2012 TO MARCH 2014
Regional Coop Cattle registered
Cattle sold
% sold Avg. Price/ animal
sold (N$)
Avg. Price of cattle
withdrawn (N$)
Avg. price/kg
for animals
sold (N$)
Avg. price/kg for animals
rejected (N$)
Kavango 379 230 61 3318 1556 9.5 9.9
Kunene 1121 869 78 2855 1520 8.6 7.9
Ohangwena 164 100 61 4359 3605 13.7 NA
Omusati 1275 707 55 4999 3172 12.5 12.4
Oshana 68 30 44 4140 2743 16.0 10.4
Oshikoto 662 437 66 3979 3243 12.7 11.1
Grand Total 3669 2373 65 3825 2686 10.7 11.2
Cattle valued at over 9 million Namibian dollars were sold at these auctions over a period of
20 months. To date all cooperatives are organising regular auctions following an auction
calendar developed by the secretariat. Kunene, Oshikoto and Omusati cooperatives are
doing well here, but the other 3 are lagging behind and are yet far to gain a sustainable
income from this business. All in all the set up of the cooperatives and the organisation of
regular auctions in the NCA is a big achievement of the project.
2.2.6.5 EXPLORATION OF FOREIGN LIVESTOCK MARKETS
BACKGROUND
The domestic livestock market has insignificant markets that would absorb grade C beef
which is abundant in the NCAs. It stands to reason that alternative livestock markets should
be explored.
The current wholesale prices offered in Zimbabwe and Angola will not make the
exportation of bone-in beef exports to Zimbabwe and Angola viable. Landing prices in both
countries are currently about US$5.00/kg whilst the wholesale selling price is US$4.50 for
grade C beef. The retail prices are however much higher than the wholesale prices being
offered. According to our information In Angola the average selling price of beef is
US$8.20/kg and in Zimbabwe prices of grade C bone-in beef average US$6.80/kg.
MARKET EXPLORATION ACTIVITIES IN ANGOLA Angola imports about 100,000 tons of beef per year which comes mostly from Brazil
offered at wholesale prices of US$4.50/kg. A price Namibian meat cannot be offered.
However there is to our findings a big potential to market processed meat (biltong and
sausages) where prices are high and the demand is not met yet. The advantages to market
processed meat are not only the much higher margins, secondly it does not require a
cooling chain and thirdly the quality of the processed meat (Grade C) does not affect too
much the quality of the end products. This is a marketing route coops could try out in
future. At the very end the project is currently exploring this market.
EXPORT OF BEEF TO ZIMBABWE
About 10.8 tonnes of chilled beef in the form of “quartered” carcasses left for Zimbabwe
from Oshakati abattoir on the 28th of November 2013 and the beef was sold successfully in
Zimbabwe by the first week of December. This was the first time bone-in beef ever left
Namibia to a foreign destination. The honourable minister of Agriculture Water and
Project Implementation CBRLM Sub-Activity Final Report
Page | 76
Forestry, John Mutorwa ceremoniously dispatched this load of bone-in beef from the NCAs
of Namibia to Zimbabwe.
This export of 10.8 tonnes of beef to Zimbabwe from the NCAs followed extensive
negotiations between the directorates of veterinary services of Zimbabwe and Namibia.
The negotiations were facilitated by the CBRLM projects over a period of 8 months and this
export was a big operational success. However, given the current low wholesale prices
offered in Zimbabwe, the business turned out not to be viable.
FURTHER NEEDS TO ESTABLISH FOREIGN LIVESTOCK MARKETS
Technocrats in government consultancies and projects must be engaged in lateral thinking
and establish viable markets for the grade C bone in beef that abounds in the NCAs. Value
addition through meat processing also elevates prices of cattle that farmers would receive.
There is a big market in Namibia but foremost in neighbouring countries for ‘russians’, chilli
bites, sausages, biltong, salamis and tinned meats. Such products do not necessarily have
to be derived from grades A, AB and B beef. These products can easily be made from Grade
C beef without significant impairment of quality. The tenderness of beef can also be
improved by vacuum packing the grade C beef and storing it as chilled for two weeks.
Project Implementation CBRLM Sub-Activity Final Report
Page | 77
2.2.7 PUBLIC OUTREACH
2.2.7.1 ACTIVITIES
Public outreach activities were partly in the hands of the community development expert
and of the training co-ordinator, most for developing information materials. The following
items were produced and distributed to the general public at special events:
Leaflets (2011) and banners (2012) were produced to be used at public information
sharing events.
CBRLM Booklet – a 36 page, full colour, richly illustrated booklet launched in April
2013 by Minister Mutorwa in Windhoek, following the internal mid-term evaluation
of Demo GAs. This booklet was re-printed to be distributed in September 2013 at
the international UN COP11 meeting held in Windhoek and at the Namibia
Rangeland Forum held in October 2013. Copies were given to the regional teams to
be distributed at public functions and to farmers. This booklet was and is popular
among those interested in the concepts and experiences by farmers so far and
serves as reference for another “lessons learnt” booklet produced by MCA Namibia
in July 2014.
Radio talk shows – text was drafted and translated into Oshivambo, Otjiherero and
Rukwangali for 2 series of radio presentations to be used by regional facilitating
teams and colleagues from DEES to help ensure that a consistent message was
broadcast. Regional managers repeatedly said that they would book timeslots for
broadcasts in the regular agricultural programmes through and with DEES
colleagues. The feedback was also, that facilitators/regional managers found it
much easier talking freely, without written concept.
NBC Green Horizon inserts – In February 2013 the producers of Green Horizon, the
weekly agricultural program broadcast on NBC TV approached GOPA-CBRLM and
MCA with a request to collaborate on the production of film material, which could
then also be used as insert in their program. This led to two inserts depicting the
experiences of CBRLM grazing area members in Kavango – at Nsindi and Nyege GA.
They were first broadcast in June 2013 and have had several re-runs on NBC TV.
Stories and Press Releases – On the occasion of special events, such as the
certification of field facilitators, launch of the CBRLM booklet, the first shipment of
beef from the NCA’s to Zimbabwe, the Namibia Rangeland Forum etc., press
releases were sent to print and other media.
CBRLM Messenger – A 4 page newsletter was distributed by e-mail to partners and
direct stakeholders was started at the beginning of 2013, informing colleagues
about latest developments and sharing lessons learnt and success stories.
Success stories were written and sent to MCA Namibia for inclusion into MCA-N
media releases and printed materials.
www.cbrlm.org - The CBRLM website was re-designed and greatly improved in
2013. Background information and progress reports, training materials etc are
downloadable from the website.
Specifications were drafted and resource materials were prepared and shared with
a service provider that was contracted by MCA-N to write another booklet on

Project Implementation CBRLM Sub-Activity Final Report
Page | 78
CBRLM for decision makers, farmers and the general public – translated into
Otjiherero, Oshindonga, Rukwangali and Afrikaans. Altogether 25 000 copies of this
booklet will be distributed to all regions of the country with the help of MAWF. The
launch by MCA-N is planned for beginning September 2014.
Major events where GOPA-CBRLM was represented were:
The MCA Livestock support information workshop on 9 July 2014 at the Safari Hotel
in Windhoek also attended by the PS and deputy PS of MAWF
The handing over ceremonies of MCA-N sponsored water points served as de-
centralized public outreach events. Similarly the auctions that were organized by
the GOPA-CBRLM marketing expert and/or the GOPA-CBRLM and MCA-N
supported regional Livestock Marketing Co-operatives.
Ongwediva Trade Fair 2013 – To support the information booth of MAWF/DEES
GOPA-CBRLM contributed funds and information materials to the display at the
fair.
Windhoek Show 2013 – GOPA-CBRLM contributed information and exhibition
materials to the MAWF/DEES booth, collaborating with the public relations division
of MAWF.
COP 11 – GOPA-CBRLM shared a booth with MCA-N.
Rangeland Forum 2010 and 2011 & then hosting in 2013 – At this annual forum
expert staff contributed presentations and in 2013 the Rangeland Forum,
sponsored by MCA-N, was held in Rundu, Kavango East. A site visit to Nyege GA
formed the highlight of the forum.
Rangeland and Bush Encroachment Forum – The rangeland expert and training co-
ordinator are active members of this national forum, established by the Minister of
Agriculture, Water and Forestry
National Training Authority (NTA) – After having been asked to contribute the
concerns and considerations of the farmers and support organizations working on
communal land, one of the professional trainers serves on the agricultural Industry
Skills Committee, while the other professional trainer serves on the Technical
Working Group for agricultural training development of the NTA.
The GOPA-CBRLM Livestock and Marketing experts participated and helped
facilitate various stakeholder meetings.
2.2.7.2 LESSONS LEARNT
Public outreach, mobilization and training are closely related. Field facilitators often asked
for more public visibility of the project. The rationale behind this is the observation that
especially farmers in the NCA’s tend to adopt or support only those initiatives that carry the
visible approval and support of top political or social leadership. They do not want to be
seen supporting or engaging in activities that are not first publicly endorsed – and often
repeatedly so – by influential leadership.
More public outreach in the urban centres – both in the NCA’s and south of the veterinary
cordon fence as well as through public media is needed. Especially the link with top
leadership and technocrats in MAWF and stakeholder organizations based in the capital
Project Implementation CBRLM Sub-Activity Final Report
Page | 79
require a more continuous effort to build trusting relationships and more committed
partnership.
In the GOPA-CBRLM team public outreach was often done ad hoc, reacting to specific needs
and opportunities and engaging those staff members that were readily available. While
satisfactory results were achieved, judging from feedback, it should be considered that well
worded and creatively presented publicity material takes considerable time and skill to be
produced.
Event management requires careful planning to take into consideration acceptability by
potential participants and effectiveness in terms of achieving intended outcomes. In the
absence of engaging a dedicated public outreach person and/or sharing these tasks among
several staff members, it is advisable to develop and follow a policy that can guide the
responsible persons.

Project Implementation CBRLM Sub-Activity Final Report
Page | 80
2.3 MONITORING AND EVALUATION
2.3.1 INTERNAL MONITORING
2.3.1.1 MONITORING SYSTEM AND TOOLS
In the terms of reference the implementer was required to establish mechanisms to
monitor progress, resolve conflict among stakeholders and provide feedback that allows
adjustment to management in response to learned experience and new knowledge.
More specifically the implementer was required to undertake the following monitoring and
evaluation tasks:
Report quarterly against the identified monitoring indicators and their
accompanying targets through an indicator tracking table that is included in the
quarterly report. The Implementer will be expected to collect all relevant data for
this reporting requirement.
Prepare a summary M&E Section in the Annual Report.
Provide any data or other information requested during the Data Quality Review
that MCA-N will be conducting after Compact Years 1, 3, and 5.
Collaborate with MCA-N, Impact Evaluator, survey firms and MCC on the impact
evaluation of the activity and participate in regular dialogue with the Impact
Evaluator (through conference calls and email exchanges) about any issues with the
evaluation and any key changes to programme implementation so that they can be
incorporated into the evaluation.
Apart from the last bullet point, these are essentially monitoring tasks. All impact and
outcome level indicator data is the responsibility of the Impact Evaluator.
The implementer interpreted these ToR more broadly and identified three categories of
monitoring data to be collected. These are as follows:
Data to support implementation planning and management
Data to inform project performance monitoring indicators
Beneficiary profiles
Figure 7 shows the six instruments used to inform each of these categories of monitoring
data. A detailed description of these six monitoring instruments is contained in the
deliverable: Data Collection Plan.
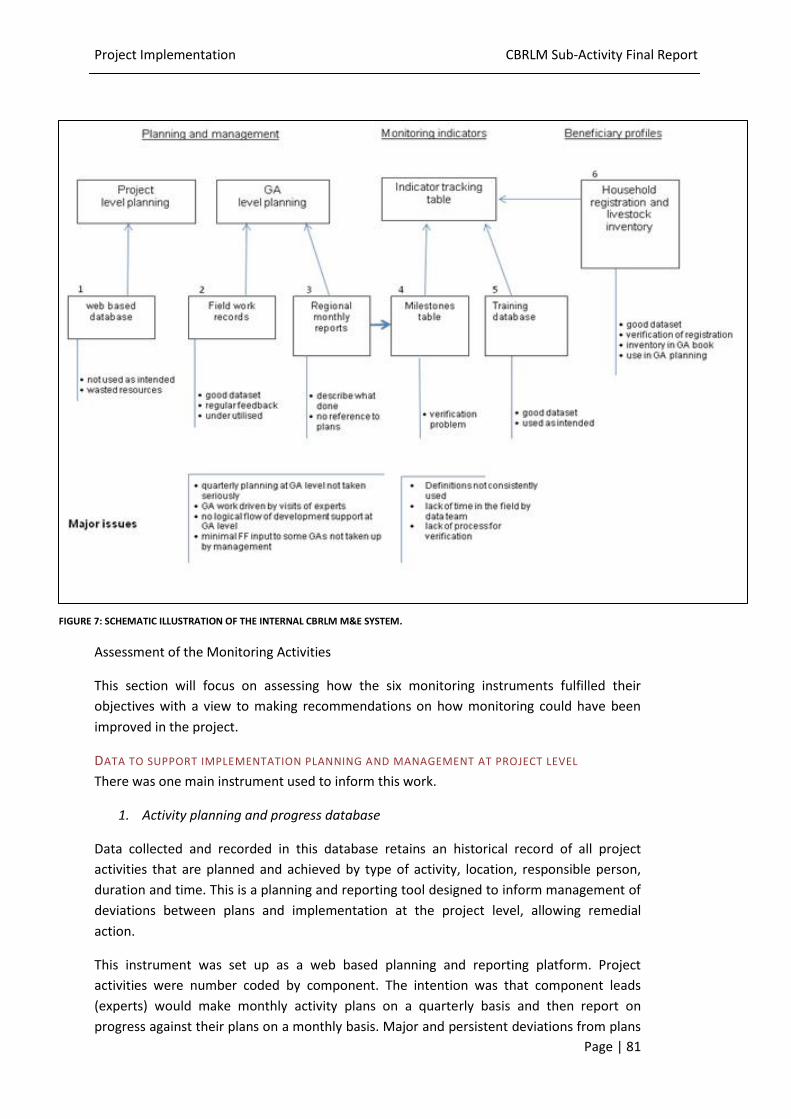
Project Implementation CBRLM Sub-Activity Final Report
Page | 81
Assessment of the Monitoring Activities
This section will focus on assessing how the six monitoring instruments fulfilled their
objectives with a view to making recommendations on how monitoring could have been
improved in the project.
DATA TO SUPPORT IMPLEMENTATION PLANNING AND MANAGEMENT AT PROJECT LEVEL
There was one main instrument used to inform this work.
1. Activity planning and progress database
Data collected and recorded in this database retains an historical record of all project
activities that are planned and achieved by type of activity, location, responsible person,
duration and time. This is a planning and reporting tool designed to inform management of
deviations between plans and implementation at the project level, allowing remedial
action.
This instrument was set up as a web based planning and reporting platform. Project
activities were number coded by component. The intention was that component leads
(experts) would make monthly activity plans on a quarterly basis and then report on
progress against their plans on a monthly basis. Major and persistent deviations from plans
FIGURE 7: SCHEMATIC ILLUSTRATION OF THE INTERNAL CBRLM M&E SYSTEM.
Project Implementation CBRLM Sub-Activity Final Report
Page | 82
could be quickly flagged and management adjustments made accordingly. The thinking was
that if component leads were making their own activity plans and entering them into the
database, they would have strong ownership of these plans, together with an incentive to
report conscientiously on achievements against them.
This objective was not fulfilled. Component leads did not take to the web based planning
approach. They preferred to participate in planning meetings where they could comment
on a suggested planning framework and interact with colleagues. Because the component
activity plans were not initiated by them, reporting against these plans was not thoroughly
done. Part of the reason was that too little time was devoted in planning meetings for
reporting against previous quarter plans and planning for the next quarter.
The database was maintained by the monitoring adviser and used as the basis for reporting
on progress for the first 12 quarterly reports. In March 2013, the planning framework
changed to accommodate the six elements of training and support which had become the
major focus of field activities at GA level, sometimes clustered between topics and/or
across GAs.
In hind sight the significant amounts of project funds and expert time allocated to
developing and maintaining a web based activity planning and monitoring tool was not well
spent. While the activity database contains a consistent record of all activities undertaken
and achieved up to quarter 12, this information base has not been used apart from
providing a consistent reporting format in the first twelve quarterly reports.
DATA TO SUPPORT IMPLEMENTATION PLANNING AND MANAGEMENT AT GA LEVEL
Two instruments were used to collect data to feed into planning and management at the
GA level.
2. The field work database
A weekly record is kept of the daily work of all field staff. This includes regional managers as
well as field facilitators. This provided information on what field work was done, by whom,
where and with which beneficiaries. It was designed to provide management with an
objective measure of field work implementation, allowing remedial action as necessary.
Information was provided by field staff on a weekly reporting form about the days worked
by location and type of work undertaken. The database was maintained by the data
manager at headquarters in the Oshakati office.
Analysed information from this database was sent back to the field staff and reported in the
quarterly reports. It provided a good indication of which GA communities FFs were working
with and on what components of CBRLM.
Apart from the regular quarterly reporting, the database has been used to analyse the
resources allocated to demonstration areas and helped in the planning of the rollout to the
non-demonstration areas in the last 18 months of the project. The information in the
database was also used to interpret the GA performance data from the internal GA
performance evaluation conducted in December 2013.
Project Implementation CBRLM Sub-Activity Final Report
Page | 83
This has been a very valuable monitoring tool with field level data being maintained
consistently and comprehensively over the length of the project. This is a rare achievement
which is due to the diligence (and patience) of the data manager as well as the relative
simplicity of the reporting format, enabling field staff to complete the forms quickly. The
quality of the information was also enhanced by being able to triangulate the information
provided with the timesheets submitted by FFs for their per diem payments. An
improvement that should be considered for the future is the possibility of combining the
database of field work days with the production of monthly timesheets. This requires
flexibility on the part of the implementing organisation’s accounting and reporting
procedures, which may be difficult to negotiate.
The most disappointing aspect of this monitoring tool is that, despite receiving regular
analysis indicating the very few days per quarter spent by FFs in some GAs, no action was
taken by either regional or component managers to investigate the reasons for very low
intensity of contact with GA communities. One possible reason for this is that patterns of
working became fixed early on with half or more of available time being spent at regional
or RIA level, rather than with GA communities.
3. Regional monthly reports and GA progress reports
The monthly reports from the regions are descriptive reports of what has taken place in the
region and by GA.
The GA level reporting is based on actions undertaken against component heads. While this
gives some indication of what was done and not done, it does not relate achievements to
planed activities.
A major consequence of this lack of connection between planned field activities and actual
achievements has been that the quarterly planning exercise at GA level has been a farce.
Regional managers and FFs have continued through the course of the project to include
plans for work at GA level well beyond their capacity to undertake it.
Some attempt has been made to compare previous quarter plans with actual
implementation in quarterly reporting. Despite showing large disparities between what was
planned and what was done, not sufficient management action was taken to better match
quarterly GA activity plans with actual implementation. Hence FFs came to regard quarterly
GA planning as meaningless. Work at GA level thus tended to respond to need than to
follow any predetermined plan. GA level work was often dictated by visits to the region by
component leaders or trainers. At the community level this resulted in a lack of systematic
follow through of a logical development programme.
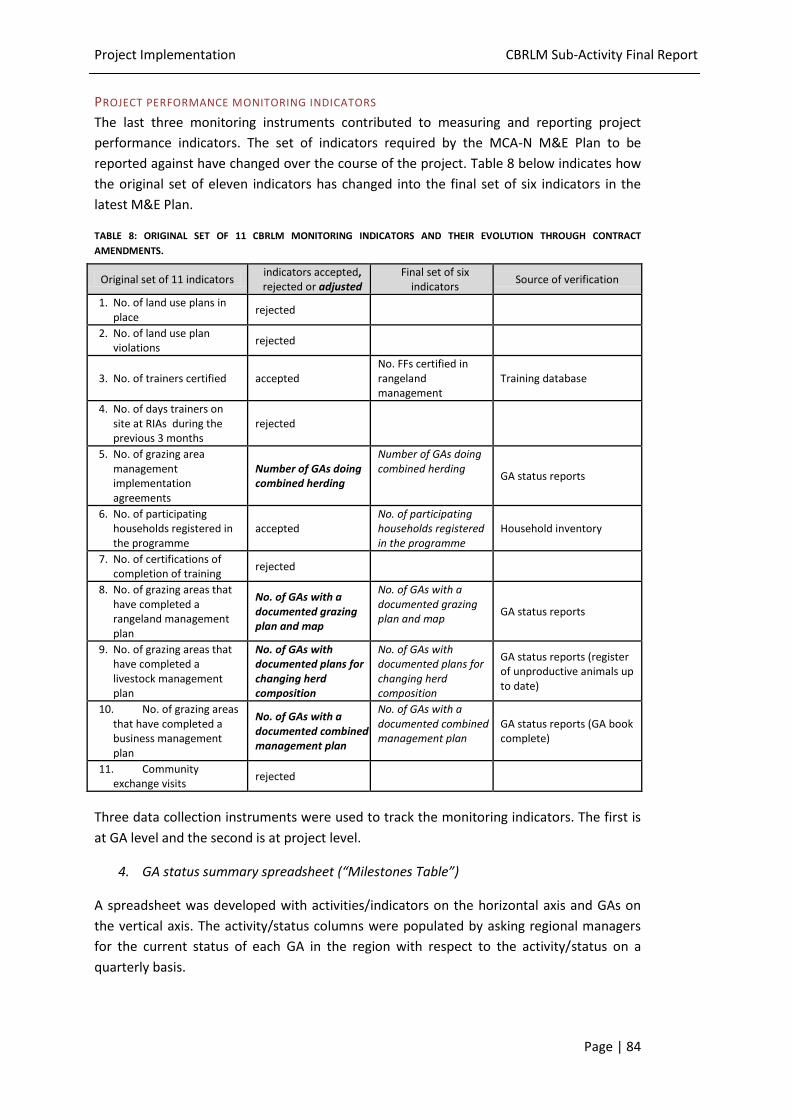
Project Implementation CBRLM Sub-Activity Final Report
Page | 84
PROJECT PERFORMANCE MONITORING INDICATORS
The last three monitoring instruments contributed to measuring and reporting project
performance indicators. The set of indicators required by the MCA-N M&E Plan to be
reported against have changed over the course of the project. Table 8 below indicates how
the original set of eleven indicators has changed into the final set of six indicators in the
latest M&E Plan.
TABLE 8: ORIGINAL SET OF 11 CBRLM MONITORING INDICATORS AND THEIR EVOLUTION THROUGH CONTRACT
AMENDMENTS.
Three data collection instruments were used to track the monitoring indicators. The first is
at GA level and the second is at project level.
4. GA status summary spreadsheet (“Milestones Table”)
A spreadsheet was developed with activities/indicators on the horizontal axis and GAs on
the vertical axis. The activity/status columns were populated by asking regional managers
for the current status of each GA in the region with respect to the activity/status on a
quarterly basis.
Original set of 11 indicators indicators accepted, rejected or adjusted
Final set of six indicators
Source of verification
1. No. of land use plans in place
rejected
2. No. of land use plan violations
rejected
3. No. of trainers certified accepted No. FFs certified in rangeland management
Training database
4. No. of days trainers on site at RIAs during the previous 3 months
rejected
5. No. of grazing area management implementation agreements
Number of GAs doing combined herding
Number of GAs doing combined herding
GA status reports
6. No. of participating households registered in the programme
accepted No. of participating households registered in the programme
Household inventory
7. No. of certifications of completion of training
rejected
8. No. of grazing areas that have completed a rangeland management plan
No. of GAs with a documented grazing plan and map
No. of GAs with a documented grazing plan and map
GA status reports
9. No. of grazing areas that have completed a livestock management plan
No. of GAs with documented plans for changing herd composition
No. of GAs with documented plans for changing herd composition
GA status reports (register of unproductive animals up to date)
10. No. of grazing areas that have completed a business management plan
No. of GAs with a documented combined management plan
No. of GAs with a documented combined management plan
GA status reports (GA book complete)
11. Community exchange visits
rejected
Project Implementation CBRLM Sub-Activity Final Report
Page | 85
Some of this information was based on past monthly reports, but there was a need for
constant updating. Indicators such as “doing combined herding” or having a “functional
committee” could change for any GA between one quarter and the next.
The spreadsheet was useful for reporting on the number of GAs achieving key status
indicators, including the specified MCA-N monitoring indicators based on GA status reports.
However, as with other information from the GA status reports, two weaknesses need to
be recognised.
First is the problem of verification. For example it was not unusual for a component leader
to report an indicator status for a GA that was different from the status reported by the
regional manager. These discrepancies could be partly explained by the second weakness,
which was lack of clear definitions of some status indicators.
The indicator of “the number of GAs doing combined herding” is a case in point. MCA-N
attempted to elaborate with the following expanded definition:
“The number of GA communities that have agreed to combined herding,
which is where two or more cattle-owning households using the GA agree
to bring the cattle that graze in that GA together on a daily basis and
herd them in a compact group through the day before returning to
individual household kraals for the night.”
Even this more detailed definition leaves room for inconsistent reporting. Just how compact
the herd has to be to qualify is not clear. Some FF regarded taking cattle to the same
general area and letting them roam all day as qualifying. And the notion of “daily basis” has
also been interpreted in different ways. Some FFs regard bringing herds together on “most
days”, or even “some days” as qualifying.
Given the crucial importance of PGCH in CBRLM´s theory of change, the lack of a rigorous
monitoring mechanism to regularly and reliably determine adherence to and quality of
PGCH was a major shortcoming. Given that development and implementation of such a
mechanism is a challenging and resource-intensive task, it seems that none of the CBRLM
stakeholders felt eager to do more than contractually obliged to with regards to that task. A
clear definition of roles and responsibilities in this regard from the donor side might have
prevented this.
5. Field facilitator and training of trainers database
A database has been maintained of all training of trainer events. These have included
formal training events at central or regional locations, as well as field training events such
as GALA training. This database has enabled the training coordinator to keep track of which
FFs, extension staff, herder trainers and livestock agents have received which training by
event and topic. This has been used as one of the criteria for awarding CBRLM certificates.
Project Implementation CBRLM Sub-Activity Final Report
Page | 86
BENEFICIARY PROFILES
6. Household and livestock inventory
A household and livestock inventory record was collected and maintained for all
households in GA communities. This record includes information on household
membership, as well as livestock ownership. An additional form aims to record cattle
disposals and acquisitions. This data collection instrument was reviewed in detail by the
Data Quality Review Team and recommended adjustments were made to the data
collection format and analysis.
Detailed information on household demographics and livestock ownership in particular is
not only essential for the purposes of project monitoring, evaluation and reporting, but also
for project implementation by both the implementer and the CBRLM communities. Exact
knowledge about cattle numbers and ownership are crucial if GA communities are to
manage their resources and livestock as intended. For example, per-animal contributions to
the GA fund and CBRLM bull payments as promoted by the Project depend on exact and
continuous record-keeping of cattle numbers and corresponding owners. The latter is also
crucial for the assessment of needs, definition of goals and process-monitoring with regards
to herd restructuring.
The household and livestock inventory database fulfilled most of its objectives. It served as
a tangible form of household registration, allowing a certificate of registration to be printed
for each participating household, with details about the family and composition of livestock
owned. It also produced a verified quantification of one of the monitoring indicators: the
number of participating households registered in the programme.
At the GA level the overall herd structure and ownership pattern was produced for
inclusion in the GA book, to be used as a basis for discussions about herd restructuring and
payment contributions to the GA fund.
The collection of household and cattle inventory data was a rolling process because new
GAs continued to be mobilized up to the end of 2012. Thus GA herds were enumerated at
different times. Even within a GA some households registered later than others and the
livestock within that GA would not all be registered in the same month.
This posed a problem with assessing changes in GA herds over time. However a more
important problem in this regard was the difficulty households had in reconciling changes in
numbers of their cattle registered between one enumeration and the next (usually a year
later). The difference in number and classes of cattle between one year and next was clear,
but households were not able to accurately account for the changes in terms of methods of
acquisitions and disposals through the year. Thus it was not possible to get good
information on the proportion cattle sold versus slaughtered or given away. What became
clear from the cattle enumeration inventories over time was the high fluidity of GA herds,
both in terms of size and composition over time, with most changes being due to receiving
cattle into the herd or giving/taking cattle away from the herd. Changes due to births,
deaths, sales and slaughters were small in comparison.
Project Implementation CBRLM Sub-Activity Final Report
Page | 87
2.3.1.2 CONCLUSION
For two thirds of the duration of this project the data management team consisted of one
part time adviser and one full time data management staff member. Increases in the
volume of data collection and reporting tasks towards the end of the project prompted the
employment of an additional full time data management staff member.
A consequence of the limited staffing for data management was that M&E staff were not
able to visit the field very much. With greater staffing capacity and more frequent visits to
field sites, it is likely that the quality of the data collection could have been improved. In
particular, more time should have been spent in the field with FFs and regional managers to
develop practical ways of measuring and verifying GA status indicators.
However, it should be noted that even if the quality of the monitoring data collected and
reported could have been improved, the value of doing so is dependent on the findings
being utilised to make appropriate adjustments to management and planning. Where good
quality information has been appropriately analysed and reported in a timely manner, it
has not resulted in management changes. In this sense the project did do as well as it could
to meet the general monitoring ToR, which was to: “establish mechanisms to monitor
progress, resolve conflict among stakeholders and provide feedback that allows adjustment
to management in response to learned experience and new knowledge”.
2.3.2 EXTERNAL EVALUATION
The CBRLM project was subject to a rigorous external impact evaluation. The external
evaluation was based on an experimental randomised controlled trial (RCT) approach and
conducted by Innovations for Poverty Action (IPA).
The rigorous experimental nature of the external impact evaluation had huge implications
on the setup and implementation of CBRLM.
Before actual CBRLM implementation started, it required the implementer to identify a
sample of 41 potential Rangeland Intervention Areas (RIA) according to a set of criteria like
concentration of livestock, absence of illegal fencing, etc10. These RIAs are areas with an
average size of almost 1000 km² and served as the units of randomisation. One half of the
RIAs was subsequently randomly assigned to receive the treatment (i.e. the CBRLM
project), the other half was assigned to serve as control areas, meaning that no CBRLM
implementation would take place in these areas. This would result in both a treatment and
a control sample, which apart from the CBRLM intervention would on average be identical
with regards to selected relevant indicators. The treatment and control samples could be
compared before, during and after the project in order to rigorously determine the impact
brought about by CBRLM.
An area the size of a RIA was much too vast to receive full coverage of CBRLM in the given
project setup. Therefore, before randomisation took place, the CBRLM implementer was
10 See the CBRLM RIA Eligibility Report from July 2010 for more information on this process.
Project Implementation CBRLM Sub-Activity Final Report
Page | 88
also asked to concretely identify GAs which would most likely participate in the project
within all the potential RIAs, i.e. a prediction was to be made about which GA communities
would participate in the project before actual GA-level mobilisation could take place.
In the implementer´s view, which had been communicated to all relevant stakeholders
throughout the CBRLM project period, this approach was flawed by two major conceptual
problems: The first problem is intrinsic to the applied RCT approach. In order to identify the
study sample, communities must be pre-mobilised under the caveat that they might not
receive any treatment/support. This means that this pre-mobilisation must be as non-
invasive as possible in order to avoid negative repercussions on both project
implementation and evaluation. The second problem is a direct consequence of the first,
namely that the implementer was not able to reliably predict participation by certain
communities in a community-based intervention without previous intensive mobilisation
(and to adhere to these predictions later on).
The CBRLM project was implemented only in GAs that lie within the boundaries of
treatment RIAs and intensive GA-level mobilisation only started once randomisation had
been done. However, it turned out that the overlap between GA communities that had
been predicted previously and GA communities that actually committed to and participated
in CBRLM was much lower than expected, hence rendering the identified sample areas in
control RIAs as well as all data collected by the evaluator through several baseline surveys
irrelevant for utilisation in line with the initial RCT concept.
The impact evaluation approach was subsequently adapted and a revised evaluation
strategy was developed to objectively identify new samples of survey areas in both
treatment and control RIAs ex post. Since the baseline data had to be discarded, the
current revised evaluation approach will not be able to determine the absolute change (i.e.
CBRLM impact plus any other factor that might influence the indicators under observation)
that took place in both treatment and control areas during CBRLM as compared to the
initial situation before project start. Instead, it constitutes an endline-only evaluation,
aiming at determining the net impact of the project compared to control areas.
Concluding, it appears to the implementer that the applied external evaluation approach –
while in theory being clearly advantageous over other approaches – in practice was
associated with major trade-offs. Given the size, complexity and pilot-nature of the CBRLM
project and the resulting need for flexibility in terms of implementation, it is questionable
whether a very rigid evaluation approach that requires absolute adherence to an
experimental framework laid out before actual project implementation is the most
appropriate choice. Furthermore, it should be noted that, by requiring adherence to a rigid
experimental setup, the evaluation approach per se had a distorting impact on project
implementation in terms of freely selecting intervention areas and associated logistical
efforts. In other words, the evaluation is inevitably evaluating a project that would have
been implemented in a different way if it had not been evaluated. Nevertheless, the CBRLM
implementer tried to meet all requirements asked for by the external evaluator and
provided substantial support to IPA field staff and their efforts wherever possible. It is
hoped that, despite mentioned challenges, the external evaluation through the revised
design will be able to find evidence on the impact CBRLM had on its target groups.
Project Implementation CBRLM Sub-Activity Final Report
Page | 89
At the time of writing, the external evaluation is still ongoing. After consultations with the
implementer, the evaluator decided to complement the quantitative evaluation design with
a qualitative component. This additional component is to take place in late 2014.
Furthermore, the evaluator decided to conduct a behavioural assessment in late 2014 as
part of the quantitative evaluation design, which will attempt to measure differences in
CBRLM-related practices and behaviour by project communities as compared to control
communities. This behavioural assessment will inform viability and design of the final
endline data collection on physical CBRLM outcomes. The latter is envisaged to take place
in late 2015.
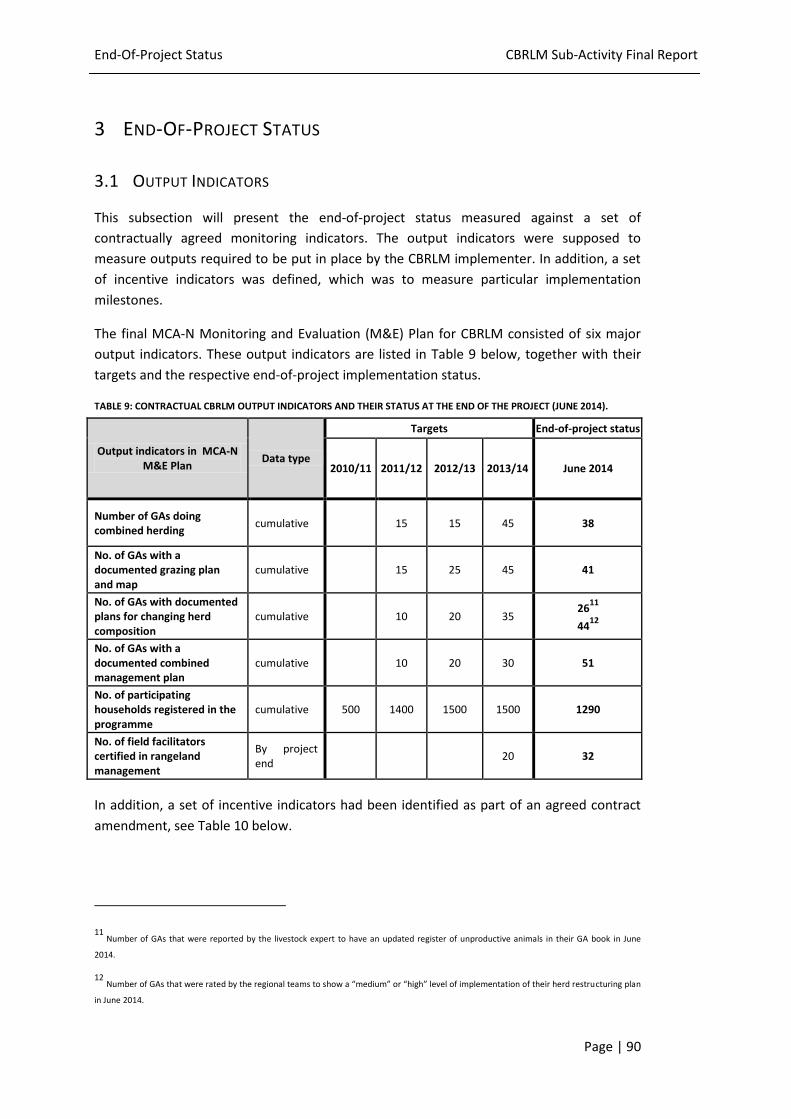
End-Of-Project Status CBRLM Sub-Activity Final Report
Page | 90
3 END-OF-PROJECT STATUS
3.1 OUTPUT INDICATORS
This subsection will present the end-of-project status measured against a set of
contractually agreed monitoring indicators. The output indicators were supposed to
measure outputs required to be put in place by the CBRLM implementer. In addition, a set
of incentive indicators was defined, which was to measure particular implementation
milestones.
The final MCA-N Monitoring and Evaluation (M&E) Plan for CBRLM consisted of six major
output indicators. These output indicators are listed in Table 9 below, together with their
targets and the respective end-of-project implementation status.
TABLE 9: CONTRACTUAL CBRLM OUTPUT INDICATORS AND THEIR STATUS AT THE END OF THE PROJECT (JUNE 2014).
In addition, a set of incentive indicators had been identified as part of an agreed contract
amendment, see Table 10 below.
11 Number of GAs that were reported by the livestock expert to have an updated register of unproductive animals in their GA book in June
2014.
12 Number of GAs that were rated by the regional teams to show a “medium” or “high” level of implementation of their herd restructuring plan
in June 2014.
Output indicators in MCA-N M&E Plan
Data type
Targets End-of-project status
2010/11 2011/12 2012/13 2013/14 June 2014
Number of GAs doing combined herding
cumulative
15 15 45 38
No. of GAs with a documented grazing plan and map
cumulative
15 25 45 41
No. of GAs with documented plans for changing herd composition
cumulative
10 20 35 26
11
4412
No. of GAs with a documented combined management plan
cumulative
10 20 30 51
No. of participating households registered in the programme
cumulative 500 1400 1500 1500 1290
No. of field facilitators certified in rangeland management
By project end
20 32
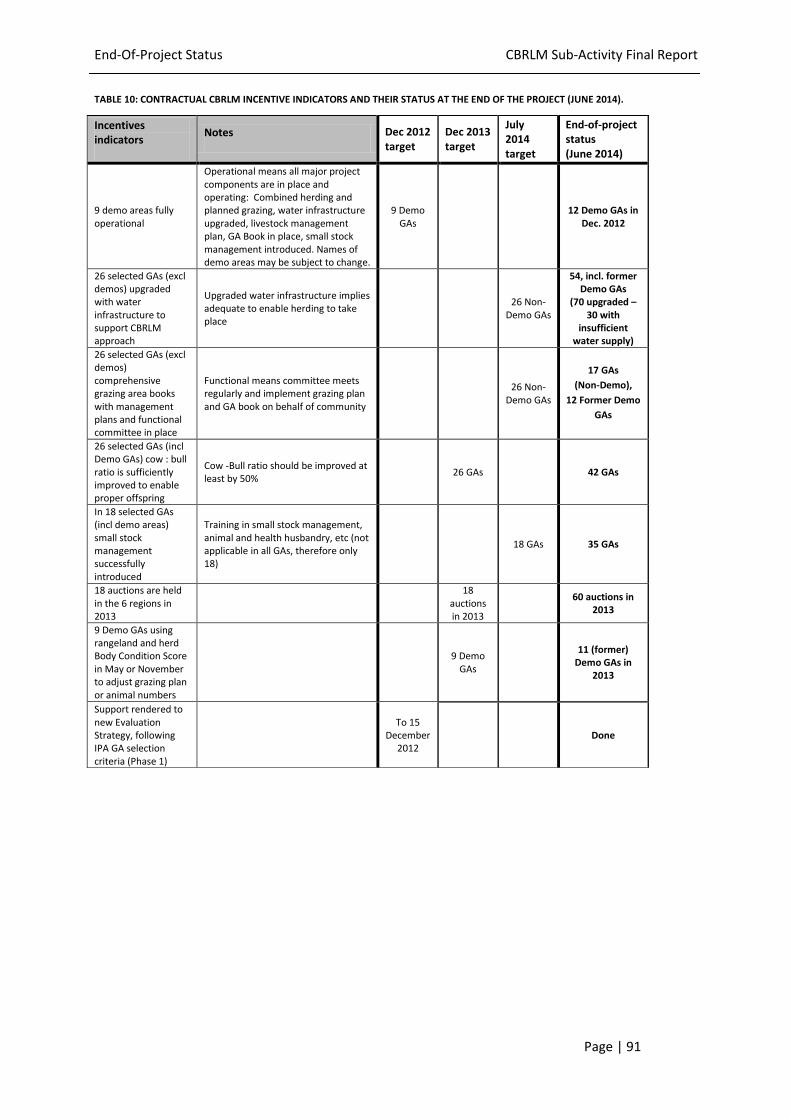
End-Of-Project Status CBRLM Sub-Activity Final Report
Page | 91
TABLE 10: CONTRACTUAL CBRLM INCENTIVE INDICATORS AND THEIR STATUS AT THE END OF THE PROJECT (JUNE 2014).
Incentives indicators
Notes Dec 2012 target
Dec 2013 target
July 2014 target
End-of-project status (June 2014)
9 demo areas fully operational
Operational means all major project components are in place and operating: Combined herding and planned grazing, water infrastructure upgraded, livestock management plan, GA Book in place, small stock management introduced. Names of demo areas may be subject to change.
9 Demo GAs
12 Demo GAs in
Dec. 2012
26 selected GAs (excl demos) upgraded with water infrastructure to support CBRLM approach
Upgraded water infrastructure implies adequate to enable herding to take place
26 Non-
Demo GAs
54, incl. former Demo GAs
(70 upgraded – 30 with
insufficient water supply)
26 selected GAs (excl demos) comprehensive grazing area books with management plans and functional committee in place
Functional means committee meets regularly and implement grazing plan and GA book on behalf of community
26 Non-
Demo GAs
17 GAs
(Non-Demo),
12 Former Demo
GAs
26 selected GAs (incl Demo GAs) cow : bull ratio is sufficiently improved to enable proper offspring
Cow -Bull ratio should be improved at least by 50%
26 GAs 42 GAs
In 18 selected GAs (incl demo areas) small stock management successfully introduced
Training in small stock management, animal and health husbandry, etc (not applicable in all GAs, therefore only 18)
18 GAs 35 GAs
18 auctions are held in the 6 regions in 2013
18
auctions in 2013
60 auctions in
2013
9 Demo GAs using rangeland and herd Body Condition Score in May or November to adjust grazing plan or animal numbers
9 Demo
GAs
11 (former) Demo GAs in
2013
Support rendered to new Evaluation Strategy, following IPA GA selection criteria (Phase 1)
To 15
December 2012
Done
End-Of-Project Status CBRLM Sub-Activity Final Report
Page | 92
3.2 OUTCOMES AND SUSTAINABILITY
Most of the contractual monitoring indicators listed in section 3.1 are related to project
outputs rather than outcomes. Actual expected CBRLM outcomes, namely improved
rangeland condition, increased livestock off-take and increased wealth of communal
farmers, are not directly captured by these indicators. While GA-level inputs from the
project certainly contribute to these outcomes, the latter crucially depend on
comprehensive and sustainable changes in the behaviour of the GA communities with
regards to rangeland and livestock management as well as livestock marketing. In other
words, the CBRLM outcomes do not only depend on the implementer´s inputs, but even
more strongly on what the project communities do. While the implementer does not claim
to be in a position to objectively determine the outcomes or measure the impact of
CBRLM13, the present subsection presents the implementer´s perspective on the CBRLM-
related performance as well as the prospect of sustainability of the different GA
communities.
3.2.1 GA PERFORMANCE
In late 2013, before the final six months of project implementation, the implementer
carried out an internal GA performance evaluation 14 . Besides the collection of
comprehensive monitoring information, the purpose of this exercise was to determine for
every active GA the performance of the GA community with regards to CBRLM activities.
The information collected would not only inform implementation during the final phase of
the project, but also activities by any potential stakeholders who might work with the
CBRLM GAs after the CBRLM implementation timeframe. The following paragraph
summarises the findings for key activities practiced by the GA communities as observed in
an average CBRLM GA.
By project end in June 2014, the average GA committee had been in existence for almost
exactly two years. The communities indicated that, on average and under normal
conditions (i.e. in average-rainfall years), 84% of all households that have livestock in a GA
were participating in CBRLM and that 74% of all cattle in a GA were part of the combined
herd, which on average entailed 650 heads of cattle.
According to (self-reported) information provided by GA communities during the internal
evaluation surveys, the average CBRLM GA did seven months of combined herding and
followed a grazing plan for about five months in 2013. Note that there is no information
available on the quality and intensity of implementation of both planned grazing and
combined herding.
In the average GA, no significant adjustment of animal numbers to available fodder through
13 The CBRLM project is undergoing a rigorous external impact evaluation, see section 2.3.2.
14 For further reading on the internal evaluation and its findings, refer to the report “CBRLM Internal GA Performance Evaluation – Outcomes &
Results” from March 2014. This report includes the survey questionnaires. The entire dataset of the internal evaluation has been shared with
MAWF and MCA-N.
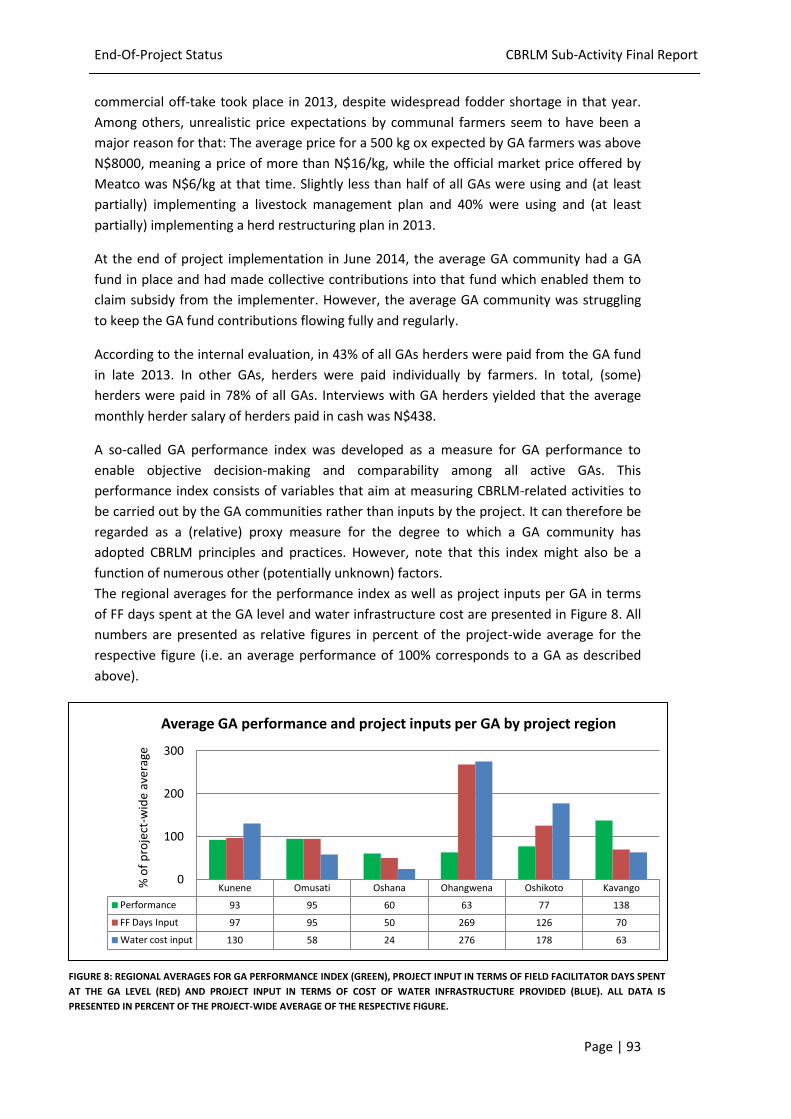
End-Of-Project Status CBRLM Sub-Activity Final Report
Page | 93
commercial off-take took place in 2013, despite widespread fodder shortage in that year.
Among others, unrealistic price expectations by communal farmers seem to have been a
major reason for that: The average price for a 500 kg ox expected by GA farmers was above
N$8000, meaning a price of more than N$16/kg, while the official market price offered by
Meatco was N$6/kg at that time. Slightly less than half of all GAs were using and (at least
partially) implementing a livestock management plan and 40% were using and (at least
partially) implementing a herd restructuring plan in 2013.
At the end of project implementation in June 2014, the average GA community had a GA
fund in place and had made collective contributions into that fund which enabled them to
claim subsidy from the implementer. However, the average GA community was struggling
to keep the GA fund contributions flowing fully and regularly.
According to the internal evaluation, in 43% of all GAs herders were paid from the GA fund
in late 2013. In other GAs, herders were paid individually by farmers. In total, (some)
herders were paid in 78% of all GAs. Interviews with GA herders yielded that the average
monthly herder salary of herders paid in cash was N$438.
A so-called GA performance index was developed as a measure for GA performance to
enable objective decision-making and comparability among all active GAs. This
performance index consists of variables that aim at measuring CBRLM-related activities to
be carried out by the GA communities rather than inputs by the project. It can therefore be
regarded as a (relative) proxy measure for the degree to which a GA community has
adopted CBRLM principles and practices. However, note that this index might also be a
function of numerous other (potentially unknown) factors.
The regional averages for the performance index as well as project inputs per GA in terms
of FF days spent at the GA level and water infrastructure cost are presented in Figure 8. All
numbers are presented as relative figures in percent of the project-wide average for the
respective figure (i.e. an average performance of 100% corresponds to a GA as described
above).
FIGURE 8: REGIONAL AVERAGES FOR GA PERFORMANCE INDEX (GREEN), PROJECT INPUT IN TERMS OF FIELD FACILITATOR DAYS SPENT
AT THE GA LEVEL (RED) AND PROJECT INPUT IN TERMS OF COST OF WATER INFRASTRUCTURE PROVIDED (BLUE). ALL DATA IS
PRESENTED IN PERCENT OF THE PROJECT-WIDE AVERAGE OF THE RESPECTIVE FIGURE.
Kunene Omusati Oshana Ohangwena Oshikoto Kavango
Performance 93 95 60 63 77 138
FF Days Input 97 95 50 269 126 70
Water cost input 130 58 24 276 178 63
0
100
200
300
% o
f p
roje
ct-w
ide
aver
age
Average GA performance and project inputs per GA by project region
End-Of-Project Status CBRLM Sub-Activity Final Report
Page | 94
Figure 8 shows that there are considerable differences between the project regions with
regards to both GA performance and project inputs.
The average GA in Kunene and Omusati regions is close the average GA described above in
terms of performance. However, note that these two regions were most severely affected
by low rainfall and resulting fodder shortage in both 2012 and 2013. In both years, the core
CBRLM practice of PGCH was only feasible to a limited degree. However, even though this
situation threatened the existence of many communal farmers in these two regions, the GA
farmers did not adjust their animal numbers through sale as promoted by CBRLM, but
rather took the risk of seeing their animals starve.
GAs in Oshana region seem to perform far below average. However, this can be attributed
at least partially to the fact that CBRLM mobilisation and implementation started very late
in Oshana region as compared to other regions, mainly because the GAs in Oshana were
hardly accessible due to flooding in 2010 and 2011. Furthermore, water availability is very
poor in this region due to groundwater salinity, which constitutes another obstacle for
thorough CBRLM implementation. These issues are also reflected by the relatively low input
in terms of field facilitator days and low water infrastructure cost.
GAs in Ohangwena region also perform far below average, but show a completely reversed
picture with regards to project inputs. Three out of the four active GAs in Ohangwena
regions are former Demo GAs, meaning that they received more intensive facilitation and
more timely and thorough investment in water infrastructure than other GAs. The strong
difference in terms of inputs as compared to other regions can also be explained by the
major infrastructure provision in form of an earth dam at GA Ngishongwa as well as the fact
that in Ohangwena only two GAs were covered by one field facilitator, while in other
regions it was between three and six GAs per field facilitator. Besides possible shortcomings
in facilitation from the side of the implementer, potential reasons for the skewed relation
between project input and GA performance in Ohangwena were mentioned to be the
politicised atmosphere in the region and the limited dependency of communities on
livestock because of subsistence cropping. All these factors might negatively affect the
readiness of communities to organise themselves, change their mindset and adopt new
management practices as introduced by CBRLM.
Average GA performance in Oshikoto region was found to be better than in Ohangwena,
but still well below project average. Project inputs to that region are above project average.
In this region, a lot of FF time has been spent on the mobilisation of traditional authorities
and communities in RIA King Nehale at the northern border of Etosha National Park, since
this area has a high population density and also seems to be highly politicised.
Furthermore, like for the GAs in Oshana region, the area suffers from poor water quality
and availability, so that instead of drilling boreholes, the only option for water provision
was the costly extension of pipelines to the GAs.
The performance index for the Kavango regions is well above project average. While this
might be attributed also to above-average quality of facilitation and organisation of the
regional team, there are some factors which might have made CBRLM implementation
easier in Kavango regions as compared to other regions: Kavango in general receives most
rain of all project regions and fodder shortage does not seem as critical as in the other
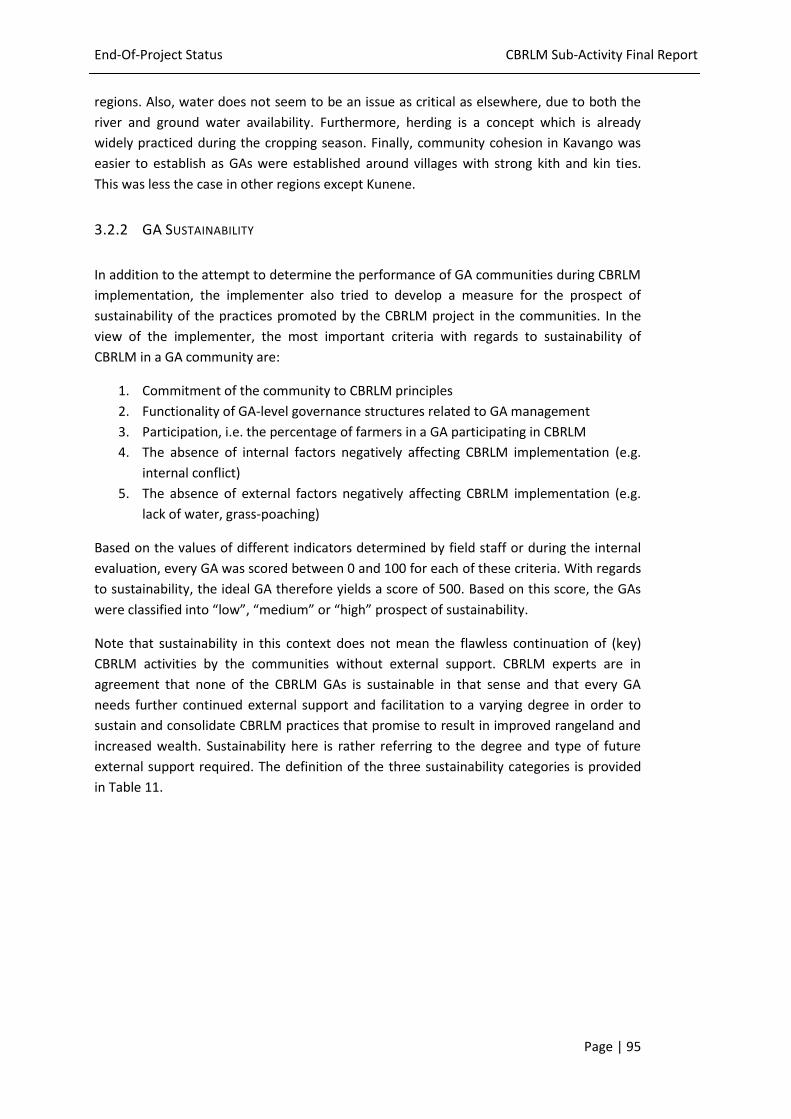
End-Of-Project Status CBRLM Sub-Activity Final Report
Page | 95
regions. Also, water does not seem to be an issue as critical as elsewhere, due to both the
river and ground water availability. Furthermore, herding is a concept which is already
widely practiced during the cropping season. Finally, community cohesion in Kavango was
easier to establish as GAs were established around villages with strong kith and kin ties.
This was less the case in other regions except Kunene.
3.2.2 GA SUSTAINABILITY
In addition to the attempt to determine the performance of GA communities during CBRLM
implementation, the implementer also tried to develop a measure for the prospect of
sustainability of the practices promoted by the CBRLM project in the communities. In the
view of the implementer, the most important criteria with regards to sustainability of
CBRLM in a GA community are:
1. Commitment of the community to CBRLM principles
2. Functionality of GA-level governance structures related to GA management
3. Participation, i.e. the percentage of farmers in a GA participating in CBRLM
4. The absence of internal factors negatively affecting CBRLM implementation (e.g.
internal conflict)
5. The absence of external factors negatively affecting CBRLM implementation (e.g.
lack of water, grass-poaching)
Based on the values of different indicators determined by field staff or during the internal
evaluation, every GA was scored between 0 and 100 for each of these criteria. With regards
to sustainability, the ideal GA therefore yields a score of 500. Based on this score, the GAs
were classified into “low”, “medium” or “high” prospect of sustainability.
Note that sustainability in this context does not mean the flawless continuation of (key)
CBRLM activities by the communities without external support. CBRLM experts are in
agreement that none of the CBRLM GAs is sustainable in that sense and that every GA
needs further continued external support and facilitation to a varying degree in order to
sustain and consolidate CBRLM practices that promise to result in improved rangeland and
increased wealth. Sustainability here is rather referring to the degree and type of future
external support required. The definition of the three sustainability categories is provided
in Table 11.
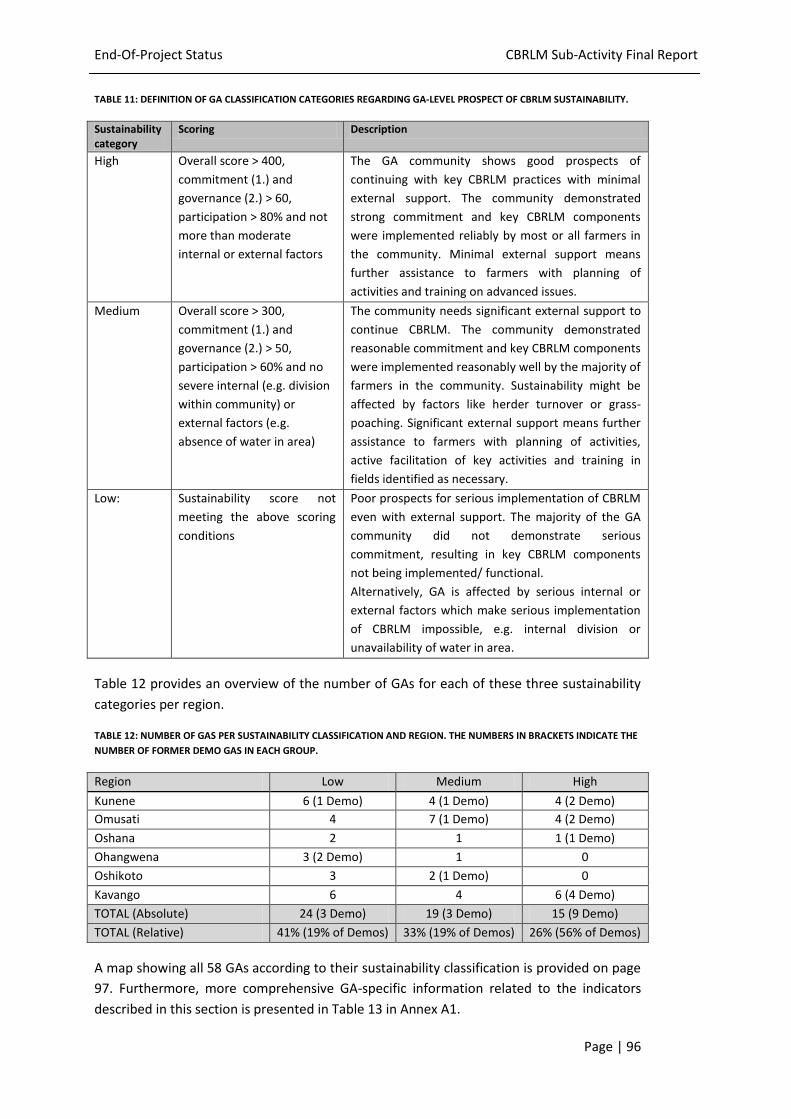
End-Of-Project Status CBRLM Sub-Activity Final Report
Page | 96
TABLE 11: DEFINITION OF GA CLASSIFICATION CATEGORIES REGARDING GA-LEVEL PROSPECT OF CBRLM SUSTAINABILITY.
Sustainability category
Scoring Description
High Overall score > 400,
commitment (1.) and
governance (2.) > 60,
participation > 80% and not
more than moderate
internal or external factors
The GA community shows good prospects of
continuing with key CBRLM practices with minimal
external support. The community demonstrated
strong commitment and key CBRLM components
were implemented reliably by most or all farmers in
the community. Minimal external support means
further assistance to farmers with planning of
activities and training on advanced issues.
Medium Overall score > 300,
commitment (1.) and
governance (2.) > 50,
participation > 60% and no
severe internal (e.g. division
within community) or
external factors (e.g.
absence of water in area)
The community needs significant external support to
continue CBRLM. The community demonstrated
reasonable commitment and key CBRLM components
were implemented reasonably well by the majority of
farmers in the community. Sustainability might be
affected by factors like herder turnover or grass-
poaching. Significant external support means further
assistance to farmers with planning of activities,
active facilitation of key activities and training in
fields identified as necessary.
Low: Sustainability score not
meeting the above scoring
conditions
Poor prospects for serious implementation of CBRLM
even with external support. The majority of the GA
community did not demonstrate serious
commitment, resulting in key CBRLM components
not being implemented/ functional.
Alternatively, GA is affected by serious internal or
external factors which make serious implementation
of CBRLM impossible, e.g. internal division or
unavailability of water in area.
Table 12 provides an overview of the number of GAs for each of these three sustainability
categories per region.
TABLE 12: NUMBER OF GAS PER SUSTAINABILITY CLASSIFICATION AND REGION. THE NUMBERS IN BRACKETS INDICATE THE
NUMBER OF FORMER DEMO GAS IN EACH GROUP.
Region Low Medium High
Kunene 6 (1 Demo) 4 (1 Demo) 4 (2 Demo)
Omusati 4 7 (1 Demo) 4 (2 Demo)
Oshana 2 1 1 (1 Demo)
Ohangwena 3 (2 Demo) 1 0
Oshikoto 3 2 (1 Demo) 0
Kavango 6 4 6 (4 Demo)
TOTAL (Absolute) 24 (3 Demo) 19 (3 Demo) 15 (9 Demo)
TOTAL (Relative) 41% (19% of Demos) 33% (19% of Demos) 26% (56% of Demos)
A map showing all 58 GAs according to their sustainability classification is provided on page
97. Furthermore, more comprehensive GA-specific information related to the indicators
described in this section is presented in Table 13 in Annex A1.
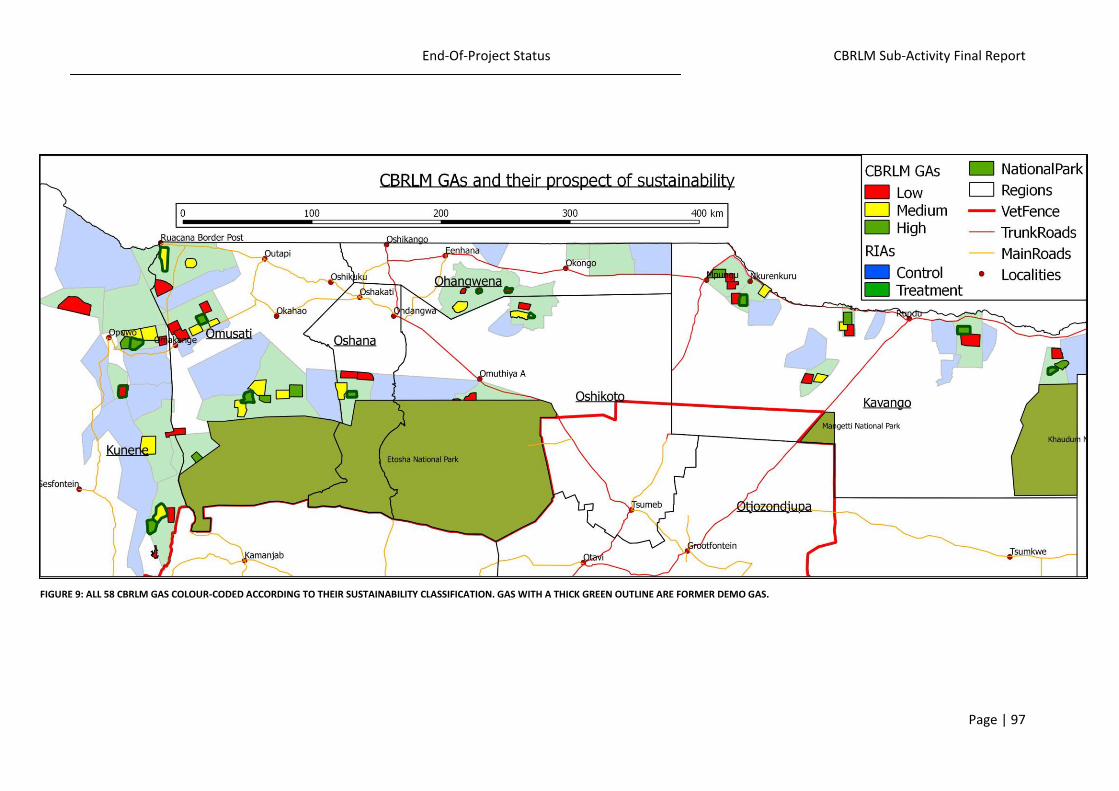
End-Of-Project Status CBRLM Sub-Activity Final Report
Page | 97
FIGURE 9: ALL 58 CBRLM GAS COLOUR-CODED ACCORDING TO THEIR SUSTAINABILITY CLASSIFICATION. GAS WITH A THICK GREEN OUTLINE ARE FORMER DEMO GAS.
End-Of-Project Status CBRLM Sub-Activity Final Report
Page | 98
3.3 CBRLM HANDOVER TO MAWF
The Ministry of Agriculture, Water and Forestry indicated its willingness to carry on
supporting CBRLM activities that are in line with the mandates of its different directorates,
in particular DEES, DVS and DWSSC. In addition, these directorates will serve as the
custodians of some of the project outputs, e.g. water infrastructure and SSPOS monitoring.
In order to facilitate and guide the continuation of CBRLM activities by MAWF staff, hard-
and soft copies of all documentation, planning and training materials and all major reports
that were developed and applied in CBRLM will be handed over to MAWF.
Regarding the bull scheme, it is paramount that the monitoring of bulls be continued in
order to guide future decisions on the approach to follow on genetic conservation and
improvement. Each DEES regional office shall receive a hard copy file of the bull registration
certificates and contracts signed between CBRLM and GAs. The SSPOS is on activity that
DEES has vowed to make sure that the pass on of new goats to secondary beneficiaries will
be monitored to make sure that it happen. Again the contracts signed by the beneficiaries
shall be handed over to the respective DEES regional head quarters in a hard copy file and
were soft copy data base.
Seven mobile crush pen and scale units were procured by MCA-N and were used for
livestock handling and for marketing activities during CBRLM implementation. These scales
are being serviced to make sure they are in a usable form. Their future use will be decided
upon by MCA-N according to procedures to be approved by MCC. The implementer strongly
recommends that these materials be handed over to the six regional cooperatives to
support their future operations.
With regards to water infrastructure, a final water infrastructure report has been produced
by the CBRLM project which contains detailed information on all water infrastructure sites.
Since construction at some water sites was not yet finished when the final water
infrastructure report was submitted, detailed information on these sites will be provided as
soon as possible in order to give DWSSC a complete and consistent picture.
Once completed, all water infrastructure is to be handed over to DWSSC. At time of writing,
however, this has happened only in GAs in Oshikoto region. However this is the
responsibility of MCA-N being directly in charge of the water component.
All communities that received any water infrastructure through CBRLM were to be trained
in water infrastructure maintenance and management before handover to DWSSC would
take place. This training was conducted by DWSSC and took place in most GAs. At the time
of writing, all GAs outside of Omusati and Oshana regions received the DWSSC training
required before handover.
End-Of-Project Status CBRLM Sub-Activity Final Report
Page | 99
3.4 IMPLEMENTATION SUCCESSES
In terms of meeting its contractual obligations, the implementation of the CBRLM project
can be rated as highly successful. The project by far exceeded most of its contractual
targets. Few targets were not met entirely, but the achievements were only slightly below
the defined target value. Most outputs by the Project went far beyond contractual targets.
In addition, components in the original terms of reference were expanded in scope and cost
and additional complementary components were added to enhance overall project
performance.
STAFFING AND ADMINISTRATION
In the inception report it was planned to staff the project with five full-time experts,
including the team leader and two part-time experts. By the end of the project five of these
seven experts were still employed with CBRLM. Two of the experts (community
development and marketing) were replaced two years into the project and their
replacements remained until project end. Such a level of consistency in projects of this
nature is rare.
The project expert staff cadre expanded beyond original plans to accommodate some of
the expanded activities. A water engineer was recruited directly by MCA-N to support the
implementation of the expanded water component. A second training expert was recruited
to support the training of facilitators, which had expanded into an ongoing training cum
implementation support activity. An additional livestock assistant expert was brought in to
support the livestock production component, which expanded to include livestock schemes
(bull, SSPOS) not foreseen in the initial project ToR.
At the field level, the original staffing plan comprised three regional field managers (initially
called community liaison officers) and 12 field facilitators. By the end of the project there
were four regional managers and the cadre of field facilitators had expanded to 18, i.e. a
total of 22 field staff. To these have been added six professional herder trainers. The
number of project vehicles went up from an initial 16 to finally 24.
From 2012 onwards, the project successfully administered a DEES overtime budget line in
order to enable improved DEES participation in the project. Another additional challenge
for CBRLM management was the inclusion of the six livestock marketing cooperatives into
the project from late 2012 on, for which a new budget line was contracted without
additional staffing.
The logistical and administrative implications of this significant number of staff through the
project were handled efficiently and effectively by the team leader and GOPA backstopping
staff.
STAKEHOLDER LIAISON AND AWARENESS OF CBRLM
From the start of the project and throughout its implementation a great deal of effort was
put into liaison at both government and local authority levels. In this regard the project was
given full support and assistance by MCA-N. At inception, the MCA-N CEO and senior
managers toured the NCAs with project staff to explain its scope and objectives and to get
buy in from local leaders. MAWF was involved with initial RIA definition and selection.
End-Of-Project Status CBRLM Sub-Activity Final Report
Page | 100
Throughout the project local leaders and DEES management were kept informed about
project progress. DEES staff were included in training activities from the beginning. Regional
radio programmes were aired to inform the public about the project, publicity events were
held and publicity materials produced. A CBRLM web-site was designed and published
(www.cbrlm.org).
The result of this is that there is now a greatly increased awareness of the concept of
CBRLM among stakeholders at all levels, nationally, regionally and at community level. In
support of this there now exists a good set of materials on the concept of CBRLM. These
materials have been handed over to DEES.
Towards the end of the project, MAWF management seem to have recognised the
usefulness of the CBRLM approach and have therefore expressed their willingness to
continue best practices in a more limited scope.
ADAPTIVE TRAINING AND LEARNING APPROACH
The original thinking in the project design was that the FFs would be trained by experts in
the concepts and techniques of CBRLM. The FFs would then go into the field and train GA
communities on how to implement CBRLM. Thereafter it was expected that project staff
would support communities to implement CBRLM.
At the inception of the project it was recognised that the field facilitators did not only need
to have technical knowledge and skills in relation to CBRLM, but they also needed
facilitation skills to enable them to deliver the CBRLM message in ways that communities
could appreciate, understand and commit to. It was also realized that facilitation skills were
best acquired using a learning-by-doing approach. For this reason the “training of
facilitators” events moved to being a mix of classroom and field based activities.
At the same time it became apparent that it was not possible to separate training (of FFs
and communities) from implementation. With the pressure to achieve project
implementation goals, it became necessary to combine training of field staff, training of
communities and implementation of project components. This fitted in with the realization
that one-off training is not sufficient either for FFs or for communities. Support for
implementation therefore became opportunities to provide follow-up training and
mentoring.
The entire training intervention was a massive part of the project, reaching many hundred
persons ranging from GOPA field staff, DEES, DVS, communities, herders to cooperatives.
Highly professional training materials like the CBRLM reader were developed.
An important lesson from this experience is that for CBRLM to be successfully adopted
requires behavioural change to take place on a number of fronts at the same time and this
cannot be achieved with one-off training events. The implication is that continuous follow
up support, mentoring and training is needed.
End-Of-Project Status CBRLM Sub-Activity Final Report
Page | 101
PROVISION OF WATER POINT UPGRADES AND INSTALLATIONS
In order to implement combined herding and planned grazing, water points with sufficient
delivery capacity are required. It was soon discovered that adequate water facilities were
lacking in most GAs, which precluded those communities from implementing the PGCH
approach being advocated by CBRLM.
A water needs assessment was undertaken and a programme of water upgrades and new
installations was implemented. This required a significant expansion in the project budget
from less than US$1 million to US$4 million. The project amendment, infrastructure
specification, procurement, installation and commissioning required for the completion of
70 water points was a major undertaking. Even though some late-coming GAs were
provided water infrastructure only towards the very end of the project period, the
provision of water infrastructure at the described scale within the given timeframe
constitutes a remarkable accomplishment in itself.
CAPACITY DEVELOPMENT OF 58 GA COMMUNITIES
Although there has been considerable attrition, (43 communities who were mobilised and
showed initial commitment dropped out again), the support to 58 GA level "community
farms", which is well above the contractual target of 50, is a considerable achievement in
itself. It includes the establishment of a local governance structure to promote and manage
the practice of PGCH.
Required behavioural changes include the joint planning of rangeland management, joint
decisions on livestock management, joint planning of budgets and expenditures. In turn this
requires the establishment of a management organization which has the mandate of all
livestock owners. This does not only involve the transfer of management skills, it also
involves the empowerment of community organisations to take binding decisions that are
respected by and adhered to by everyone in the community. This does not happen
overnight, or even in 4 years. It needs continuing ongoing support.
All 58 GAs have digitized maps showing the boundary of the GA and the division of grazing
within the boundary into blocks. These maps are laminated and can be used to mark up
grazing plans for the coming season. Currently 41 communities have drawn up dry season
grazing plans with the help of project staff and 27 communities are following these plans
with combined herds. The reason that not all 58 communities are implementing PGCH are
numerous, but include the impact of drought, lack of herders, water supply issues and
organizational and management issues. With ongoing support many of these mitigating
circumstances can be expected to be resolved.
PROCUREMENT AND DELIVERY OF QUALITY BULLS TO GA COMMUNITIES
The successful delivery of 115 quality bulls to GA communities has been a major logistical
achievement. These bulls have been provided to GAs on the basis of a needs assessment.
The “cows to active bull ratio” for each GA herd was established using bull testing. Where
this was significantly higher than the standard of 25:1, bulls were procured to bring the
ratio in line with the standard. Tested and certified bulls were obtained, mostly from south
of the cordon fence.
End-Of-Project Status CBRLM Sub-Activity Final Report
Page | 102
GA communities signed a bull agreement in relation to the receipt of the bulls and a
schedule for repayment. Repayment was received in the form of cash (usually from cattle
sales) or goats. If payment was not forthcoming, the bull(s) were from the GA and
distributed it to other GAs needing bulls. As repayments came in the funds were used to
purchase additional bulls.
A major innovative feature of the scheme was that the bulls became the collective property
of the community and not of any individual in the community. The need for the community
to agree jointly on purchase of the bulls and to jointly make the required repayments
tested the cohesion of communities and stimulated joint planning. The successful
implementation of this innovative scheme is a major achievement of the project, which can
show the way for future projects and seems to have stimulated a market for bulls in the
NCAs.
MARKETING AND INSTITUTIONAL DEVELOPMENT
The CBRLM project has promoted livestock auctions in the six project regions. Prior to the
project auctions in the NCAs were organized by Agra and on average one auction was held
per month. From early 2013 until project end, almost one hundred auctions (i.e. an average
of more than five auctions per month) were held across all project regions by livestock
marketing cooperatives with initial support from the CBRLM project. The project has
assisted with the organization of auctions and training of auctioneers. This is the first time
such auction activity has been seen in the NCAs.
The promotion of auctions is part of a more general support to six livestock marketing
cooperatives. This support included training of board members on issues of cooperative
governance and support to establish and equip a cooperative secretariat to facilitate day to
day running of the Cooperative Forum and coordinate the activities of the six cooperatives.
The development of local institutions in the agricultural sector such as cooperatives is seen
as a key element in the development of the sector and in sustaining CBRLM in the NCAs.
The project has also pioneered work to investigate the feasibility of exporting meat and
processed meat products from the NCAs directly to the external markets of Angola and
Zimbabwe. All these initiatives will be taken forward by Meatco and the livestock marketing
cooperatives.
3.5 IMPLEMENTATION CHALLENGES AND SHORTCOMINGS
DROUGHT
Both the rainfall seasons of 2011/2012 and 2012/2013 yielded poor rainfall (i.e. significantly
below average), resulting in drought conditions in all project regions except Kavango
regions. In particular, the second drought year was strongly affecting CBRLM
implementation, since it coincided with the expansion phase of CBRLM activities from the
Demo GAs to the final set of 58 GAs. Particularly in the north-western regions, it was hard
to convince farmers of the benefits of CBRLM practices under these conditions. In the
hardest-hit areas PGCH was not viable given the prevailing extreme fodder shortage.
CBRLM was able to mitigate the first year of very poor fodder production with CBRLM GA
farmers reporting better animal body condition scores than their neighbours. A second
End-Of-Project Status CBRLM Sub-Activity Final Report
Page | 103
consecutive year of very poor fodder production combined with a collapse in beef prices
resulted in the CBRLM approach not being able to adapt to the circumstances and large-
scale movement of animals out of the GAs as well as deaths of livestock occurred. Markets
have as yet not adapted to the need to be able to absorb large numbers of livestock in poor
fodder years following several years of good fodder production, during which animal
numbers build up. This needs to be taken up at the highest policy levels.
LEVEL OF SUPPORT REQUIRED AT GA LEVEL
In this project the level of support provided by FFs directly to GA communities has been
very variable. The range has been from an average of 13 days per month over 36 months in
GA Wangolo to an average of 3.5 days per month over 13 months in GA Onandjila. This is
further compounded by the number of various activities that FFs needed to carry out at the
GA level. The expansion of the project from a focus on rangeland into new sectors diluted
the effect of FF support to key strategic activities.
For all GAs it is agreed that further follow-up support is needed for some time to come in
the areas of community governance, combined herding, grazing planning, joint budgeting
and livestock production. An indication of how long “some time to come” may be can be
gained by considering the support provided to IRDNC’s flagship grazing area that served as
the “demonstration” community that has been used frequently for exposure visits. IRDNC
support for Erora started in 2004 and is still ongoing 10 years later. Unfortunately, Erora
could not be supported by CBRLM since it was situated in a control RIA excluded from
implementation through the external evaluation framework. Therefore, the level of support
over the last 5 years declined. Erora has experienced three consecutive years of below-
average fodder production. Under these circumstances, tangible improvements in
rangeland management are not visible. Plans are underway to address this.
In addition, it has been observed that FFs require ongoing supervision. This applies to most
CBRLM FFs who have been awarded CBRLM certificates and have attended formal training
in both classroom and field and have received on-the-job training by CBRLM experts. To
provide intensive FF type support at community level, as well as supervision coverage
implies a very heavy input of support staff. This cannot possibly be provided by DEES staff
and implies the involvement of supplementary support, either from donor funded projects
or from the non-government sector.
As the CBRLM team leader was concentrating on the financial, administrative and
personnel aspects as well as the marketing component of the project, the rangeland expert
was promoted in January 2013 to deputy team leader with the additional task to coordinate
and monitor all GA level implementation aspects. However, this role was not fulfilled.
“GRASS POACHING”
Blocks within a GA that are being rested as part of the grazing plan will be attractive to un-
herded cattle and to herders from outside the GA. Resting grass is in danger of being
poached unless firm grazing rules are in place and can be enforced.
The CBRLM project design assumed that communities would establish grazing boundaries
around their GA which would be agreed with traditional authorities and neighbouring
communities. In most GAs, discussions with neighbouring communities have taken place
End-Of-Project Status CBRLM Sub-Activity Final Report
Page | 104
and boundaries were agreed to with few disputes. The GA committees had no means,
however, to enforce these boundaries and un-herded cattle entered from outside the GA
boundaries.
At the same time in some GAs not all livestock owners in a GA agree to include their
animals in the GA combined herd. Where participation is low this creates a serious problem
of “internal grass poaching”.
GA communities need stronger support to ensure they can protect the gains they make
through PGCH. Unless this happens communities will not continue to spend the
considerable time and effort needed to properly organize and implement PGCH. There is an
urgent need therefore to take forward the current initiatives being discussed about
registration of group rights, which will enable improved rangeland management.
DEMONSTRATION OF RANGELAND BENEFITS
The major objective of CBRLM is to arrest rangeland degradation and improve its
productivity. The practice of PGCH has been promoted to achieve this. For farmers to
continue to use any new practice, especially one that requires substantial behavioural
change at the group level, they need to see results.
A significant question in this regard is the level at which PGCH must take place for impact to
be seen and the length of time required. Partial and/or intermittent PGCH has been
common in the project GAs. Unfortunately, no quantitative learning took place about the
extent to which partial PGCH can be expected to achieve results.
There have been three major reasons for this. First, the way in which PGCH has
actually been applied has not been sufficiently well monitored. Monitoring the
effectiveness of application of grazing plans at 58 sites across the NCAs on a daily
basis is a complex undertaking for which the CBRLM program did not have the
resources to commit.
Second, there were differences in understanding of what “adherence to combined
herding” actually means, so reports from the field have given an inconsistent
picture of what has happened where.
Third, a stop was put to the initiative to objectively measure changes in rangeland
and compare sites where PGCH had taken place with sites where it had not.
In the absence of evidence about rangeland improvement effects of PGCH as it has been
possible to implement in practice in the NCAs, it has been suggested that future projects
should focus not only on rangeland improvements. It is suggested that the potential
synergies with crop improvement should be emphasized more. The advantage would be
that some short term benefits could be demonstrated, which would encourage farmers to
stick with the new practice of PGCH.
Nevertheless, it would still be important to establish both the way in which PGCH is
implemented in the NCA and the rangeland benefits realized over what time period. Any
extended project should therefore include a strong field monitoring component, both of
the actual practice of PGCH and of rangeland sites.
End-Of-Project Status CBRLM Sub-Activity Final Report
Page | 105
INCREASING OFF-TAKE AND ADJUSTING CATTLE NUMBERS
It is generally realized that increasing cattle productivity without increasing off-take is not a
viable option in the long term, even though it may result in increases in wealth in the short
term. An assumption of this project was that increased production would encourage
farmers to increase their off-take. It was also assumed that as part of the new grazing
management practices farmers would adjust their cattle numbers according to the available
fodder.
There were a number of incentives in this project to encourage off-take. None of them had
any significant effect. First was the drought in Kunene and the west of Omusati. Despite
advice from project staff to reduce numbers, farmers preferred to relocate their animals
and did not increase sales.
Second, the livestock management programme involved herd restructuring. Farmers and
project staff identified and recorded cattle in the GA herd that were deemed to be
unproductive. Farmers were encouraged to sell these animals. Anecdotal evidence
indicates that some of these were sold and replaced by younger animals or calves. There is
also evidence that some unproductive cattle were sold as part of bull repayment.
A baseline survey in the project regions undertaken by IPA in 2011 estimated the cattle off-
take through sales at 3.7%. An estimate of sales off-take in the GAs in 2013 yielded a rate of
4.3% and was presented in the CBRLM Marketing Report. This was an “animal equivalent”
sales rate, which included sales of goats to pay for bulls. These goats were redistributed
among other GAs. The estimated cattle sales off-take rate not related to bull repayment
was 2.2%. However these data do not provide evidence that the project has had any
significant impact on cattle sales in the GAs. This is despite the efforts that have been put
into increasing the number of auctions held in the regions and reports of increased calving
due to improved cow:bull ratio and combined herding.
A major component of the PGCH approach is that cattle will be sold when projected grass
availability is too low for the current numbers and, when grass becomes more available,
cattle will be purchased again to bring up the numbers required to apply the desired
grazing pressure. A major challenge is how to persuade farmers to sell and buy as the
grazing need dictates. First is the problem of overcoming the general reluctance to sell.
Second, in a GA herd with many owners, where some have over 100 cattle and others only
3 or 4, joint decisions on who should sell and how many become very complex.
ABSENTEEISM
The high degree of livestock farming in the absence of the actual livestock owners in some
areas constituted a major challenge for CBRLM in various aspects. Obviously, livestock
farmers are difficult to reach and involve if they are scattered through the entire country
instead of residing inside or close to their GA. This affected mobilisation, increased logistical
requirements and made meeting on a regular basis very difficult. With regards to
governance, it was often not possible for the GA committees to make binding decisions
where there were absentee owners. Implementation of the GA fund with contributions per-
animal is also challenging if the actual owner who is to pay the contribution is not present.
End-Of-Project Status CBRLM Sub-Activity Final Report
Page | 106
HERDER TURNOVER
The project has attempted to improve the status of herders in the community. Herder
training has been provided. GA committees have been encouraged to pay herders higher
wages and to provide clothing and other equipment. Despite this high herder turnover
remains a problem for many GAs, which means that the skills training for effective
combined herding needs to be repeatedly delivered.
Changing long held views about the status of herders will take time. However, it is
important to recognize the importance of making this change for effective combined
herding to take place. In Kavango herders tend to be family members and do not receive
wages so other means of status improvement are needed here.
DIFFERING APPROACHES IN THE LIVESTOCK AND RANGELAND COMPONENTS
The livestock improvement component of the project was supposed to be complementary
to the core component of rangeland management. While there was an obvious link through
the GA herd, the two components undertook training and implementation activities
separately.
A reason for the separation of the rangeland and livestock components were the different
conceptual perceptions by the two sets of experts responsible for each component. The
experts with the livestock component saw their role as imparting technical and practical
knowledge and skills to FFs and farmers. The rangeland experts on the other hand saw their
role as working with communities to figure out ways in which a new management system
could best be implemented given the circumstances faced by those communities.
As a result, farmers received a set of rangeland messages and a set of livestock
management messages which were loosely connected through such mechanisms as
identification of unproductive animals for sale. A more integrated message would have
been preferable, but its delivery would probably have required de-emphasis of one or other
of the components.
Further controversy concerned the bull scheme. While its proponents underlined the need
for this sub-component to increase genetic diversity, improve the herd structure and – last
but not least - achieve the contractual project targets, other CBRLM experts argue that it
would have been cheaper to stop castrating bulls in the NCAs, purchase local bulls or swap
bulls from within an area. However, the latter approach would have taken longer and
supposedly not yielded the desired outcomes within the project period.
Conclusions CBRLM Sub-Activity Final Report
Page | 107
4 CONCLUSIONS
CBRLM was designed and implemented as a pilot project, meaning that this project was to
test the viability and efficacy of the sound rangeland management approach and the
components that were built around it. The key questions that were to be answered by this
pilot project were formulated in section 1.2.1.5 of this report and will eventually be clarified
by the rigorous external impact evaluation. While the implementer is not in a position to
judge and quantify project outcomes and impact and therefore far from claiming to be able
to give definite answers to these questions, some of the experiences made during project
implementation can still give some indication on the direction these answers might take.
The question whether the innovative CBRLM rangeland approach works in practice in the
Northern Communal Areas of Namibia cannot be responded with confidence by the
implementer, both due to the lack of data and because implementation was negatively
affected by two consecutive drought years. In isolated cases like GA Wangolo, promising
observations of rangeland improvement were made after a single year of practicing CBRLM
principles before the drought struck. However, experience also shows that it is extremely
challenging to have communities practicing the CBRLM concept rigorously over an
extended period of time. Therefore, it seems that the duration of this project is by far not
enough to introduce CBRLM rangeland principles and have communities reliably apply
them over a period of time that is sufficient to yield tangible improvement of rangeland on
a large scale. Unfortunately, the external evaluation component on rangeland that would
have aimed at answering this question was cancelled by the donor agency MCC.
The second question was whether the concept of participation has been delivered
differently by CBRLM than by previous participatory interventions. Looking back, it must be
admitted that the general concept of participation and most of the avenues chosen to
implement it were neither unique nor very innovative. At a more detailed level, however,
the various empowerment tools applied took into account lessons learned from previous
interventions. In particular, financial empowerment through the GA fund has not taken
place before at the scale applied by CBRLM. Furthermore, while previous projects also
worked with communities in a participatory way, e.g. through committees, the facilitation
by CBRLM and support to the corresponding structures was more intensive in terms of
training and material input. During an internal evaluation exercise, several GA communities
that also had been participating in earlier projects explicitly expressed their appreciation for
the continuous facilitation provided through CBRLM as compared to once-off training
sessions that had been provided during NOLIDEP.
The last question on whether the context in which conventional intervention strategies
have been delivered resulted in better or different outcomes cannot be answered with
confidence, since the outcomes have not been objectively determined yet. With regards to
the operational context itself, the experience of some CBRLM experts that were already
working in the sector more than a decade before suggests that the educational level of
rural communities has significantly improved compared to when projects like NOLIDEP and
SARDEP were implemented. In particular, the availability and buy-in of knowledgeable
Conclusions CBRLM Sub-Activity Final Report
Page | 108
individuals like teachers in many communities had a positive impact on the corresponding
GA committees’ capacity.
4.1 LESSONS LEARNED
This section will summarise the major lessons learned with regards to the operational
framework of CBRLM from the implementer’s point of view.
4.1.1 IMPLEMENTER
The internal M&E requirements of this large project were initially underestimated.
The M&E adviser was only recruited part time with a full time junior data manager
being his assistance. The assumption that component experts would also monitor
implementation progress more closely did not really work out. The project had
developed a sophisticated planning and tracking tool, however this was mainly
based on the reporting from the field teams which may not have been fully
accurate. Secondly rangeland monitoring was contracted by MCA-N externally,
however MCC decided to discontinue this activity. Only from August 2013 another
full time M&E expert was recruited which improved the internal monitoring
drastically.
It is the case that interest by communities in CBRLM has become more widespread
during the course of the project. Community mobilization into the project was
faster in the second phase RIAs. However, there is reason to think that this is driven
as much by the material incentives of the project as by the intrinsic enthusiasm of
communities to adopt CBRLM practices.
Implementation was expert-led. The FFs in most cases rather worked like liaison
staff than being able to implement the components on their own after some
training as planned initially. Only now a number of FFs reached such a level. FFs
need to be trained over long period of time (e.g. Zimbabwean system of a three-
year practical and academic training). University graduates seemed to fulfil the
required tasks better than non-graduates because of better technical
understanding and analytic problem-solving skills.
The project was implemented through components. While this resulted in
successful delivery, it was found in an internal mid-term evaluation that there has
been a lack of coordination or alignment between different components (mainly
between rangeland and livestock). The rangeland expert was tasked to
subsequently coordinate GA-level activities better. However, this did not
materialize with only one year of implementation left.
Throughout the project implementation phase, the implementation scope was
expanded significantly and additional implementation (sub-) components were
added to the original project ToR (see Figure 3 on page 17). While all of these
additional components were justified in the views of the CBRLM experts to add
value to the respective components and accordingly approved by MCA-N, they
might also have to some degree detracted from achievement of the original project
objectives.
Conclusions CBRLM Sub-Activity Final Report
Page | 109
For example, it seems that “empowerment of communities to ensure compliance
by all users to grazing rules within the boundaries of their GAs” has not been
addressed satisfactorily. Achievement of the latter was, however, not only in the
hands of the CBRLM implementer, but also strongly dependent on outcomes of the
CLS Sub-Activity, which was running in parallel.
Furthermore, some of the additional components involved significant additional
(material and financial) incentives for GA communities, which might in some cases
compromise sustainability of community-led implementation of CBRLM principles
once provision of these incentives is discontinued.
4.1.2 EVALUATOR
The RCT evaluation approach has determined the selection of RIAs and the
implementer’s approach to the geographic extension of the project. This has
resulted in working in very remote sites and a lot of time, effort and costs had to be
used just for transport purposes.
Experience tells that for a project like CBRLM, where massive efforts are put into
both implementation and evaluation, it is recommendable to have at least one
permanent staff from the side of the evaluator working full time on the project
from the beginning.
4.1.3 DONOR
For a good implementation proper communication between stakeholders is
essential. The formal lines of communication did not allow a direct communication
between the implementer and MAWF management or the external evaluator and
were sometimes perceived as having been too intricate. These barriers were only
reduced towards the end of the project.
The development of a logical framework as a planning tool was not required by
MCC. However, it is believed such an instrument would have been helpful for all
stakeholders to have a reference document that clearly outlines and communicates
the proposed intervention logic and documents the assumptions behind this logic.
The lack of a sound mechanism to monitor quality of and adherence to PGCH was a
major shortcoming of the project with regards to determining the impact of the
approach. This could have been avoided by a clear assignment of responsibilities by
the donor with regards to monitoring between implementer and evaluator.
During project implementation it turned out that evaluator and implementer had
very different interpretations of what a pilot project is supposed to do. While the
evaluator argued that a pilot project needs to stick exactly to an initially defined
design in order to rigorously test the impact of exactly that design, the implementer
argued that in a pilot project flexibility is key since it is impossible to know
determine all eventualities in advance and that the project is supposed to develop
and test ways to respond to these eventualities. A clear initial definition and
position by the donor would have helped to avoid controversy around this issue.
Conclusions CBRLM Sub-Activity Final Report
Page | 110
4.2 RECOMMENDATIONS
1. Continuation of support to GA communities is required
o To achieve the behavioural changes required for communities to adopt PGCH
in a sustainable manner requires intensive facilitation and mentoring over a
prolonged period of time. The facilitation input of this project to date is not
sufficient to ensure continued application of the CBRLM approach. Follow up
support is needed to ensure this.
o Continued mentoring support should be given to those communities in the
project RIAs who have shown real commitment to implementing PGCH. These
communities would act as important cases for testing the effectiveness of any
new land rights legislation enabling the enforcement of grazing rules within a
GA.
2. Legislation to enable the enforcement of grazing rules is required
o The empowerment of communities to manage their rangeland resources in a
way that improves its productivity has not been accompanied by
empowerment to protect those gains by enforcing grazing rules within the
boundary of their GAs.
o Where communities have adopted PGCH in a consistent and thorough manner,
there is as yet little evidence to suggest that this has resulted in an
improvement of the rangeland. A possible reasons for this is that any potential
improvement has been mitigated by grass poaching, both from within the GA
and from intruders from outside the GA.
o The most critical factor is to create the conditions in the communal areas
where grazing plans can be developed and enforced by the local stakeholders
present. The establishment of group rights and local by laws that can be
enforced and fined imposed is crucial to the success of the rangeland sector.
Synergies with Community Forests and Communal Conservancies need to be
developed so that these resources managed at various scales can be done
effectively.
o The project should not be extended into the control RIAs (or elsewhere) until
such time as land rights legislation is in place that enables communities to
protect range improvement gains made within the boundary of their GA. The
effectiveness of this legislation should be tested with communities currently
undertaking CBRLM before an extension of the approach is promoted in the
NCAs.
3. Future water infrastructure provision
o In order to implement CBRLM with combined herding and planned grazing in
the NCAs, it is necessary to invest substantially in the upgrading of water
supply. This includes the upgrading of existing water points and the
establishment of new water points.
Conclusions CBRLM Sub-Activity Final Report
Page | 111
o Some communities might commit to practice sound rangeland management in
order to receive water infrastructure, but might not put this commitment into
practice once the infrastructure is in place. In the absence of sound rangeland
management, however, the provision of water infrastructure can be harmful
for the environment. The following two suggestions might help to solve this
dilemma in future:
Future water infrastructure provision could make the distinction
between dedicated livestock-only water points (i.e. water points that
must be used exclusively for serving livestock and not humans) and
water points that are for mixed or human-only consumption. In the
absence of sound rangeland management, the livestock-only water
points could be (temporarily) closed by MAWF since no humans will
directly suffer.
Legislation could make sound rangeland management compulsory and
bring forward corresponding enforcement mechanisms
4. Systematic rangeland monitoring required
o Data from the rangeland monitoring sites that have been set up should
continue to be collected on a regular basis to assess changes in rangeland
productivity over time.
o A major achievement of the project was to install new water points at 39 sites.
The justification for these new water points was that they were part of an
improved grazing management system. It is well recognised that without
appropriate grazing management, rangeland degradation will take place
around newly established water points. The use of these new water points
needs to be monitored to ensure that a legacy of the CBRLM project is not
intensified rangeland degradation.
5. Fire mitigation strategies need to be developed and applied
Fire breaks that were established by over-trampling and overgrazing routes to and
from grazing areas seemed to be effective in stopping fires. This practise needs to
be further entrenched as does the development of fire breaks at the regional,
constituency and national level.
4.3 THE WAY FORWARD
Although the independent impact evaluation of the CBRLM project is yet to be undertaken,
the major lessons that have come out of four years of intensive implementation of CBRLM
in the NCAs should be taken into account for further initiatives. If these lessons are
seriously taken on board in future CBRLM work, then the investment in this pilot project
will have been of value.
It is being envisaged that if an EU grant fund application is successful the CBRLM work is
taken forward by two Namibian NGOs who will work with the six regional livestock
marketing cooperatives as well as the private sector. The work will be led by Meatco
Foundation and Cooperative Agriculture Namibia with on-the-ground implementation
Conclusions CBRLM Sub-Activity Final Report
Page | 112
through the six regional livestock marketing cooperatives and Meatco. Most of these actors
have either been directly involved with or closely followed the CBRLM project.
Implementation would be built on and pursued through structures established by CBRLM.
To the extent that this proposal envisages the work being led by Namibian institutions, it
may be assumed that they will be committed over the long term in an institutionalised
programme-based rather than project-based approach.
Like the CBRLM project, the proposed continuation would address the full chain of livestock
production. Taking into account the experience of communal farmers refusing to destock
even when their stock was threatened by drought, the proposed initiative will lay a stronger
focus on developing local marketing solutions by bringing together regional cooperatives
and commercial actors like Meatco and creating synergies by having them complement
each other.
The proposed continuation is thus based on the development of strong partnerships
between actors with different perspectives, including regional councils, governors,
traditional authorities and line ministries. Establishing a common adequate context-specific
message for and with farmers has also been shown by the CBRLM project not to be an easy
matter, even when there is a single implementing agency. Given the difficulty of
implementing support activities through multiple partners and the fact that some of these
partners are newly formed institutions, very careful consideration will need to be given to
the support capacity that will be available to train, facilitate and mentor GA communities.
The proposed initiative would therefore be organised less in different components led by
individual experts, but rather include a small number of technical staff who can all deal with
the full chain of livestock production.
Under the CBRLM project, support to some of the 58 finally “active” GAs was very thin. It is
acknowledged that there needed to be better planning of activities with GA communities
and that they need more consistent support at the GA level to follow through these plans. If
the proposed partnership is to take this lesson on board, the number of GA communities
they will be able to support in a meaningful way is likely to be fewer, maybe no more than
3-5 per region/cooperative.
It is clear also that ongoing work should focus on existing GAs and not expand into new
areas, as envisaged under the original terms of reference of the CBRLM project. There are
two major reasons for this.
First, the water infrastructure cost and procurement implications of establishing
new GAs needs to be factored into any expansion plan and this will take time to
secure.
The second and more important reason for not working with new GA communities
is that without the ability to enforce grazing rules within GA boundaries, the
potential positive impact of PGCH is often negated by grass-poaching and initially
motivated communities might be demoralised.
This suggests that the new initiative must devote time and effort to furthering the
legalisation of group land use rights to communal farmers. In turn, this will require the
development of an improved partnership with MAWF and MLR at all levels. The rationale
Conclusions CBRLM Sub-Activity Final Report
Page | 113
for continuing to support GA communities to implement CBRLM principles in the absence
of group grazing right legislation is twofold. First, to enable the communities themselves to
apply bottom-up pressure for such change through local traditional leaders. Second, to
have in place functioning GA governance structures with appropriate knowledge and skills
to properly implement PGCH in the context of new legislation and corresponding
enforcement mechanisms. These GAs would then provide a test bed for the efficacy of the
new legislation.
In the meantime, there are other elements of the CBRLM approach that the experience of
this project suggests need further attention for the approach to work effectively in the
NCAs. These include herder training and turnover. Despite intensive efforts from the
CBRLM project to promote the status of herders, it is still a long way to go to see herders
really being acknowledged for the importance and value of their work within a CBRLM
context, given that they watch over both the resource base and the livestock. Suggestions
have been made about the possibility of linking up with the commercial sector to establish
a national level herder school.
In line with the National Rangeland Management Policy and Strategy, the proposed
continuation will further focus on rangeland as the fundamental element in the chain of
livestock production and foster understanding of the need to treat the rangeland as such.
An important element of the approach that needs further consideration is the practical
monitoring of the implementation of PGCH. Despite having field facilitators working directly
with GA communities, the CBRLM project had scanty knowledge of whether and how GA
herds were actually being herded on a daily basis. Going forward, there needs to be a much
clearer definition of what constitutes acceptable herding practice and clearer identification
of roles and responsibilities for monitoring this. This is vitally important because without a
good knowledge of the type of grazing pressure the rangeland has been subjected to, it is
impossible to ascribe any change or improvement to a grazing regime.
What is also clear is that this approach needs rigorous and continued implementation of
PGCH by the communities over a relatively long period of time before they can see tangible
rangeland benefits as a result from their own action. In order to keep community morale
up, this calls for the development and facilitation of additional compatible and
complementary community-based activities that promise to yield benefits in shorter time.
Such activities might include approaches related to conservation agriculture and cropping
practices that take advantages of synergies between livestock and cropping, like the use of
mobile kraals to fertilise and prepare crop fields.
The anticipated EU grant fund contract (EDF 10 funding) is planned to be for 2.5 years and
finalised by early 2017. Funds available will be about 20 million NAD including co-financing
contributions. An annual budget of 8 million NAD is not small but constitutes only 40% of
the funds available for CBRLM. In a way this project is supposed to bridge activities to a new
EDF 11 financed programme to develop value-added chains in the livestock sector in the
NCAs. The EU Delegation in Namibia, together with the National Planning Commission, is
currently preparing this new livestock programme which should be effective by 2016.
Conclusions CBRLM Sub-Activity Final Report
Page | 114
MAWF involvement in this new program will depend on the future findings of the external
impact evaluation of CBRLM.
At the end of the project, MAWF management has been receiving the CBRLM pilot project
very positively as made clear by public announcements of the PS and the deputy PS
Agriculture. Both have made commitments that the Ministry will continue best practices of
CBRLM as in line with existing policies and legislation.
MAWF is currently planning for structural changes and staff increases in the Ministry. The
programming of the EU EDF11 funds would be a good chance to align restructuring of the
Ministry with the requirements for upcoming livestock development programmes in the
NCAs.
References CBRLM Sub-Activity Final Report
Page | 115
REFERENCES
Directorate of Veterinary Services. (2014). NamLITS NCA Phase 3 Report. Windhoek: DVS.
Eicher, C. (1985). Agricultural Research for African Development: Problems and Priorities for
1985 - 2000. Bellagio, Italy: Unpublished paper prepared for a World Bank conference on
research priorities for Subsaharan Africa.
Fortmann.et.al. (2001). At the threshold between governance and management:
community based natural resource management in Southern Africa. Public Administration
and Development , 21, 171-185.
Guyo.et.al. (2003). Linkages between Community, Environmental, and Conflict
Management: Experiences from Northern Kenya. Ithaka, NY: Paper prepared for the
conference “Reconciling Rural Poverty Reduction with Renewable Resource Conservation:
Identifying Relationships and Remedies". Cornell University.
Holmes-Watts, T., & Watts, S. (2008). Legal frameworks for and the practice of participatory
natural resources management in South Africa. Forest Policy and Economics , 10, 435–443.
IFAD. (2002). NOLIDEP Interim evaluation (2002) . Retrieved from
http://www.ifad.org/evaluation/public_html/eksyst/doc/prj/region/pf/namibia/na_362.ht
m
Innovations for Poverty Action. (2011). CBRLM Household Baseline Survey.
Janke, H. (1982). Livestock Producing Systems and Livestock Development in Tropical Africa.
Kiel, Germany: KielerWissenschaftsverlag.
Land, Environment and Development (LEAD) Project. (2005). Our land we farm. An analysis
of the Namibian commercial agricultural land reform process. Windhoek: Legal Assistance
Centre.
Matambo, S., & Seely, M. World Resources Report Case Study. Namibia: Combating
Desertification with Tools for Local-Level Decision-Making. Washington DC: World
Resources Report.
MAWF. (2012). The Minister's Speeches. Retrieved April 03, 2014, from
http://www.mawf.gov.na/speeches.html
Mendelsohn, J., Jarvis, A., Roberts, C., & Robertson, T. (2002). Atlas of Namibia. A Portrait
of the Land and its People. Cape Town: David Philip Publishers; New Africa Books (Pty) Ltd.
Millenium Challenge Corporation. (2008). Millennium Challenge Account Namibia Compact:
Volume 3: Thematic Analysis Report – Livestock. Washington: Millenium Challenge
Corporation.
Namibia Statistics Agency. (2014). Downloadable files from NSA. Retrieved April 02, 2014,
from http://www.nsa.org.na/dataset/
References CBRLM Sub-Activity Final Report
Page | 116
National Planning Commission. (2013). FOURTH NATIONAL DEVELOPMENT PLAN (NDP4)
2012/13 – 2016/2017. Retrieved May 16, 2014, from http://www.npc.gov.na/?page_id=202
Nouala, S. (2012). Rational Use of Rangelands and Fodder Crop Development in Africa.
Nairobi: African Union, InterAfricfan Bureau for Animal Resources.
NSA. (2012). Namibia 2011 Population & Housing Census Main Report. Windhoek: Namibia
Statistics Agency.
Roe, E. M. (1989). Six Myths About Livestock Rangeland Development South of the Sahara.
Rangelands , 11 (5).
Thomson, G. R., & Venter, R. (2012). Risk analysis on animal disease hazards associated
with import of animal commodities (including live animals) and products into Namibia and
consequences thereof. Windhoek: Meat Board.
World Bank. (1987). Livestock Strategy Paper. Washington D.C.: Economics and Policy
Division, Agriculture and Rural Development Department.
World Bank. (2014). Namibia Overview. Retrieved April 2, 2014, from
http://www.worldbank.org/en/country/namibia/overview
Annex CBRLM Sub-Activity Final Report
Page | 117
ANNEX
The following sections in the annex will provide GA-specific information with regards to
selected indicators for every CBRLM component.
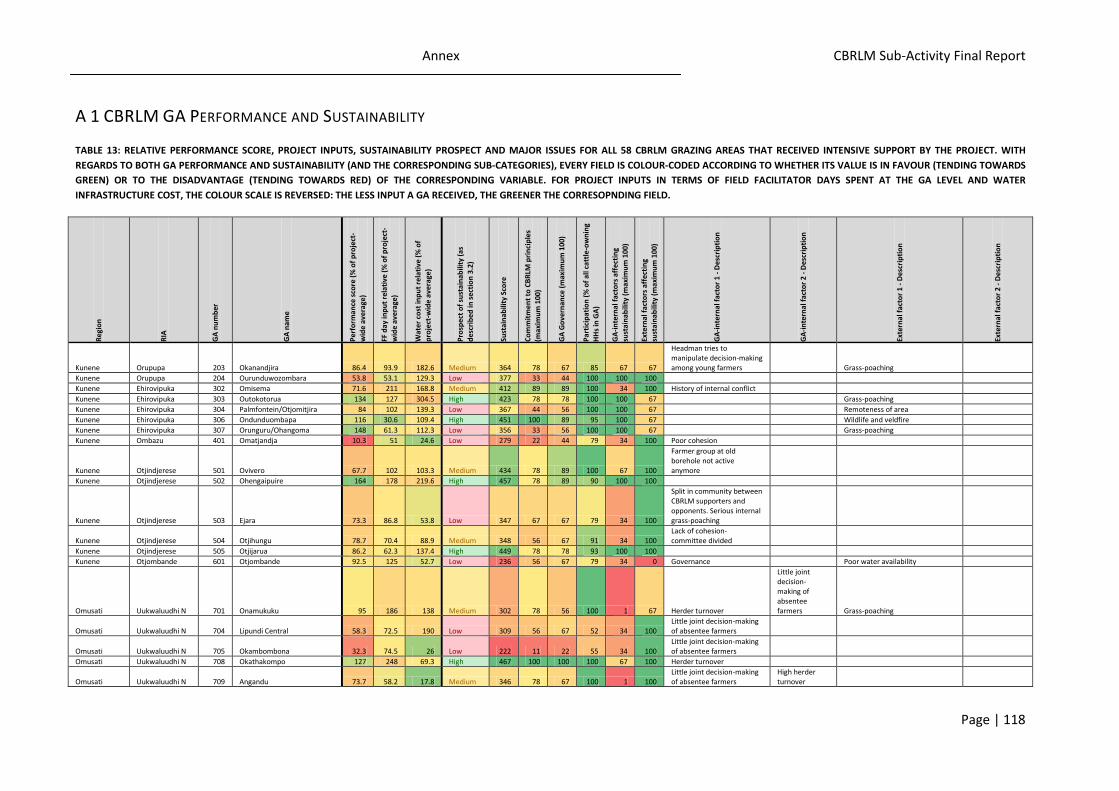
Annex CBRLM Sub-Activity Final Report
Page | 118
A 1 CBRLM GA PERFORMANCE AND SUSTAINABILITY
TABLE 13: RELATIVE PERFORMANCE SCORE, PROJECT INPUTS, SUSTAINABILITY PROSPECT AND MAJOR ISSUES FOR ALL 58 CBRLM GRAZING AREAS THAT RECEIVED INTENSIVE SUPPORT BY THE PROJECT. WITH
REGARDS TO BOTH GA PERFORMANCE AND SUSTAINABILITY (AND THE CORRESPONDING SUB-CATEGORIES), EVERY FIELD IS COLOUR-CODED ACCORDING TO WHETHER ITS VALUE IS IN FAVOUR (TENDING TOWARDS
GREEN) OR TO THE DISADVANTAGE (TENDING TOWARDS RED) OF THE CORRESPONDING VARIABLE. FOR PROJECT INPUTS IN TERMS OF FIELD FACILITATOR DAYS SPENT AT THE GA LEVEL AND WATER
INFRASTRUCTURE COST, THE COLOUR SCALE IS REVERSED: THE LESS INPUT A GA RECEIVED, THE GREENER THE CORRESOPNDING FIELD.
Reg
ion
RIA
GA
nu
mb
er
GA
nam
e
Per
form
ance
sco
re (
% o
f p
roje
ct-
wid
e av
erag
e)
FF d
ay in
pu
t re
lati
ve (
% o
f p
roje
ct-
wid
e av
erag
e)
Wat
er c
ost
inp
ut
rela
tive
(%
of
pro
ject
-wid
e av
erag
e)
Pro
spec
t o
f su
stai
nab
ility
(as
des
crib
ed in
se
ctio
n 3
.2)
Sust
ain
abili
ty S
core
Co
mm
itm
ent
to C
BR
LM p
rin
cip
les
(max
imu
m 1
00)
GA
Go
vern
ance
(m
axim
um
100
)
Par
tici
pat
ion
(%
of
all c
att
le-o
wn
ing
HH
s in
GA
)
GA
-in
tern
al f
acto
rs a
ffec
tin
g
sust
ain
abili
ty (
max
imu
m 1
00)
Exte
rnal
fac
tors
aff
ecti
ng
sust
ain
abili
ty (
max
imu
m 1
00)
GA
-in
tern
al f
acto
r 1
- D
escr
ipti
on
GA
-in
tern
al f
acto
r 2
- D
escr
ipti
on
Exte
rnal
fac
tor
1 -
Des
crip
tio
n
Exte
rnal
fac
tor
2 -
Des
crip
tio
n
Kunene Orupupa 203 Okanandjira 86.4 93.9 182.6 Medium 364 78 67 85 67 67
Headman tries to manipulate decision-making among young farmers Grass-poaching
Kunene Orupupa 204 Ourunduwozombara 53.8 53.1 129.3 Low 377 33 44 100 100 100
Kunene Ehirovipuka 302 Omisema 71.6 211 168.8 Medium 412 89 89 100 34 100 History of internal conflict
Kunene Ehirovipuka 303 Outokotorua 134 127 304.5 High 423 78 78 100 100 67 Grass-poaching
Kunene Ehirovipuka 304 Palmfontein/Otjomitjira 84 102 139.3 Low 367 44 56 100 100 67 Remoteness of area
Kunene Ehirovipuka 306 Ondunduombapa 116 30.6 109.4 High 451 100 89 95 100 67 Wildlife and veldfire
Kunene Ehirovipuka 307 Orunguru/Ohangoma 148 61.3 112.3 Low 356 33 56 100 100 67 Grass-poaching
Kunene Ombazu 401 Omatjandja 10.3 51 24.6 Low 279 22 44 79 34 100 Poor cohesion
Kunene Otjindjerese 501 Ovivero 67.7 102 103.3 Medium 434 78 89 100 67 100
Farmer group at old borehole not active anymore
Kunene Otjindjerese 502 Ohengaipuire 164 178 219.6 High 457 78 89 90 100 100
Kunene Otjindjerese 503 Ejara 73.3 86.8 53.8 Low 347 67 67 79 34 100
Split in community between CBRLM supporters and opponents. Serious internal grass-poaching
Kunene Otjindjerese 504 Otjihungu 78.7 70.4 88.9 Medium 348 56 67 91 34 100 Lack of cohesion- committee divided
Kunene Otjindjerese 505 Otjijarua 86.2 62.3 137.4 High 449 78 78 93 100 100
Kunene Otjombande 601 Otjombande 92.5 125 52.7 Low 236 56 67 79 34 0 Governance Poor water availability
Omusati Uukwaluudhi N 701 Onamukuku 95 186 138 Medium 302 78 56 100 1 67 Herder turnover
Little joint decision-making of absentee farmers Grass-poaching
Omusati Uukwaluudhi N 704 Lipundi Central 58.3 72.5 190 Low 309 56 67 52 34 100 Little joint decision-making of absentee farmers
Omusati Uukwaluudhi N 705 Okambombona 32.3 74.5 26 Low 222 11 22 55 34 100 Little joint decision-making of absentee farmers
Omusati Uukwaluudhi N 708 Okathakompo 127 248 69.3 High 467 100 100 100 67 100 Herder turnover
Omusati Uukwaluudhi N 709 Angandu 73.7 58.2 17.8 Medium 346 78 67 100 1 100 Little joint decision-making of absentee farmers
High herder turnover
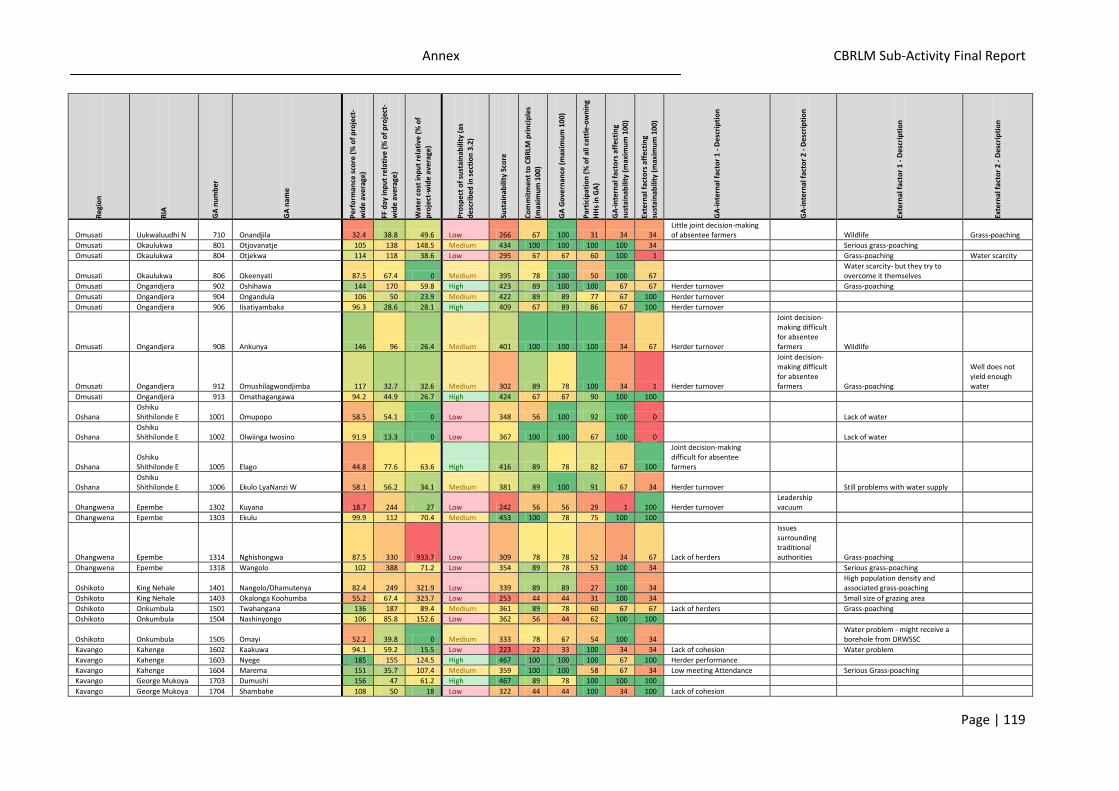
Annex CBRLM Sub-Activity Final Report
Page | 119
Reg
ion
RIA
GA
nu
mb
er
GA
nam
e
Per
form
ance
sco
re (
% o
f p
roje
ct-
wid
e av
erag
e)
FF d
ay in
pu
t re
lati
ve (
% o
f p
roje
ct-
wid
e av
erag
e)
Wat
er c
ost
inp
ut
rela
tive
(%
of
pro
ject
-wid
e av
erag
e)
Pro
spec
t o
f su
stai
nab
ility
(as
des
crib
ed in
se
ctio
n 3
.2)
Sust
ain
abili
ty S
core
Co
mm
itm
ent
to C
BR
LM p
rin
cip
les
(max
imu
m 1
00)
GA
Go
vern
ance
(m
axim
um
100
)
Par
tici
pat
ion
(%
of
all c
att
le-o
wn
ing
HH
s in
GA
)
GA
-in
tern
al f
acto
rs a
ffec
tin
g
sust
ain
abili
ty (
max
imu
m 1
00)
Exte
rnal
fac
tors
aff
ecti
ng
sust
ain
abili
ty (
max
imu
m 1
00)
GA
-in
tern
al f
acto
r 1
- D
escr
ipti
on
GA
-in
tern
al f
acto
r 2
- D
escr
ipti
on
Exte
rnal
fac
tor
1 -
Des
crip
tio
n
Exte
rnal
fac
tor
2 -
Des
crip
tio
n
Omusati Uukwaluudhi N 710 Onandjila 32.4 38.8 49.6 Low 266 67 100 31 34 34 Little joint decision-making of absentee farmers Wildlife Grass-poaching
Omusati Okaulukwa 801 Otjovanatje 105 138 148.5 Medium 434 100 100 100 100 34 Serious grass-poaching
Omusati Okaulukwa 804 Otjekwa 114 118 38.6 Low 295 67 67 60 100 1 Grass-poaching Water scarcity
Omusati Okaulukwa 806 Okeenyati 87.5 67.4 0 Medium 395 78 100 50 100 67 Water scarcity- but they try to overcome it themselves
Omusati Ongandjera 902 Oshihawa 144 170 59.8 High 423 89 100 100 67 67 Herder turnover Grass-poaching
Omusati Ongandjera 904 Ongandula 106 50 23.9 Medium 422 89 89 77 67 100 Herder turnover
Omusati Ongandjera 906 Iisatiyambaka 96.3 28.6 28.1 High 409 67 89 86 67 100 Herder turnover
Omusati Ongandjera 908 Ankunya 146 96 26.4 Medium 401 100 100 100 34 67 Herder turnover
Joint decision-making difficult for absentee farmers Wildlife
Omusati Ongandjera 912 Omushilagwondjimba 117 32.7 32.6 Medium 302 89 78 100 34 1 Herder turnover
Joint decision-making difficult for absentee farmers Grass-poaching
Well does not yield enough water
Omusati Ongandjera 913 Omathagangawa 94.2 44.9 26.7 High 424 67 67 90 100 100
Oshana Oshiku Shithilonde E 1001 Omupopo 58.5 54.1 0 Low 348 56 100 92 100 0 Lack of water
Oshana Oshiku Shithilonde E 1002 Olwiinga Iwosino 91.9 13.3 0 Low 367 100 100 67 100 0 Lack of water
Oshana Oshiku Shithilonde E 1005 Elago 44.8 77.6 63.6 High 416 89 78 82 67 100
Joint decision-making difficult for absentee farmers
Oshana Oshiku Shithilonde E 1006 Ekulo LyaNanzi W 58.1 56.2 34.1 Medium 381 89 100 91 67 34 Herder turnover Still problems with water supply
Ohangwena Epembe 1302 Kuyana 18.7 244 27 Low 242 56 56 29 1 100 Herder turnover Leadership vacuum
Ohangwena Epembe 1303 Ekulu 99.9 112 70.4 Medium 453 100 78 75 100 100
Ohangwena Epembe 1314 Nghishongwa 87.5 330 933.7 Low 309 78 78 52 34 67 Lack of herders
Issues surrounding traditional authorities Grass-poaching
Ohangwena Epembe 1318 Wangolo 102 388 71.2 Low 354 89 78 53 100 34 Serious grass-poaching
Oshikoto King Nehale 1401 Nangolo/Dhamutenya 82.4 249 321.9 Low 339 89 89 27 100 34 High population density and associated grass-poaching
Oshikoto King Nehale 1403 Okalonga Koohumba 55.2 67.4 323.7 Low 253 44 44 31 100 34 Small size of grazing area
Oshikoto Onkumbula 1501 Twahangana 136 187 89.4 Medium 361 89 78 60 67 67 Lack of herders Grass-poaching
Oshikoto Onkumbula 1504 Nashinyongo 106 85.8 152.6 Low 362 56 44 62 100 100
Oshikoto Onkumbula 1505 Omayi 52.2 39.8 0 Medium 333 78 67 54 100 34 Water problem - might receive a borehole from DRWSSC
Kavango Kahenge 1602 Kaakuwa 94.1 59.2 15.5 Low 223 22 33 100 34 34 Lack of cohesion Water problem
Kavango Kahenge 1603 Nyege 185 155 124.5 High 467 100 100 100 67 100 Herder performance
Kavango Kahenge 1604 Marema 151 35.7 107.4 Medium 359 100 100 58 67 34 Low meeting Attendance Serious Grass-poaching
Kavango George Mukoya 1703 Dumushi 156 47 61.2 High 467 89 78 100 100 100
Kavango George Mukoya 1704 Shambahe 108 50 18 Low 322 44 44 100 34 100 Lack of cohesion
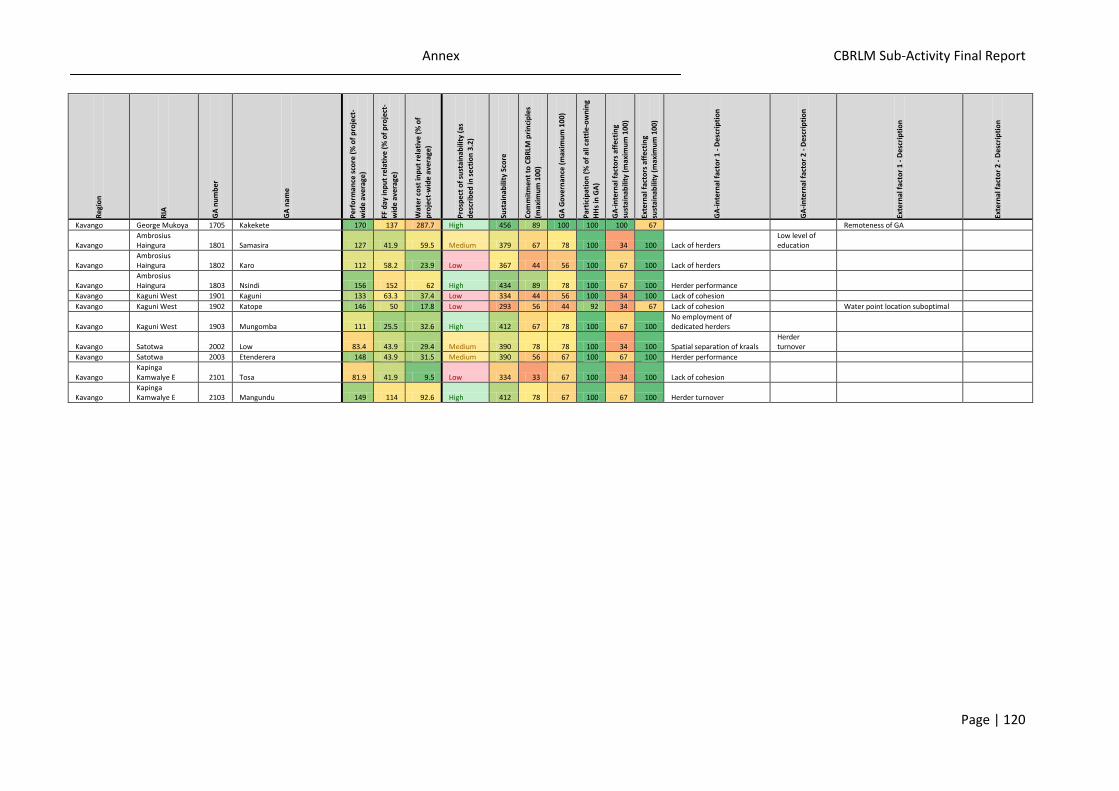
Annex CBRLM Sub-Activity Final Report
Page | 120
Reg
ion
RIA
GA
nu
mb
er
GA
nam
e
Per
form
ance
sco
re (
% o
f p
roje
ct-
wid
e av
erag
e)
FF d
ay in
pu
t re
lati
ve (
% o
f p
roje
ct-
wid
e av
erag
e)
Wat
er c
ost
inp
ut
rela
tive
(%
of
pro
ject
-wid
e av
erag
e)
Pro
spec
t o
f su
stai
nab
ility
(as
des
crib
ed in
se
ctio
n 3
.2)
Sust
ain
abili
ty S
core
Co
mm
itm
ent
to C
BR
LM p
rin
cip
les
(max
imu
m 1
00)
GA
Go
vern
ance
(m
axim
um
100
)
Par
tici
pat
ion
(%
of
all c
att
le-o
wn
ing
HH
s in
GA
)
GA
-in
tern
al f
acto
rs a
ffec
tin
g
sust
ain
abili
ty (
max
imu
m 1
00)
Exte
rnal
fac
tors
aff
ecti
ng
sust
ain
abili
ty (
max
imu
m 1
00)
GA
-in
tern
al f
acto
r 1
- D
escr
ipti
on
GA
-in
tern
al f
acto
r 2
- D
escr
ipti
on
Exte
rnal
fac
tor
1 -
Des
crip
tio
n
Exte
rnal
fac
tor
2 -
Des
crip
tio
n
Kavango George Mukoya 1705 Kakekete 170 137 287.7 High 456 89 100 100 100 67 Remoteness of GA
Kavango Ambrosius Haingura 1801 Samasira 127 41.9 59.5 Medium 379 67 78 100 34 100 Lack of herders
Low level of education
Kavango Ambrosius Haingura 1802 Karo 112 58.2 23.9 Low 367 44 56 100 67 100 Lack of herders
Kavango Ambrosius Haingura 1803 Nsindi 156 152 62 High 434 89 78 100 67 100 Herder performance
Kavango Kaguni West 1901 Kaguni 133 63.3 37.4 Low 334 44 56 100 34 100 Lack of cohesion
Kavango Kaguni West 1902 Katope 146 50 17.8 Low 293 56 44 92 34 67 Lack of cohesion Water point location suboptimal
Kavango Kaguni West 1903 Mungomba 111 25.5 32.6 High 412 67 78 100 67 100 No employment of dedicated herders
Kavango Satotwa 2002 Low 83.4 43.9 29.4 Medium 390 78 78 100 34 100 Spatial separation of kraals Herder turnover
Kavango Satotwa 2003 Etenderera 148 43.9 31.5 Medium 390 56 67 100 67 100 Herder performance
Kavango Kapinga Kamwalye E 2101 Tosa 81.9 41.9 9.5 Low 334 33 67 100 34 100 Lack of cohesion
Kavango Kapinga Kamwalye E 2103 Mangundu 149 114 92.6 High 412 78 67 100 67 100 Herder turnover
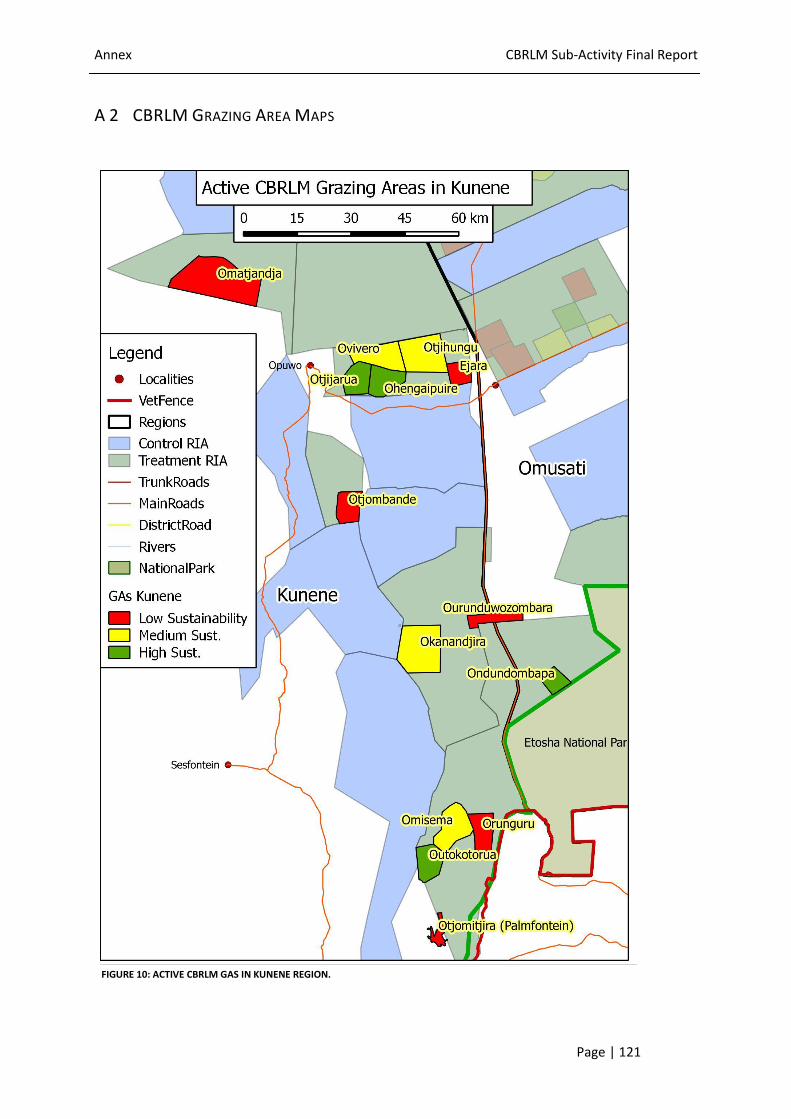
Annex CBRLM Sub-Activity Final Report
Page | 121
A 2 CBRLM GRAZING AREA MAPS
FIGURE 10: ACTIVE CBRLM GAS IN KUNENE REGION.
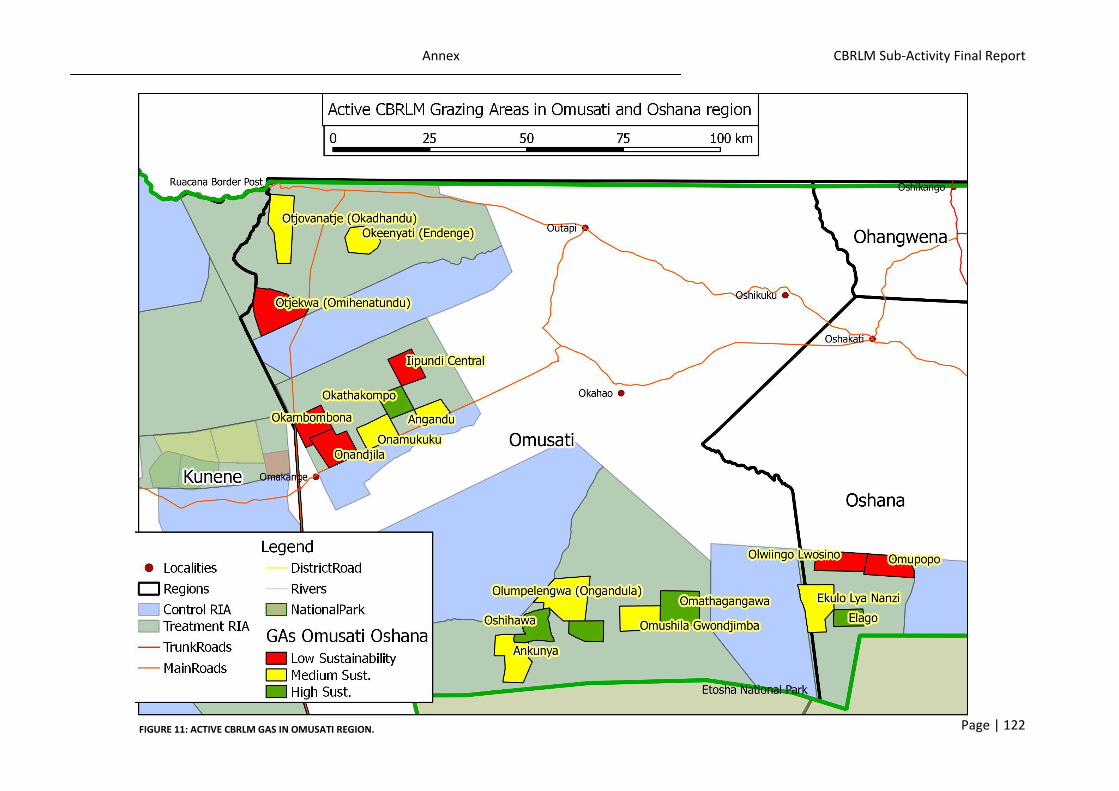
Annex CBRLM Sub-Activity Final Report
Page | 122 FIGURE 11: ACTIVE CBRLM GAS IN OMUSATI REGION.
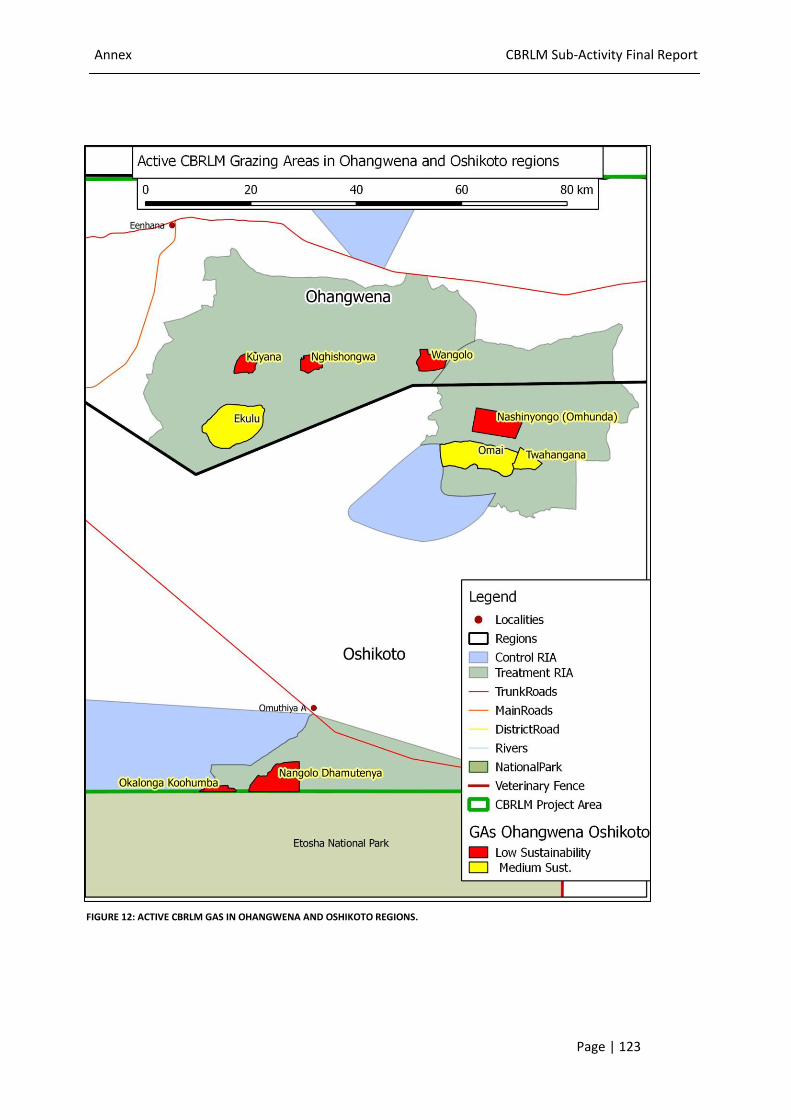
Annex CBRLM Sub-Activity Final Report
Page | 123
FIGURE 12: ACTIVE CBRLM GAS IN OHANGWENA AND OSHIKOTO REGIONS.

Annex CBRLM Sub-Activity Final Report
Page | 124
FIGURE 13: ACTIVE CBRLM GAS IN REGIONS KAVANGO WEST AND EAST.
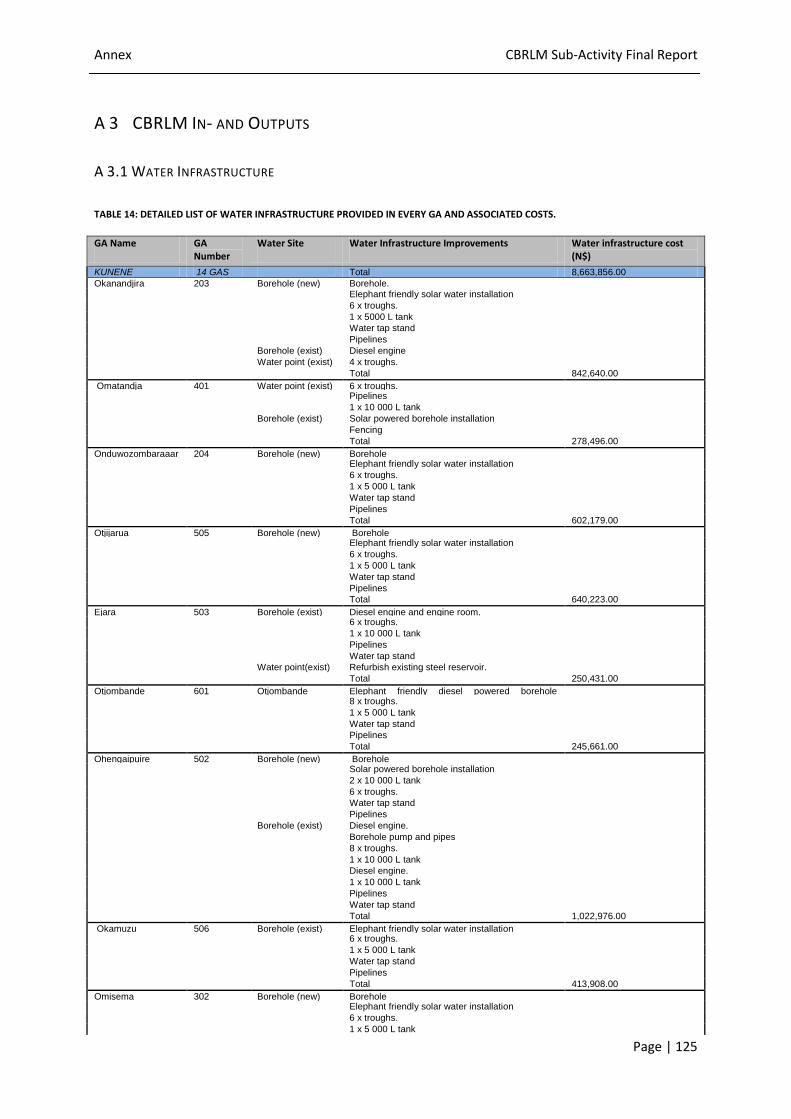
Annex CBRLM Sub-Activity Final Report
Page | 125
A 3 CBRLM IN- AND OUTPUTS
A 3.1 WATER INFRASTRUCTURE
TABLE 14: DETAILED LIST OF WATER INFRASTRUCTURE PROVIDED IN EVERY GA AND ASSOCIATED COSTS.
GA Name GA Number
Water Site Water Infrastructure Improvements Water infrastructure cost (N$)
KUNENE 14 GAS Total 8,663,856.00
Okanandjira 203 Borehole (new) Borehole. Elephant friendly solar water installation
6 x troughs.
1 x 5000 L tank
Water tap stand
Pipelines
Borehole (exist) Diesel engine
Water point (exist) 4 x troughs.
Total 842,640.00
Omatandja 401 Water point (exist) 6 x troughs. Pipelines
1 x 10 000 L tank
Borehole (exist) Solar powered borehole installation
Fencing
Total 278,496.00
Onduwozombaraaar
a
204 Borehole (new) Borehole Elephant friendly solar water installation
6 x troughs.
1 x 5 000 L tank
Water tap stand
Pipelines
Total 602,179.00
Otjijarua 505 Borehole (new) Borehole Elephant friendly solar water installation
6 x troughs.
1 x 5 000 L tank
Water tap stand
Pipelines
Total 640,223.00
Ejara 503 Borehole (exist) Diesel engine and engine room. 6 x troughs.
1 x 10 000 L tank
Pipelines
Water tap stand
Water point(exist) Refurbish existing steel reservoir.
Total 250,431.00
Otjombande 601 Otjombande
borehole (exist)
Elephant friendly diesel powered borehole
installation
8 x troughs.
1 x 5 000 L tank
Water tap stand
Pipelines
Total 245,661.00
Ohengaipuire 502 Borehole (new) Borehole Solar powered borehole installation
2 x 10 000 L tank
6 x troughs.
Water tap stand
Pipelines
Borehole (exist) Diesel engine.
Borehole pump and pipes
8 x troughs.
1 x 10 000 L tank
Diesel engine.
1 x 10 000 L tank
Pipelines
Water tap stand
Total 1,022,976.00
Okamuzu 506 Borehole (exist) Elephant friendly solar water installation 6 x troughs.
1 x 5 000 L tank
Water tap stand
Pipelines
Total 413,908.00
Omisema 302 Borehole (new) Borehole Elephant friendly solar water installation
6 x troughs.
1 x 5 000 L tank
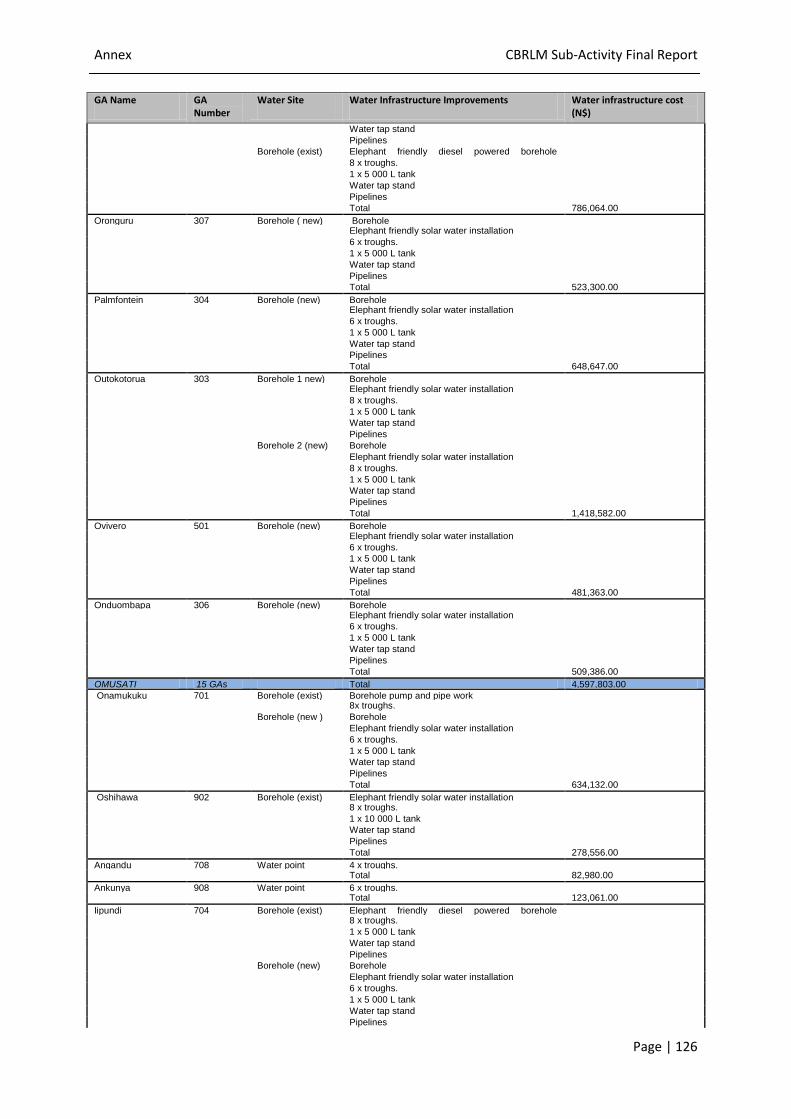
Annex CBRLM Sub-Activity Final Report
Page | 126
GA Name GA Number
Water Site Water Infrastructure Improvements Water infrastructure cost (N$)
Water tap stand
Pipelines
Borehole (exist) Elephant friendly diesel powered borehole
installation
8 x troughs.
1 x 5 000 L tank
Water tap stand
Pipelines
Total 786,064.00
Oronguru 307 Borehole ( new) Borehole Elephant friendly solar water installation
6 x troughs.
1 x 5 000 L tank
Water tap stand
Pipelines
Total 523,300.00
Palmfontein
(Otjimitjira)
304 Borehole (new) Borehole Elephant friendly solar water installation
6 x troughs.
1 x 5 000 L tank
Water tap stand
Pipelines
Total 648,647.00
Outokotorua 303 Borehole 1 new) Borehole Elephant friendly solar water installation
8 x troughs.
1 x 5 000 L tank
Water tap stand
Pipelines
Borehole 2 (new) Borehole
Elephant friendly solar water installation
8 x troughs.
1 x 5 000 L tank
Water tap stand
Pipelines
Total 1,418,582.00
Ovivero 501 Borehole (new) Borehole Elephant friendly solar water installation
6 x troughs.
1 x 5 000 L tank
Water tap stand
Pipelines
Total 481,363.00
Onduombapa 306 Borehole (new) Borehole Elephant friendly solar water installation
6 x troughs.
1 x 5 000 L tank
Water tap stand
Pipelines
Total 509,386.00
OMUSATI 15 GAs Total 4,597,803.00
Onamukuku 701 Borehole (exist) Borehole pump and pipe work 8x troughs.
Borehole (new ) Borehole
Elephant friendly solar water installation
6 x troughs.
1 x 5 000 L tank
Water tap stand
Pipelines
Total 634,132.00
Oshihawa 902 Borehole (exist) Elephant friendly solar water installation 8 x troughs.
1 x 10 000 L tank
Water tap stand
Pipelines
Total 278,556.00
Angandu 708 Water point 4 x troughs. Total 82,980.00
Ankunya 908 Water point 6 x troughs. Total 123,061.00
Iipundi 704 Borehole (exist) Elephant friendly diesel powered borehole
installation
8 x troughs.
1 x 5 000 L tank
Water tap stand
Pipelines
Borehole (new) Borehole
Elephant friendly solar water installation
6 x troughs.
1 x 5 000 L tank
Water tap stand
Pipelines
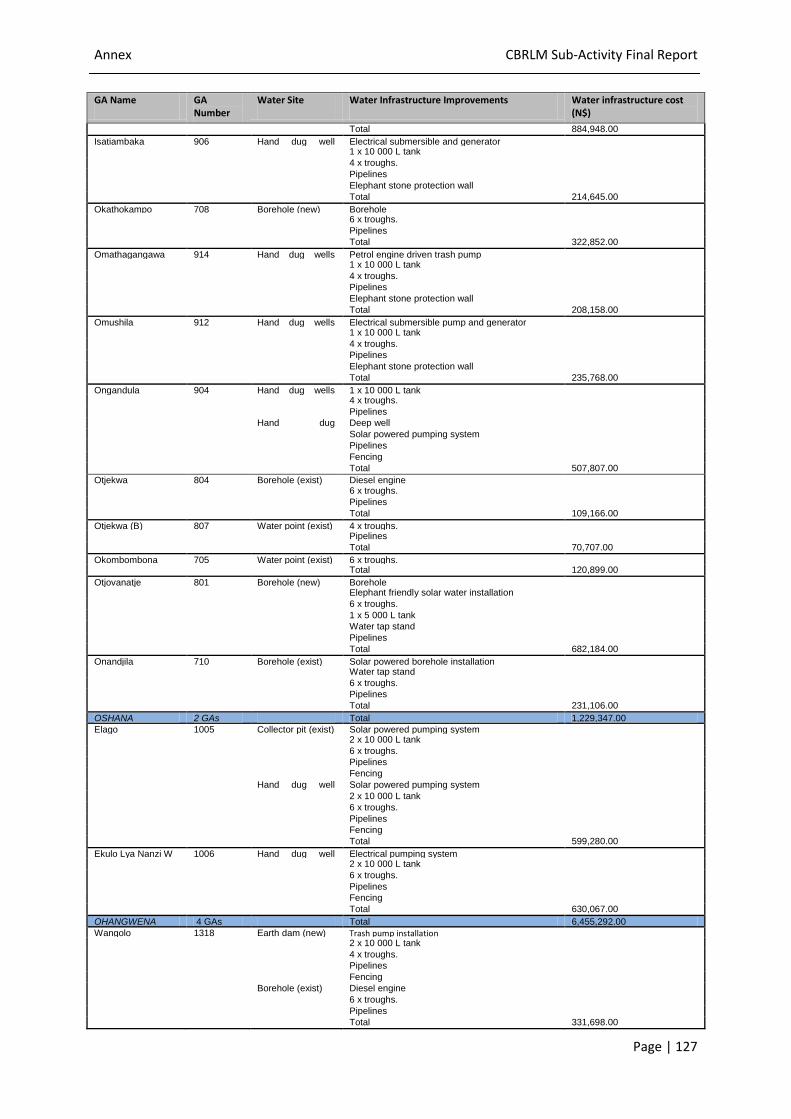
Annex CBRLM Sub-Activity Final Report
Page | 127
GA Name GA Number
Water Site Water Infrastructure Improvements Water infrastructure cost (N$)
Total 884,948.00
Isatiambaka 906 Hand dug well
(exist)
Electrical submersible and generator 1 x 10 000 L tank
4 x troughs.
Pipelines
Elephant stone protection wall
Total 214,645.00
Okathokampo 708 Borehole (new) Borehole 6 x troughs.
Pipelines
Total 322,852.00
Omathagangawa 914 Hand dug wells
(exist)
Petrol engine driven trash pump 1 x 10 000 L tank
4 x troughs.
Pipelines
Elephant stone protection wall
Total 208,158.00
Omushila
Wondjimba
912 Hand dug wells
(exist)
Electrical submersible pump and generator 1 x 10 000 L tank
4 x troughs.
Pipelines
Elephant stone protection wall
Total 235,768.00
Ongandula 904 Hand dug wells
(exist)
1 x 10 000 L tank 4 x troughs.
Pipelines
Hand dug
well(new)
Deep well
Solar powered pumping system
Pipelines
Fencing
Total 507,807.00
Otjekwa
(Omihenatundu)
804 Borehole (exist) Diesel engine 6 x troughs.
Pipelines
Total 109,166.00
Otjekwa (B) 807 Water point (exist) 4 x troughs. Pipelines
Total 70,707.00
Okombombona 705 Water point (exist) 6 x troughs. Total 120,899.00
Otjovanatje 801 Borehole (new) Borehole Elephant friendly solar water installation
6 x troughs.
1 x 5 000 L tank
Water tap stand
Pipelines
Total 682,184.00
Onandjila 710 Borehole (exist) Solar powered borehole installation Water tap stand
6 x troughs.
Pipelines
Total 231,106.00
OSHANA 2 GAs Total 1,229,347.00
Elago 1005 Collector pit (exist) Solar powered pumping system 2 x 10 000 L tank
6 x troughs.
Pipelines
Fencing
Hand dug well
(exist)
Solar powered pumping system
2 x 10 000 L tank
6 x troughs.
Pipelines
Fencing
Total 599,280.00
Ekulo Lya Nanzi W 1006 Hand dug well
(exist)
Electrical pumping system 2 x 10 000 L tank
6 x troughs.
Pipelines
Fencing
Total 630,067.00
OHANGWENA 4 GAs Total 6,455,292.00
Wangolo 1318 Earth dam (new) Trash pump installation 2 x 10 000 L tank
4 x troughs.
Pipelines
Fencing
Borehole (exist) Diesel engine
6 x troughs.
Pipelines
Total 331,698.00
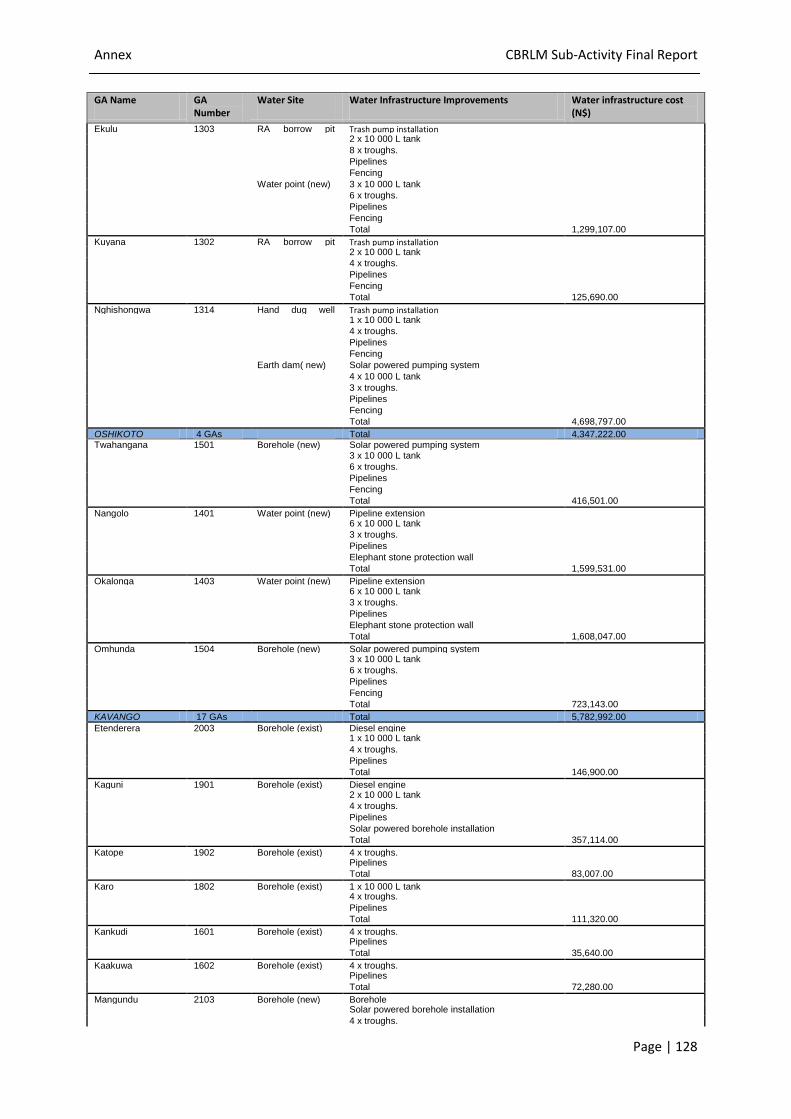
Annex CBRLM Sub-Activity Final Report
Page | 128
GA Name GA Number
Water Site Water Infrastructure Improvements Water infrastructure cost (N$)
Ekulu 1303 RA borrow pit
(new)
Trash pump installation 2 x 10 000 L tank
8 x troughs.
Pipelines
Fencing
Water point (new) 3 x 10 000 L tank
6 x troughs.
Pipelines
Fencing
Total 1,299,107.00
Kuyana 1302 RA borrow pit
(new)
Trash pump installation 2 x 10 000 L tank
4 x troughs.
Pipelines
Fencing
Total 125,690.00
Nghishongwa 1314 Hand dug well
(exist)
Trash pump installation 1 x 10 000 L tank
4 x troughs.
Pipelines
Fencing
Earth dam( new) Solar powered pumping system
4 x 10 000 L tank
3 x troughs.
Pipelines
Fencing
Total 4,698,797.00
OSHIKOTO 4 GAs Total 4,347,222.00 Twahangana 1501 Borehole (new) Solar powered pumping system 3 x 10 000 L tank
6 x troughs.
Pipelines
Fencing
Total 416,501.00
Nangolo
Dhamutenya
1401 Water point (new) Pipeline extension 6 x 10 000 L tank
3 x troughs.
Pipelines
Elephant stone protection wall
Total 1,599,531.00
Okalonga
Koohumba
1403 Water point (new) Pipeline extension 6 x 10 000 L tank
3 x troughs.
Pipelines
Elephant stone protection wall
Total 1,608,047.00
Omhunda 1504 Borehole (new) Solar powered pumping system 3 x 10 000 L tank
6 x troughs.
Pipelines
Fencing
Total 723,143.00
KAVANGO 17 GAs Total 5,782,992.00
Etenderera 2003 Borehole (exist) Diesel engine 1 x 10 000 L tank
4 x troughs.
Pipelines
Total 146,900.00
Kaguni 1901 Borehole (exist) Diesel engine 2 x 10 000 L tank
4 x troughs.
Pipelines
Solar powered borehole installation
Total 357,114.00
Katope 1902 Borehole (exist) 4 x troughs. Pipelines
Total 83,007.00
Karo 1802 Borehole (exist) 1 x 10 000 L tank 4 x troughs.
Pipelines
Total 111,320.00
Kankudi 1601 Borehole (exist) 4 x troughs. Pipelines
Total 35,640.00
Kaakuwa 1602 Borehole (exist) 4 x troughs. Pipelines
Total 72,280.00
Mangundu 2103 Borehole (new) Borehole Solar powered borehole installation
4 x troughs.
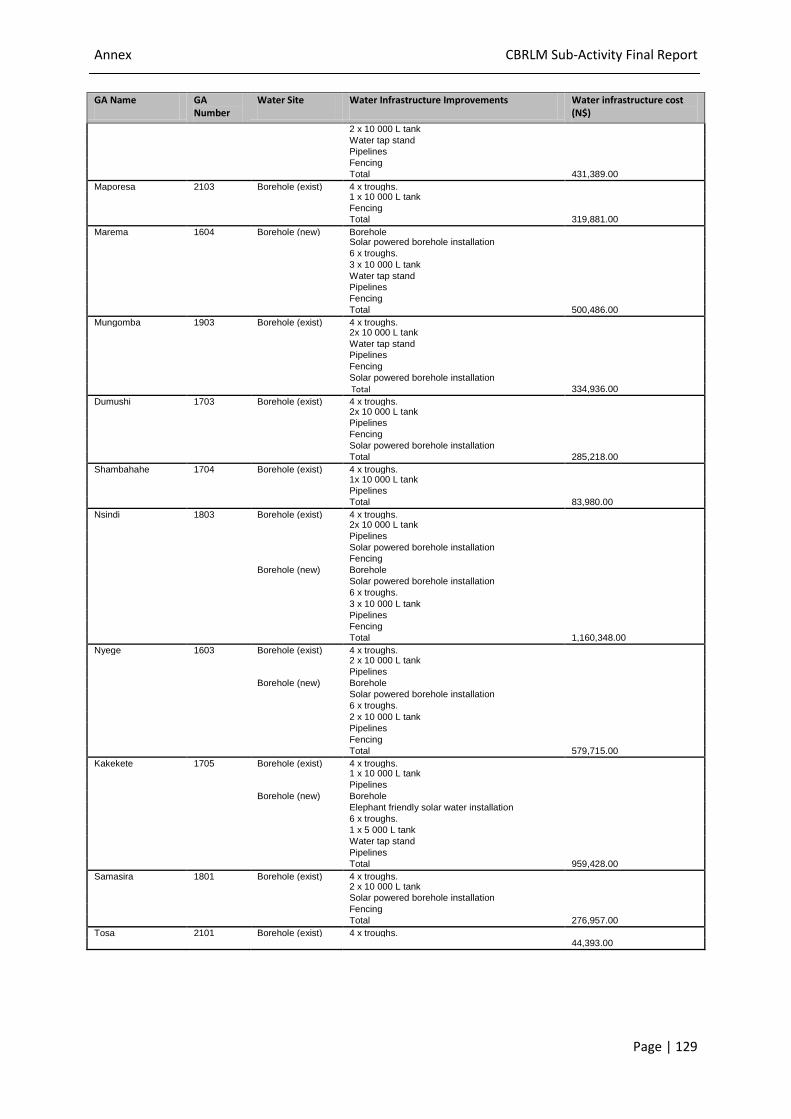
Annex CBRLM Sub-Activity Final Report
Page | 129
GA Name GA Number
Water Site Water Infrastructure Improvements Water infrastructure cost (N$)
2 x 10 000 L tank
Water tap stand
Pipelines
Fencing
Total 431,389.00
Maporesa 2103 Borehole (exist) 4 x troughs. 1 x 10 000 L tank
Fencing
Total 319,881.00
Marema 1604 Borehole (new) Borehole Solar powered borehole installation
6 x troughs.
3 x 10 000 L tank
Water tap stand
Pipelines
Fencing
Total 500,486.00
Mungomba 1903 Borehole (exist) 4 x troughs. 2x 10 000 L tank
Water tap stand
Pipelines
Fencing
Solar powered borehole installation
Total 334,936.00
Dumushi 1703 Borehole (exist) 4 x troughs. 2x 10 000 L tank
Pipelines
Fencing
Solar powered borehole installation
Total 285,218.00
Shambahahe 1704 Borehole (exist) 4 x troughs. 1x 10 000 L tank
Pipelines
Total 83,980.00
Nsindi 1803 Borehole (exist) 4 x troughs. 2x 10 000 L tank
Pipelines
Solar powered borehole installation
Fencing
Borehole (new) Borehole
Solar powered borehole installation
6 x troughs.
3 x 10 000 L tank
Pipelines
Fencing
Total 1,160,348.00
Nyege 1603 Borehole (exist) 4 x troughs. 2 x 10 000 L tank
Pipelines
Borehole (new) Borehole
Solar powered borehole installation
6 x troughs.
2 x 10 000 L tank
Pipelines
Fencing
Total 579,715.00
Kakekete 1705 Borehole (exist) 4 x troughs. 1 x 10 000 L tank
Pipelines
Borehole (new) Borehole
Elephant friendly solar water installation
6 x troughs.
1 x 5 000 L tank
Water tap stand
Pipelines
Total 959,428.00
Samasira 1801 Borehole (exist) 4 x troughs. 2 x 10 000 L tank
Solar powered borehole installation
Fencing
Total 276,957.00
Tosa 2101 Borehole (exist) 4 x troughs. 44,393.00
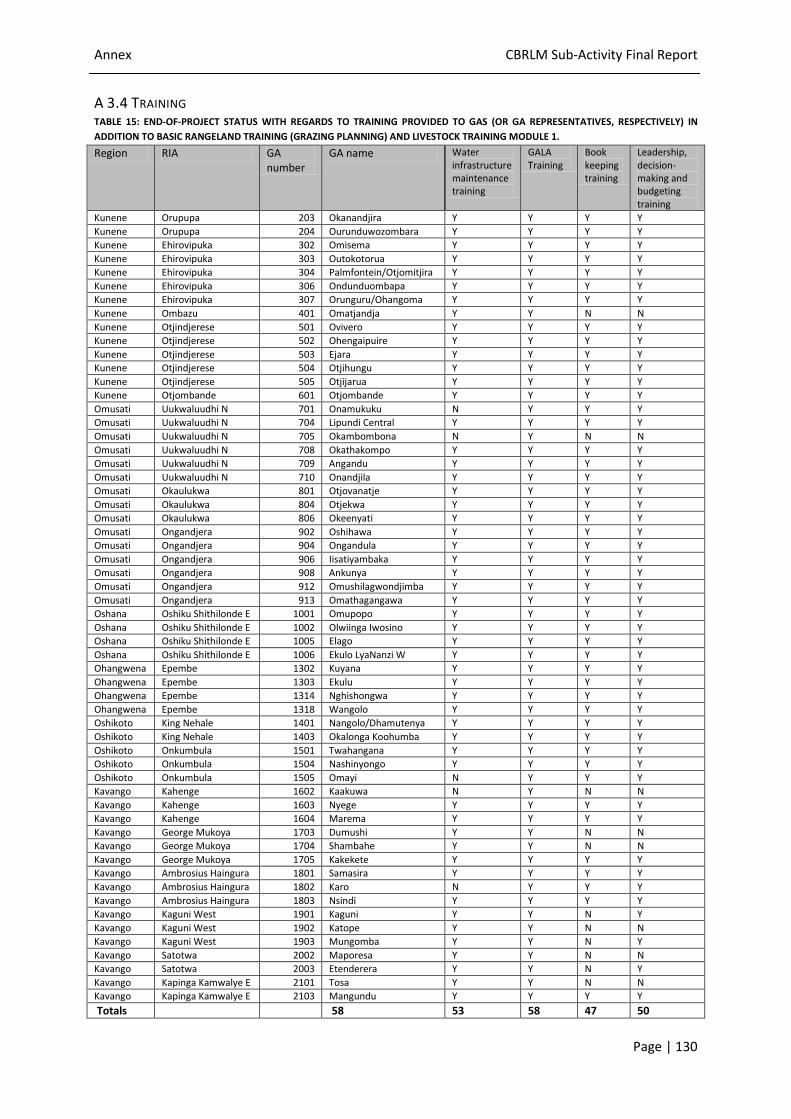
Annex CBRLM Sub-Activity Final Report
Page | 130
A 3.4 TRAINING TABLE 15: END-OF-PROJECT STATUS WITH REGARDS TO TRAINING PROVIDED TO GAS (OR GA REPRESENTATIVES, RESPECTIVELY) IN
ADDITION TO BASIC RANGELAND TRAINING (GRAZING PLANNING) AND LIVESTOCK TRAINING MODULE 1.
Region RIA GA number
GA name Water infrastructure maintenance training
GALA Training
Book keeping training
Leadership, decision-making and budgeting training
Kunene Orupupa 203 Okanandjira Y Y Y Y
Kunene Orupupa 204 Ourunduwozombara Y Y Y Y
Kunene Ehirovipuka 302 Omisema Y Y Y Y
Kunene Ehirovipuka 303 Outokotorua Y Y Y Y
Kunene Ehirovipuka 304 Palmfontein/Otjomitjira Y Y Y Y
Kunene Ehirovipuka 306 Ondunduombapa Y Y Y Y
Kunene Ehirovipuka 307 Orunguru/Ohangoma Y Y Y Y
Kunene Ombazu 401 Omatjandja Y Y N N
Kunene Otjindjerese 501 Ovivero Y Y Y Y
Kunene Otjindjerese 502 Ohengaipuire Y Y Y Y
Kunene Otjindjerese 503 Ejara Y Y Y Y
Kunene Otjindjerese 504 Otjihungu Y Y Y Y
Kunene Otjindjerese 505 Otjijarua Y Y Y Y
Kunene Otjombande 601 Otjombande Y Y Y Y
Omusati Uukwaluudhi N 701 Onamukuku N Y Y Y
Omusati Uukwaluudhi N 704 Lipundi Central Y Y Y Y
Omusati Uukwaluudhi N 705 Okambombona N Y N N
Omusati Uukwaluudhi N 708 Okathakompo Y Y Y Y
Omusati Uukwaluudhi N 709 Angandu Y Y Y Y
Omusati Uukwaluudhi N 710 Onandjila Y Y Y Y
Omusati Okaulukwa 801 Otjovanatje Y Y Y Y
Omusati Okaulukwa 804 Otjekwa Y Y Y Y
Omusati Okaulukwa 806 Okeenyati Y Y Y Y
Omusati Ongandjera 902 Oshihawa Y Y Y Y
Omusati Ongandjera 904 Ongandula Y Y Y Y
Omusati Ongandjera 906 Iisatiyambaka Y Y Y Y
Omusati Ongandjera 908 Ankunya Y Y Y Y
Omusati Ongandjera 912 Omushilagwondjimba Y Y Y Y
Omusati Ongandjera 913 Omathagangawa Y Y Y Y
Oshana Oshiku Shithilonde E 1001 Omupopo Y Y Y Y
Oshana Oshiku Shithilonde E 1002 Olwiinga Iwosino Y Y Y Y
Oshana Oshiku Shithilonde E 1005 Elago Y Y Y Y
Oshana Oshiku Shithilonde E 1006 Ekulo LyaNanzi W Y Y Y Y
Ohangwena Epembe 1302 Kuyana Y Y Y Y
Ohangwena Epembe 1303 Ekulu Y Y Y Y
Ohangwena Epembe 1314 Nghishongwa Y Y Y Y
Ohangwena Epembe 1318 Wangolo Y Y Y Y
Oshikoto King Nehale 1401 Nangolo/Dhamutenya Y Y Y Y
Oshikoto King Nehale 1403 Okalonga Koohumba Y Y Y Y
Oshikoto Onkumbula 1501 Twahangana Y Y Y Y
Oshikoto Onkumbula 1504 Nashinyongo Y Y Y Y
Oshikoto Onkumbula 1505 Omayi N Y Y Y
Kavango Kahenge 1602 Kaakuwa N Y N N
Kavango Kahenge 1603 Nyege Y Y Y Y
Kavango Kahenge 1604 Marema Y Y Y Y
Kavango George Mukoya 1703 Dumushi Y Y N N
Kavango George Mukoya 1704 Shambahe Y Y N N
Kavango George Mukoya 1705 Kakekete Y Y Y Y
Kavango Ambrosius Haingura 1801 Samasira Y Y Y Y
Kavango Ambrosius Haingura 1802 Karo N Y Y Y
Kavango Ambrosius Haingura 1803 Nsindi Y Y Y Y
Kavango Kaguni West 1901 Kaguni Y Y N Y
Kavango Kaguni West 1902 Katope Y Y N N
Kavango Kaguni West 1903 Mungomba Y Y N Y
Kavango Satotwa 2002 Maporesa Y Y N N
Kavango Satotwa 2003 Etenderera Y Y N Y
Kavango Kapinga Kamwalye E 2101 Tosa Y Y N N
Kavango Kapinga Kamwalye E 2103 Mangundu Y Y Y Y
Totals 58 53 58 47 50
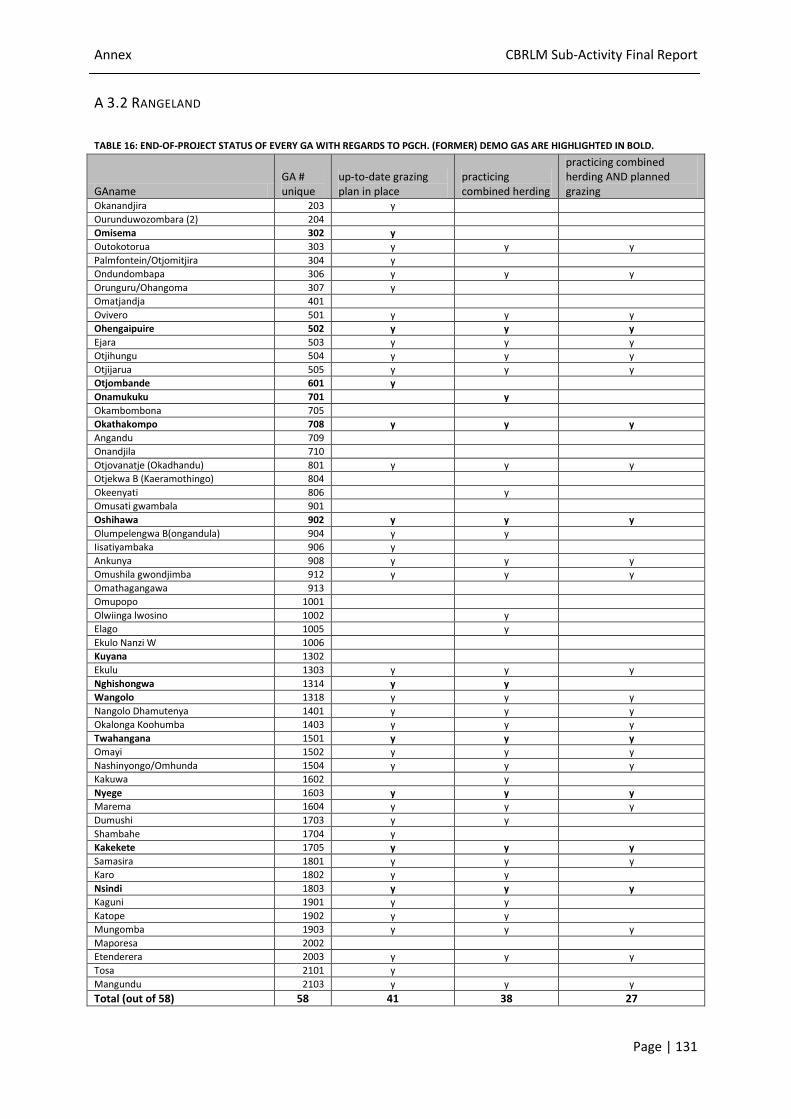
Annex CBRLM Sub-Activity Final Report
Page | 131
A 3.2 RANGELAND
TABLE 16: END-OF-PROJECT STATUS OF EVERY GA WITH REGARDS TO PGCH. (FORMER) DEMO GAS ARE HIGHLIGHTED IN BOLD.
GAname GA # unique
up-to-date grazing plan in place
practicing combined herding
practicing combined herding AND planned grazing
Okanandjira 203 y
Ourunduwozombara (2) 204
Omisema 302 y
Outokotorua 303 y y y
Palmfontein/Otjomitjira 304 y
Ondundombapa 306 y y y
Orunguru/Ohangoma 307 y
Omatjandja 401
Ovivero 501 y y y
Ohengaipuire 502 y y y
Ejara 503 y y y
Otjihungu 504 y y y
Otjijarua 505 y y y
Otjombande 601 y
Onamukuku 701 y
Okambombona 705
Okathakompo 708 y y y
Angandu 709
Onandjila 710
Otjovanatje (Okadhandu) 801 y y y
Otjekwa B (Kaeramothingo) 804
Okeenyati 806 y
Omusati gwambala 901
Oshihawa 902 y y y
Olumpelengwa B(ongandula) 904 y y
Iisatiyambaka 906 y
Ankunya 908 y y y
Omushila gwondjimba 912 y y y
Omathagangawa 913
Omupopo 1001
Olwiinga lwosino 1002 y
Elago 1005 y
Ekulo Nanzi W 1006
Kuyana 1302
Ekulu 1303 y y y
Nghishongwa 1314 y y
Wangolo 1318 y y y
Nangolo Dhamutenya 1401 y y y
Okalonga Koohumba 1403 y y y
Twahangana 1501 y y y
Omayi 1502 y y y
Nashinyongo/Omhunda 1504 y y y
Kakuwa 1602 y
Nyege 1603 y y y
Marema 1604 y y y
Dumushi 1703 y y
Shambahe 1704 y
Kakekete 1705 y y y
Samasira 1801 y y y
Karo 1802 y y
Nsindi 1803 y y y
Kaguni 1901 y y
Katope 1902 y y
Mungomba 1903 y y y
Maporesa 2002
Etenderera 2003 y y y
Tosa 2101 y
Mangundu 2103 y y y
Total (out of 58) 58 41 38 27
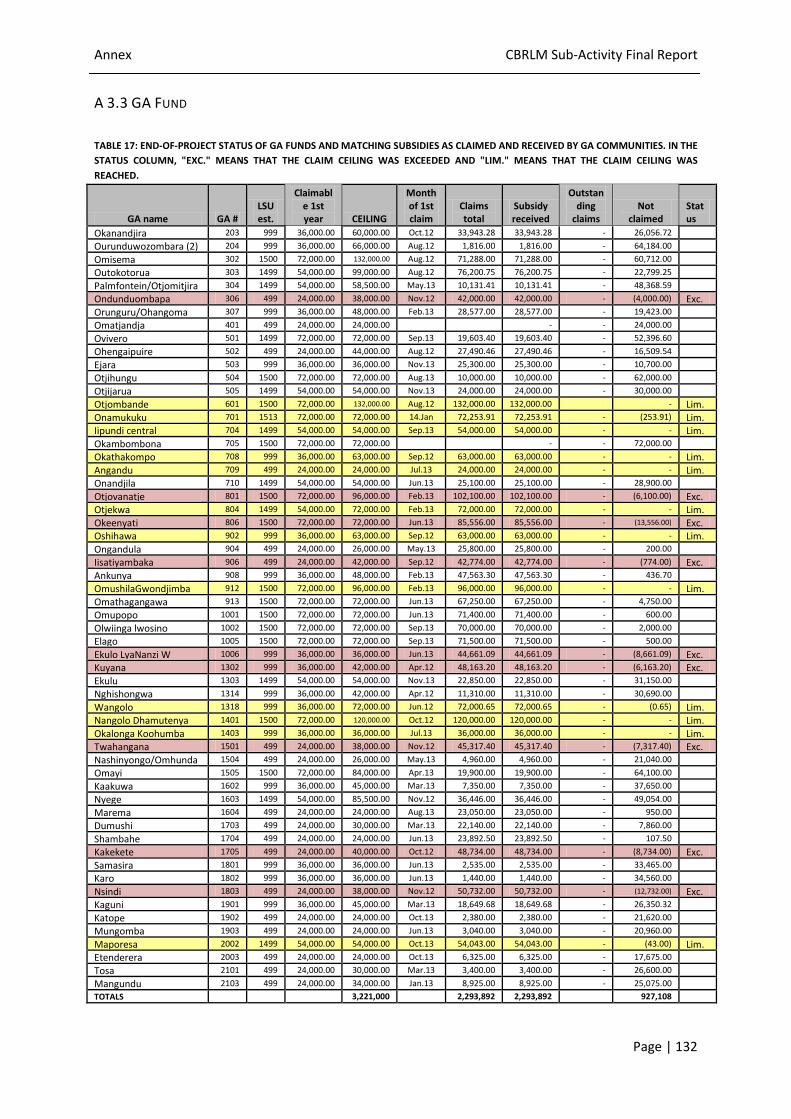
Annex CBRLM Sub-Activity Final Report
Page | 132
A 3.3 GA FUND
TABLE 17: END-OF-PROJECT STATUS OF GA FUNDS AND MATCHING SUBSIDIES AS CLAIMED AND RECEIVED BY GA COMMUNITIES. IN THE
STATUS COLUMN, "EXC." MEANS THAT THE CLAIM CEILING WAS EXCEEDED AND "LIM." MEANS THAT THE CLAIM CEILING WAS
REACHED.
GA name GA # LSU est.
Claimable 1st year CEILING
Month of 1st claim
Claims total
Subsidy received
Outstanding
claims Not
claimed Status
Okanandjira 203 999 36,000.00 60,000.00 Oct.12 33,943.28 33,943.28 - 26,056.72 Ourunduwozombara (2) 204 999 36,000.00 66,000.00 Aug.12 1,816.00 1,816.00 - 64,184.00 Omisema 302 1500 72,000.00 132,000.00 Aug.12 71,288.00 71,288.00 - 60,712.00 Outokotorua 303 1499 54,000.00 99,000.00 Aug.12 76,200.75 76,200.75 - 22,799.25 Palmfontein/Otjomitjira 304 1499 54,000.00 58,500.00 May.13 10,131.41 10,131.41 - 48,368.59 Ondunduombapa 306 499 24,000.00 38,000.00 Nov.12 42,000.00 42,000.00 - (4,000.00) Exc. Orunguru/Ohangoma 307 999 36,000.00 48,000.00 Feb.13 28,577.00 28,577.00 - 19,423.00 Omatjandja 401 499 24,000.00 24,000.00 - - 24,000.00 Ovivero 501 1499 72,000.00 72,000.00 Sep.13 19,603.40 19,603.40 - 52,396.60 Ohengaipuire 502 499 24,000.00 44,000.00 Aug.12 27,490.46 27,490.46 - 16,509.54 Ejara 503 999 36,000.00 36,000.00 Nov.13 25,300.00 25,300.00 - 10,700.00 Otjihungu 504 1500 72,000.00 72,000.00 Aug.13 10,000.00 10,000.00 - 62,000.00 Otjijarua 505 1499 54,000.00 54,000.00 Nov.13 24,000.00 24,000.00 - 30,000.00 Otjombande 601 1500 72,000.00 132,000.00 Aug.12 132,000.00 132,000.00 - Lim. Onamukuku 701 1513 72,000.00 72,000.00 14.Jan 72,253.91 72,253.91 - (253.91) Lim. Iipundi central 704 1499 54,000.00 54,000.00 Sep.13 54,000.00 54,000.00 - - Lim. Okambombona 705 1500 72,000.00 72,000.00 - - 72,000.00 Okathakompo 708 999 36,000.00 63,000.00 Sep.12 63,000.00 63,000.00 - - Lim. Angandu 709 499 24,000.00 24,000.00 Jul.13 24,000.00 24,000.00 - - Lim. Onandjila 710 1499 54,000.00 54,000.00 Jun.13 25,100.00 25,100.00 - 28,900.00 Otjovanatje 801 1500 72,000.00 96,000.00 Feb.13 102,100.00 102,100.00 - (6,100.00) Exc. Otjekwa 804 1499 54,000.00 72,000.00 Feb.13 72,000.00 72,000.00 - - Lim. Okeenyati 806 1500 72,000.00 72,000.00 Jun.13 85,556.00 85,556.00 - (13,556.00) Exc. Oshihawa 902 999 36,000.00 63,000.00 Sep.12 63,000.00 63,000.00 - - Lim. Ongandula 904 499 24,000.00 26,000.00 May.13 25,800.00 25,800.00 - 200.00 Iisatiyambaka 906 499 24,000.00 42,000.00 Sep.12 42,774.00 42,774.00 - (774.00) Exc. Ankunya 908 999 36,000.00 48,000.00 Feb.13 47,563.30 47,563.30 - 436.70 OmushilaGwondjimba 912 1500 72,000.00 96,000.00 Feb.13 96,000.00 96,000.00 - - Lim. Omathagangawa 913 1500 72,000.00 72,000.00 Jun.13 67,250.00 67,250.00 - 4,750.00 Omupopo 1001 1500 72,000.00 72,000.00 Jun.13 71,400.00 71,400.00 - 600.00 Olwiinga lwosino 1002 1500 72,000.00 72,000.00 Sep.13 70,000.00 70,000.00 - 2,000.00 Elago 1005 1500 72,000.00 72,000.00 Sep.13 71,500.00 71,500.00 - 500.00 Ekulo LyaNanzi W 1006 999 36,000.00 36,000.00 Jun.13 44,661.09 44,661.09 - (8,661.09) Exc. Kuyana 1302 999 36,000.00 42,000.00 Apr.12 48,163.20 48,163.20 - (6,163.20) Exc. Ekulu 1303 1499 54,000.00 54,000.00 Nov.13 22,850.00 22,850.00 - 31,150.00 Nghishongwa 1314 999 36,000.00 42,000.00 Apr.12 11,310.00 11,310.00 - 30,690.00 Wangolo 1318 999 36,000.00 72,000.00 Jun.12 72,000.65 72,000.65 - (0.65) Lim. Nangolo Dhamutenya 1401 1500 72,000.00 120,000.00 Oct.12 120,000.00 120,000.00 - - Lim. Okalonga Koohumba 1403 999 36,000.00 36,000.00 Jul.13 36,000.00 36,000.00 - - Lim. Twahangana 1501 499 24,000.00 38,000.00 Nov.12 45,317.40 45,317.40 - (7,317.40) Exc. Nashinyongo/Omhunda 1504 499 24,000.00 26,000.00 May.13 4,960.00 4,960.00 - 21,040.00 Omayi 1505 1500 72,000.00 84,000.00 Apr.13 19,900.00 19,900.00 - 64,100.00 Kaakuwa 1602 999 36,000.00 45,000.00 Mar.13 7,350.00 7,350.00 - 37,650.00 Nyege 1603 1499 54,000.00 85,500.00 Nov.12 36,446.00 36,446.00 - 49,054.00 Marema 1604 499 24,000.00 24,000.00 Aug.13 23,050.00 23,050.00 - 950.00 Dumushi 1703 499 24,000.00 30,000.00 Mar.13 22,140.00 22,140.00 - 7,860.00 Shambahe 1704 499 24,000.00 24,000.00 Jun.13 23,892.50 23,892.50 - 107.50 Kakekete 1705 499 24,000.00 40,000.00 Oct.12 48,734.00 48,734.00 - (8,734.00) Exc. Samasira 1801 999 36,000.00 36,000.00 Jun.13 2,535.00 2,535.00 - 33,465.00 Karo 1802 999 36,000.00 36,000.00 Jun.13 1,440.00 1,440.00 - 34,560.00 Nsindi 1803 499 24,000.00 38,000.00 Nov.12 50,732.00 50,732.00 - (12,732.00) Exc. Kaguni 1901 999 36,000.00 45,000.00 Mar.13 18,649.68 18,649.68 - 26,350.32 Katope 1902 499 24,000.00 24,000.00 Oct.13 2,380.00 2,380.00 - 21,620.00 Mungomba 1903 499 24,000.00 24,000.00 Jun.13 3,040.00 3,040.00 - 20,960.00 Maporesa 2002 1499 54,000.00 54,000.00 Oct.13 54,043.00 54,043.00 - (43.00) Lim. Etenderera 2003 499 24,000.00 24,000.00 Oct.13 6,325.00 6,325.00 - 17,675.00 Tosa 2101 499 24,000.00 30,000.00 Mar.13 3,400.00 3,400.00 - 26,600.00 Mangundu 2103 499 24,000.00 34,000.00 Jan.13 8,925.00 8,925.00 - 25,075.00 TOTALS 3,221,000 2,293,892 2,293,892 927,108
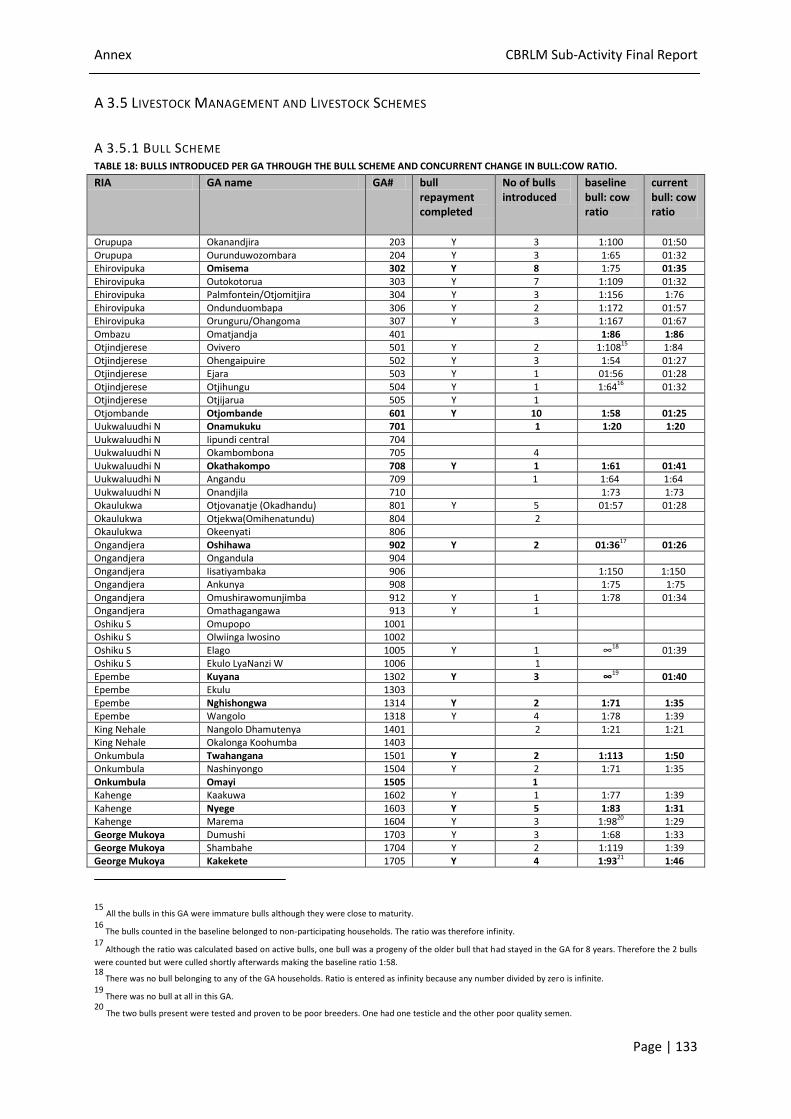
Annex CBRLM Sub-Activity Final Report
Page | 133
A 3.5 LIVESTOCK MANAGEMENT AND LIVESTOCK SCHEMES
A 3.5.1 BULL SCHEME TABLE 18: BULLS INTRODUCED PER GA THROUGH THE BULL SCHEME AND CONCURRENT CHANGE IN BULL:COW RATIO.
RIA GA name GA# bull repayment completed
No of bulls introduced
baseline bull: cow ratio
current bull: cow ratio
Orupupa Okanandjira 203 Y 3 1:100 01:50 Orupupa Ourunduwozombara 204 Y 3 1:65 01:32 Ehirovipuka Omisema 302 Y 8 1:75 01:35 Ehirovipuka Outokotorua 303 Y 7 1:109 01:32 Ehirovipuka Palmfontein/Otjomitjira 304 Y 3 1:156 1:76 Ehirovipuka Ondunduombapa 306 Y 2 1:172 01:57 Ehirovipuka Orunguru/Ohangoma 307 Y 3 1:167 01:67 Ombazu Omatjandja 401 1:86 1:86 Otjindjerese Ovivero 501 Y 2 1:10815 1:84 Otjindjerese Ohengaipuire 502 Y 3 1:54 01:27 Otjindjerese Ejara 503 Y 1 01:56 01:28 Otjindjerese Otjihungu 504 Y 1 1:6416 01:32 Otjindjerese Otjijarua 505 Y 1 Otjombande Otjombande 601 Y 10 1:58 01:25 Uukwaluudhi N Onamukuku 701 1 1:20 1:20 Uukwaluudhi N Iipundi central 704 Uukwaluudhi N Okambombona 705 4 Uukwaluudhi N Okathakompo 708 Y 1 1:61 01:41 Uukwaluudhi N Angandu 709 1 1:64 1:64 Uukwaluudhi N Onandjila 710 1:73 1:73 Okaulukwa Otjovanatje (Okadhandu) 801 Y 5 01:57 01:28 Okaulukwa Otjekwa(Omihenatundu) 804 2 Okaulukwa Okeenyati 806 Ongandjera Oshihawa 902 Y 2 01:3617 01:26 Ongandjera Ongandula 904 Ongandjera Iisatiyambaka 906 1:150 1:150 Ongandjera Ankunya 908 1:75 1:75 Ongandjera Omushirawomunjimba 912 Y 1 1:78 01:34 Ongandjera Omathagangawa 913 Y 1 Oshiku S Omupopo 1001 Oshiku S Olwiinga lwosino 1002 Oshiku S Elago 1005 Y 1 ∞18 01:39 Oshiku S Ekulo LyaNanzi W 1006 1 Epembe Kuyana 1302 Y 3 ∞19 01:40 Epembe Ekulu 1303 Epembe Nghishongwa 1314 Y 2 1:71 1:35 Epembe Wangolo 1318 Y 4 1:78 1:39 King Nehale Nangolo Dhamutenya 1401 2 1:21 1:21 King Nehale Okalonga Koohumba 1403 Onkumbula Twahangana 1501 Y 2 1:113 1:50 Onkumbula Nashinyongo 1504 Y 2 1:71 1:35 Onkumbula Omayi 1505 1 Kahenge Kaakuwa 1602 Y 1 1:77 1:39 Kahenge Nyege 1603 Y 5 1:83 1:31 Kahenge Marema 1604 Y 3 1:9820 1:29 George Mukoya Dumushi 1703 Y 3 1:68 1:33 George Mukoya Shambahe 1704 Y 2 1:119 1:39 George Mukoya Kakekete 1705 Y 4 1:9321 1:46
15 All the bulls in this GA were immature bulls although they were close to maturity.
16 The bulls counted in the baseline belonged to non-participating households. The ratio was therefore infinity.
17 Although the ratio was calculated based on active bulls, one bull was a progeny of the older bull that had stayed in the GA for 8 years. Therefore the 2 bulls
were counted but were culled shortly afterwards making the baseline ratio 1:58. 18
There was no bull belonging to any of the GA households. Ratio is entered as infinity because any number divided by zero is infinite. 19
There was no bull at all in this GA. 20
The two bulls present were tested and proven to be poor breeders. One had one testicle and the other poor quality semen.
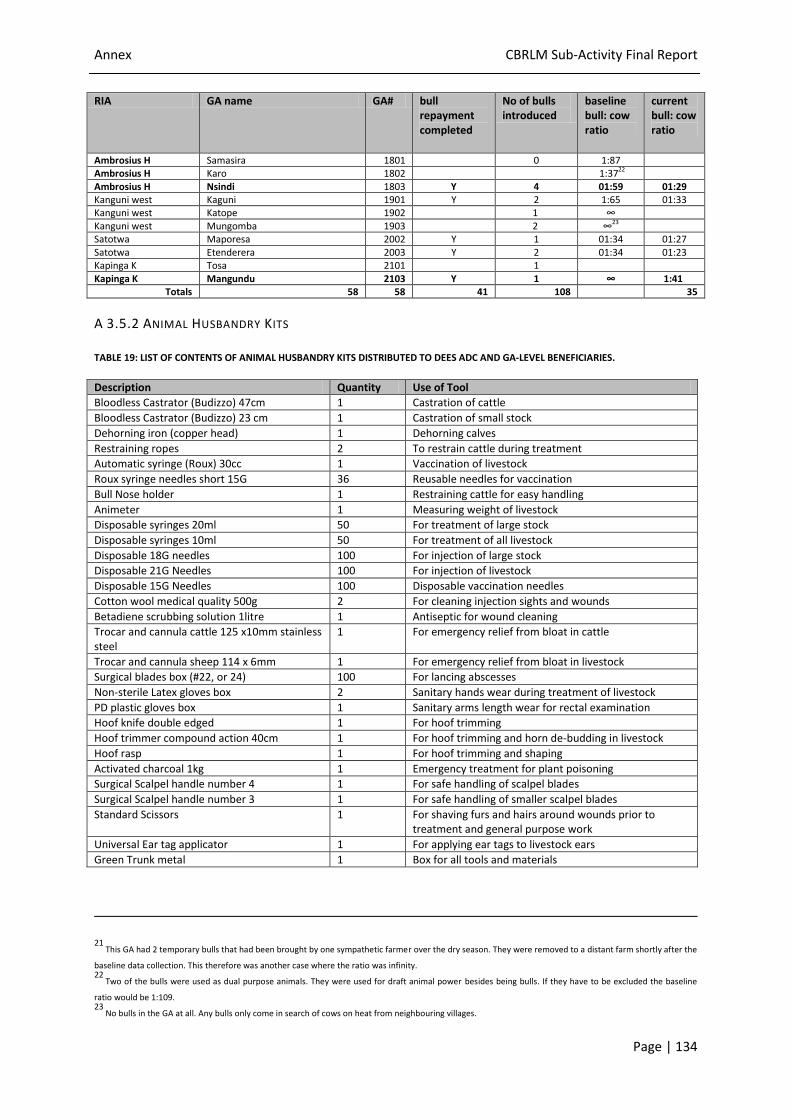
Annex CBRLM Sub-Activity Final Report
Page | 134
RIA GA name GA# bull repayment completed
No of bulls introduced
baseline bull: cow ratio
current bull: cow ratio
Ambrosius H Samasira 1801 0 1:87 Ambrosius H Karo 1802 1:3722 Ambrosius H Nsindi 1803 Y 4 01:59 01:29 Kanguni west Kaguni 1901 Y 2 1:65 01:33 Kanguni west Katope 1902 1 ∞ Kanguni west Mungomba 1903 2 ∞23 Satotwa Maporesa 2002 Y 1 01:34 01:27 Satotwa Etenderera 2003 Y 2 01:34 01:23 Kapinga K Tosa 2101 1 Kapinga K Mangundu 2103 Y 1 ∞ 1:41
Totals 58 58 41 108 35
A 3.5.2 ANIMAL HUSBANDRY KITS
TABLE 19: LIST OF CONTENTS OF ANIMAL HUSBANDRY KITS DISTRIBUTED TO DEES ADC AND GA-LEVEL BENEFICIARIES.
Description Quantity Use of Tool
Bloodless Castrator (Budizzo) 47cm 1 Castration of cattle
Bloodless Castrator (Budizzo) 23 cm 1 Castration of small stock
Dehorning iron (copper head) 1 Dehorning calves
Restraining ropes 2 To restrain cattle during treatment
Automatic syringe (Roux) 30cc 1 Vaccination of livestock
Roux syringe needles short 15G 36 Reusable needles for vaccination
Bull Nose holder 1 Restraining cattle for easy handling
Animeter 1 Measuring weight of livestock
Disposable syringes 20ml 50 For treatment of large stock
Disposable syringes 10ml 50 For treatment of all livestock
Disposable 18G needles 100 For injection of large stock
Disposable 21G Needles 100 For injection of livestock
Disposable 15G Needles 100 Disposable vaccination needles
Cotton wool medical quality 500g 2 For cleaning injection sights and wounds
Betadiene scrubbing solution 1litre 1 Antiseptic for wound cleaning
Trocar and cannula cattle 125 x10mm stainless steel
1 For emergency relief from bloat in cattle
Trocar and cannula sheep 114 x 6mm 1 For emergency relief from bloat in livestock
Surgical blades box (#22, or 24) 100 For lancing abscesses
Non-sterile Latex gloves box 2 Sanitary hands wear during treatment of livestock
PD plastic gloves box 1 Sanitary arms length wear for rectal examination
Hoof knife double edged 1 For hoof trimming
Hoof trimmer compound action 40cm 1 For hoof trimming and horn de-budding in livestock
Hoof rasp 1 For hoof trimming and shaping
Activated charcoal 1kg 1 Emergency treatment for plant poisoning
Surgical Scalpel handle number 4 1 For safe handling of scalpel blades
Surgical Scalpel handle number 3 1 For safe handling of smaller scalpel blades
Standard Scissors 1 For shaving furs and hairs around wounds prior to treatment and general purpose work
Universal Ear tag applicator 1 For applying ear tags to livestock ears
Green Trunk metal 1 Box for all tools and materials
21 This GA had 2 temporary bulls that had been brought by one sympathetic farmer over the dry season. They were removed to a distant farm shortly after the
baseline data collection. This therefore was another case where the ratio was infinity. 22
Two of the bulls were used as dual purpose animals. They were used for draft animal power besides being bulls. If they have to be excluded the baseline
ratio would be 1:109. 23
No bulls in the GA at all. Any bulls only come in search of cows on heat from neighbouring villages.
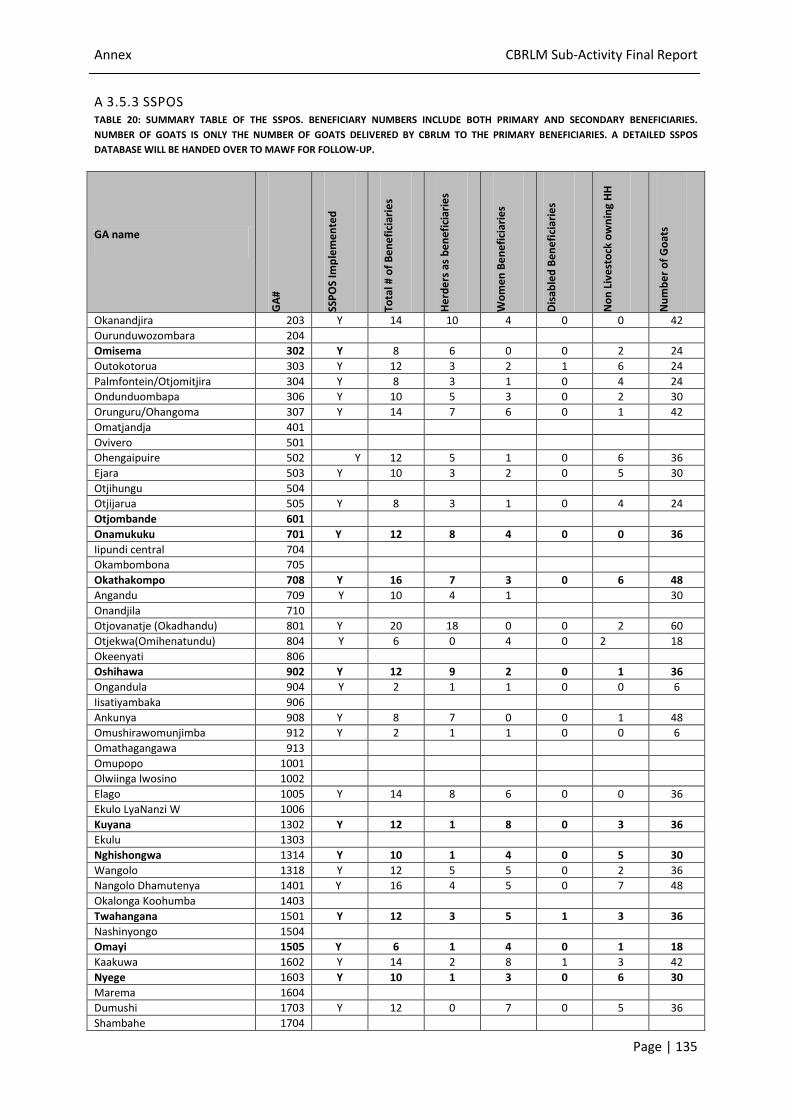
Annex CBRLM Sub-Activity Final Report
Page | 135
A 3.5.3 SSPOS TABLE 20: SUMMARY TABLE OF THE SSPOS. BENEFICIARY NUMBERS INCLUDE BOTH PRIMARY AND SECONDARY BENEFICIARIES.
NUMBER OF GOATS IS ONLY THE NUMBER OF GOATS DELIVERED BY CBRLM TO THE PRIMARY BENEFICIARIES. A DETAILED SSPOS
DATABASE WILL BE HANDED OVER TO MAWF FOR FOLLOW-UP.
GA name
GA
#
SSP
OS
Imp
lem
en
ted
Tota
l # o
f B
en
efi
ciar
ies
He
rde
rs a
s b
en
efi
ciar
ies
Wo
me
n B
en
efi
ciar
ies
Dis
able
d B
en
efi
ciar
ies
No
n L
ive
sto
ck o
wn
ing
HH
Nu
mb
er
of
Go
ats
Okanandjira 203 Y 14 10 4 0 0 42
Ourunduwozombara 204
Omisema 302 Y 8 6 0 0 2 24
Outokotorua 303 Y 12 3 2 1 6 24
Palmfontein/Otjomitjira 304 Y 8 3 1 0 4 24
Ondunduombapa 306 Y 10 5 3 0 2 30
Orunguru/Ohangoma 307 Y 14 7 6 0 1 42
Omatjandja 401
Ovivero 501
Ohengaipuire 502 Y 12 5 1 0 6 36
Ejara 503 Y 10 3 2 0 5 30
Otjihungu 504
Otjijarua 505 Y 8 3 1 0 4 24
Otjombande 601
Onamukuku 701 Y 12 8 4 0 0 36
Iipundi central 704
Okambombona 705
Okathakompo 708 Y 16 7 3 0 6 48
Angandu 709 Y 10 4 1 30
Onandjila 710
Otjovanatje (Okadhandu) 801 Y 20 18 0 0 2 60
Otjekwa(Omihenatundu) 804 Y 6 0 4 0 2 18
Okeenyati 806
Oshihawa 902 Y 12 9 2 0 1 36
Ongandula 904 Y 2 1 1 0 0 6
Iisatiyambaka 906
Ankunya 908 Y 8 7 0 0 1 48
Omushirawomunjimba 912 Y 2 1 1 0 0 6
Omathagangawa 913
Omupopo 1001
Olwiinga lwosino 1002
Elago 1005 Y 14 8 6 0 0 36
Ekulo LyaNanzi W 1006
Kuyana 1302 Y 12 1 8 0 3 36
Ekulu 1303
Nghishongwa 1314 Y 10 1 4 0 5 30
Wangolo 1318 Y 12 5 5 0 2 36
Nangolo Dhamutenya 1401 Y 16 4 5 0 7 48
Okalonga Koohumba 1403
Twahangana 1501 Y 12 3 5 1 3 36
Nashinyongo 1504
Omayi 1505 Y 6 1 4 0 1 18
Kaakuwa 1602 Y 14 2 8 1 3 42
Nyege 1603 Y 10 1 3 0 6 30
Marema 1604
Dumushi 1703 Y 12 0 7 0 5 36
Shambahe 1704
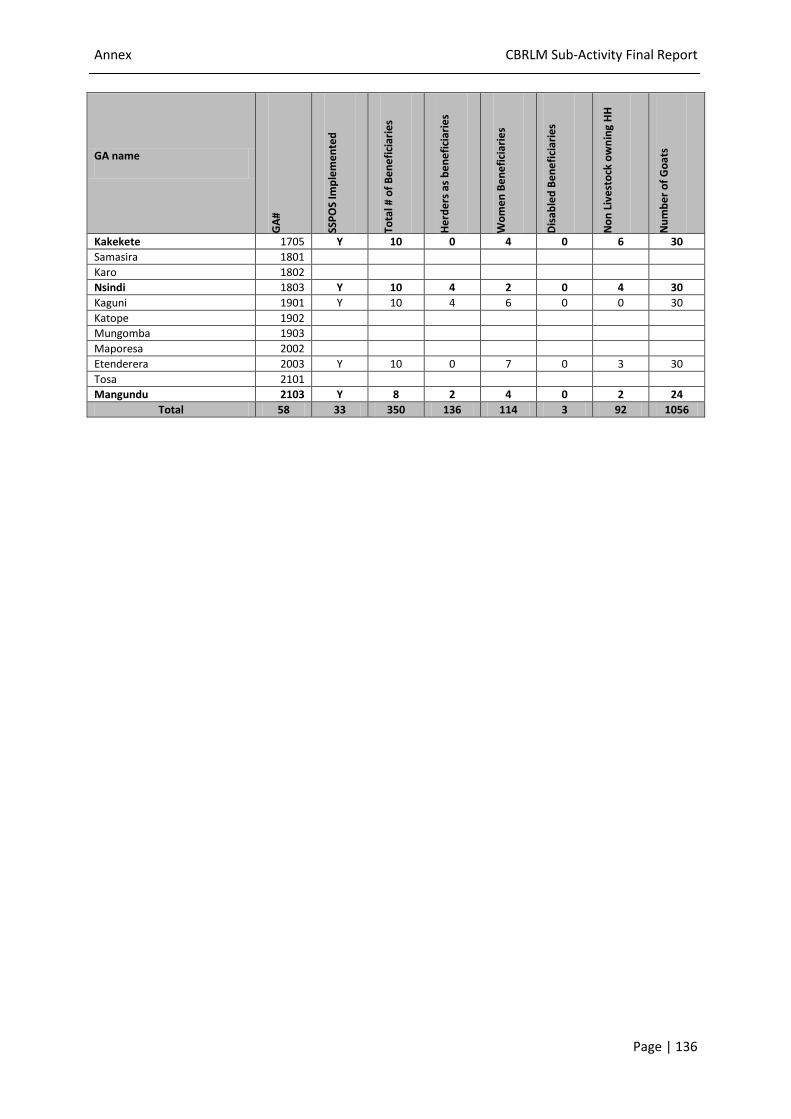
Annex CBRLM Sub-Activity Final Report
Page | 136
GA name
GA
#
SSP
OS
Imp
lem
en
ted
Tota
l # o
f B
en
efi
ciar
ies
He
rde
rs a
s b
en
efi
ciar
ies
Wo
me
n B
en
efi
ciar
ies
Dis
able
d B
en
efi
ciar
ies
No
n L
ive
sto
ck o
wn
ing
HH
Nu
mb
er
of
Go
ats
Kakekete 1705 Y 10 0 4 0 6 30
Samasira 1801
Karo 1802
Nsindi 1803 Y 10 4 2 0 4 30
Kaguni 1901 Y 10 4 6 0 0 30
Katope 1902
Mungomba 1903
Maporesa 2002
Etenderera 2003 Y 10 0 7 0 3 30
Tosa 2101
Mangundu 2103 Y 8 2 4 0 2 24
Total 58 33 350 136 114 3 92 1056
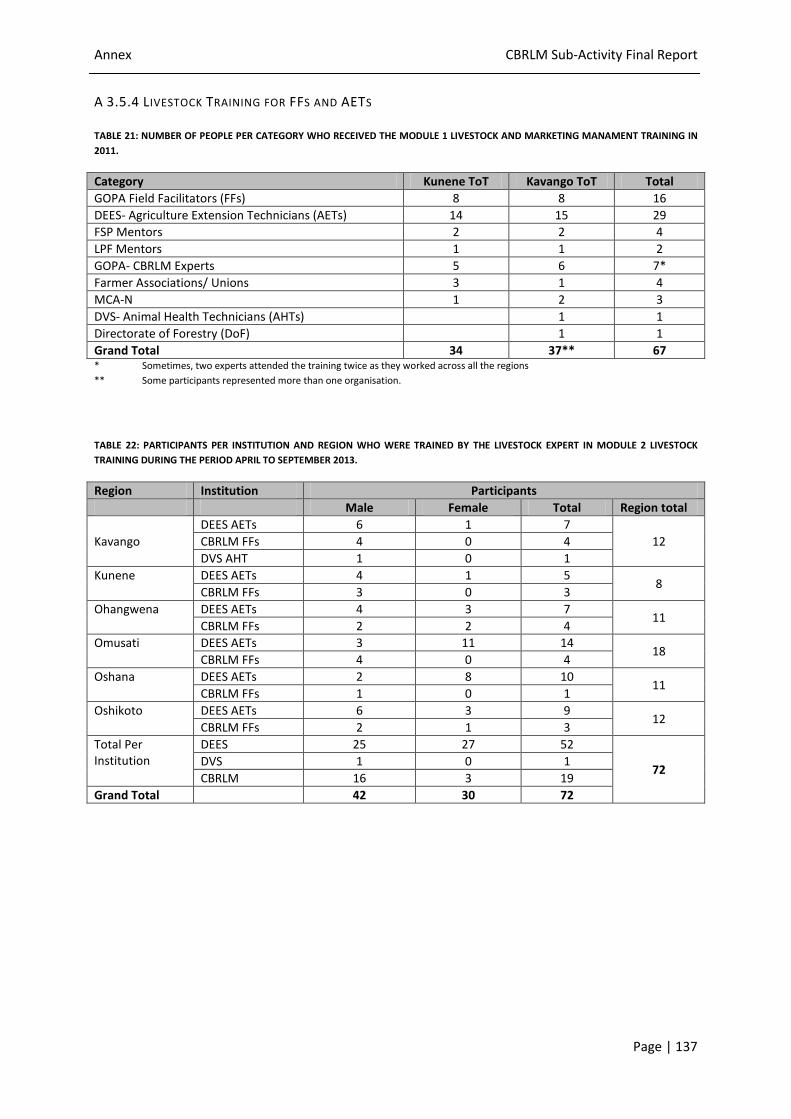
Annex CBRLM Sub-Activity Final Report
Page | 137
A 3.5.4 LIVESTOCK TRAINING FOR FFS AND AETS
TABLE 21: NUMBER OF PEOPLE PER CATEGORY WHO RECEIVED THE MODULE 1 LIVESTOCK AND MARKETING MANAMENT TRAINING IN
2011.
Category Kunene ToT Kavango ToT Total
GOPA Field Facilitators (FFs) 8 8 16
DEES- Agriculture Extension Technicians (AETs) 14 15 29
FSP Mentors 2 2 4
LPF Mentors 1 1 2
GOPA- CBRLM Experts 5 6 7*
Farmer Associations/ Unions 3 1 4
MCA-N 1 2 3
DVS- Animal Health Technicians (AHTs) 1 1
Directorate of Forestry (DoF) 1 1
Grand Total 34 37** 67 * Sometimes, two experts attended the training twice as they worked across all the regions
** Some participants represented more than one organisation.
TABLE 22: PARTICIPANTS PER INSTITUTION AND REGION WHO WERE TRAINED BY THE LIVESTOCK EXPERT IN MODULE 2 LIVESTOCK
TRAINING DURING THE PERIOD APRIL TO SEPTEMBER 2013.
Region Institution Participants
Male Female Total Region total
Kavango
DEES AETs 6 1 7
12 CBRLM FFs 4 0 4
DVS AHT 1 0 1
Kunene DEES AETs 4 1 5 8
CBRLM FFs 3 0 3
Ohangwena DEES AETs 4 3 7 11
CBRLM FFs 2 2 4
Omusati DEES AETs 3 11 14 18
CBRLM FFs 4 0 4
Oshana DEES AETs 2 8 10 11
CBRLM FFs 1 0 1
Oshikoto DEES AETs 6 3 9 12
CBRLM FFs 2 1 3
Total Per Institution
DEES 25 27 52
72 DVS 1 0 1
CBRLM 16 3 19
Grand Total 42 30 72
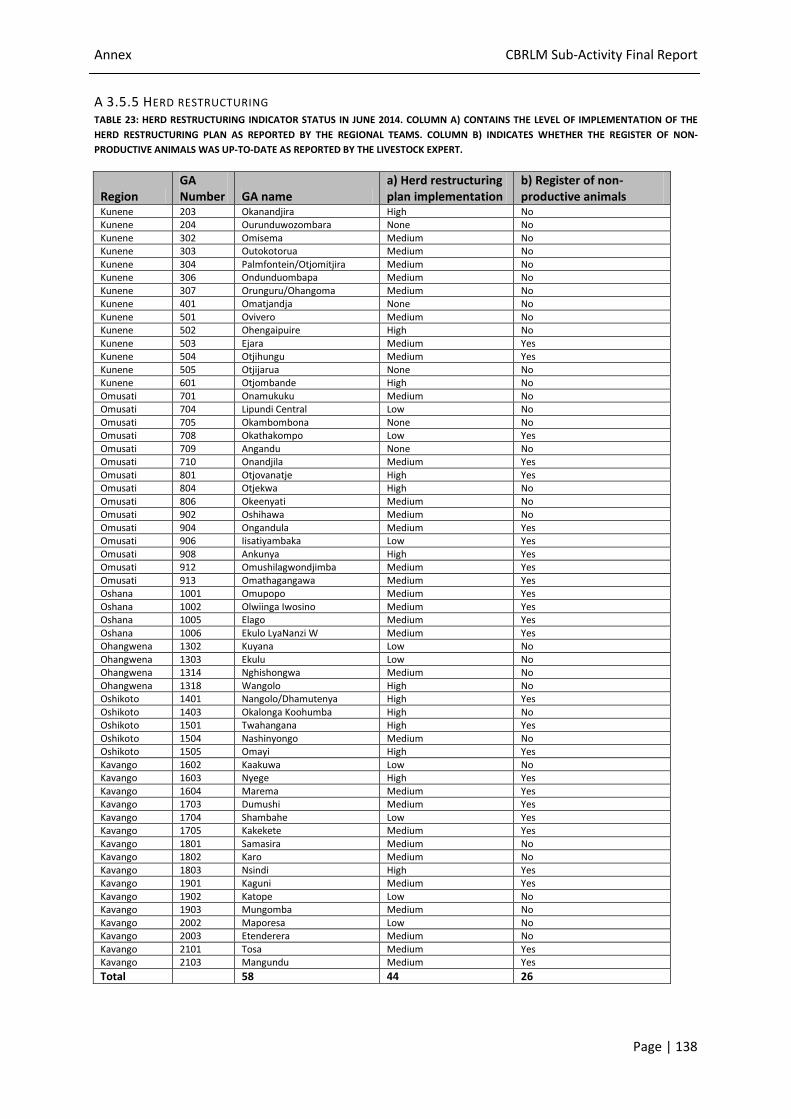
Annex CBRLM Sub-Activity Final Report
Page | 138
A 3.5.5 HERD RESTRUCTURING TABLE 23: HERD RESTRUCTURING INDICATOR STATUS IN JUNE 2014. COLUMN A) CONTAINS THE LEVEL OF IMPLEMENTATION OF THE
HERD RESTRUCTURING PLAN AS REPORTED BY THE REGIONAL TEAMS. COLUMN B) INDICATES WHETHER THE REGISTER OF NON-
PRODUCTIVE ANIMALS WAS UP-TO-DATE AS REPORTED BY THE LIVESTOCK EXPERT.
Region GA Number GA name
a) Herd restructuring plan implementation
b) Register of non-productive animals
Kunene 203 Okanandjira High No Kunene 204 Ourunduwozombara None No Kunene 302 Omisema Medium No Kunene 303 Outokotorua Medium No Kunene 304 Palmfontein/Otjomitjira Medium No Kunene 306 Ondunduombapa Medium No Kunene 307 Orunguru/Ohangoma Medium No Kunene 401 Omatjandja None No Kunene 501 Ovivero Medium No Kunene 502 Ohengaipuire High No Kunene 503 Ejara Medium Yes Kunene 504 Otjihungu Medium Yes Kunene 505 Otjijarua None No Kunene 601 Otjombande High No Omusati 701 Onamukuku Medium No Omusati 704 Lipundi Central Low No Omusati 705 Okambombona None No Omusati 708 Okathakompo Low Yes Omusati 709 Angandu None No Omusati 710 Onandjila Medium Yes Omusati 801 Otjovanatje High Yes Omusati 804 Otjekwa High No Omusati 806 Okeenyati Medium No Omusati 902 Oshihawa Medium No Omusati 904 Ongandula Medium Yes Omusati 906 Iisatiyambaka Low Yes Omusati 908 Ankunya High Yes Omusati 912 Omushilagwondjimba Medium Yes Omusati 913 Omathagangawa Medium Yes Oshana 1001 Omupopo Medium Yes Oshana 1002 Olwiinga Iwosino Medium Yes Oshana 1005 Elago Medium Yes Oshana 1006 Ekulo LyaNanzi W Medium Yes Ohangwena 1302 Kuyana Low No Ohangwena 1303 Ekulu Low No Ohangwena 1314 Nghishongwa Medium No Ohangwena 1318 Wangolo High No Oshikoto 1401 Nangolo/Dhamutenya High Yes Oshikoto 1403 Okalonga Koohumba High No Oshikoto 1501 Twahangana High Yes Oshikoto 1504 Nashinyongo Medium No Oshikoto 1505 Omayi High Yes Kavango 1602 Kaakuwa Low No Kavango 1603 Nyege High Yes Kavango 1604 Marema Medium Yes Kavango 1703 Dumushi Medium Yes Kavango 1704 Shambahe Low Yes Kavango 1705 Kakekete Medium Yes Kavango 1801 Samasira Medium No Kavango 1802 Karo Medium No Kavango 1803 Nsindi High Yes Kavango 1901 Kaguni Medium Yes Kavango 1902 Katope Low No Kavango 1903 Mungomba Medium No Kavango 2002 Maporesa Low No Kavango 2003 Etenderera Medium No Kavango 2101 Tosa Medium Yes Kavango 2103 Mangundu Medium Yes
Total 58 44 26

Annex CBRLM Sub-Activity Final Report
Page | 139
A 4 CBRLM DELIVERABLE TIMETABLE
All contractual project deliverables in the form of reports and other written material are
listed in Table 24.
TABLE 24: CONTRACTUAL DELIVERABLES FOR THE CBRLM IMPLEMENTER.
Deliverable Date Scheduled Date Delivered Deviation Summary
Draft inception report 09/04/10 16/04/10 + 1 week To schedule
QPR – 1 31/05/10 31/05/10 nil To schedule
RIA Eligibility report 01/06/10 14/07/10 + 1.5 months Rescheduled
Gender integration plan 30/06/10 30/06/10 nil To schedule
Final inception report 01/07/10 01/07/10 nil To schedule
QPR – 2 31/08/10 31/08/10 nil To schedule
Draft Training materials 30/09/10 31/10/10 + 1 month As per reschedule agreement
Data collection plan 30/09/10 30/09/10 nil To schedule
Environmental screening tool 30/09/10 30/09/10 nil To schedule
QPR – 3 30/11/10 03/12/10 nil To schedule
QPR – 4 28/02/11 02/03/11 nil To schedule
Implementation guidelines 30/11/10 31/05/11 + 6 months Over schedule
Household level inventory - Initial
Output Report 31/07/11 15/08/11 + 2 weeks As per reschedule agreement
QPR – 5 31/05/11 31/05/11 nil To schedule
QPR – 6 31/08/11 07/09/11 + 1 week To schedule
Water/livestock infrastructure
needs report – Initial infrastructure
report
30/09/11 15/11/11 + 6 weeks As per reschedule agreement
QPR – 7 30/11/11 06/11/11 + I week To schedule
QPR – 8 29/02/12 20/03/12 + 3 weeks Over schedule
QPR – 9 31/05/12 04/07/12 + 4 weeks Over schedule
QPR – 10 31/08/12 10/09/12 + I week To schedule
Household level inventory - Final
Inventory Report for Demo GAs
30/09/12 29/10/12 + 1 month Over schedule
QPR – 11 30/11/12 18/12/12 + 2 weeks To schedule
QPR – 12 28/02/13 14/03/13 + 2 weeks To schedule
QPR – 13 31/05/13 24/05/13 + 3 weeks Over schedule
QPR – 14 31/08/13 16/09/13 + 2 weeks To schedule
QPR – 15 30/11/13 17/12/13 + 2 weeks To schedule
QPR - 16 28/02/14 12/03/14 + 2 weeks To schedule
Household level livestock inventory
report for all focal GAs 28/02/14 15/03/14 + 2 weeks
To schedule (as per contract
amendment 5)
Water/livestock infrastructure
needs final report 15/03/14 15/05/14 + 6 weeks As per contract amendment 8
Final Report on Marketing and
Cooperatives 31/03/14 25/05/14 + 6 weeks As per contract amendment 5
QPR -17 31/05/14 12/06/14 + 2 weeks To schedule
CBRLM Final Report 31/07/14 31/07/14 nil To schedule
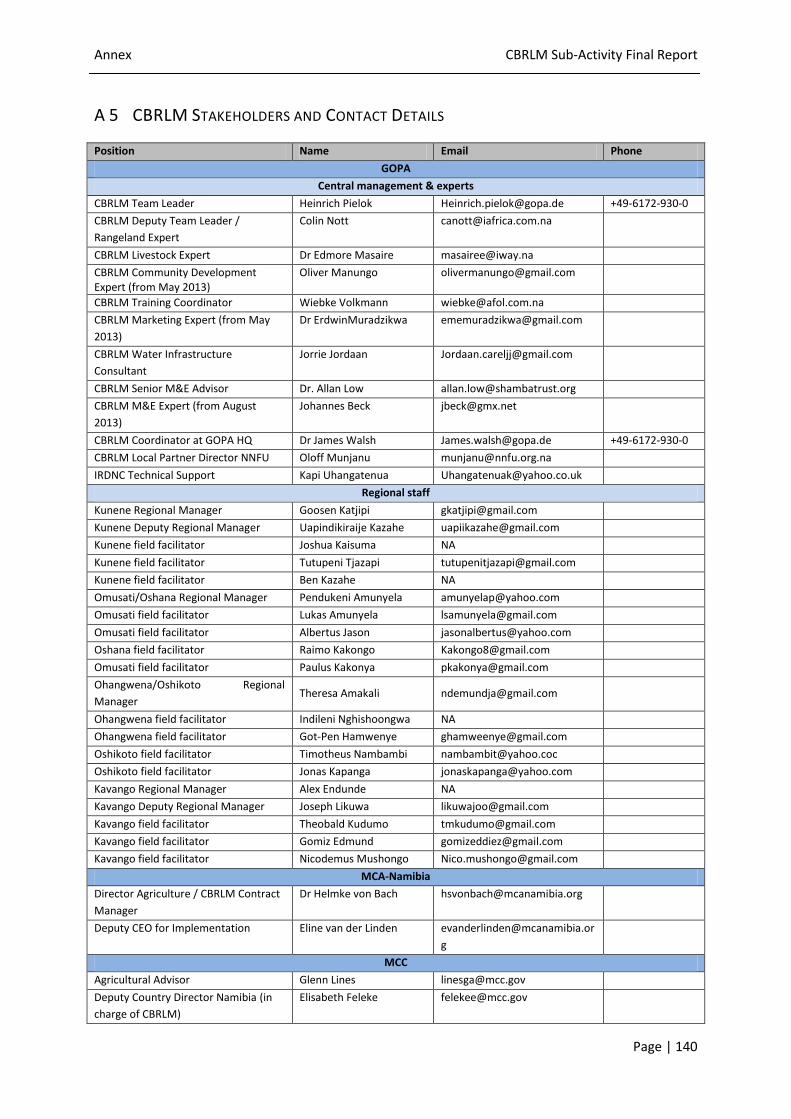
Annex CBRLM Sub-Activity Final Report
Page | 140
A 5 CBRLM STAKEHOLDERS AND CONTACT DETAILS
Position Name Email Phone
GOPA
Central management & experts
CBRLM Team Leader Heinrich Pielok [email protected] +49-6172-930-0
CBRLM Deputy Team Leader /
Rangeland Expert
Colin Nott [email protected]
CBRLM Livestock Expert Dr Edmore Masaire [email protected]
CBRLM Community Development Expert (from May 2013)
Oliver Manungo [email protected]
CBRLM Training Coordinator Wiebke Volkmann [email protected]
CBRLM Marketing Expert (from May
2013)
Dr ErdwinMuradzikwa [email protected]
CBRLM Water Infrastructure
Consultant
Jorrie Jordaan [email protected]
CBRLM Senior M&E Advisor Dr. Allan Low [email protected]
CBRLM M&E Expert (from August
2013)
Johannes Beck [email protected]
CBRLM Coordinator at GOPA HQ Dr James Walsh [email protected] +49-6172-930-0
CBRLM Local Partner Director NNFU Oloff Munjanu [email protected]
IRDNC Technical Support Kapi Uhangatenua [email protected]
Regional staff
Kunene Regional Manager Goosen Katjipi [email protected]
Kunene Deputy Regional Manager Uapindikiraije Kazahe [email protected]
Kunene field facilitator Joshua Kaisuma NA
Kunene field facilitator Tutupeni Tjazapi [email protected]
Kunene field facilitator Ben Kazahe NA
Omusati/Oshana Regional Manager Pendukeni Amunyela [email protected]
Omusati field facilitator Lukas Amunyela [email protected]
Omusati field facilitator Albertus Jason [email protected]
Oshana field facilitator Raimo Kakongo [email protected]
Omusati field facilitator Paulus Kakonya [email protected]
Ohangwena/Oshikoto Regional
Manager Theresa Amakali [email protected]
Ohangwena field facilitator Indileni Nghishoongwa NA
Ohangwena field facilitator Got-Pen Hamwenye [email protected]
Oshikoto field facilitator Timotheus Nambambi [email protected]
Oshikoto field facilitator Jonas Kapanga [email protected]
Kavango Regional Manager Alex Endunde NA
Kavango Deputy Regional Manager Joseph Likuwa [email protected]
Kavango field facilitator Theobald Kudumo [email protected]
Kavango field facilitator Gomiz Edmund [email protected]
Kavango field facilitator Nicodemus Mushongo [email protected]
MCA-Namibia
Director Agriculture / CBRLM Contract
Manager
Dr Helmke von Bach [email protected]
Deputy CEO for Implementation Eline van der Linden [email protected]
g
MCC
Agricultural Advisor Glenn Lines [email protected]
Deputy Country Director Namibia (in
charge of CBRLM)
Elisabeth Feleke [email protected]
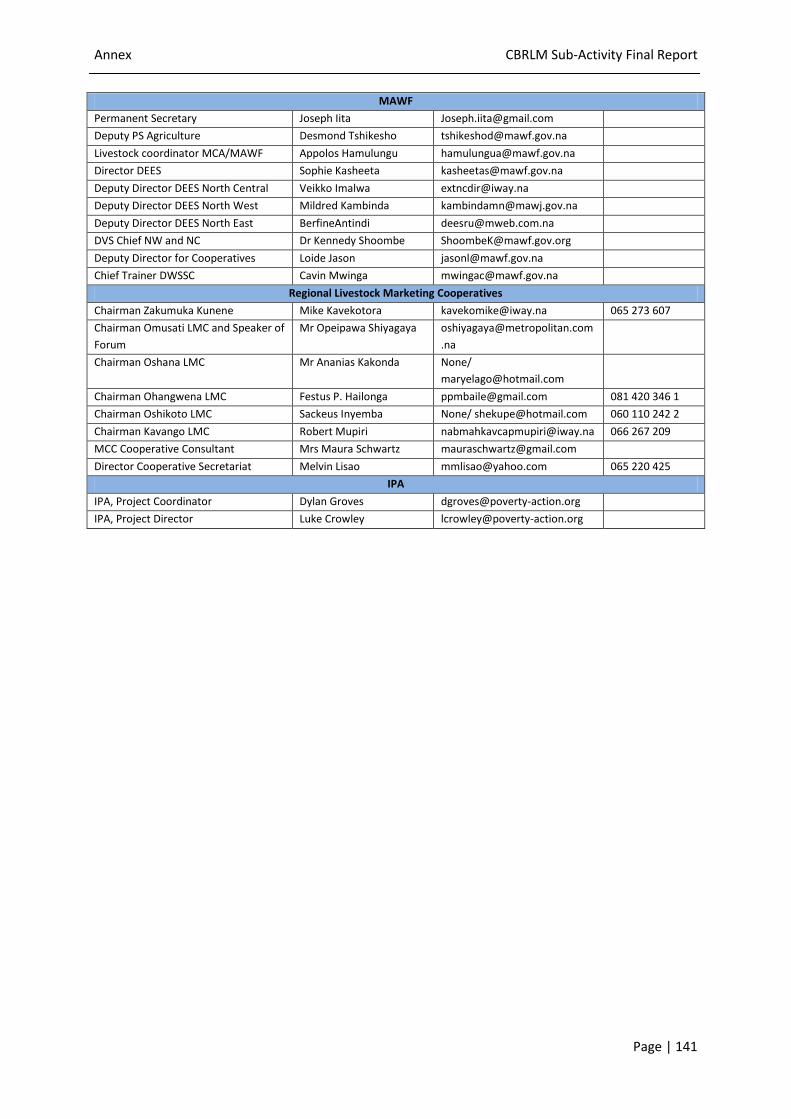
Annex CBRLM Sub-Activity Final Report
Page | 141
MAWF
Permanent Secretary Joseph Iita [email protected]
Deputy PS Agriculture Desmond Tshikesho [email protected]
Livestock coordinator MCA/MAWF Appolos Hamulungu [email protected]
Director DEES Sophie Kasheeta [email protected]
Deputy Director DEES North Central Veikko Imalwa [email protected]
Deputy Director DEES North West Mildred Kambinda [email protected]
Deputy Director DEES North East BerfineAntindi [email protected]
DVS Chief NW and NC Dr Kennedy Shoombe [email protected]
Deputy Director for Cooperatives Loide Jason [email protected]
Chief Trainer DWSSC Cavin Mwinga [email protected]
Regional Livestock Marketing Cooperatives
Chairman Zakumuka Kunene Mike Kavekotora [email protected] 065 273 607
Chairman Omusati LMC and Speaker of
Forum
Mr Opeipawa Shiyagaya [email protected]
.na
Chairman Oshana LMC Mr Ananias Kakonda None/
Chairman Ohangwena LMC Festus P. Hailonga [email protected] 081 420 346 1
Chairman Oshikoto LMC Sackeus Inyemba None/ [email protected] 060 110 242 2
Chairman Kavango LMC Robert Mupiri [email protected] 066 267 209
MCC Cooperative Consultant Mrs Maura Schwartz [email protected]
Director Cooperative Secretariat Melvin Lisao [email protected] 065 220 425
IPA
IPA, Project Coordinator Dylan Groves [email protected]
IPA, Project Director Luke Crowley [email protected]