Community Bank Leverage Ratio (CBLR): Background and Analysis … · 2019-11-01 · Community Bank...
21
Community Bank Leverage Ratio (CBLR): Background and Analysis of Bank Data November 1, 2019 Congressional Research Service https://crsreports.congress.gov R45989
Transcript of Community Bank Leverage Ratio (CBLR): Background and Analysis … · 2019-11-01 · Community Bank...
Community Bank Leverage Ratio (CBLR):
Background and Analysis of Bank Data
November 1, 2019
Congressional Research Service
https://crsreports.congress.gov
R45989
Congressional Research Service
SUMMARY
Community Bank Leverage Ratio (CBLR): Background and Analysis of Bank Data Capital allows banks to withstand losses (to a point) without failing, and regulators require banks
to hold certain minimum amounts. These requirements are generally expressed as ratios between
balance sheet items, and banks (particularly small banks) indicate that reporting those ratios can
be difficult. Capital ratios fall into one of two main types—simpler leverage ratios and more
complex risk-weighted ratios. A leverage ratio treats all assets the same, whereas a risk-weighted
ratio assigns assets a risk weight to account for the likelihood of losses.
In response to concerns that small banks faced unnecessarily burdensome capital requirements, Congress mandated further
tailoring of capital rules in Section 201 of the Economic Growth, Regulatory Relief, and Consumer Protection Act of 2018
(P.L. 115-174) and created the Community Bank Leverage Ratio (CBLR). Under the provision, a bank with less than $10
billion in assets that meets certain risk-profile criteria will have the option to meet a CBLR requirement instead of the
existing, more complex risk-weighted requirements. Because most small banks currently hold enough capital to meet the
CBLR option, Section 201 will allow many small banks to opt out of requirements to meet and report more complex ratios.
Section 201 grants the federal bank regulatory agencies—the Federal Reserve (the Fed), the Office of the Comptroller of the
Currency (OCC), and the Federal Deposit Insurance Corporation (FDIC)—discretion over certain aspects of CBLR
implementation, including setting the exact ratio; the provision mandated a range between 8% and 10%. In November 2018,
the regulators proposed 9%, arguing this threshold supports safety and stability while providing regulatory relief to small
banks. Bank proponents criticized this decision and advocated an 8% threshold, arguing that 9% is too high and withholds the
exemption’s benefits from banks with appropriately small risks. Despite the criticism, the bank regulators announced in a
joint press release on October 29, 2019, they had finalized the rule with a 9% threshold.
Questions related to how much riskier bank portfolios will be if they are only subject to a leverage ratio (rather than a
combination of leverage and risk-based ratios) and how high the threshold must be to mitigate those risks are matters of
debate. Riskier assets generally offer greater rates of return to compensate investors for bearing more risk. Without risk
weighting, banks would have an incentive to hold riskier assets to earn higher returns. In addition, a leverage ratio alone may
not fully reflect a bank’s riskiness because a bank with a high concentration of very risky assets could have a similar ratio to
a bank with a high concentration of very safe assets. Risk-based ratios can address these problems, however, they can create
misallocations across asset classes and involve complexity related to compliance.
Of the 5,352 FDIC-insured depository institutions in the United States at the end of the second quarter of 2019, the
Congressional Research Service (CRS) estimates that 5,078 (about 95%) would meet the size and risk-profile criteria
necessary to qualify for the CBLR option. Under the regulator-set risk-profile criteria, nonqualifying banks are on average
larger, have larger off-balance-sheet exposures, and have risk-based capital ratios that are about a quarter lower than
qualifying banks.
Of the 5,078 banks that qualify based on size and risk criteria, CRS estimates 4,440 (or 83% of all U.S. banks) would exceed
a 9% threshold and would be eligible to enter the CBLR regime without having to hold additional capital. If the threshold
were set at 8%, an additional 515 banks (9.6%) would exceed the lower threshold. Thus, the difference between 8% or 9%
would, depending on perspective, provide appropriate regulatory relief to or remove important safeguards from almost 10%
of the nation’s banks, which collectively hold about 2% of total U.S. banking industry assets. Banks that would be CBLR
compliant at a 9% threshold are similar in size, activities, and off-balance-sheet exposures to 8% threshold banks. However,
the latter group’s risk-based ratios are about half the level of the former’s.
R45989
November 1, 2019
David W. Perkins Analyst in Macroeconomic Policy
Community Bank Leverage Ratio: Background and Analysis of Bank Data
Congressional Research Service
Contents
Introduction ..................................................................................................................................... 1
Background on Capital Requirements ............................................................................................. 3
Generally Applicable Requirements (Without CBLR Option).................................................. 3 Leverage Ratio Requirements ............................................................................................. 4 Risk-Weighted Ratio Requirements .................................................................................... 5
Effects of Capital Ratio Requirements ...................................................................................... 5 Leverage Ratio and Risk-Based Ratios: Relative Strengths and Weaknesses ........................... 5
Section 201 of P.L. 115-174 ............................................................................................................ 6
Regulatory Implementation ............................................................................................................. 7
Analysis: Banks, Qualifying Criteria, and CBLR-Compliant Thresholds....................................... 8
Key Findings .................................................................................................................................. 11
Figures
Figure 1. Simplified Calculation of Capital Ratios ......................................................................... 4
Figure 2. Number of Qualifying Banks and Their CBLRs .............................................................. 9
Figure B-1. Proposed Reporting Form .......................................................................................... 15
Tables
Table 1. Balance Sheet Averages: Qualifying Versus Nonqualifying Banks ................................. 10
Table 2. Balance Sheet Averages by Possible CBLR Thresholds ................................................... 11
Table A-1. Number of Qualifying Banks by Headquartered State and Their CBLRs ................... 13
Table B-1. Mnemonics and Calculations ....................................................................................... 17
Appendixes
Appendix A. Qualifying Banks by CBLR and State ..................................................................... 13
Appendix B. Methodology ............................................................................................................ 15
Contacts
Author Information ........................................................................................................................ 17
Community Bank Leverage Ratio: Background and Analysis of Bank Data
Congressional Research Service 1
Introduction Holding capital enables banks to absorb unexpected losses (up to a point) without failing.1 To
improve individual bank safety and soundness and financial system stability, bank regulators have
implemented a number of regulations requiring banks to hold minimum levels of capital. These
minimums, expressed as ratios between various balance sheet items, are called capital ratio
requirements. Although capital ratio requirements can generate the benefits of safety and stability,
they impose certain costs, including potentially reducing credit availability and raising credit
prices.2 Given these characteristics, how capital ratio requirements should be calibrated and
applied is subject to debate.
Capital ratios fall into one of two main types—a leverage ratio or a risk-weighted ratio. A
leverage ratio treats all assets the same, requiring banks to hold the same amount of capital
against the asset regardless of how risky each asset is. A risk-weighted ratio assigns a risk
weight—a number based on the asset’s riskiness that the asset value is multiplied by—to account
for the fact that some assets are more likely to lose value than others. Riskier assets receive a
higher risk weight, which requires banks to hold more capital to meet the ratio requirement, thus
better enabling them to absorb losses.3
One question within the broader debate over bank regulation is what capital ratio requirements
relatively small, safe banks should face. In general, policymakers conceptually agree that small,
safe banks—which have fewer resources to devote to compliance and individually pose less risk
to the financial system—should face a simpler, less costly regulatory regime. Accordingly, bank
regulators have imposed higher thresholds and more complex rules on the largest banks for a
number of years.4 However, some industry observers have argued for further tailoring for smaller
banks.5
In response to concerns that small banks faced unnecessarily burdensome capital requirements,
Congress mandated further tailoring of capital rules in Section 201 of P.L. 115-174, the Economic
Growth, Regulatory Relief, and Consumer Protection Act of 2018 (EGRRCPA). Section 201
created the Community Bank Leverage Ratio (CBLR), a relatively simple ratio to calculate. Under
this provision, a bank with less than $10 billion in assets that meets certain risk-profile criteria set
by bank regulators will have the option to exceed a single CBLR threshold instead of being
required to exceed several existing, more complex minimum ratios. The CBLR is set at a
1 Banks, savings associations, and their parent holding companies (bank-holding companies and thrift-holding
companies, respectively) are all subject to the capital regulation discussed in this report. They will be referred to
collectively as “banks” for brevity and clarity, unless otherwise noted. The statistics presented in “Analysis: Banks,
Qualifying Criteria, and CBLR-Compliant Thresholds” only refer to banks and savings associations, and not their
holding companies, for reasons discussed in footnote 44.
2 Douglas J. Elliott, Higher Bank Capital Requirements Would Come at a Price, Brookings Institution, February 20,
2013, at https://www.brookings.edu/research/higher-bank-capital-requirements-would-come-at-a-price/.
3 FDIC, Risk Management Manual of Examination Policies: Section 2.1 Capital, pp. 2-9, at https://www.fdic.gov/
regulations/safety/manual/section2-1.pdf.
4 The Office of the Comptroller of the Currency (OCC), the Federal Reserve (Fed), and the Federal Deposit Insurance
Corporation (FDIC), “Regulatory Capital Rules: Advanced Approaches Risk-Based Capital Rule; Market Risk Capital
Rule,” 77 Federal Register 52978-52981, August 30, 2012; and OCC, Fed, and FDIC, “Regulatory Capital Rules:
Implementation of Risk-Based Capital Surcharges for Global Systemically Important Bank Holding Companies,” 80
Federal Register 49082-49086, August 14, 2015.
5 U.S. Congress, Senate Committee on Banking, Housing, and Urban Affairs, Bank Capital and Liquidity Regulation
Part II: Industry Perspectives, 114th Cong., 2nd sess., June 23, 2016.
Community Bank Leverage Ratio: Background and Analysis of Bank Data
Congressional Research Service 2
relatively high level compared to the existing minimum ratio requirements. Banks that exceed the
CBLR are to be considered (1) in compliance with all risk-based capital ratios and (2) well
capitalized for other regulatory considerations.6 Because small banks typically hold amounts of
capital well above the required minimums, the CBLR option will allow many small banks to opt
out of requirements to meet and report more complex ratios.
Section 201 grants the federal bank regulatory agencies—the Federal Reserve (the Fed), the
Office of the Comptroller of the Currency (OCC), and the Federal Deposit Insurance Corporation
(FDIC) (hereinafter collectively referred to as “the bank regulators”)—discretion over certain
aspects of CBLR implementation, including setting the exact ratio, as the statute mandates a
range between 8% and 10%.7 In November 2018, the regulators proposed 9%.8 The banking
industry and certain policymakers criticized this decision, arguing that the threshold would be too
high.9 Despite the criticism, the bank regulators issued a joint press release on October 29, 2019,
announcing they had finalized the rule with a 9% threshold.10
Capital Ratio Requirement Definitions
Capital: The difference between the value of a bank’s assets (what it owns) and the value of its liabilities (what it
owes to depositors and creditors) is the bank’s capital—the value of the bank to the shareholders. In practice,
banks raise capital by issuing equity (commonly referred to as stock) or other instruments with equity-like
characteristics, by retaining earnings, or by other methods. A bank’s balance sheet records each type of capital
separately. Which types of capital a bank can use to meet capital ratio requirements differ from requirement to
requirement.
Capital ratio: A measure of how much capital a bank holds relative to its total assets or total exposures to
losses. Generally expressed as percentage ratio between balance sheet values, such as (Capital/Total
Assets)x100%, (Capital/Total Exposures)x100%, or (Capital/Risk-weighted Assets)x100%. For an explanation of
Risk-weight Assets, see “Risk-weighted Ratio” definition below. See Figure 1 for simplified calculation examples.
Capital ratio requirement: A rule implemented by bank regulators mandating that all banks or a set of banks
hold an amount of capital such that a specified capital ratio meets or exceeds a minimum percentage.
Community Bank Leverage Ratio (CBLR): A capital ratio created by Section 201 of the Economic Growth,
Regulatory Relief, and Consumer Protection Act of 2018 (EGRRCPA; P.L. 115-174). It is a ratio of capital to
unweighted assets. If a bank meeting other qualifying characteristics exceeds a threshold CBLR percentage, it is
exempt from generally applicable minimum ratios.
Generally applicable capital requirements: The capital ratio requirements that all banks generally must meet
if they do not have an exemption, such as the exemption created in Section 201 of EGRRCPA.
Leverage ratio: A capital ratio in which the denominator is the sum of all the values of assets or exposures to
losses. No adjustments are made to those values; all are treated equally regardless of the risk of loss on individual
asset classes or exposures.
Risk-weighted ratio: A capital ratio in which the values of assets and exposures are adjusted by being multiplied
by a risk weight before they are summed to make the denominator. Relatively risky assets are assigned higher risk
weights to reflect the greater possibility of losses, and thus banks must hold more capital against risky assets than
safe ones to meet risk-weighted capital ratio requirements. Conversely, relatively low-risk assets are assigned
lower risk-weights, and so require the bank to hold less capital relative to risky assets.
6 P.L. 115-174, title II, §201(a)-(c).
7 P.L. 115-174, title II, §201(b)(1).
8 The Federal Reserve, “Agencies propose community bank leverage ratio for qualifying community banking
organizations,” press release, November 21, 2018, at https://www.federalreserve.gov/newsevents/pressreleases/
bcreg20181121c.htm.
9 Independent Community Bankers of America, “ICBA Statement on Community Bank Leverage Ratio,” press release,
November 20, 2018, at https://www.icba.org/news/news-details/2018/11/20/icba-statement-on-community-bank-
leverage-ratio.
10 Fed, OCC, and FDIC, “Federal Bank Regulatory Agencies Issue Final Rule to Simplify Capital Calculation for
Community Banks,” press release, October 29, 2019, at https://www.fdic.gov/news/news/press/2019/pr19100.html.
Community Bank Leverage Ratio: Background and Analysis of Bank Data
Congressional Research Service 3
This report examines capital ratios generally, as well as the capital ratio regime that was in place
before EGRRCPA’s enactment and will continue to be in place for banks that do not qualify for
or do not elect to exercise the CBLR option. It then describes Section 201 of EGRRCPA, the
regulation implemented pursuant to that provision, and the ensuing debate surrounding this
implementation. Lastly, this report presents estimates on the number and characteristics of
qualifying small banks under the rule, and estimates of those banks’ current CBLRs. This
provides context on the number of banks potentially affected by CBLR implementation.
Background on Capital Requirements A bank’s balance sheet is divided into assets, liabilities, and capital. Assets are largely the value
of loans owed to the bank and securities owned by the bank. To make loans and buy securities, a
bank secures funding by either incurring liabilities or raising capital. A bank’s liabilities are
largely the value of deposits and debt the bank owes depositors and creditors. Banks raise capital
through various methods, including issuing equity to shareholders or issuing special types of
bonds that can be converted into equity. Importantly, many types of capital—unlike liabilities—
may not contractually require the bank to make payouts of specified amounts.11
Banks make profits in part because many of their assets are generally riskier, longer-term, and
more illiquid than their liabilities, which allows them to earn more interest on their assets than
they pay on their liabilities. The practice is usually profitable, but it exposes banks to risks that
can lead to failure. When defaults on a bank’s assets increase, the money coming into the bank
decreases. However, the bank generally remains obligated to make payouts on its liabilities.
Capital, though, enables the bank to absorb losses. When money coming in decreases, the bank’s
payouts on capital can be reduced, delayed, or cancelled. Thus, capital allows banks to continue
to meet their rigid liability obligations and avoid failure even after experiencing unanticipated
losses on assets.12 For this reason, regulators require banks to hold a minimum level of capital,
expressed as ratios between items on bank balance sheets.
Generally Applicable Requirements (Without CBLR Option)
Banks have been subject to capital ratio requirements for decades. U.S. bank regulators first
established explicit numerical ratio requirements in 1981. In 1988, they adopted the Basel Capital
Accords proposed by the Basel Committee on Banking Supervision (BCBS)—an international
group of bank regulators that sets international standards—which were the precursor to the ratio
requirement regime used in the United States today.13 Those requirements—now known as “Basel
I”—were revised in 2004, establishing the “Basel II” requirements that were in effect at the onset
of the financial crisis in 2008. In 2010, the BCBS agreed to more stringent “Basel III”
standards.14 Pursuant to this accord, U.S. regulators finalized new capital requirements in 2013.15
11 FDIC, Risk Management Manual of Examination Policies: Section 2.1 Capital, pp. 2-3, at https://www.fdic.gov/
regulations/safety/manual/section2-1.pdf.
12 FDIC, Risk Management Manual of Examination Policies, pp. 2-3.
13 Susan Burhouse et al., Basel and the Evolution of Capital Regulation: Moving Forward, Looking Back, Federal
Deposit Insurance Corporation, January 14, 2003, at https://www.fdic.gov/bank/analytical/fyi/2003/011403fyi.html.
14 Bank for International Settlements, Basel Committee on Banking and Supervision, “Results of the December 2010
meeting of the Basel Committee on Banking Supervision,” press release, December 1, 2010, at http://www.bis.org/
press/p101201a.htm.
15 The Office of the Comptroller of the Currency and The Board of Governors of the Federal Reserve System,
“Regulatory Capital Rules: Regulatory Capital, Implementation of Basel III, Capital Adequacy, Transition Provisions,
Community Bank Leverage Ratio: Background and Analysis of Bank Data
Congressional Research Service 4
Banks are required to satisfy several different capital ratio requirements. A detailed examination
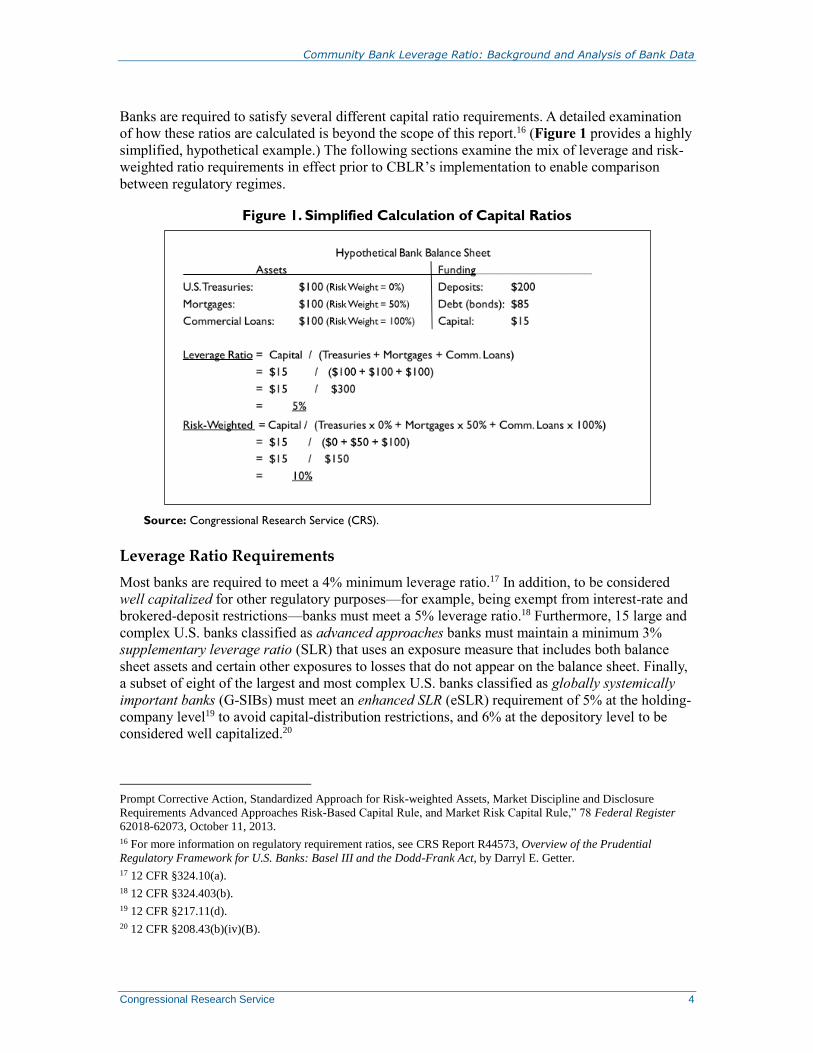
of how these ratios are calculated is beyond the scope of this report.16 (Figure 1 provides a highly
simplified, hypothetical example.) The following sections examine the mix of leverage and risk-
weighted ratio requirements in effect prior to CBLR’s implementation to enable comparison
between regulatory regimes.
Figure 1. Simplified Calculation of Capital Ratios
Source: Congressional Research Service (CRS).
Leverage Ratio Requirements
Most banks are required to meet a 4% minimum leverage ratio.17 In addition, to be considered
well capitalized for other regulatory purposes—for example, being exempt from interest-rate and
brokered-deposit restrictions—banks must meet a 5% leverage ratio.18 Furthermore, 15 large and
complex U.S. banks classified as advanced approaches banks must maintain a minimum 3%
supplementary leverage ratio (SLR) that uses an exposure measure that includes both balance
sheet assets and certain other exposures to losses that do not appear on the balance sheet. Finally,
a subset of eight of the largest and most complex U.S. banks classified as globally systemically
important banks (G-SIBs) must meet an enhanced SLR (eSLR) requirement of 5% at the holding-
company level19 to avoid capital-distribution restrictions, and 6% at the depository level to be
considered well capitalized.20
Prompt Corrective Action, Standardized Approach for Risk-weighted Assets, Market Discipline and Disclosure
Requirements Advanced Approaches Risk-Based Capital Rule, and Market Risk Capital Rule,” 78 Federal Register
62018-62073, October 11, 2013.
16 For more information on regulatory requirement ratios, see CRS Report R44573, Overview of the Prudential
Regulatory Framework for U.S. Banks: Basel III and the Dodd-Frank Act, by Darryl E. Getter.
17 12 CFR §324.10(a).
18 12 CFR §324.403(b).
19 12 CFR §217.11(d).
20 12 CFR §208.43(b)(iv)(B).
Community Bank Leverage Ratio: Background and Analysis of Bank Data
Congressional Research Service 5
Risk-Weighted Ratio Requirements
The required risk-weighted ratios depend on bank size and capital quality (some types of capital
are considered less effective at absorbing losses than other types, and thus considered lower
quality). Most banks are required to meet a 4.5% risk-weighted ratio for the highest-quality
capital and ratios of 6% and 8% for lower-quality capital types.21 To be considered well
capitalized for purposes of interest-rate and brokered-deposit restriction exemptions (among other
regulatory considerations), a bank’s ratios must be 2% above the minimums (i.e., 6.5%, 8%, and
10%, respectively).22 In addition, banks must have an additional 2.5% of high-quality capital on
top of the minimum levels (7%, 8.5%, and 10.5%, respectively) as part of a capital conservation
buffer in order to avoid restrictions on capital distributions, such as dividend payments.23
Advanced approaches banks are subject to a 0%-2.5% countercyclical buffer that the Fed can
deploy if credit conditions warrant increasing capital (the buffer is currently 0% and has been so
since its implementation).24 Finally, the G-SIBs are subject to an additional capital surcharge of
between 1% and 4.5% based on the institution’s systemic importance.25
Effects of Capital Ratio Requirements
Whether the generally applicable capital requirements’ (i.e., the requirements facing all banks
prior to the implementation of the CBLR) potential benefits—such as increased bank safety and
financial system stability—are appropriately balanced against the potential costs of reduced credit
availability is a debated issue.26 Capital is typically a more expensive source of funding for banks
than liabilities. In addition, calculating and reporting the ratios requires banks to devote
resources—such as employee time and purchases of specialized software—to regulatory
compliance. Thus, requiring banks to hold higher levels of capital and meet certain ratios imposes
costs. This could lead banks to reduce the amount of credit available or raise credit prices.27
Leverage Ratio and Risk-Based Ratios: Relative Strengths and
Weaknesses
Leverage ratios and risk-based ratios each have potential strengths and weaknesses. Because the
CBLR exempts certain banks from risk-weighted ratio requirements and allows them to use a
single leverage ratio, bank regulators will likely consider those relative strengths and weaknesses
in determining which banks should have the CBLR option.
Riskier assets generally offer greater rates of return to compensate investors for bearing more
risk. Thus, without risk weighting banks have an incentive to hold riskier assets because the same
amount of capital must be held against risky and safe assets. In addition, a leverage ratio alone
may not fully reflect a bank’s riskiness because a bank with a high concentration of very risky
21 12 CFR §324.10(a).
22 12 CFR §324.403(b).
23 12 CFR §217.11(a).
24 12 CFR §217.11(b).
25 12 CFR §217.11(c).
26 Basel Committee On Banking Supervision, An Assessment of The Long-Term Impact of Stronger Capital And
Liquidity Requirements, August 2010, pp. 1-8, at http://www.bis.org/publ/bcbs173.pdf.
27 Douglas J. Elliott, Higher Bank Capital Requirements Would Come at a Price, Brookings Institution, February 20,
2013, at https://www.brookings.edu/research/higher-bank-capital-requirements-would-come-at-a-price/.
Community Bank Leverage Ratio: Background and Analysis of Bank Data
Congressional Research Service 6
assets could have a similar ratio to a bank with a high concentration of very safe assets.28 Risk
weighting can address these issues, because the bank is required to hold more capital against risky
assets than against safe ones (and no capital against the safest assets, such as cash and U.S.
Treasuries).
However, risk weighting presents its own challenges. Risk weights assigned to particular asset
classes could inaccurately estimate some assets’ true risks, especially because they cannot be
adjusted as quickly as asset risk might change. Banks may have an incentive to overly invest in
assets with risk weights that are set too low (because they would receive a riskier asset’s high
potential rate of return, but have to hold only enough capital to protect against a safer asset’s
losses), or inversely to underinvest in assets with risks weights that are set too high. Some
observers believe that the risk weights in place prior to the 2007-2009 financial crisis were poorly
calibrated and “encouraged financial firms to crowd into” risky assets, exacerbating the
downturn.29 For example, banks held highly rated mortgage-backed securities (MBSs) before the
crisis, in part because those assets offered a higher rate of return than other assets with the same
risk weight. MBSs then suffered unexpectedly large losses during the crisis.
Another criticism is that the risk-weighted system involves needless complexity and is an
example of regulator micromanagement. The complexity could benefit the largest banks, which
have the resources to absorb the added regulatory cost, compared with small banks that could find
compliance costs more burdensome.30 Thus, critics argue, small banks should be subject to a
simpler system to avoid giving large banks a competitive advantage.
Section 201 of P.L. 115-174 In response to concerns about the generally applicable capital ratio requirements’ effects on small
banks, Congress mandated in Section 201 of EGRRCPA that certain qualifying banks that exceed
a non-risk-weighted Community Bank Leverage Ratio (CBLR) be considered in compliance with
all risked-weighted capital ratios and well capitalized for other regulatory purposes.31 The
provision defined qualifying banks as those with less than $10 billion in assets, but also
authorized the federal bank regulators to disqualify banks based on “risk profile, which shall be
based on consideration of—(i) off-balance sheet exposures; (ii) trading assets and liabilities; (iii)
total notional derivatives exposures; and (iv) such other factors as the appropriate Federal
banking agencies determine appropriate.”32 This report refers to banks that meet these criteria as
CBLR-qualifying banks. Section 201 also directed federal bank regulators to set a threshold ratio
of capital to unweighted assets at between 8% and 10% (as discussed in the “Generally
Applicable Requirements (Without CBLR Option)” section, the current minimum leverage ratio
is 4% and the threshold to be considered well capitalized is 5%). This report refers to qualifying
banks that would exceed the threshold as CBLR-compliant banks.
28 See then-Federal Reserve Chair Yellen’s comments during U.S. Congress, House Committee on Financial Services,
Monetary Policy and the State of the Economy, 114th Cong., 2nd sess., June 22, 2016, at http://www.cq.com/doc/
congressionaltranscripts-4915133?2.
29 House Committee on Financial Services, The Financial CHOICE Act: Creating Hope and Opportunity for Investors,
Consumers, and Entrepreneurs, A Republican Proposal To Reform The Financial Regulatory System, p. 8, June 23,
2016, at https://www.americanbenefitscouncil.org/pub/?ID=7597A49D-BBC1-D358-3874-4A23B45624CA.
30 House Committee on Financial Services, The Financial CHOICE Act, pp. 6-8.
31 P.L. 115-174, title II, §201(c).
32 P.L. 115-174, title II, §201(a)(3)(B). Well capitalized for other regulatory purposes includes the exemptions well-
capitalized banks get from certain interest rate and broker-deposit limitations and restrictions.
Community Bank Leverage Ratio: Background and Analysis of Bank Data
Congressional Research Service 7
Although the act specified in statute one qualifying criterion (less than $10 billion in assets) and
established a range within which the CBLR must be set (8% to 10%), it granted the regulators
discretion in certain aspects, including setting other qualifying criteria and the exact level within
the 8%-10% range.
Under Section 201, qualifying banks that meet size and risk criteria would fall into one of two
groups with respect to the CBLR threshold when the new regulation goes into effect.33 The
CBLR-compliant banks (i.e., those above the threshold) would have the option to enter the CBLR
regime, and be considered in compliance with all risk-based capital ratio minimums and well
capitalized for other regulatory purposes.34 This would free those banks from costs associated
with meeting risk-based minimums and reporting their ratios (a quarterly exercise requiring bank
resources). Most small banks hold enough capital to exceed the threshold, and thus will be
provided this regulatory relief without having to raise extra capital. Banks that meet the size and
risk-profile criteria (i.e., CBLR-qualifying banks) but whose capital holdings are below the
CBLR threshold can remain in the preexisting capital regime (no banks are required to meet the
CBLR), or can choose to raise capital or otherwise change their balance sheet composition in
order to become CBLR compliant.
Regulatory Implementation On November 21, 2018, the bank regulators announced they were inviting public comment on a
proposed CBLR rulemaking.35 The proposal included the statutorily mandated qualifying
criterion that only banks with less than $10 billion in assets would be eligible. In addition, the
regulators used the authority granted by Section 201 to exclude banks based on risk-profile
characteristics by including a number of additional qualifying criteria that limited banks’ trading
activity and off-balance-sheet exposures.36 On the question of where within the 8% to 10% range
to set the CBLR threshold, the regulators chose 9%, arguing that this level supports the “goals of
reducing regulatory burden for community banking organizations and retaining safety and
soundness in the banking system.”37
The banking industry has criticized aspects of the rule. For example, an industry group
representing community banks indicated it was “disappointed that regulators have proposed
capital standards that are higher than necessary” and “supports an 8% community bank leverage
ratio.”38 In its comment letter, the group noted that an 8% threshold “would calibrate the CBLR
33 Over time, banks may increase capital and become eligible for the CBLR regime or may fall below the CBLR after
electing to enter that regime. Section 201 directs the bank regulators to establish procedures for treatment of banks that
fall into the latter group, and the regulators have done so in rulemaking. These procedures and the new Prompt
Corrective Action regime established by the regulators are beyond the scope of this report.
34 Examples include exemption from certain activities restrictions related to interest rate offerings and brokered deposit
acceptance. See OCC, Fed, and FDIC, “Regulatory Capital Rule: Capital Simplification for Qualifying Community
Banking Organizations,” 84 Federal Register 3064-3065, February 8, 2019.
35 The Federal Reserve, “Agencies propose community bank leverage ratio for qualifying community banking
organizations,” press release, November 21, 2018, at https://www.federalreserve.gov/newsevents/pressreleases/
bcreg20181121c.htm.
36 OCC, Fed, and FDIC, “Regulatory Capital Rule: Capital Simplification for Qualifying Community Banking
Organizations,” 84 Federal Register 3064-3065, February 8, 2019. See Appendix B for more details on risk-profile
criteria.
37 OCC, Fed, and FDIC, “Regulatory Capital Rule: Capital Simplification for Qualifying Community Banking
Organizations,” 84 Federal Register 3064-3065, February 8, 2019.
38 Independent Community Bankers of America (ICBA), “ICBA Statement on Community Bank Leverage Ratio,”
Community Bank Leverage Ratio: Background and Analysis of Bank Data
Congressional Research Service 8
closer to the current risk-based capital requirements ... [and] put the ratio closer to the current 5%
leverage requirement.”39
Despite the criticism, the bank regulators issued a joint press release on October 29, 2019,
announcing they had finalized the rule with a 9% threshold, and it will go into effect on January
1, 2020.40
Analysis: Banks, Qualifying Criteria, and CBLR-
Compliant Thresholds Outside of bank policy circles and absent context, debating whether a threshold ratio of capital to
unweighted assets is best set at 8% or 9% may seem inconsequential. However, hundreds of
banks can be affected by just fractions of a percentage point. This section provides estimates of
how many depositories would, as of June 30, 2019, likely fall above or below the CBLR
threshold if set at 9% or 8%. Those estimates at the state level are provided in Appendix A. This
section also includes statistics on certain characteristics of banks that meet or do not meet various
CBLR criteria.
The estimates presented here are based on Congressional Research Service (CRS) analysis of (1)
data provided by FDIC-insured depository institutions (insured depository institutions can be
either banks or savings associations, but will be referred to as “banks”) on their Consolidated
Statement on Condition and Income, known as the call report, for the second quarter of 2019;41
and (2) information found in the CBLR notice of proposed rulemaking published in the Federal
Register.42 CRS could not find in the call report some data points necessary to provide a definitive
list of and exact statistics on which banks would and would not qualify and be CBLR compliant.43
Thus, the CRS list of qualifying and compliant banks and the calculation of every bank’s current
CBLR may not exactly match the eventual actual numbers. A more detailed description of CRS
methodology is provided in Appendix B.
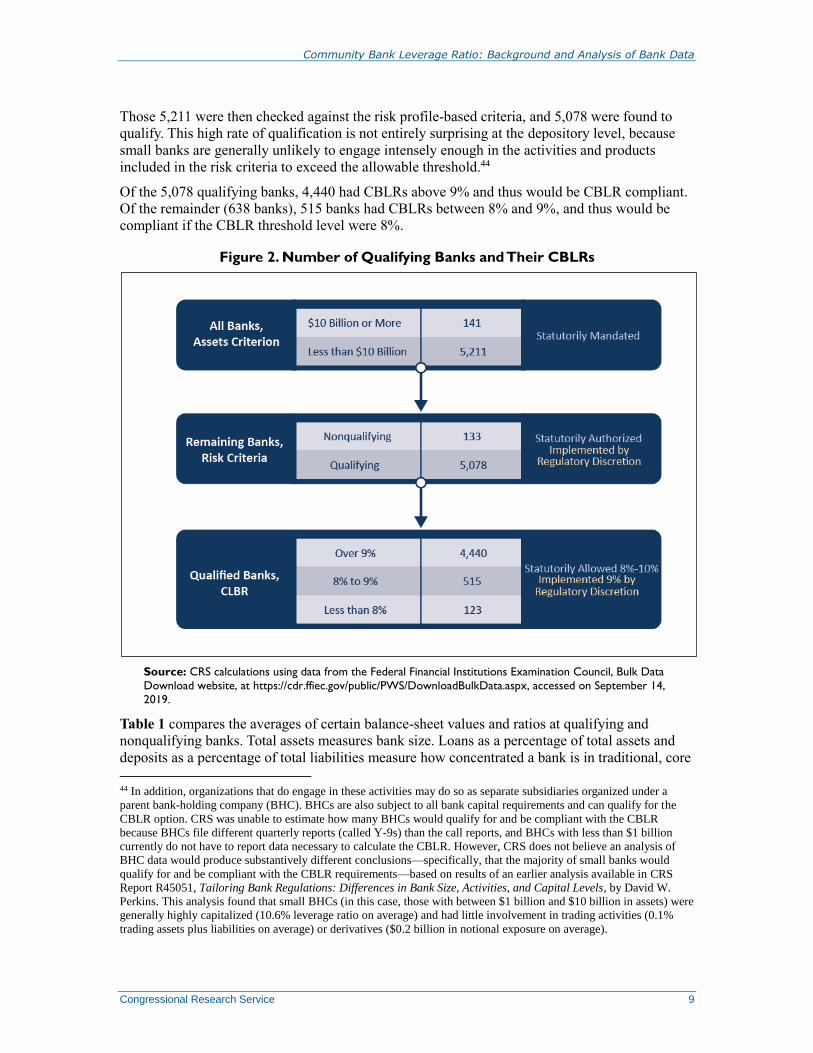
CRS began with all 5,352 banks that filed call reports for the second quarter of 2019, and first
filtered out those with $10 billion or more in assets (see Figure 2). Based on that criterion, 141
banks could not qualify and 5,211 could if they met the risk-profile criteria.
press release, November 20, 2018, at https://www.icba.org/news/news-details/2018/11/20/icba-statement-on-
community-bank-leverage-ratio.
39 Letter from James Kendrick, first vice president, Accounting and Capital Policy for the Independent Community
Bankers of America, to Officials at OCC, Fed, and FDIC, April 9, 2019, at https://www.icba.org/docs/default-source/
icba/advocacy-documents/letters-to-regulators/19-04-09_cblrcl.pdf?sfvrsn=1d9f4217_0. The ICBA also object to other
aspects of the proposal, including how a risk-profile criterion was calibrated, how tangible equity was defined, and the
proposed capital classification for banks that fell below the CBLR threshold after entering the regime.
40 Fed, OCC, and FDIC, “Federal Bank Regulatory Agencies Issue Final Rule to Simplify Capital Calculation for
Community Banks,” press release, October 29, 2019, at https://www.fdic.gov/news/news/press/2019/pr19100.html.
41 Federal Financial Institutions Examination Council, Bulk Data Download website, at https://cdr.ffiec.gov/public/
PWS/DownloadBulkData.aspx, accessed on September 14, 2019.
42 OCC, Fed, and FDIC, “Regulatory Capital Rule: Capital Simplification for Qualifying Community Banking
Organizations,” 84 Federal Register 3074, February 8, 2019.
43 Specifically, some of data related to the off-balance-sheet exposures that could disqualify a bank based on risk
profile could not be located by CRS. Hence, CRS’s count may slightly overestimate how many banks qualify. Given
the characteristics of typical $10 billion or smaller banks and the level of the disqualifying threshold, CRS believes that
if the number presented here is an overcount, then it is relatively small. See Appendix B for more details.
Community Bank Leverage Ratio: Background and Analysis of Bank Data
Congressional Research Service 9
Those 5,211 were then checked against the risk profile-based criteria, and 5,078 were found to
qualify. This high rate of qualification is not entirely surprising at the depository level, because
small banks are generally unlikely to engage intensely enough in the activities and products
included in the risk criteria to exceed the allowable threshold.44
Of the 5,078 qualifying banks, 4,440 had CBLRs above 9% and thus would be CBLR compliant.
Of the remainder (638 banks), 515 banks had CBLRs between 8% and 9%, and thus would be
compliant if the CBLR threshold level were 8%.
Figure 2. Number of Qualifying Banks and Their CBLRs
Source: CRS calculations using data from the Federal Financial Institutions Examination Council, Bulk Data
Download website, at https://cdr.ffiec.gov/public/PWS/DownloadBulkData.aspx, accessed on September 14,
2019.
Table 1 compares the averages of certain balance-sheet values and ratios at qualifying and
nonqualifying banks. Total assets measures bank size. Loans as a percentage of total assets and
deposits as a percentage of total liabilities measure how concentrated a bank is in traditional, core
44 In addition, organizations that do engage in these activities may do so as separate subsidiaries organized under a
parent bank-holding company (BHC). BHCs are also subject to all bank capital requirements and can qualify for the
CBLR option. CRS was unable to estimate how many BHCs would qualify for and be compliant with the CBLR
because BHCs file different quarterly reports (called Y-9s) than the call reports, and BHCs with less than $1 billion
currently do not have to report data necessary to calculate the CBLR. However, CRS does not believe an analysis of
BHC data would produce substantively different conclusions—specifically, that the majority of small banks would
qualify for and be compliant with the CBLR requirements—based on results of an earlier analysis available in CRS
Report R45051, Tailoring Bank Regulations: Differences in Bank Size, Activities, and Capital Levels, by David W.
Perkins. This analysis found that small BHCs (in this case, those with between $1 billion and $10 billion in assets) were
generally highly capitalized (10.6% leverage ratio on average) and had little involvement in trading activities (0.1%
trading assets plus liabilities on average) or derivatives ($0.2 billion in notional exposure on average).
Community Bank Leverage Ratio: Background and Analysis of Bank Data
Congressional Research Service 10
banking activities, while trading assets and liabilities as a percentage of total assets measure how
active it is in noncore activities. Off-balance-sheet exposures as a percentage of total assets
measures bank risk that is not reflected on the balance sheet. Recall from “Risk-Weighted Ratio
Requirements” that banks must meet three different minimum risk-weighted requirements that
differ in the types of capital used to calculate the ratio. The types of capital they use are
categorized as common equity Tier 1 (CET1), Tier 1, and total capital. Tier 1 capital is what is
used to calculate the generally applicable leverage ratio in place before the CBLR. CET1 is the
most loss-absorbing category of capital and allows the fewest capital types of the three.45 Tier 1
includes additional items not allowable in CET1.46 Total capital is the most inclusive, allowing
certain Tier 2 capital items not allowable in Tier 1.47 The average of these ratios is presented to
give an indication of how well capitalized banks are, as measured by the existing capital regime.
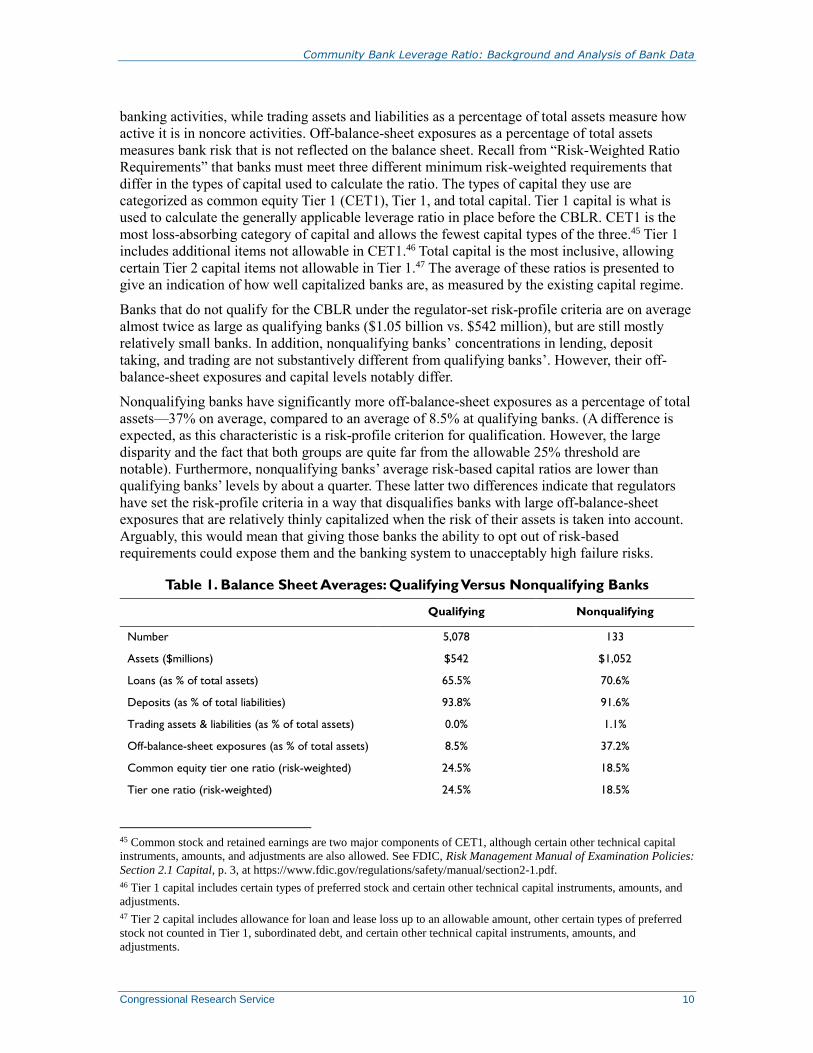
Banks that do not qualify for the CBLR under the regulator-set risk-profile criteria are on average
almost twice as large as qualifying banks ($1.05 billion vs. $542 million), but are still mostly
relatively small banks. In addition, nonqualifying banks’ concentrations in lending, deposit
taking, and trading are not substantively different from qualifying banks’. However, their off-
balance-sheet exposures and capital levels notably differ.
Nonqualifying banks have significantly more off-balance-sheet exposures as a percentage of total
assets—37% on average, compared to an average of 8.5% at qualifying banks. (A difference is
expected, as this characteristic is a risk-profile criterion for qualification. However, the large
disparity and the fact that both groups are quite far from the allowable 25% threshold are
notable). Furthermore, nonqualifying banks’ average risk-based capital ratios are lower than
qualifying banks’ levels by about a quarter. These latter two differences indicate that regulators
have set the risk-profile criteria in a way that disqualifies banks with large off-balance-sheet
exposures that are relatively thinly capitalized when the risk of their assets is taken into account.
Arguably, this would mean that giving those banks the ability to opt out of risk-based
requirements could expose them and the banking system to unacceptably high failure risks.
Table 1. Balance Sheet Averages: Qualifying Versus Nonqualifying Banks
Qualifying Nonqualifying
Number 5,078 133
Assets ($millions) $542 $1,052
Loans (as % of total assets) 65.5% 70.6%
Deposits (as % of total liabilities) 93.8% 91.6%
Trading assets & liabilities (as % of total assets) 0.0% 1.1%
Off-balance-sheet exposures (as % of total assets) 8.5% 37.2%
Common equity tier one ratio (risk-weighted) 24.5% 18.5%
Tier one ratio (risk-weighted) 24.5% 18.5%
45 Common stock and retained earnings are two major components of CET1, although certain other technical capital
instruments, amounts, and adjustments are also allowed. See FDIC, Risk Management Manual of Examination Policies:
Section 2.1 Capital, p. 3, at https://www.fdic.gov/regulations/safety/manual/section2-1.pdf.
46 Tier 1 capital includes certain types of preferred stock and certain other technical capital instruments, amounts, and
adjustments.
47 Tier 2 capital includes allowance for loan and lease loss up to an allowable amount, other certain types of preferred
stock not counted in Tier 1, subordinated debt, and certain other technical capital instruments, amounts, and
adjustments.
Community Bank Leverage Ratio: Background and Analysis of Bank Data
Congressional Research Service 11
Qualifying Nonqualifying
Total capital ratio (risk-weighted) 25.6% 19.5%
Tier one leverage ratio (not risk-weighted) 13.2% 14.5%
Source: Congressional Research Service calculations using data from the Federal Financial Institutions
Examination Council, Bulk Data Download website, at https://cdr.ffiec.gov/public/PWS/DownloadBulkData.aspx,
accessed on September 14, 2019.
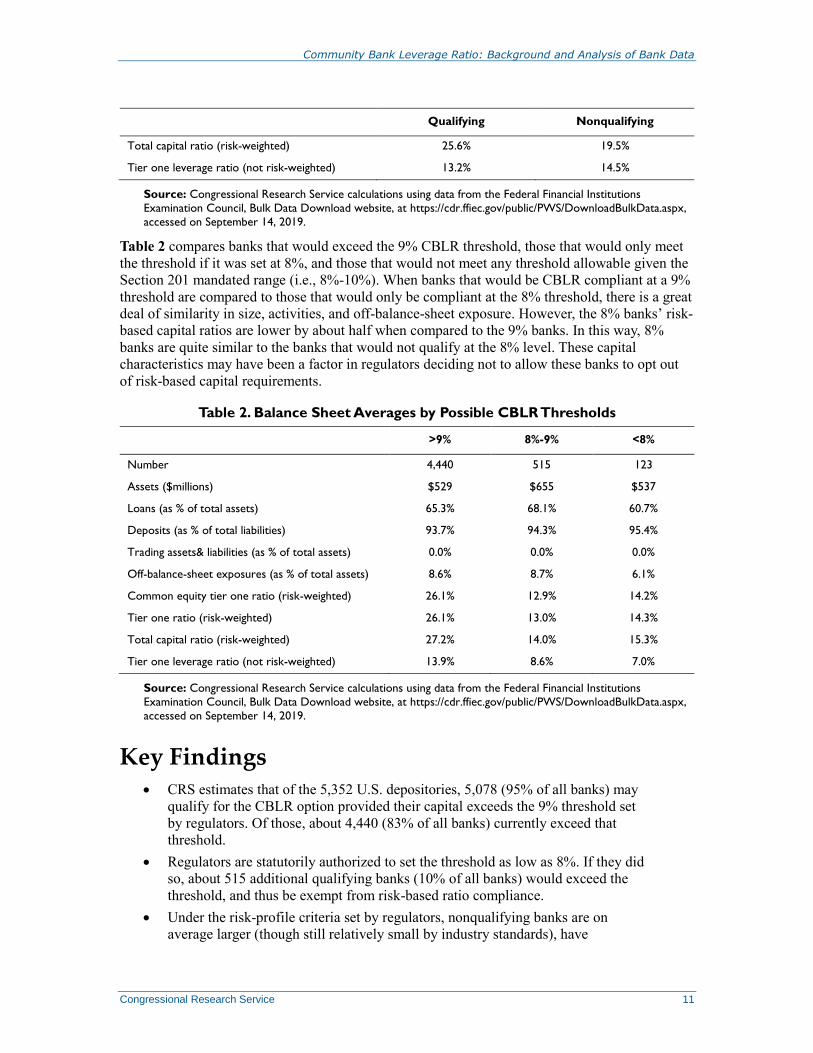
Table 2 compares banks that would exceed the 9% CBLR threshold, those that would only meet
the threshold if it was set at 8%, and those that would not meet any threshold allowable given the
Section 201 mandated range (i.e., 8%-10%). When banks that would be CBLR compliant at a 9%
threshold are compared to those that would only be compliant at the 8% threshold, there is a great
deal of similarity in size, activities, and off-balance-sheet exposure. However, the 8% banks’ risk-
based capital ratios are lower by about half when compared to the 9% banks. In this way, 8%
banks are quite similar to the banks that would not qualify at the 8% level. These capital
characteristics may have been a factor in regulators deciding not to allow these banks to opt out
of risk-based capital requirements.
Table 2. Balance Sheet Averages by Possible CBLR Thresholds
>9% 8%-9% <8%
Number 4,440 515 123
Assets ($millions) $529 $655 $537
Loans (as % of total assets) 65.3% 68.1% 60.7%
Deposits (as % of total liabilities) 93.7% 94.3% 95.4%
Trading assets& liabilities (as % of total assets) 0.0% 0.0% 0.0%
Off-balance-sheet exposures (as % of total assets) 8.6% 8.7% 6.1%
Common equity tier one ratio (risk-weighted) 26.1% 12.9% 14.2%
Tier one ratio (risk-weighted) 26.1% 13.0% 14.3%
Total capital ratio (risk-weighted) 27.2% 14.0% 15.3%
Tier one leverage ratio (not risk-weighted) 13.9% 8.6% 7.0%
Source: Congressional Research Service calculations using data from the Federal Financial Institutions
Examination Council, Bulk Data Download website, at https://cdr.ffiec.gov/public/PWS/DownloadBulkData.aspx,
accessed on September 14, 2019.
Key Findings CRS estimates that of the 5,352 U.S. depositories, 5,078 (95% of all banks) may
qualify for the CBLR option provided their capital exceeds the 9% threshold set
by regulators. Of those, about 4,440 (83% of all banks) currently exceed that
threshold.
Regulators are statutorily authorized to set the threshold as low as 8%. If they did
so, about 515 additional qualifying banks (10% of all banks) would exceed the
threshold, and thus be exempt from risk-based ratio compliance.
Under the risk-profile criteria set by regulators, nonqualifying banks are on
average larger (though still relatively small by industry standards), have
Community Bank Leverage Ratio: Background and Analysis of Bank Data
Congressional Research Service 12
significantly larger off-balance-sheet exposures, and hold about a quarter less
capital than qualifying banks, as measured by risk-based ratios.
Banks that would be CBLR compliant at a 9% threshold are similar in size,
activities, and off-balance-sheet exposures to 8% threshold banks. However, the
latter group holds about half the risk-based capital that the former does.
Community Bank Leverage Ratio: Background and Analysis of Bank Data
Congressional Research Service 13
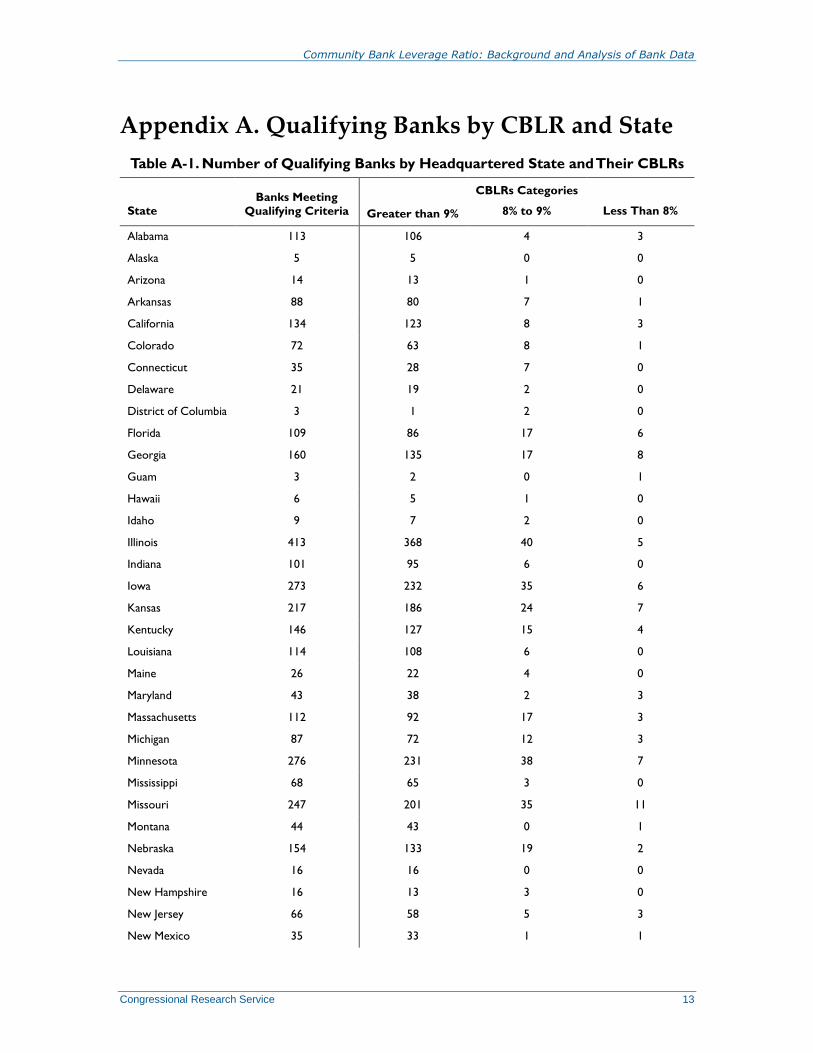
Appendix A. Qualifying Banks by CBLR and State
Table A-1. Number of Qualifying Banks by Headquartered State and Their CBLRs
State Banks Meeting
Qualifying Criteria Greater than 9%
CBLRs Categories
8% to 9% Less Than 8%
Alabama 113 106 4 3
Alaska 5 5 0 0
Arizona 14 13 1 0
Arkansas 88 80 7 1
California 134 123 8 3
Colorado 72 63 8 1
Connecticut 35 28 7 0
Delaware 21 19 2 0
District of Columbia 3 1 2 0
Florida 109 86 17 6
Georgia 160 135 17 8
Guam 3 2 0 1
Hawaii 6 5 1 0
Idaho 9 7 2 0
Illinois 413 368 40 5
Indiana 101 95 6 0
Iowa 273 232 35 6
Kansas 217 186 24 7
Kentucky 146 127 15 4
Louisiana 114 108 6 0
Maine 26 22 4 0
Maryland 43 38 2 3
Massachusetts 112 92 17 3
Michigan 87 72 12 3
Minnesota 276 231 38 7
Mississippi 68 65 3 0
Missouri 247 201 35 11
Montana 44 43 0 1
Nebraska 154 133 19 2
Nevada 16 16 0 0
New Hampshire 16 13 3 0
New Jersey 66 58 5 3
New Mexico 35 33 1 1

Community Bank Leverage Ratio: Background and Analysis of Bank Data
Congressional Research Service 14
State
Banks Meeting
Qualifying Criteria Greater than 9%
CBLRs Categories
8% to 9% Less Than 8%
New York 130 107 16 7
North Carolina 45 39 6 0
North Dakota 73 64 8 1
Ohio 173 148 20 5
Oklahoma 197 170 19 8
Oregon 15 15 0 0
Pennsylvania 138 112 20 6
Puerto Rico 3 3 0 0
Rhode Island 7 6 1 0
South Carolina 45 43 1 1
South Dakota 59 52 6 1
Tennessee 140 120 14 6
Texas 416 375 35 6
Utah 30 30 0 0
Vermont 11 8 3 0
Virgin Islands 1 0 1 0
Virginia 65 63 2 0
Washington 37 37 0 0
West Virginia 50 46 3 1
Wisconsin 186 168 17 1
Wyoming 30 27 2 1
Source: Congressional Research Service calculations using data from the Federal Financial Institutions
Examination Council, Bulk Data Download website, at https://cdr.ffiec.gov/public/PWS/DownloadBulkData.aspx,
accessed on September 14, 2019.
Notes: List of bank names available to congressional clients by state upon request. Contact report author. One
qualifying bank had null value in the “State” data field and has been omitted from this table.
Community Bank Leverage Ratio: Background and Analysis of Bank Data
Congressional Research Service 15
Appendix B. Methodology To produce the statistics and estimates presented in this report, CRS used (1) information from
the bank regulator Notice of Proposed Rulemaking: Regulatory Capital Rule: Capital
Simplification for Qualifying Community Banking Organizations, published in the Federal
Register on February 8, 2019;48 and (2) data from Consolidated Reports on Condition and Income
as of June 30, 2019, which was downloaded from the Federal Financial Institution Examination
Council bulk data download website on September 14, 2019.49
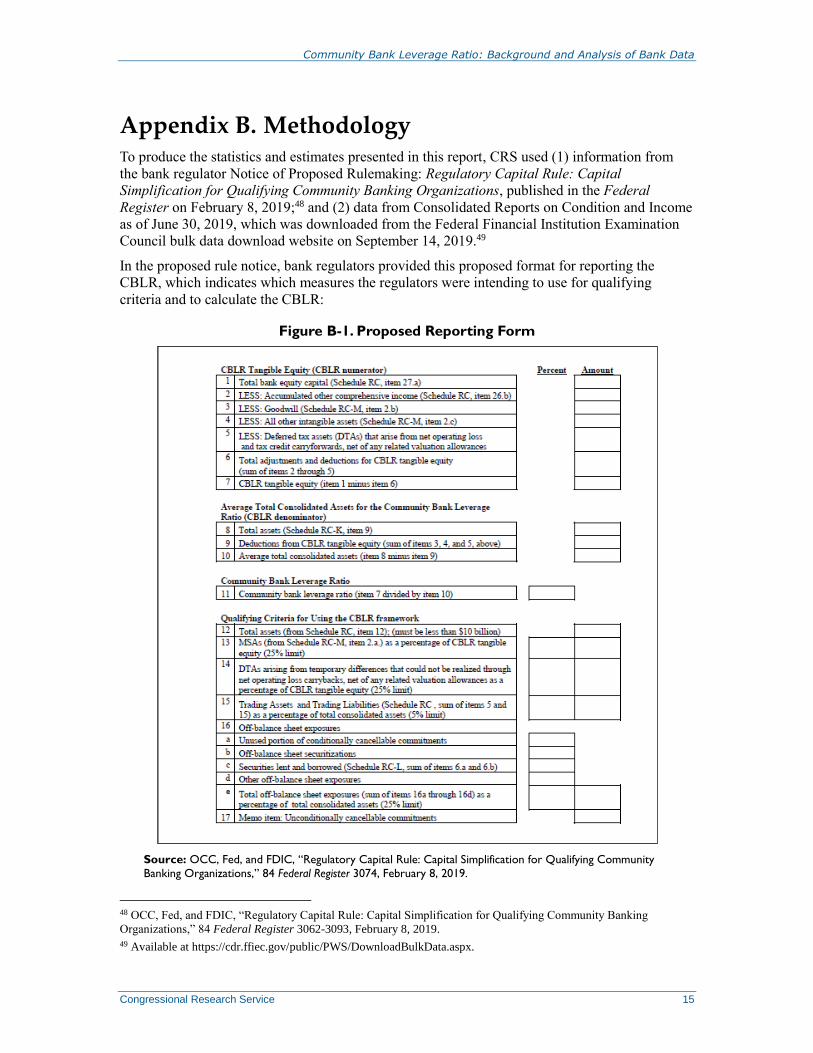
In the proposed rule notice, bank regulators provided this proposed format for reporting the
CBLR, which indicates which measures the regulators were intending to use for qualifying
criteria and to calculate the CBLR:
Figure B-1. Proposed Reporting Form
Source: OCC, Fed, and FDIC, “Regulatory Capital Rule: Capital Simplification for Qualifying Community
Banking Organizations,” 84 Federal Register 3074, February 8, 2019.
48 OCC, Fed, and FDIC, “Regulatory Capital Rule: Capital Simplification for Qualifying Community Banking
Organizations,” 84 Federal Register 3062-3093, February 8, 2019.
49 Available at https://cdr.ffiec.gov/public/PWS/DownloadBulkData.aspx.
Community Bank Leverage Ratio: Background and Analysis of Bank Data
Congressional Research Service 16
The estimates in this report may differ from the actual numbers due to two challenges with data
availability.
First, exactly how deferred tax assets are counted in the proposals and what deductions from
those figures would be permitted differ from the deferred tax asset values banks entered at call
report Schedule RC-R, Part I, line 8. However, CRS was unable to locate the exact data identified
in the proposal, and so used the deferred tax asset value available in the call report as a proxy.
CRS judged that using this proxy was unlikely to cause the estimated bank counts and statistics
presented in this report to differ substantively from the actual figures, because the vast majority of
qualifying banks reported little or no deferred tax assets. Nevertheless, the difference could cause
a bank near the 25% DTA-to-assets qualifying threshold to be erroneously classified as qualifying
or nonqualifying. In addition, using this proxy could cause the CBLRs estimated for this report to
be slightly different from certain banks’ actual CBLRs.
Second, while CRS was able to locate values in the call report data for a number of off-balance-
sheet exposures identified in the proposal, it was not able to locate others. The exposures included
in the proposal are
the unused portions of commitments (except for unconditionally cancellable
commitments); self-liquidating, trade-related contingent items that arise from the
movement of goods, transaction-related contingent items (i.e., performance bond, bid
bonds and warranties); sold credit protection in the form of guarantees and credit
derivatives; credit enhancing representations and guarantees; off-balance sheet
securitization exposures; letters of credit; forward agreements that are not derivatives
contracts; and securities lending and borrowing transactions.50
CRS used the following values banks entered in call reports: (1) Schedule RC-L, lines 1a, 1b,
1c(1)-(2), 1d, and 1e as “unused portions of commitments”; (2) Schedule RC-R, Part II, line 19,
Column A as “unconditionally cancellable commitments”; (3) Schedule RC-L lines 7a(1)-(4)
Column A as “sold credit protection in the form of guarantees and credit derivatives”; (4)
Schedule RC-R, Part II, line 10, Column A as “off balance sheet securitization exposures”; (5)
Schedule RC-L line 2, 3, and 4 as “letters of credit”; and (6) Schedule RC-L, line 6a and 6b as
“securities lending and borrowing transactions.”
CRS was unable to locate values for (1) “trade self-liquidating, trade-related contingent items that
arise from the movement of goods”; (2) “transaction-related contingent items”; (3) “credit
enhancing representations and guarantees”; and (4) “forward agreements that are not derivatives
contracts.”
Thus, the CRS-calculated off-balance-sheet exposures used for this report are underestimates for
banks that had any of the latter set of exposures. CRS judges that the number of banks that have
these exposures and for which the underestimation is the difference between falling above or
below the 25% off-balance-sheet exposures to total assets threshold is likely relatively small.
Nevertheless, by omitting the latter set of exposures, the CRS estimate of qualifying banks may
be an overcount.
To calculate the CBLRs, CRS used the following calculations and call report items (the item
number is an identifying number assigned to each line item in the call report data set):
50 OCC, Fed, and FDIC, “Regulatory Capital Rule: Capital Simplification for Qualifying Community Banking
Organizations,” 84 Federal Register 3066, February 8, 2019.
Community Bank Leverage Ratio: Background and Analysis of Bank Data
Congressional Research Service 17
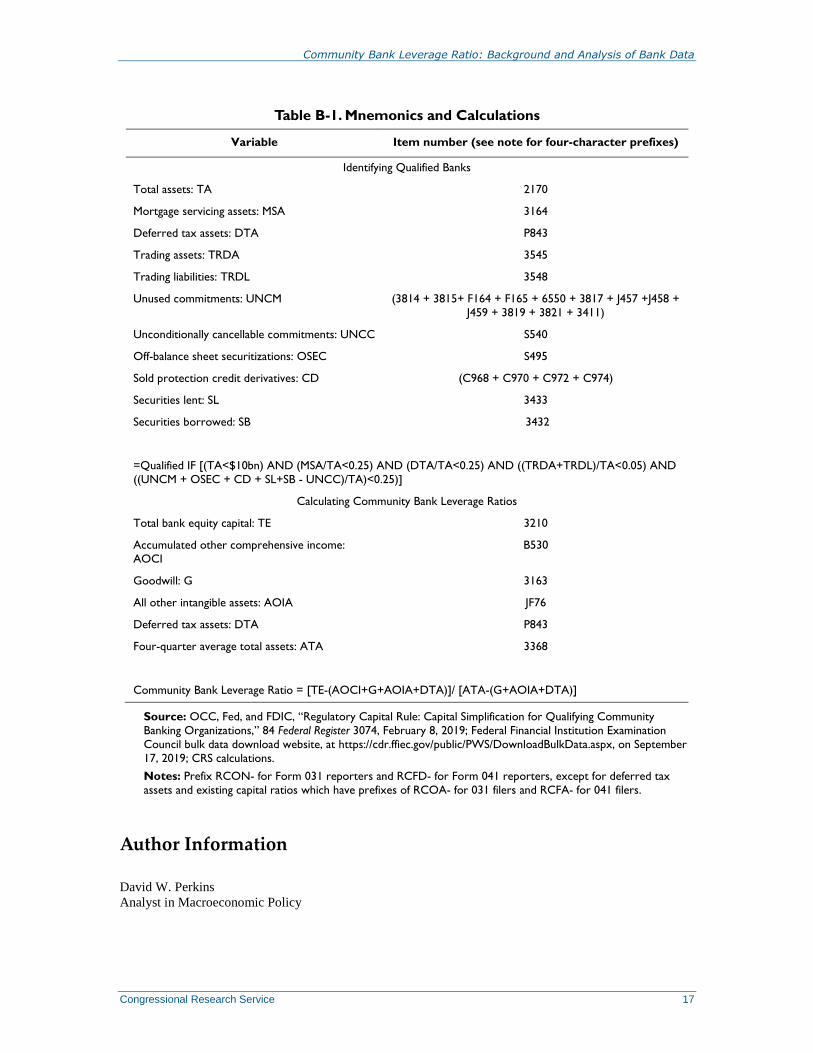
Table B-1. Mnemonics and Calculations
Variable Item number (see note for four-character prefixes)
Identifying Qualified Banks
Total assets: TA 2170
Mortgage servicing assets: MSA 3164
Deferred tax assets: DTA P843
Trading assets: TRDA 3545
Trading liabilities: TRDL 3548
Unused commitments: UNCM (3814 + 3815+ F164 + F165 + 6550 + 3817 + J457 +J458 +
J459 + 3819 + 3821 + 3411)
Unconditionally cancellable commitments: UNCC S540
Off-balance sheet securitizations: OSEC S495
Sold protection credit derivatives: CD (C968 + C970 + C972 + C974)
Securities lent: SL 3433
Securities borrowed: SB 3432
=Qualified IF [(TA<$10bn) AND (MSA/TA<0.25) AND (DTA/TA<0.25) AND ((TRDA+TRDL)/TA<0.05) AND
((UNCM + OSEC + CD + SL+SB - UNCC)/TA)<0.25)]
Calculating Community Bank Leverage Ratios
Total bank equity capital: TE 3210
Accumulated other comprehensive income:
AOCI
B530
Goodwill: G 3163
All other intangible assets: AOIA JF76
Deferred tax assets: DTA P843
Four-quarter average total assets: ATA 3368
Community Bank Leverage Ratio = [TE-(AOCI+G+AOIA+DTA)]/ [ATA-(G+AOIA+DTA)]
Source: OCC, Fed, and FDIC, “Regulatory Capital Rule: Capital Simplification for Qualifying Community
Banking Organizations,” 84 Federal Register 3074, February 8, 2019; Federal Financial Institution Examination
Council bulk data download website, at https://cdr.ffiec.gov/public/PWS/DownloadBulkData.aspx, on September
17, 2019; CRS calculations.
Notes: Prefix RCON- for Form 031 reporters and RCFD- for Form 041 reporters, except for deferred tax
assets and existing capital ratios which have prefixes of RCOA- for 031 filers and RCFA- for 041 filers.
Author Information
David W. Perkins
Analyst in Macroeconomic Policy
Community Bank Leverage Ratio: Background and Analysis of Bank Data
Congressional Research Service R45989 · VERSION 1 · NEW 18
Disclaimer
This document was prepared by the Congressional Research Service (CRS). CRS serves as nonpartisan
shared staff to congressional committees and Members of Congress. It operates solely at the behest of and
under the direction of Congress. Information in a CRS Report should not be relied upon for purposes other
than public understanding of information that has been provided by CRS to Members of Congress in
connection with CRS’s institutional role. CRS Reports, as a work of the United States Government, are not
subject to copyright protection in the United States. Any CRS Report may be reproduced and distributed in
its entirety without permission from CRS. However, as a CRS Report may include copyrighted images or
material from a third party, you may need to obtain the permission of the copyright holder if you wish to
copy or otherwise use copyrighted material.