Community Assessment 2017 Baseline 2018 Updates 2019 ...
53
1 Community Assessment 2017 Baseline 2018 Updates 2019 Updates 2020 Updates Updated February 25, 2020
Transcript of Community Assessment 2017 Baseline 2018 Updates 2019 ...

1
Community Assessment
2017 Baseline 2018 Updates 2019 Updates 2020 Updates
Updated February 25, 2020
2
Contents
Contents ...................................................................................................................................................... 2
(a) Service Area ........................................................................................................................................... 3
(b) Community wide strategic planning and needs assessment .................................................................... 4
(i) The number of eligible infants, toddlers, preschool age children, and expectant mothers, including their geographic location, race, ethnicity, and languages they speak, including: ...............................................................4
1. Demographic Make-up of Champlain Valley ........................................................................................................................... 4 2. Demographic Make-up in Addison County .............................................................................................................................. 6 3. Demographic Make-up in Chittenden County ......................................................................................................................... 8 4. Demographic Make-up in Franklin and Grand Isle Counties ................................................................................................. 12
(A) Children experiencing homelessness in collaboration with, to the extent possible, McKinney-Vento Local Education Agency Liaisons (42 U.S.C. 11432 (6)(A))11; ............................................................................................................................................... 14 (B) Children in foster care; ............................................................................................................................................................. 18 (C) Children with disabilities, including types of disabilities and relevant services and resources provided to these children by community agencies; ..................................................................................................................................................................... 21
1. Estimated number of children with disabilities five years old or younger ............................................................................ 21 2. Types of Disabilities ............................................................................................................................................................... 24 3. Relevant services and resources provided to children with special needs by community agencies ..................................... 27
(ii) The education, health, nutrition and social service needs of eligible children and their families, including prevalent social or economic factors that impact their well-being; ........................................................................ 32
1. Education Needs of Children ................................................................................................................................................. 32 2. Education Needs of Adults..................................................................................................................................................... 33 3. Health Needs ......................................................................................................................................................................... 34 4. Mental Health Needs ............................................................................................................................................................. 37 5. Nutrition Needs ..................................................................................................................................................................... 41 6. Social Service Needs .............................................................................................................................................................. 42
(iii) Typical work, school, and training schedules of parents with eligible children; ................................................. 43
(iv) Other child development, child care centers, and family child care programs that serve eligible children, including home visiting, publicly funded state and local preschools, and the approximate number of eligible children served; ................................................................................................................................................... 44
1. Child Development Programs in Champlain Valley ............................................................................................................... 46 2. Child Development Programs in Addison County .................................................................................................................. 47 3. Child Development Programs in Chittenden County ............................................................................................................. 48 4. Child Development Programs in Franklin and Grand Isle Counties ....................................................................................... 49 4. Overview of Act 166 Public/Private Pre-K Programs in CVHS Region .................................................................................... 50
(v) Resources that are available in the community to address the needs of eligible children and their families; ...... 52
(vi) Strengths of the community ........................................................................................................................... 53

3
(a) Service Area
Site Location
# of Children Served
County HS 2016-17
HS 2017-
18
HS 2018-
19
HS 2019-
20
EHS 2016-
17
EHS 2017-
18
EHS 2018-
19
EHS 2019-
20
EHS-CCP
2016-17
EHS-CCP
2017-18
EHS-CCP
2018-19
EHS-CCP
2019-20
1. Addison County Parent Child Center Otter Creek
10 10 8 8 Addison
2. Burlington Children’s Space 12 12 12 12 10 10 10 10 Chittenden
3. Champlain Islands Parent Child Center
10 10 10 10 5 5 5 5 Grand Isle
4. College Street Children’s Center 5 5 5 5 Addison
5. Essex Elementary Riverside 10 10 10 15 Chittenden
6. Flynn Elementary 20 20 10 10 Chittenden 7. Franklin Square 15 15 15 15 Chittenden 8. Home-Based 10 10 10 10 Chittenden 9. Home-Based 11 10 10 10 10 Franklin & Grand Isle 10. Ira Allen 10 20 20 20 Chittenden 11. JFK Elementary 54 50 50 50 Chittenden 12. King Street Center 15 15 15 15 8 8 8 8 Chittenden
13. Malletts Bay School 20 15 15 15 Chittenden
14. Mary Hogan Middlebury ELC Addison County ELC
15 15 15 15 Addison
15. Mary Johnson Children’s Center 15 15 15 15 Addison
16. Milton 10 10 10 10 Chittenden 17. Richford 10 Franklin 18. Robin’s Nest 7 7 Chittenden 19. Sara Holbrook 15 15 15 15 Chittenden 20. St. Albans Early Learning Center 15 15 15 15 Franklin
21. Sustainability Academy 10 Chittenden
22. Swanton Early Learning Center 15 15 15 15 Franklin
23. Trinity 15 15 15 15 Chittenden 24. YMCA Milton Family Center 10 10 10 8 Franklin Chittenden
Totals (Funded) 281 255 255 255 30 30 30 30 34 34 34 34 345 319 319 319 Totals (Funded + Non-federally funded)
304 274 257 262 30 30 30 30 38 38 36 34 372 342 323 326

4
(b) Community wide strategic planning and needs assessment
(i) The number of eligible infants, toddlers, preschool age children, and expectant mothers, including their geographic location, race, ethnicity, and languages they speak, including:
We have a great investment in our families and children. Parents, no matter how impoverished, in whatever way,
love their children and want what is best. How do we acknowledge that without throwing a million services at them when they need help?
~Community Service Provider, CVHS Community Survey 2017 1. Demographic Make-up of Champlain Valley Total population for the four counties (Addison, Chittenden, Franklin, and Grand Isle) of the Champlain Valley is approximately 253,420. There are a total of 13,053 children ages birth through 4 years old. Approximately 8% of Champlain Valley residents speak a language other than English at home, most of them in Chittenden County.
2019 Update
0–5 Age Population The population of Vermont’s 0-5 age population saw a 2.3% decline from 2011 to 2016.
Vermont’s 0–5 Age Population (2016)
Infant Toddler Pre-K Pre-K / K Total Age 0 1 2 3 4 5 0-5
Addison 306 330 331 338 321 334 1,960 Chittenden 1629 1639 1591 1569 1540 1533 9,501 Franklin 619 599 596 622 624 586 3,646 Grand Isle 67 62 61 63 80 61 394 Vermont 6,051 6,111 6,187 6,039 6,253 6,177 36,818
5
2019 Update
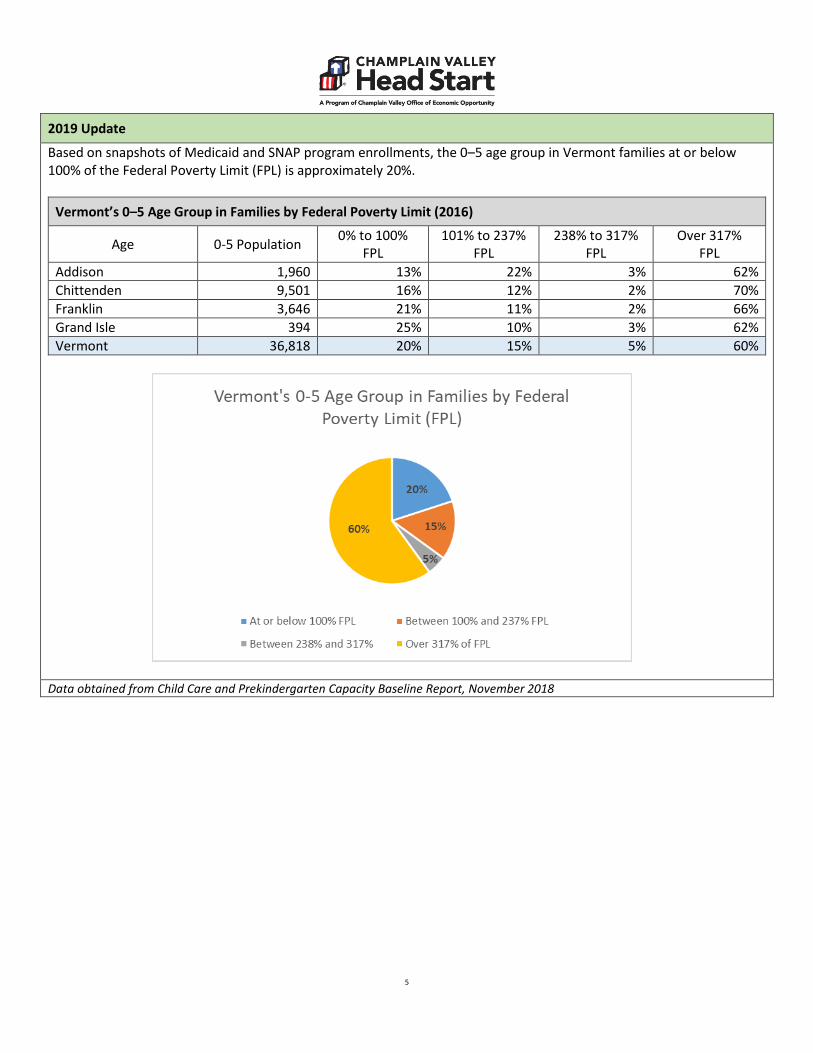
Based on snapshots of Medicaid and SNAP program enrollments, the 0–5 age group in Vermont families at or below 100% of the Federal Poverty Limit (FPL) is approximately 20%.
Vermont’s 0–5 Age Group in Families by Federal Poverty Limit (2016)
Age 0-5 Population 0% to 100% FPL
101% to 237% FPL
238% to 317% FPL
Over 317% FPL
Addison 1,960 13% 22% 3% 62% Chittenden 9,501 16% 12% 2% 70% Franklin 3,646 21% 11% 2% 66% Grand Isle 394 25% 10% 3% 62% Vermont 36,818 20% 15% 5% 60%
Data obtained from Child Care and Prekindergarten Capacity Baseline Report, November 2018

6
2. Demographic Make-up in Addison County Total population for Addison County is approximately 37,035. In Addison County, there are a total of 1,592 children ages birth through 4 years old. Approximately 5.2% of Addison County residents speak a language other than English at home.
Towns in Addison County with the largest number of children ages birth through 4
Town Children ages birth through 4 Middlebury 368 Bristol 170 Vergennes 113 Ferrisburgh 119 Monkton 89 Starksboro 76 Data was obtained through census.gov/quickfacts, the VT Department of Health, and the VT Agency of Human Services
Towns in Addison County with the largest number of families receiving public assistance
Town
Number of families (with children ages birth through 4)
receiving Reach Up (TANF) public assistance
Middlebury 34 Vergennes 15 Bristol 10 Data was obtained through census.gov/quickfacts, the VT Department of Health, and the VT Agency of Human Services
Race and Ethnicity Data for Addison County
Race / ethnicity data Addison County Vermont White persons 35,109 592,115 Black persons 407 8,120 American Indian and Alaska Native persons 74 2,498 Asian persons 703 9,994 Native Hawaiian and Other Pacific Islander -- -- Persons reporting two or more races 740 11,867 Persons of Hispanic or Latino origin 815 11,243 Data was obtained through census.gov/quickfacts, the VT Department of Health, and the VT Agency of Human Services

7

8
3. Demographic Make-up in Chittenden County Total population for Chittenden County is approximately 161,382. In Chittenden County, there are a total of 7,908 children ages birth through 4 years old. Approximately 9.1% of Chittenden County residents speak a language other than English at home.
Towns in Chittenden County with the largest number of children ages birth through 4
Town Children ages birth through 4 Burlington 2080 Essex 1026 South Burlington 921 Colchester 852 Milton 531 Williston 461 Winooski 352 Data was obtained through census.gov/quickfacts, the VT Department of Health, and the VT Agency of Human Services
Towns in Chittenden County with the largest number of families receiving public assistance
Town Number of families (with children ages birth through 4) receiving Reach Up (TANF) public assistance
Burlington 287 Winooski 67 Colchester 81 Essex 51 Milton 35 South Burlington 28 Data was obtained through census.gov/quickfacts, the VT Department of Health, and the VT Agency of Human Services
9
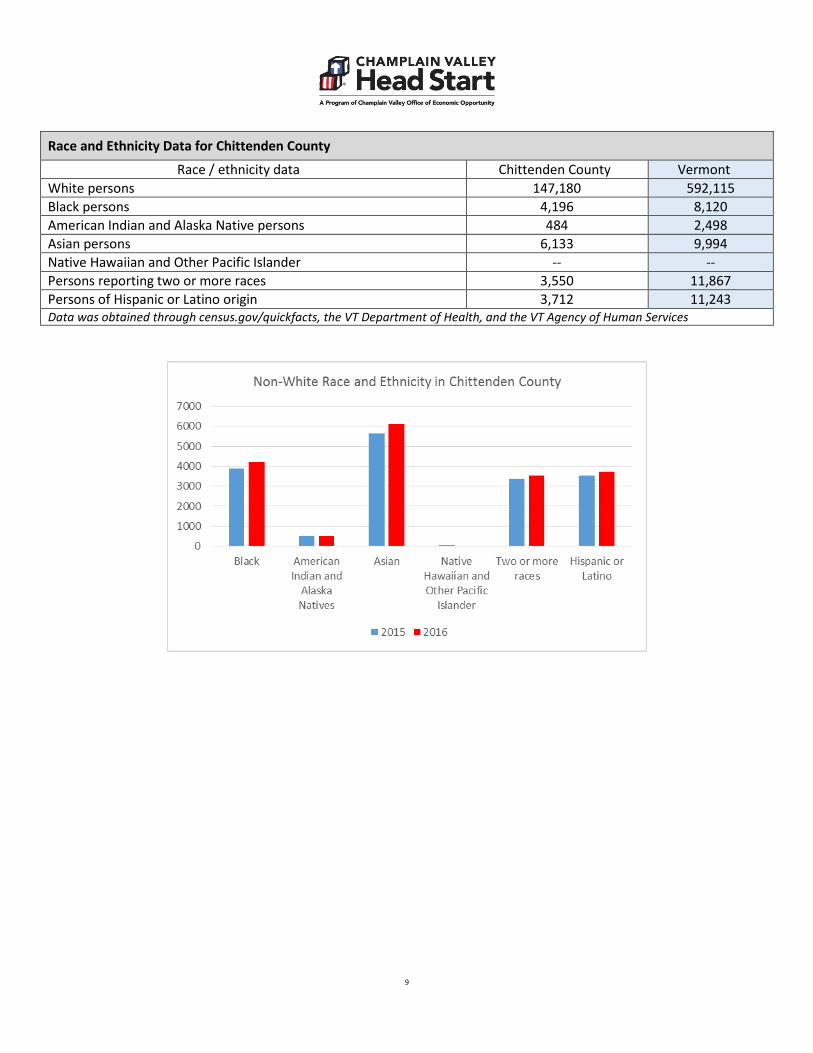
Race and Ethnicity Data for Chittenden County
Race / ethnicity data Chittenden County Vermont White persons 147,180 592,115 Black persons 4,196 8,120 American Indian and Alaska Native persons 484 2,498 Asian persons 6,133 9,994 Native Hawaiian and Other Pacific Islander -- -- Persons reporting two or more races 3,550 11,867 Persons of Hispanic or Latino origin 3,712 11,243 Data was obtained through census.gov/quickfacts, the VT Department of Health, and the VT Agency of Human Services

10
Refugees in Chittenden County
Being a marginalized community, accessing these services is very important for the families’ well-being and health. ~Community Service Provider, CVHS Community Assessment Survey, 2017
Approximately 9.1% of Chittenden County residents speak a language other than English at home, which is the highest percentage in the state of Vermont. This can be attributed to the fact that the Burlington area has been a designated Refugee Resettlement Area since 1989. Refugees resettled in the area in the last five years are mainly from Bhutan, Somalia, Burma, the Democratic Republic of Congo and Iraq. The most prevalent languages spoken by these refugees are Bhutanese or Nepali, Somali, Burmese or Karen, Swahili or French, and Arabic. The majority of families that resettle in this area are income eligible for Head Start as they have little or no income.
Refugee Data for Chittenden County
Country of Origin FY-12 FY-13 FY-14 FY-15 FY-16 FY-17 FY-18 FY-19 Total Democratic Republic of Congo 0 1 15 32 73 50 76 89 336 Eritrea 0 1 1 0 0 0 0 0 2 Ethiopia 0 0 0 0 0 1 0 0 1 Rwanda 0 1 0 0 1 1 0 0 2 Somalia 0 25 47 55 80 0 0 1 266 Sudan 0 3 10 0 0 58 0 0 13 Afghanistan 0 0 1 0 0 0 0 1 3 Iran 0 0 0 0 3 1 0 0 3 Iraq 10 19 56 20 1 0 0 0 125 Bhutan 298 256 173 192 218 19 0 1 1280 Burma 42 17 24 7 4 88 54 15 117
2148 Data was obtained through U.S. Committee for Refugees and Immigrants (formerly Vermont Refugee Resettlement Program)

11
2018 Update
2019 Update
2020 Update
Significant shifts in community demographics and resources Based on current information from U.S. Committee for Refugees and Immigrants, the number of individuals arriving decreased by almost 42% between Fiscal Years 2016 and 2017. Funding for VRRP is based on the number of individuals received each year. If the trend of decreased arrivals continues, it is likely to have a negative impact on the capacity of VRRP to provide services to those who have recently arrived in the community. Based on current information from U.S. Committee for Refugees and Immigrants, the number of individuals arriving decreased by 38% between Fiscal Years 2017 and 2018. The total decrease from Fiscal Year 2016 to 2018 is 65%. Funding for USCRI—Vermont is based on the number of individuals received each year. If the trend of decreased arrivals continues, it is likely to have a negative impact on the capacity of USCRI—Vermont to provide services to those who have recently arrived in the community.
Data was obtained through U.S. Committee for Refugees and Immigrants (formerly Vermont Refugee Resettlement Program)

12
4. Demographic Make-up in Franklin and Grand Isle Counties Total population for Franklin and Grand Isle Counties is approximately 55,003. In Franklin County, there are a total of 3,237 children ages birth through 4 years old. In Grand Isle County, there are a total of 316 children ages birth through 4 years old. Approximately 3.5% of Franklin County residents and 4.0% of Grand Isle residents speak a language other than English at home.
Towns in Franklin & Grand Isle Counties with the largest number of children ages birth through 4
Town Children ages birth through 4 St. Albans City 409 Swanton 389 St. Albans Town 384 Georgia 283 Fairfax 275 Highgate 218 Enosburg 165 Data was obtained through census.gov/quickfacts, the VT Department of Health, and the VT Agency of Human Services
Towns in Franklin & Grand Isle Counties w/ largest number of families receiving public assistance
Town Number of families (with children ages birth through 4) receiving Reach Up (TANF) public assistance
St. Albans City 118 Swanton 59 Richford 38 Enosburg 53 St. Albans Town 14 Highgate 21 Alburgh 15 Data was obtained through census.gov/quickfacts, the VT Department of Health, and the VT Agency of Human Services

13
Race and Ethnicity Data Franklin & Grand Isle Counties
Race / ethnicity data Franklin County Grand Isle County Vermont White persons 46,603 6,477 592,115 Black persons 342 55 8,120 American Indian and Alaska Native persons 488 96 2,498
Asian persons 293 27 9,994 Native Hawaiian and Other Pacific Islander -- 7 -- Persons reporting two or more races 1074 199 11,867 Persons of Hispanic or Latino origin 683 130 11,243 Data was obtained through census.gov/quickfacts, the VT Department of Health, and the VT Agency of Human Services

14
(A) Children experiencing homelessness in collaboration with, to the extent possible, McKinney-Vento Local Education Agency Liaisons (42 U.S.C. 11432 (6)(A))11; Overall, the number of families with children experiencing homelessness in Vermont decreased by 22% between 2016 and the prior year based on the annual Point-in-Time Count reported by the Vermont Coalition to End Homelessness (http://helpingtohousevt.org/point-in-time-counts/). As noted below, the number of homeless children decreased in Chittenden County and increased slightly in Addison and Franklin/Grand Isle counties.
Information reported by Vermont’s McKinney-Vento program, indicates 1.3% of the student population (pre-K through 12) are homeless. The majority of homeless students are doubled-up /sharing the housing of others (62.6%) or staying in motels/hotels (22%). (Source: National Center for Homeless Education and U.S. Department of Education’s EDfacts) Champlain Valley Head Start has also seen a slight decrease in the number of homeless children served. The majority of CVHS participants experiencing homelessness are located in Chittenden County and are enrolled in preschool programming.

15
2018 Update
Rates of family and child homelessness In 2017-2018 program year, there were 6 Early Head Start families who experienced homelessness, out of 40 families total. This represented a jump from 8% to 15% over the 2016-2017 program year. Information is not yet available for the January 2018 Point-in-Time count which gathers information regarding rates of homelessness on a single night each January. Based on information from the recent Building Bright Futures How are Vermont’s Young Children 2017, the number of homeless children in publicly funded homeless shelters has remained relatively stable over the past three years.
Data Source: CVHS PIR data How are Vermont’s Young Children and Families, Building Bright Futures, 2017 Report
16
2019 Update
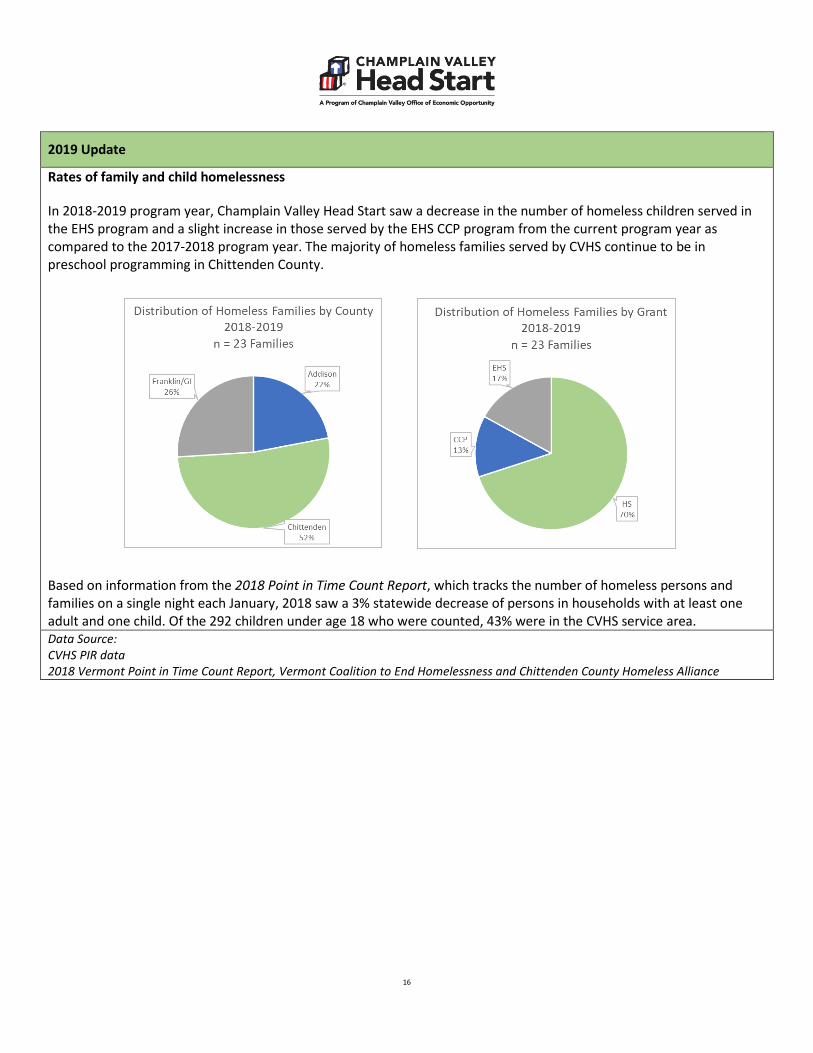
Rates of family and child homelessness In 2018-2019 program year, Champlain Valley Head Start saw a decrease in the number of homeless children served in the EHS program and a slight increase in those served by the EHS CCP program from the current program year as compared to the 2017-2018 program year. The majority of homeless families served by CVHS continue to be in preschool programming in Chittenden County. Based on information from the 2018 Point in Time Count Report, which tracks the number of homeless persons and families on a single night each January, 2018 saw a 3% statewide decrease of persons in households with at least one adult and one child. Of the 292 children under age 18 who were counted, 43% were in the CVHS service area. Data Source: CVHS PIR data 2018 Vermont Point in Time Count Report, Vermont Coalition to End Homelessness and Chittenden County Homeless Alliance
17
2020 Update
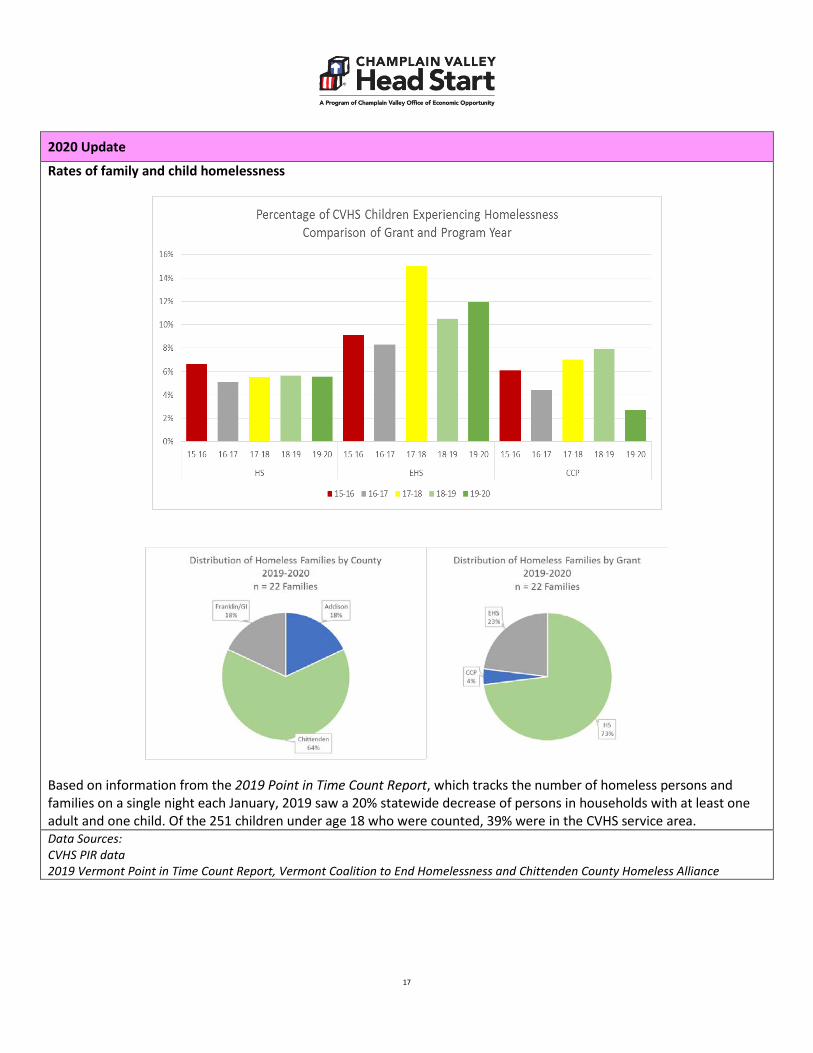
Rates of family and child homelessness
Based on information from the 2019 Point in Time Count Report, which tracks the number of homeless persons and families on a single night each January, 2019 saw a 20% statewide decrease of persons in households with at least one adult and one child. Of the 251 children under age 18 who were counted, 39% were in the CVHS service area. Data Sources: CVHS PIR data 2019 Vermont Point in Time Count Report, Vermont Coalition to End Homelessness and Chittenden County Homeless Alliance

18
(B) Children in foster care; According to the Vermont Department for Children and Families, Outcomes for Vermonters Report released in January 2017, the numbers of children aged 0-5 in state custody has increased dramatically (132%) since FFY 2010. These children account for almost 40% of all children in state custody. While the majority of children in Vermont are being raised by a biological, step, or adopted caregiver, there are growing populations being raised by grandparents, relatives, or foster caregivers.
For the CVHS service region, the rate of children in state custody is highest in Franklin/Grand Isle Counties (Source: Building Bright Futures, How are Vermont’s Young Children and Families, published in December, 2016).
Children enrolled in Early Head Start services are more likely to be in foster care at some point during their enrollment.

19
2019 Update
Children in foster care According to How are Vermont’s Young Children, the rate of children under the age of 9 going into protective custody continues to rise. The rate of children under the age of 3 in protective custody rose from 8.1 (per 1,000) in 2012 to 15.4 (per 1,000) in 2016. The figure below was taken from the Annual Report on Outcomes for Vermonters released in January of 2019. It notes the total number of children in custody by federal fiscal year. The report notes that according to FSD Social Workers, 50% of children 0-5 came into custody as a result of opioid abuse in the family.
The majority of CVHS children in foster care are enrolled in the Early Head Start Child Care Partnership program.
Data Source: CVHS PIR data How are Vermont’s Young Children and Families, Building Bright Futures, 2018 Report Annual Report on Outcomes for Vermonters, Vermont Department for Children and Families, January 2019

20
2020 Update
Children in foster care According to How are Vermont’s Young Children, the rate of children under the age of 9 rose slightly between 2018 and 2019. About half of children in protective custody are eventually reunified with their biological families (Annual Report on Outcomes for Vermonters, January 2020)
The majority of CVHS children in foster care continue to be enrolled in the Early Head Start Child Care Partnership program.
Data Source: CVHS PIR data How are Vermont’s Young Children and Families, Building Bright Futures, 2019 Report Annual Report on Outcomes for Vermonters, Vermont Department for Children and Families, January 2020

21
(C) Children with disabilities, including types of disabilities and relevant services and resources provided to these children by community agencies;
I had no idea how unbelievably helpful my community could be until I had a child with Autism. ~Head Start Parent, CVHS Community Assessment Survey, 2017
1. Estimated number of children with disabilities five years old or younger
Total Number of One Plans (IFSPs) for Children Ages 0-3
County 2009-2010 2010-2011 2011-2012 2012-2013 2013-2014 2014-2015 2015-2016 2016-2017 Addison 25 26 25 35 40 38 47 46 Chittenden 139 198 173 183 224 207 329 357 Franklin & GI 59 55 63 70 67 74 116 92
Data Source: www.dcf.vermont.gov Part C Public Reporting
2020 Update
Public Reporting of IDEA Part C Data - Vermont Department for Children and Families has recently updated systems for data collection and public reporting of data related to Part C of IDEA. Each year, Vermont reports the number of infants and toddlers with an IFSP on December 1. The chart below is the new format for reporting this Child Count data. The chart above was compiled using Child Count and information from the Part C database, which was sometimes reported using the state fiscal year of July 1 to June 30 and also included special collections.
Number of Infants and Toddlers Active on December 1 (birth to 3 years old)
2015 2016 2017 2018 Addison 43 34 54 58 Chittenden 227 245 271 265 Franklin & GI 82 86 97 94 Statewide 896 959 1048 1063
Data Source: https://dcf.vermont.gov/sites/dcf/files/CDD/Reports/Part_C/CIS-Determinations-Data.pdf Chittenden County: Chittenden County serves approximately 26% of the birth to three population in Vermont. Although the child count data in the table above was not found for each of the counties, the Chittenden County CIS team provided the following numbers: In 2015 there were 227 children with One Plans during the point in time (12/1/15) child count collection and in 2016 there were 241 children with One Plans (12/1/16). This totals a 36% increase in the number of children with One Plans over the past six years.
Percent of Population who are Children with Disabilities Ages 3-5
Vermont (%) 2011-2012
Vermont (%) 2012-2013
Vermont (%) 2013-2014
Vermont (%) 2014-2015
Nation (%) 2013-2014
Nation (%) 2014-2015
8.9 9.5 9.5 9.9 8.7 6.3 Data Source: http:/www.ideadata.org Data reported for the IDEA 2014 Child Count

22
Number of Children with an IEP by Supervisory Union 2007 to 2015
Supervisory Union/ School District
Child Count as of December 1 2009 2010 2011 2012 2013 2014 2015
Addison County Addison Northeast 37 32 37 28 23 28 21 Addison Northwest *** *** 15 *** *** 12 14 Addison Central 42 45 45 50 53 42 39 Chittenden County Colchester 31 33 40 62 51 46 48 Milton 37 41 44 36 47 46 51 Chittenden East 44 50 45 40 40 38 47 Chittenden Central 33 34 34 33 31 27 27 Chittenden South 75 64 70 70 60 62 66 Burlington 84 81 97 87 84 103 47 South Burlington 31 31 26 31 37 43 44 Winooski 29 37 34 29 19 22 25 Essex Town 29 29 34 36 32 44 48 Franklin & GI Counties Franklin Northeast 30 35 39 45 34 35 28 Franklin Northwest 54 54 47 50 54 55 49 Franklin West 39 39 31 32 41 35 44 Franklin Central 65 69 63 57 45 52 52 Grand Isle 21 20 20 25 21 24 18 Data Source: www.dcf.vermont.gov AOE Public Reporting *** Indicates a suppressed number less than 11

23
Based on the data set forth above, as of 12/1/15, the largest groupings of children with disabilities ages 3-5 in the CVHS service region are as follows:
Number of Children with Disabilities ages 3-5
Supervisory union / school district Towns served Number of Children
Addison County
Addison Central Supervisory Union Bridport, Cornwall, Middlebury, Ripton, Salisbury, Shoreham and Weybridge 39
Addison Northeast Supervisory Union Bristol, Lincoln, Monkton, New Haven and Starksboro 21
Chittenden County Burlington School District Burlington
Chittenden South Supervisory Union Charlotte, Hinesburg, Shelburne, Williston and St. George 66
Milton School District Milton 51 Colchester School District Colchester 48 Essex Town School District Essex Town 48
Chittenden East Supervisory Union Richmond, Bolton, Huntington, Jericho, Jonesville, Underhill, and Underhill Center 47
South Burlington School District South Burlington 44 Chittenden Central Supervisory Union Essex Junction and Westford 27 Winooski School District Winooski 25 Franklin & GI Counties Franklin Central Supervisory Union Fairfield, St. Albans City and St. Albans Town 52 Franklin Northwest Supervisory Union Franklin, Highgate, Sheldon and Swanton 49 Franklin West Supervisory Union Fairfax, Fletcher and Georgia 44
Franklin Northeast Supervisory Union Bakersfield, Berkshire, Enosburg Falls, Montgomery and Richford 28
Grand Isle Supervisory Union Alburg, Grand Isle, Isle La Mott, North Hero and South Hero 18
Data Source: www.dcf.vermont.gov AOE Public Reporting

24
2. Types of Disabilities The Essential Early Education Consultant for the Vermont Agency of Education has indicated that children found eligible for special education services by EEE are generally listed under the category of Developmental Delay (See 2360.5.3 and 2361 VT DOE Special Ed regulations for additional detail) or Medical Diagnosis.
Percent of Children with Disabilities by Disability Category Ages 3-5
Disability Category Vermont (%) 2012
Vermont (%) 2013
Vermont (%) 2014
Nation (%) 2012
Nation (%) 2013
Nation (%) 2014
All Disabilities 100 100 100 100 100 100 Autism 3.66 3.3 2.3 7.77 8.4 8.9 Developmental Delay 92.9 93.3 93.7 37.22 37.9 37 Emotional Disturbance X X X X X X Hearing Impairment X X X 1.26 1.2 1.2 Intellectual Disability X X X 1.95 1.9 1.9 Multiple Disability X X X 1.1 1 1.1 Orthopedic Impairment X X X X X X
Other Health Impairment 1.04 1.4 1.3 2.87 3.1 3.1
Specific Learning Disabilities X X X 1.17 1.2 1.4
Speech/Language Impairment 1.42 X 1.5 44.86 44.2 43.7
Traumatic Brain Injury X X X X X X Visual Impairment X X X X X X X indicates less than 1% Data Source: http:/www.ideadata.org Data reported for IDEA Child Count

25
Children with Developmental Delay Diagnosis: Percent of Children by Area of Delay 12/1/2014
Supervisory Union
Receptive and/or Expressive Delay (%)
Social and/or Emotional Development (%)
Adaptive, Physical Delay, or other (%)
Cognitive Skills (%)
Any Combination of 2 or more areas (%)
Not Applicable (not Developmental Delay) (%)
Addison Northeast 32.14 X X X 67.86 X
Addison Northwest 50 8.33 X X 33.3 8.33
Addison Central 33.33 7.14 4.76 X 52.38 2.83 Burlington 42.7 2.91 1.94 1.94 40.78 8.74 Colchester 60.87 4.35 X 34.78 Chittenden East 84.21 2.63 X X 5.26 7.89 Chittenden Central 40.74 3.7 X X 33.33 18.52
Chittenden South 72.58 X X X 27.42 X
Essex 20.45 6.82 5.45 X 56.82 6.82 Milton 13.04 2.17 X 45.65 36.96 South Burlington 39.53 2.33 4.55 X 48.84 9.3 Winooski 27.27 4.55 9.09 X 31.82 22.73 Franklin Central 55.77 1.92 1.92 X 36.54 3.85 Franklin Northeast 54.29 5.71 X X 40 X
Franklin Northwest 54.55 X 7.27 X 34.55 3.64
Franklin West 65.71 X X X 31.43 2.86 Grand Isle 62.5 8.33 12.5 X 8.33 4.17 Data Source: Information provided by Kate Rogers, VT EEE from 12.1.2014 count

26
Autism Spectrum Disorders:
Vermont Children with Autism Diagnosis in 2000-2001 and 2014-2015 (Child Count by Age Group)
2000-2001 2014-2015 Ages 3-5 14 41 Ages 6-21 160 963 Ages 3-21 174 1,004 Data Source: State of Vermont in accordance with Section 618 of IDEA to U.S. Department of Education, OSEP In 2014, CDC released estimates indicating that about 1 in 68 children has been identified with ASD (or 14.7 per 1,000 8-year-olds). In March 2016, a new report indicated that rates continued to hold at an estimated 1 in 68 (14.6 per 1,000) school-aged children identified with autism spectrum disorder (ASD). Although the CDC reports show essentially no change in ASD prevalence in these two reports, it is considered too soon to know whether ASD prevalence in the United States might be starting to stabilize. CDC will continue tracking ASD prevalence to better understand changes over time. CDC research finds that even though ASD can be diagnosed as early as age 2 years, most children are not diagnosed with ASD until after age 4 years. The median age of first diagnosis by subtype is as follows.
• Autistic disorder: 3 years, 10 months • Pervasive developmental disorder-not otherwise specified (PDD-NOS): 4 years, 1 month • Asperger disorder: 6 years, 2 months
Number of children with an IFSP (ages 0-3) with a diagnosis of Autism
County Child Count 2005 2006 2007 2008 2009 2010 2011 2012
Addison 5 3 4 2 1 1 1 3 Chittenden 11 11 24 25 27 20 15 10 Franklin & GI 3 4 10 6 3 5 3 6 Data Source: Provided by Kathy Boulanger, VT Part C Administrative Assistant

27
3. Relevant services and resources provided to children with special needs by community agencies Eligible children are provided early intervention services as outlined in their Individual Family Service Plan (IFSP) or Individual Education Program (IEP).
Relevant services and resources provided to children with special needs by community agencies
Agencies CIS
(ages 0-3) EEE
(ages 3-5) Additional Services and
Supports for ASD Vermont Family Network
− Assistive Technology − Audiology − Family Education and
Training − Medical Evaluation − Nursing − Nutrition − Occupational Therapy − Physical Therapy − Psychology Services − Social Work − Speech − Transportation − Vision Services − Special Instruction Group − Special Instruction
Individual − Respite
− Case Management − Team Meetings − Consultation − Developmental and
Assistive Therapy − Occupational Therapy − Physical Therapy − Personal Care − Preschool − Social/emotional and
adaptive skills intervention − Speech/language services
Vermont Child Development Clinic and UVM Autism Clinic: − diagnostic and follow up
services
Mental Health and Developmental Services Agencies home and community based services: − 1:1 Autism Behavior
Interventionist − Behavior Specialist − Autism Specialist − Adaptive and Expressive
Arts Program − Autism Family Support
Consultation − Functional Life Skills
Consultation − 24 hour Crisis Support
Autism Support Daily: − Guidance, Support, and
Information − Financial Assistance for
medical, educational, or professional services
Statewide network of support and advocacy related to special education; Families are matched with trained parent volunteers who provide information, resources, and emotional support
Data Sources: Vermont AOE and DCF websites; Vermont State Profile compiled by L&M Policy Research published January 24th, 2014 (www.LMpolicyresearch.com)

28
Educational Environment for Children Ages 3-5 with IEPs
Regular early ed > 10 hrs/week
Regular early ed < 10 hrs/week
Not attending programming
Services provided in
program
Services provided in
another location
Services provided in
program
Services provided in
another Location
Services provided at
home
Services provided at
service provider location
Addison County Addison Northeast 19 *** 0 0 *** *** Addison Northwest *** *** *** 0 *** 0 Addison Central 42 *** *** 0 *** *** Chittenden County Colchester 32 *** 13 0 0 *** Milton 21 13 11 *** *** 0 Chittenden East 32 *** *** 0 0 *** Chittenden Central 12 *** *** *** 0 *** Chittenden South 42 *** 16 0 0 *** Burlington 65 *** 0 *** 0 *** South Burlington 12 *** 13 *** 0 *** Winooski 15 *** *** 0 0 *** Essex Town 18 *** *** *** 0 *** Franklin & GI Counties Franklin Northeast *** *** 11 *** *** 0 Franklin Northwest *** 0 *** 0 31 15 Franklin West 15 *** 18 0 *** *** Franklin Central 28 *** *** *** *** *** Grand Isle 13 0 0 *** *** *** *** Indicates a suppressed number less than 11 Data Source: VT AOE website, Special Education Data Reports
29
2020 Update
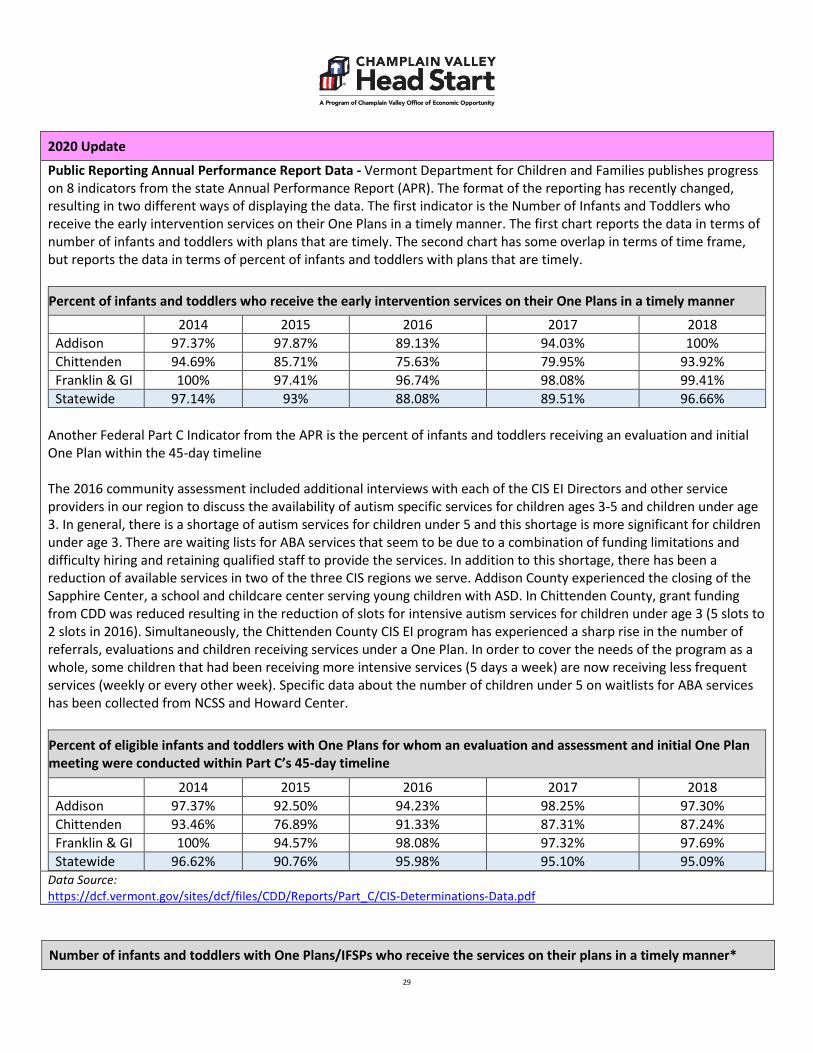
Public Reporting Annual Performance Report Data - Vermont Department for Children and Families publishes progress on 8 indicators from the state Annual Performance Report (APR). The format of the reporting has recently changed, resulting in two different ways of displaying the data. The first indicator is the Number of Infants and Toddlers who receive the early intervention services on their One Plans in a timely manner. The first chart reports the data in terms of number of infants and toddlers with plans that are timely. The second chart has some overlap in terms of time frame, but reports the data in terms of percent of infants and toddlers with plans that are timely.
Percent of infants and toddlers who receive the early intervention services on their One Plans in a timely manner
2014 2015 2016 2017 2018 Addison 97.37% 97.87% 89.13% 94.03% 100% Chittenden 94.69% 85.71% 75.63% 79.95% 93.92% Franklin & GI 100% 97.41% 96.74% 98.08% 99.41% Statewide 97.14% 93% 88.08% 89.51% 96.66%
Another Federal Part C Indicator from the APR is the percent of infants and toddlers receiving an evaluation and initial One Plan within the 45-day timeline The 2016 community assessment included additional interviews with each of the CIS EI Directors and other service providers in our region to discuss the availability of autism specific services for children ages 3-5 and children under age 3. In general, there is a shortage of autism services for children under 5 and this shortage is more significant for children under age 3. There are waiting lists for ABA services that seem to be due to a combination of funding limitations and difficulty hiring and retaining qualified staff to provide the services. In addition to this shortage, there has been a reduction of available services in two of the three CIS regions we serve. Addison County experienced the closing of the Sapphire Center, a school and childcare center serving young children with ASD. In Chittenden County, grant funding from CDD was reduced resulting in the reduction of slots for intensive autism services for children under age 3 (5 slots to 2 slots in 2016). Simultaneously, the Chittenden County CIS EI program has experienced a sharp rise in the number of referrals, evaluations and children receiving services under a One Plan. In order to cover the needs of the program as a whole, some children that had been receiving more intensive services (5 days a week) are now receiving less frequent services (weekly or every other week). Specific data about the number of children under 5 on waitlists for ABA services has been collected from NCSS and Howard Center.
Percent of eligible infants and toddlers with One Plans for whom an evaluation and assessment and initial One Plan meeting were conducted within Part C’s 45-day timeline
2014 2015 2016 2017 2018 Addison 97.37% 92.50% 94.23% 98.25% 97.30% Chittenden 93.46% 76.89% 91.33% 87.31% 87.24% Franklin & GI 100% 94.57% 98.08% 97.32% 97.69% Statewide 96.62% 90.76% 95.98% 95.10% 95.09%
Data Source: https://dcf.vermont.gov/sites/dcf/files/CDD/Reports/Part_C/CIS-Determinations-Data.pdf
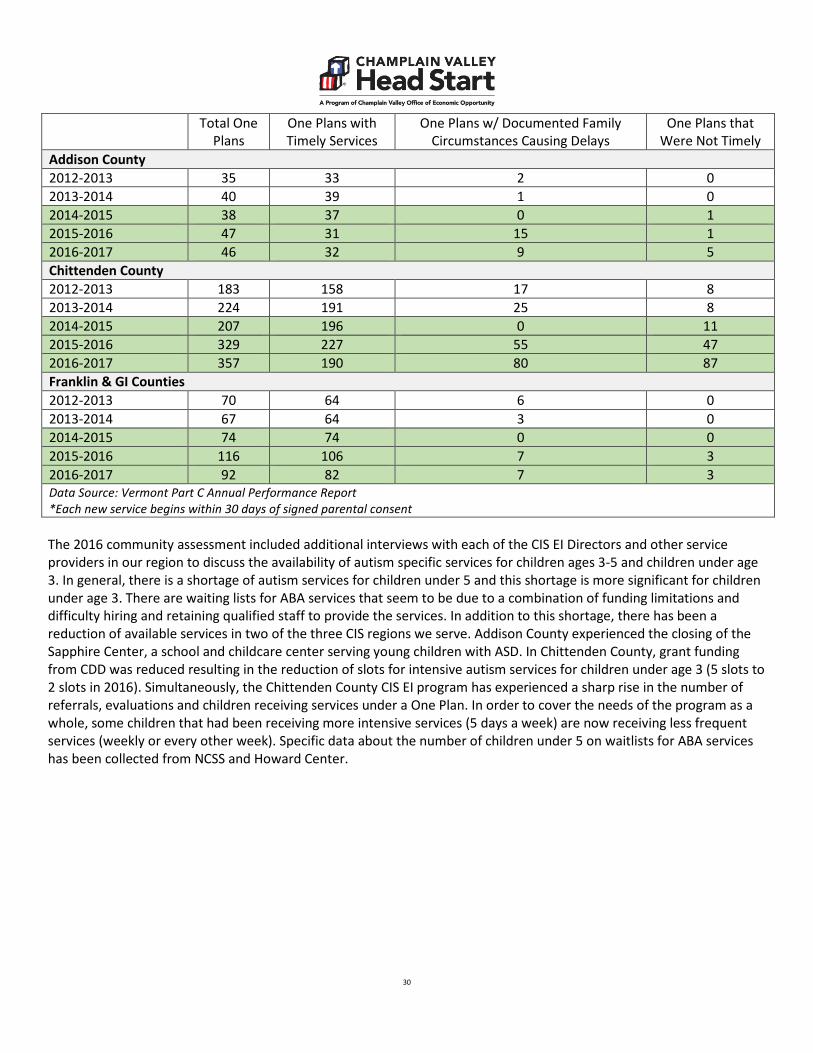
Number of infants and toddlers with One Plans/IFSPs who receive the services on their plans in a timely manner*
30
Total One Plans
One Plans with Timely Services
One Plans w/ Documented Family Circumstances Causing Delays
One Plans that Were Not Timely
Addison County 2012-2013 35 33 2 0 2013-2014 40 39 1 0 2014-2015 38 37 0 1 2015-2016 47 31 15 1 2016-2017 46 32 9 5 Chittenden County 2012-2013 183 158 17 8 2013-2014 224 191 25 8 2014-2015 207 196 0 11 2015-2016 329 227 55 47 2016-2017 357 190 80 87 Franklin & GI Counties 2012-2013 70 64 6 0 2013-2014 67 64 3 0 2014-2015 74 74 0 0 2015-2016 116 106 7 3 2016-2017 92 82 7 3 Data Source: Vermont Part C Annual Performance Report *Each new service begins within 30 days of signed parental consent The 2016 community assessment included additional interviews with each of the CIS EI Directors and other service providers in our region to discuss the availability of autism specific services for children ages 3-5 and children under age 3. In general, there is a shortage of autism services for children under 5 and this shortage is more significant for children under age 3. There are waiting lists for ABA services that seem to be due to a combination of funding limitations and difficulty hiring and retaining qualified staff to provide the services. In addition to this shortage, there has been a reduction of available services in two of the three CIS regions we serve. Addison County experienced the closing of the Sapphire Center, a school and childcare center serving young children with ASD. In Chittenden County, grant funding from CDD was reduced resulting in the reduction of slots for intensive autism services for children under age 3 (5 slots to 2 slots in 2016). Simultaneously, the Chittenden County CIS EI program has experienced a sharp rise in the number of referrals, evaluations and children receiving services under a One Plan. In order to cover the needs of the program as a whole, some children that had been receiving more intensive services (5 days a week) are now receiving less frequent services (weekly or every other week). Specific data about the number of children under 5 on waitlists for ABA services has been collected from NCSS and Howard Center.

31
2019 Update
Impact of Staff Turnover The 2019 Community Assessment notes significant turnover among Children’s Integrated Services staff in Chittenden and Addison counties in recent years. Chittenden county has reported staff vacancies that remained unfilled for long periods of time and acknowledged the impact this had on the services to children and families. Children’s services have been reduced in frequency (1/every other week when 1/weekly is recommended, or 1/monthly when 1/every other week is recommended) and children have been put on waitlists for services (such as speech evaluation). The most recent data on number of infants and toddlers who receive their services in a timely manner (chart above), shows a spike in the number of One Plans with services that were not timely. Data Source: Interviews with CIS EI Directors and personnel
32
(ii) The education, health, nutrition and social service needs of eligible children and their families, including prevalent social or economic factors that impact their well-being;
Interest, commitment, care.
~Head Start Parent, CVHS Community Survey 2017 1. Education Needs of Children To assess the needs of Head Start eligible children and families, CVHS conducted surveys among eligible families and child/family services agencies, and collected information from various state and community data sources. This data was collected during winter 2017. With respect to education needs of children, families and community partners were asked to choose the five most important skills or attributes a child should have to be ready for school and experience success as a lifelong learner. In preparing infants and toddlers to enter preschool, both families and community partners agreed that one of the five most important attributes was beginning to learn & follow rules. Parents also expressed the importance of beginning to use words for conversation, communication, and describing what they are thinking and doing; demonstrating healthy and safe habits; and gross motor skills. Community partners shared the importance of infants and toddlers beginning to show curiosity or an eagerness to explore the world around them; engaging in positive relationships and interaction with adults; beginning to develop and show control over feelings and behaviors; and beginning to develop personal relationships with peers as important attributes when entering preschool. Three of the top five indicators for children’s kindergarten readiness, identified by both parents and community partners, were:
• children’s ability to cooperate and take turns; • children’s language skills; and • children’s ability to pay attention
Families also expressed the importance of children’s fine motor development and knowledge of letters and numbers as important skills children should have when entering kindergarten. Community partners expressed their desire for children to be curious learners and physically healthy when entering kindergarten. In preparing young children for kindergarten, we strive to provide an early education experience that is based on sound child development principles regarding how children grow and learn. CVHS will continue to work collaboratively with families and community partners to transition children to kindergarten ready to learn.
33
2. Education Needs of Adults
This is important to obtain employment. ~Head Start Parent, CVHS Community Survey 2017
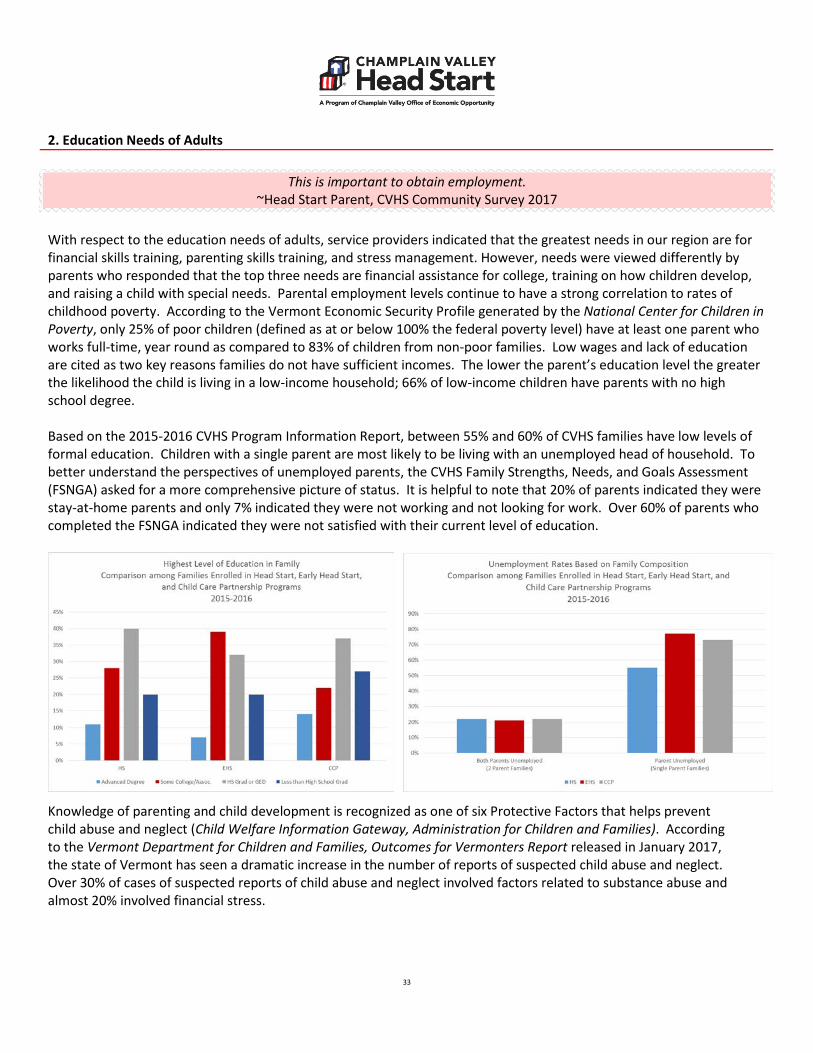
With respect to the education needs of adults, service providers indicated that the greatest needs in our region are for financial skills training, parenting skills training, and stress management. However, needs were viewed differently by parents who responded that the top three needs are financial assistance for college, training on how children develop, and raising a child with special needs. Parental employment levels continue to have a strong correlation to rates of childhood poverty. According to the Vermont Economic Security Profile generated by the National Center for Children in Poverty, only 25% of poor children (defined as at or below 100% the federal poverty level) have at least one parent who works full-time, year round as compared to 83% of children from non-poor families. Low wages and lack of education are cited as two key reasons families do not have sufficient incomes. The lower the parent’s education level the greater the likelihood the child is living in a low-income household; 66% of low-income children have parents with no high school degree. Based on the 2015-2016 CVHS Program Information Report, between 55% and 60% of CVHS families have low levels of formal education. Children with a single parent are most likely to be living with an unemployed head of household. To better understand the perspectives of unemployed parents, the CVHS Family Strengths, Needs, and Goals Assessment (FSNGA) asked for a more comprehensive picture of status. It is helpful to note that 20% of parents indicated they were stay-at-home parents and only 7% indicated they were not working and not looking for work. Over 60% of parents who completed the FSNGA indicated they were not satisfied with their current level of education.
Knowledge of parenting and child development is recognized as one of six Protective Factors that helps prevent child abuse and neglect (Child Welfare Information Gateway, Administration for Children and Families). According to the Vermont Department for Children and Families, Outcomes for Vermonters Report released in January 2017, the state of Vermont has seen a dramatic increase in the number of reports of suspected child abuse and neglect. Over 30% of cases of suspected reports of child abuse and neglect involved factors related to substance abuse and almost 20% involved financial stress.

34
3. Health Needs
Dr. Dynasaur covers full dental costs for children. I think the need is getting parents to bring their children to the dentist regularly.
~Community Service Provider, CVHS Community Survey 2017 The American Academy of Pediatrics’ 2016 report, Poverty and Child Health in the United States, states that one of the key ways to ameliorate the effects of child poverty is by providing access to comprehensive health care. Also included is access to early childhood education. CVHS addresses both of these. In terms of health needs, CVHS adult family members identified the three least accessible community health needs as adult services for dental, vision and health insurance on the 2016-2017 Community Assessment. Children’s dental services and health insurance were identified as the two most accessible community health needs. 56.7% of Vermont children ages 0-18 were enrolled in Medicaid/CHIP (Dr. Dynasaur) according to data from Voices for Vermont’s Children from 2015-2017. Dr. Dynasaur covers children up to 300% of the Federal Poverty Level (FPL). This number is up from 41.9% in 2009, a 35,3% increase. For individual counties in the CVHS catchment area, the 2015-2017 rates were as follows: 53.7% - Addison; 40.8% - Chittenden; 54.9% - Franklin; and 57.1% - Grand Isle. Significant increases in participation were due to Vermont’s CHIP expansion in 2014. Participation by eligible children in Dr. Dynasaur was at 98.7% in 2015 based on data from www.insurekidsnow.gov. This is up from 94.3% in 2013. Approximately 98% of VT children are covered by health insurance, compared to 95% nationally (www.datacenter.kidscount.org). Availability and accessibility of health insurance for children is a significant strength in Vermont. Adults with incomes up to 138% of the FPL are also eligible for Medicaid health insurance, as are pregnant women with incomes up to 208% of the FPL. Pregnant women continue with benefits, including 100% coverage of dental, up to 60 days post-delivery. There has been a 47% reduction in the uninsured rate from 2013 to 2015 in Vermont due to increased coverage from the Affordable Care Act. Prior to ACA implementation, 7.2% of Vermonter’s were uninsured. By 2015, the rate was 3.8%, the 2nd lowest uninsured rate in the country. In 2017, 4.6% of Vermont residents were uninsured (www.healthinsurance.org). Access to Medicaid health insurance for adults is also a strength in Vermont. 2017 data from the Child Trends Databank show that well child exams track inversely with income, highest level of parental education, and child’s age. 82% of children whose parent(s) did not complete high school, or a GED, had a well child exam in the previous year. Completing high school, or a GED, moved that percentage to 88. 89% of children whose parents had some college completed a well child exam, and 95% of children who parents had a 4 year degree had an annual well child exam. Data from 2013 showed that children with a foreign-born parent had lower rates of well child exams: 83% for children of foreign-born parents, versus 92% with no foreign-born parent. Children’s oral health needs are affected by many factors: availability of dentists, including pediatric dentists and other specialty providers; insurance coverage; education level of parents; socioeconomic status; community water fluoridation status; and frequency of preventative dental visits. In American Academy of Pediatric Dentists’ “The State of Little Teeth”, it is noted that by age 3, 5-10% of US children have oral health issues. By the age of 6, about 60% of children have had caries at some point, and 40% will have them when they enter kindergarten. The percent of untreated decay varies inversely with family income, from 9% for children in higher income families, up to 28% for children living in families with the lowest incomes. Children from families with the lowest incomes also miss the most days of school

35
annually due to dental problems, with an average of 14 days missed per 100 children. Children from the highest income category miss an average of less than 1 day per 100 children annually. A declining population of dentists in Vermont, along with a limited number of dentists who accept Medicaid patients, creates access problems for low income families. The 2015 Vermont Department of Health Dentist Survey – March 2018 (VDHDS) found that there were 299 general and 14 pediatric dentists in the state. 48% of dentists in the state were 55 years old or older. 24% were 65 and older. The same report also indicated that in 2015, only 60% of dentists in Vermont accepted new Medicaid patients, a drop from 69% in 2011. The ratio of dentists per 100,000 population by county ranged from 46.5 in Chittenden County, to 35.1 in Franklin, 34.1 in Addison, and 11.3 in Grand Isle. 36.7% of children covered by Medicaid in 2014 did not receive any oral health care, down from 41.5% in 2010 (The State of Our Children: KIDS Count in Vermont Health Report, 2014 (SOC)). As noted in the 2014 VT Oral Health Plan, “Children living below the federal poverty line suffer far more dental caries than their wealthier counterparts and their disease is more likely to be untreated.” Finally, in the American Academy of Pediatric Dentists’ “State of Little Teeth” report, there continues to be a gap between caregivers’ knowledge of best dental practices and actions. 60% of caregivers know to take their 1 year old to the dentist, however, only 25% do it. In addition, Vermont’s Office of Oral Health completed a dental practice survey of Medicaid providers and asked at what age they recommended children be seen for the first dental appointment. Survey results showed 44% for age 1, 21% for age 2, 31% for age 3, and 4% for ages 4 or older. Many dental providers will not see 1 year olds. On a positive note, primary cities and towns in the CVHS catchment areas now all have dental providers who will accept 1 year olds with Medicaid/CHIP insurance. This is a result of a new pediatric dentist opening a practice in Middlebury, and a dentist in St. Albans opening the office to the same demographic. Fluoridated community water supplies are considered to be one of the top ten public health achievements in the 20th century, saving $38 in dental costs for every $1 spent on fluoridation. Only 56.2% of Vermont’s community water supplies are fluoridated, versus a national average of 72.4% (Vermont’s State Health Improvement Plan, 2019-2023, Data from 2017). Also supporting the importance of fluoride, in January 2008, the American Academy of Public Health Dentistry adopted a resolution on fluoride varnish for caries prevention, particularly those children living below the federal poverty level, who have a significantly higher burden of oral disease. One in three women who needed to see a dentist for an oral health problem during pregnancy did not receive treatment (The 2013 Burden of Oral Disease in Vermont, BODV). “Those who did not receive care tended to be younger, have less than a high school education, have a low income, be unmarried, and a WIC or Medicaid recipient.” 44% of pregnant women who were <100%FPL received a dental cleaning, compared to 79% for those who were >200+ FPL. External data supports additional health needs: increased rates of immunization; improved screening and treatment for blood lead levels; transportation, and improved health literacy. One of Vermont’s 3 state health improvement goals is to improve childhood immunization rates (SHIP). “A person who is fully immunized is protected against vaccine preventable disease or severe illness, and helps protect the community from disease outbreaks.” 2015 data from Voices for Vermont’s Children show that Vermont has a 76% immunization rate for children age 19-35 months, compared to a national average of 75% nationally (www.datacenter.kidscount.org), not including Hepatitis A. The Healthy Vermonters 2020 goal for this population is 80%. The Hepatitis A immunization rate for Vermont 19-35 month olds is currently at 74% based on 2016 data (CDC). Lead exposure from prenatal to age six poses serious long-term health consequences, such as learning disabilities, behavioral challenges, reduced cognitive abilities and poisoning. Early childhood exposures to lead bring about a degradation in learning potential (Early Childhood Lead Exposure and Academic Achievement: Evidence from Detroit Public Schools, 2008-2010, American Journal of Public Health, March 2013, AJPH). The odds of scoring “less than proficient” on academic achievement tests in 3rd, 5th and 8th grade are twice as high for those with early childhood lead levels above 10 µg/dl compared to those with levels at 1 µg/dl or lower. Increased probability of “less than

36
proficient” scores was also significant at blood lead levels between 5-9 µg/dl. The CDC’s childhood lead poisoning data from 2015 indicated the following number of tested children in CVHS’s catchment area with elevated lead:
Tested Children in CVHS’s Catchment Area with Elevated Lead
County # Tested # 5-9 µg/dl # 10 or more µg/dl Elevated Addison 278 24 0 8.6% Chittenden 1771 61 4 3.7% Franklin 475 28 4 6.7% Grand Isle 70 4 0 5.7% Data source: CDC https://www.cdc.gov/nceh/lead/data/state/vtdata.htm - 2011-2015 Vermont’s EPSDT schedule for Medicaid children includes blood-level testing at 12 and 24 months. Data show that 77% of 12 month olds were tested in 2017 in Vermont, and 68% of 24 month olds were tested (Lead Poisoning Prevention: Report on 2017 Program Outcomes and Activities—a report to the VT Legislature). 412 of these children had an elevated blood lead level. Lead paint and dust from older homes are the primary means of exposure for young children. Housing that was built prior to 1978, the year that a ban on lead paint was implemented, makes up 70% of Vermont’s housing stock. Lastly, health literacy, the ability to get and use basic health information and access services, is critical to good health. 60% of U.S. adults who receive Medicaid would have difficulty with basic health activities such as following directions on prescription medication, or understanding their child’s immunization schedule according to a 2003 U.S. Department of Health & Human Services report. Children with parents who have limited literacy skills are more likely to have decreased access to primary preventative care, to have unmet health needs, and to more frequently utilize the emergency room unnecessarily (American Academy of Pediatrics, Sanders, et al, 2009). The Fletcher Allen Health Care Community Health Needs Assessment 2013, also highlights the additional health literacy barrier for new Americans due to language. Community leader interviews noted, “They cannot understand their health care provider, to say nothing of the health care or insurance systems.” This same assessment found a high need for transportation for accessing health care services.
37
4. Mental Health Needs
If parents are unwell, the children grow up seeing this level of unwell as normal, and that becomes the new normal. ~Community Service Provider, CVHS Community Survey 2017
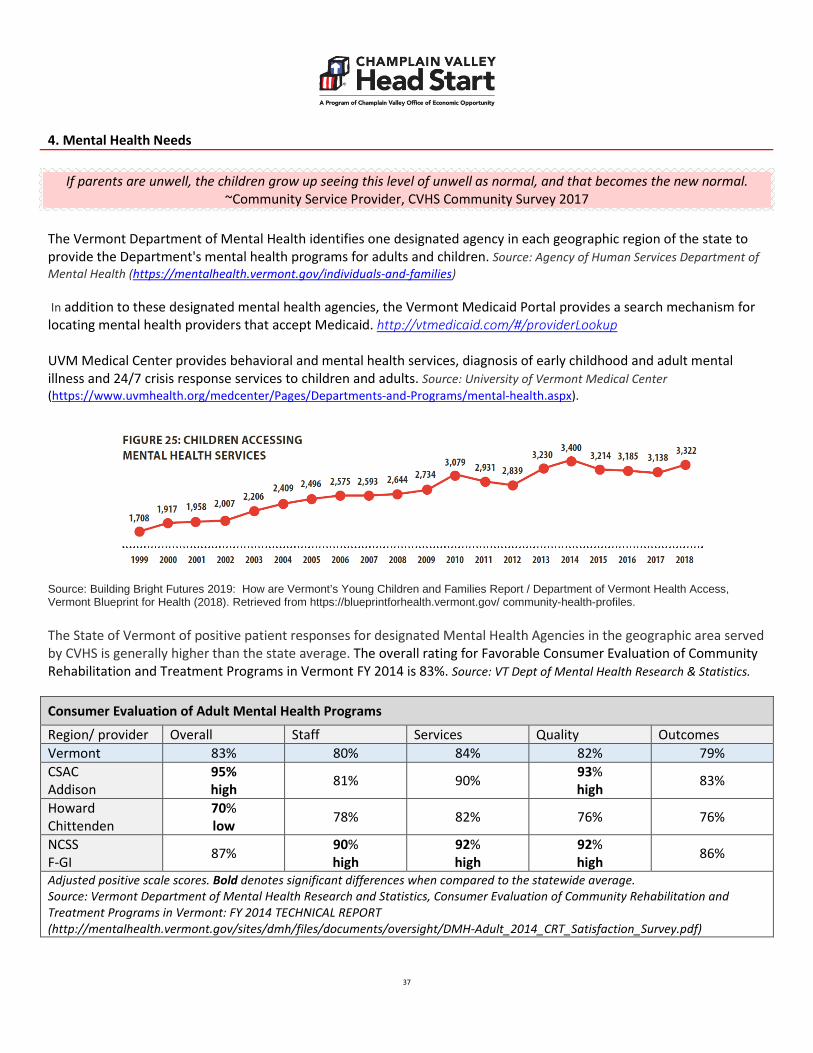
The Vermont Department of Mental Health identifies one designated agency in each geographic region of the state to provide the Department's mental health programs for adults and children. Source: Agency of Human Services Department of Mental Health (https://mentalhealth.vermont.gov/individuals-and-families) In addition to these designated mental health agencies, the Vermont Medicaid Portal provides a search mechanism for locating mental health providers that accept Medicaid. http://vtmedicaid.com/#/providerLookup UVM Medical Center provides behavioral and mental health services, diagnosis of early childhood and adult mental illness and 24/7 crisis response services to children and adults. Source: University of Vermont Medical Center (https://www.uvmhealth.org/medcenter/Pages/Departments-and-Programs/mental-health.aspx).
Source: Building Bright Futures 2019: How are Vermont’s Young Children and Families Report / Department of Vermont Health Access, Vermont Blueprint for Health (2018). Retrieved from https://blueprintforhealth.vermont.gov/ community-health-profiles. The State of Vermont of positive patient responses for designated Mental Health Agencies in the geographic area served by CVHS is generally higher than the state average. The overall rating for Favorable Consumer Evaluation of Community Rehabilitation and Treatment Programs in Vermont FY 2014 is 83%. Source: VT Dept of Mental Health Research & Statistics.
Consumer Evaluation of Adult Mental Health Programs
Region/ provider Overall Staff Services Quality Outcomes Vermont 83% 80% 84% 82% 79% CSAC Addison
95% high 81% 90% 93%
high 83%
Howard Chittenden
70% low 78% 82% 76% 76%
NCSS F-GI 87% 90%
high 92% high
92% high 86%
Adjusted positive scale scores. Bold denotes significant differences when compared to the statewide average. Source: Vermont Department of Mental Health Research and Statistics, Consumer Evaluation of Community Rehabilitation and Treatment Programs in Vermont: FY 2014 TECHNICAL REPORT (http://mentalhealth.vermont.gov/sites/dmh/files/documents/oversight/DMH-Adult_2014_CRT_Satisfaction_Survey.pdf)

38
Parent Evaluation of Child and Adolescent Mental Health Programs Care
Region/ provider Overall Staff Services Quality Outcomes Vermont 82% 88% 87% 83% 65% CSAC Addison 76% 85% 78% 76% 63%
Howard Chittenden 86% 89% 90% 88% 74%
high NCSS F-GI
90% high
96% high
94% high
92% high 71%
Adjusted positive scale scores. Bold denotes significant differences when compared to the statewide average. Source: Vermont Department of Mental Health Research and Statistics, Evaluation of child and adolescent mental health programs by Parents of Children Served in Vermont September – December 2013 TECHNICAL REPORT OCTOBER 2015 (http://mentalhealth.vermont.gov/sites/dmh/files/documents/oversight/DMH-CAFU_2015_Satisfaction_Survey.pdf) Respondents to the CVHS Community Survey included Head Start parents and community providers. The results of the survey indicated that mental and behavioral health services for both children and adults are a high need in the community. The results also indicated that ease of access to mental health services is difficult. Q20 of the survey asked, ‘How high is the need for the following health services for Head Start eligible families?’. Out of 12 community services choices, ‘Mental and Behavioral Health for Children’ was ranked as the 2nd highest health need, while ‘Mental Health for Adults’ was ranked as the 3rd highest health need. Interestingly, Q21 followed up with, ‘How easy is it for Head Start eligible families to access these services?’. Respondents indicated that ‘Mental and Behavioral Health for Children’ was the 6th most accessible service and ‘Mental Health for Adults’ was ranked as the 10th most accessible service. Q20: How high is the need for the following health services for Head Start eligible families?
Q21: How easy is it for Head Start eligible families to access these services?
Choices Rank (of 12 choices)
Choices Rank (of 12 choices)
Mental and Behavioral Health for Children 2nd highest Mental and Behavioral Health
for Children 6th most accessible
Mental Health for Adults 3rd highest Mental Health for Adults 10th most accessible
Source: CVHS 2017 Community Survey Source: CVHS 2017 Community Survey For these two questions, when the CVHS survey results are filtered to separate Parent and Provider responses, there are notable differences, particularly in terms of the need for ‘Mental Health for Adults’. Q20: How high is the need for the following health services for Head Start eligible families?
Q21: How easy is it for Head Start eligible families to access these services?
Choices Responses Rank (of 12 choices)
Choices Responses Rank (of 12 choices)
Mental and Behavioral Health for Children
Parent 4th highest Mental and Behavioral Health for Children
Parent 5th most accessible
Provider 7th highest Provider 6th most accessible
Mental Health for Adults
Parent 4th highest Mental Health for Adults
Parent 8th most accessible
Provider 1st highest Provider 10th most accessible
Source: CVHS 2017 Community Survey Source: CVHS 2017 Community Survey

39
Q26 of the survey asked, ‘How high is the need for the following during and after pregnancy for Head Start eligible families?’ Out of 13 community services choices, ‘Mental Health Support for Parents During and After Pregnancy’ was ranked as the 2nd highest need, while ‘Depression Identification and Support for Parents During and After Pregnancy’ was ranked as the 4th highest need. Q26: How high is the need for the following during and after pregnancy for Head Start eligible families?
Q27: How easy is it for Head Start eligible families to access these services?
Choices Rank (of 13 choices)
Choices Rank (of 13 choices)
Mental Health Support for Parents 2nd highest Mental Health Support for Parents 11th most accessible
Depression Identification/Support for Parents
4th highest Depression Identification/Support for Parents
10th most accessible
Source: CVHS 2017 Community Survey Source: CVHS 2017 Community Survey Q27 followed up with, ‘How easy is it for Head Start eligible families to access these services?’. Respondents indicated that ‘Mental Health Support for Parents During and After Pregnancy’ was the 11th most accessible service (or fourth least accessible) and ‘Depression Identification and Support for Parents During and After Pregnancy’ was ranked as the 10th most accessible service (or third least accessible).

40
Q26 of the survey asked, ‘How high is the need for the following during and after pregnancy for Head Start eligible families?’ Out of 13 community services choices, ‘Mental Health Support for Parents During and After Pregnancy’ was ranked as the 2nd highest need, while ‘Depression Identification and Support for Parents During and After Pregnancy’ was ranked as the 4th highest need. Q26: How high is the need for the following during and after pregnancy for Head Start eligible families?
Q27: How easy is it for Head Start eligible families to access these services?
Choices Rank (of 13 choices)
Choices Rank (of 13 choices)
Mental Health Support for Parents 2nd highest Mental Health Support for Parents 11th most accessible
Depression Identification/Support for Parents
4th highest Depression Identification/Support for Parents
10th most accessible
Source: CVHS 2017 Community Survey Source: CVHS 2017 Community Survey Q27 followed up with, ‘How easy is it for Head Start eligible families to access these services?’. Respondents indicated that ‘Mental Health Support for Parents During and After Pregnancy’ was the 11th most accessible service (or fourth least accessible) and ‘Depression Identification and Support for Parents During and After Pregnancy’ was ranked as the 10th most accessible service (or third least accessible).
41
5. Nutrition Needs
Most people feel like failures as parents for needing these services (WIC, 3Squares, Emergency Food Assistance). It would be nice if they were more accepted in society.
~Community Service Provider, CVHS Community Survey 2017 With respect to nutrition needs, decreases in poverty statewide from 2015 to 2016 have shown a participation decrease in state food and nutrition assistance programs. StateHealthFacts.org reports participation has dropped 5% for 3 Squares between September 2015 and September 2016. The USDA reports a 12.2% drop in WIC participation between November 2015 and November 2016. Despite these decreases, the CVHS Community Assessment survey identified the highest categorical need for families as General Food Assistance (such as 3 Squares & food shelves) and WIC with 71.2% and 68.75% reported it as a “high need” or “most urgent need” respectively). The majority of respondents felt all nutrition services in the survey including food shelves, farmers markets, nutrition education programs, and indoor and outdoor recreation facilities were high or urgent needs for families. The CVHS Family Strengths, Needs, and Goals Assessment (FSNGA) reports that 23.8% of families within CVHS were worried within the last 12 months that they would run out of food before having money to buy more. In addition, 14% of families stated within the past 12 months the food they bought did not last and they did not have money to buy more. Among these families, 91.7% were accessing one of 3 food assistance services (WIC, 3 Squares, Food Shelves). 44.4% were accessing all of the 3 food assistance services. CVHS continues to support and encourage families to access these services. Childhood obesity was not a concern for parents (51%) but was a concern for providers (96%). CVHS growth assessment data showed that 9.3% of children were overweight and an additional 13.7% were obese. Exercise and healthy eating are the focus areas around maintaining healthy BMI levels in children. CVHS incorporates many strategies in the classrooms including focused nutrition activities around fruits and vegetables; meals and snacks daily that are low in fat, sugar, and salt; and daily physical activity including structured curriculum such as the UVM Kiddie CATS program and I Am Moving, I Am Learning. The challenge is extending these healthy behaviors beyond the classroom. CVHS continues to seek strategies for promoting healthy eating and physical activity outside of the classroom.
42
6. Social Service Needs
Overall, we live in a compassionate community. ~Head Start Parent, CVHS Community Survey 2017
With respect to social service needs, families identified affordable childcare, affordable housing, fuel/utility assistance and transportation as the most significant needs. This supports data from the 2015 annual snapshot report generated by Vermont 2-1-1, the statewide human and social services information and referral agency, indicating the top need of callers as housing/shelter. The top 3 gaps in services for callers were listed as community shelters, utility assistance, and gas money. According to an analysis in the October 2015 report Difficult Choices: Housing for Vermont Families, in order to afford the market rate rent for an apartment without paying more than 30% of income on housing, “a full-time worker would need to make between $20.69 and $25.54 an hour. In other words, a household relying on minimum wage would need to work 111 hours per week— or nearly three full time jobs—to afford market-rate rent in Burlington.” The lack of affordability is disproportionately felt by renting households with the percent of renting households paying more than 50% of their income for housing is double the percent of homeowners with mortgages with the same level of cost burden (Vermont Housing Finance Agency, Housing Data Profile). The ability to afford utilities and fuel can be a key component to ensuring a family can maintain housing. Households that receive Weatherization services experience a 24% savings in their heating costs. The number households benefitting from Weatherization services, however, was at its lowest rate since 2011 (DCF Outcomes for Vermonters, 2017). Also noted in the Outcomes for Vermonters, the number of households with children receiving Fuel Assistance benefits is at its lowest point since before 2009. Furthermore, low wages, high housing costs and other barriers are compounded by the difficulty many Vermont families have in locating and affording quality child care. In the Basic Needs Budget and Livable Wage Report prepared by the Joint Fiscal Office of Vermont (February, 2017), a single parent with two children living in Chittenden County would need a wage of $38.16 per hour to meet the basic needs of the family compared to $17.64 for a single adult with no children. This represents an increase of $2.24 per hour for the single parent as compared to a $.0.38 per hour increase for the single adult since 2015. According to the 2016 Vermont report by Child Care Aware of America, the average annual fee for infant/toddler care in a full-time center is $11,513. The cost of child care for a family without assistance living at 100% of the federal poverty level can be as much as 83.5% of their income (BBF, How are Vermont’s Young Children and Families). This cost can be mitigated by participating in the Child Care Financial Assistance Program to receive subsidies to help cover the cost of care. In many situations, though, even with a full certificate at a 4 or 5 STAR program, a family is still left paying a co-pay, for households living at 100% FPL that could be as much as 4.5% of their income (BBF, How are Vermont’s Young Children and Families). This is still seen as unaffordable for families in the lowest income brackets. In addition to lack of affordability, families often have limited choices regarding high quality care. Only 11% of centers and 2% of family child care homes are nationally accredited (Child Care Aware). In addition to being listed as one of the most urgent needs facing families, Transportation was also identified by community assessment survey recipients as the largest barrier to accessing needed services which includes childcare, employment, appointments for benefits, and substance abuse/mental health treatment. Transportation was also identified as the third most common barrier for families receiving Reach Up (DCF Outcomes for Vermonters, 2017). While there are public transportation services available in all 4 CVHS counties, it is most limited in Grand Isle County and clustered largely in the urban centers.

43
(iii) Typical work, school, and training schedules of parents with eligible children;
The majority of parents with eligible children are in need of full-time, year-round care based on traditional work-day, work-week schedules. Based on responses of parents and service providers regarding need for care, it is assumed that the majority of families hold traditional work, school, or training schedules.

44
(iv) Other child development, child care centers, and family child care programs that serve eligible children, including home visiting, publicly funded state and local preschools, and the approximate number of eligible children served;
2018 Update
2019 Update
Vermont’s total capacity of regulated care (home and centers combined) has decreased by 7% for infant and toddler slots and 2.5% for PreK slots since 2015.
There has not been a net loss of infant, toddler, or PreK slots in Vermont’s center & school based provider segment, since 2015.
Vermont has 564 registered home child care providers but that is down nearly 27% since 2015.
The number of registered home providers has decreased throughout the CVHS service area, since 2016.
Data Source: Child Development Division of the Department for Children and Families in Vermont Child Care and Prekindergarten Capacity Baseline Report, November 2018

45
2018 Update
There is a gap in services for Infants/Toddlers across the CVHS service area. Across the service area, infants are less likely to have access to high-quality regulated care as opposed to toddlers. Franklin County has the highest rate of infants and toddlers in need of care without access to high-quality regulated care.
When looking at access to any regulated child care, Addison County has the greatest disparity in both infants and toddlers needing care without access.
Data Source: Vermont Insights
46
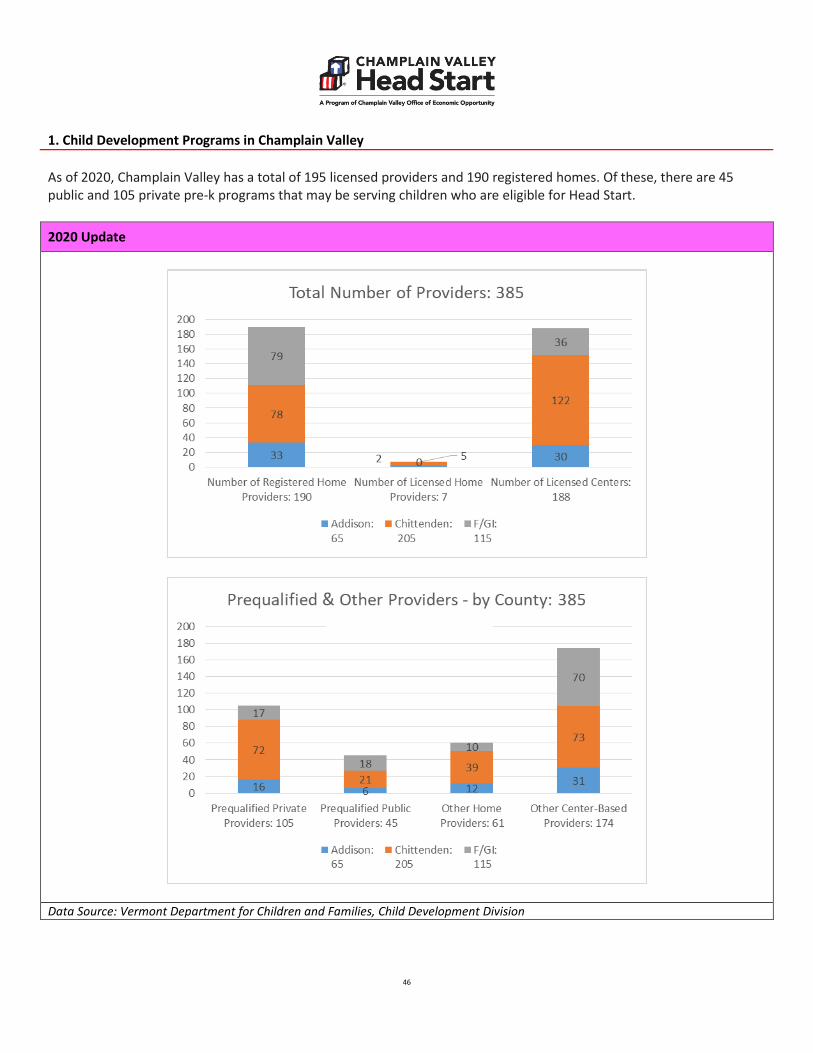
1. Child Development Programs in Champlain Valley As of 2020, Champlain Valley has a total of 195 licensed providers and 190 registered homes. Of these, there are 45 public and 105 private pre-k programs that may be serving children who are eligible for Head Start.
2020 Update
Data Source: Vermont Department for Children and Families, Child Development Division
47
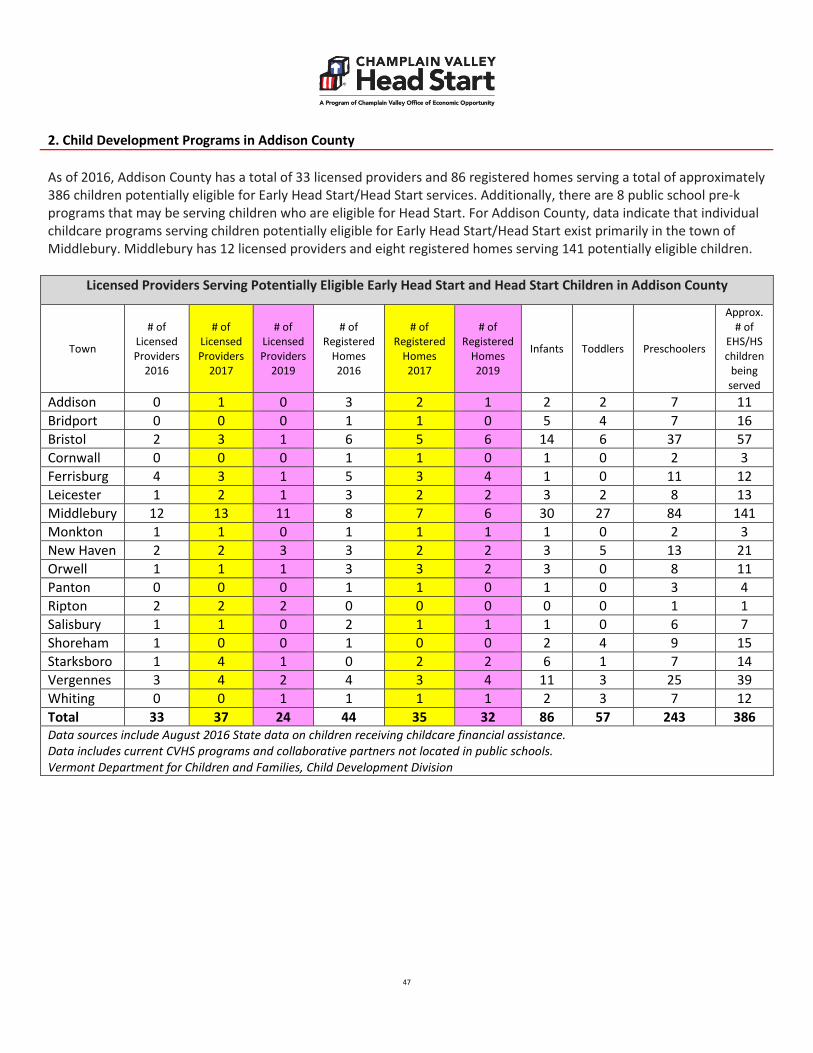
2. Child Development Programs in Addison County As of 2016, Addison County has a total of 33 licensed providers and 86 registered homes serving a total of approximately 386 children potentially eligible for Early Head Start/Head Start services. Additionally, there are 8 public school pre-k programs that may be serving children who are eligible for Head Start. For Addison County, data indicate that individual childcare programs serving children potentially eligible for Early Head Start/Head Start exist primarily in the town of Middlebury. Middlebury has 12 licensed providers and eight registered homes serving 141 potentially eligible children.
Licensed Providers Serving Potentially Eligible Early Head Start and Head Start Children in Addison County
Town
# of Licensed Providers
2016
# of Licensed Providers
2017
# of Licensed Providers
2019
# of Registered
Homes 2016
# of Registered
Homes 2017
# of Registered
Homes 2019
Infants Toddlers Preschoolers
Approx. # of
EHS/HS children
being served
Addison 0 1 0 3 2 1 2 2 7 11 Bridport 0 0 0 1 1 0 5 4 7 16 Bristol 2 3 1 6 5 6 14 6 37 57 Cornwall 0 0 0 1 1 0 1 0 2 3 Ferrisburg 4 3 1 5 3 4 1 0 11 12 Leicester 1 2 1 3 2 2 3 2 8 13 Middlebury 12 13 11 8 7 6 30 27 84 141 Monkton 1 1 0 1 1 1 1 0 2 3 New Haven 2 2 3 3 2 2 3 5 13 21 Orwell 1 1 1 3 3 2 3 0 8 11 Panton 0 0 0 1 1 0 1 0 3 4 Ripton 2 2 2 0 0 0 0 0 1 1 Salisbury 1 1 0 2 1 1 1 0 6 7 Shoreham 1 0 0 1 0 0 2 4 9 15 Starksboro 1 4 1 0 2 2 6 1 7 14 Vergennes 3 4 2 4 3 4 11 3 25 39 Whiting 0 0 1 1 1 1 2 3 7 12 Total 33 37 24 44 35 32 86 57 243 386 Data sources include August 2016 State data on children receiving childcare financial assistance. Data includes current CVHS programs and collaborative partners not located in public schools. Vermont Department for Children and Families, Child Development Division

48
3. Child Development Programs in Chittenden County As of 2016, Chittenden County has a total of 147 licensed providers and 126 registered homes serving a total of approximately 1,385 children potentially eligible for Early Head Start/Head Start services. Additionally, there are 21 public school pre-k programs that may be serving children who are eligible for Head Start. For Chittenden County, data indicate that individual childcare programs serving children potentially eligible for Early Head Start/Head Start exist primarily in the towns of Burlington, Essex and Colchester. Burlington has 30 licensed providers and 33 registered homes serving 460 potentially eligible children. Essex has 23 licensed providers and 16 registered homes serving 188 potentially eligible children. Colchester has 18 licensed providers and 16 registered homes serving 188 potentially eligible children.
Licensed Providers Serving Potentially Eligible Early Head Start and Head Start Children in Chittenden County
Town
# of Licensed Providers
2016
# of Licensed Providers
2017
# of Licensed Providers
2019
# of Registered
Homes 2016
# of Registered
Homes 2017
# of Registered
Homes 2019
Infants Toddlers Preschoolers
Approx. # of
EHS/HS children
being served
Bolton 2 2 2 1 1 0 2 1 2 5 Burlington 30 31 21 33 23 22 88 70 302 460 Charlotte 3 3 2 2 1 1 2 0 5 7 Colchester 18 19 14 16 9 8 42 36 110 188 Essex 23 23 14 16 14 10 39 33 116 188 Hinesburg 4 3 2 4 2 1 7 6 21 34 Huntington 2 1 1 2 0 0 4 1 5 10 Jericho 4 6 1 3 3 2 4 3 9 16 Milton 9 9 8 14 12 11 22 32 80 134 Richmond 5 5 3 6 5 2 6 5 6 17 Shelburne 10 10 6 4 4 3 8 4 25 37 S.Burlington 17 17 16 8 8 6 26 24 62 112 St. George 0 0 0 1 1 1 2 0 2 4 Underhill 2 2 1 2 1 2 2 1 5 8 Westford 0 0 0 1 0 0 1 1 3 5 Williston 12 12 10 8 8 7 7 5 27 39 Winooski 6 6 5 5 4 2 24 21 76 121 Total 147 149 106 126 96 78 286 243 856 1,385 Data sources include August 2016 State data on children receiving childcare financial assistance. Data includes current CVHS programs and collaborative partners not located in public schools. Vermont Department for Children and Families, Child Development Division

49
4. Child Development Programs in Franklin and Grand Isle Counties As of 2016, Franklin and Grand Isle Counties have a total of 24 licensed providers and 123 registered homes serving a total of approximately 674 children potentially eligible for Early Head Start/Head Start services. Additionally, there are 17 public school pre-k programs that may be serving children who are eligible for Head Start. For Franklin and Grand Isle Counties, data indicate that individual childcare programs serving children potentially eligible for Early Head Start/Head Start exist primarily in St. Albans. St. Albans has nine licensed providers and 24 registered homes serving 268 potentially eligible children.
Licensed Providers Serving Potentially Eligible Early Head Start and Head Start Children in Franklin & GI Counties
Town
# of Licensed Providers
2016
# of Licensed Providers
2017
# of Licensed Providers
2019
# of Registered
Homes 2016
# of Registered
Homes 2017
# of Registered
Homes 2019
Infants Toddlers Preschoolers
Approx. # of
EHS/HS children
being served
Alburgh 0 0 0 7 3 3 5 4 14 23 Bakersfield 1 1 0 0 0 0 1 0 3 4 Enosburg 1 1 1 8 7 6 12 11 32 55 Fairfax 3 3 2 16 15 14 12 5 20 37 Fairfield 1 1 0 3 2 2 1 1 15 17 Franklin 0 0 0 6 4 4 4 5 11 20 Georgia 2 1 1 8 9 5 7 4 7 18 Grand Isle 3 3 2 1 1 1 1 3 16 20 Highgate 1 1 1 8 7 8 6 5 18 29 Montgomery 0 0 0 0 0 0 2 1 1 4 N. Hero 0 0 0 0 0 0 2 1 6 9 Richford 1 1 1 4 3 2 9 7 20 36 Sheldon 0 0 0 8 6 4 2 3 12 17 So. Hero 2 3 1 2 1 1 0 3 5 8 St. Albans 9 10 7 24 19 14 54 57 157 268 St. Albans Town 0 0 0 8 6 5 4 3 10 17 Swanton 0 0 1 20 11 9 22 19 51 92 Total 24 25 17 123 94 78 144 132 398 674 Data sources include August 2016 State data on children receiving childcare financial assistance. Data includes current CVHS programs and collaborative partners not located in public schools. Vermont Department for Children and Families, Child Development Division

50
4. Overview of Act 166 Public/Private Pre-K Programs in CVHS Region
Supporting children in the healthy development of empathy, communication, and accountability are strong social building blocks that can serve as primary prevention to later-in-life perpetrated behaviors.
~Community Service Provider, CVHS Community Survey 2017
Top six towns in each CVHS region with highest financial need based on state Child Care Financial Assistance data
Town
# of Prequalified Pre-K Programs: Public School 2016
# of Prequalified Pre-K
Programs: Public School 2017
# of Prequalified Pre-K
Programs: Public School 2018
# of Prequalified Pre-K
Programs: Public School 2019
# of Prequalified Pre-K
Programs: Privately Operated
2016
# of Prequalified Pre-K
Programs: Privately Operated
2017
# of Prequalified Pre-K
Programs: Privately Operated
2018
# of Prequalified Pre-K
Programs: Privately Operated
2019
Total Capacit
y 2016
Total Capacit
y 2017
Total Capacit
y 2018
Total Capacit
y 2019
Addison County Middlebury 1 1 1 1 7 7 6 6 220 217 195 195 Bristol 1 1 1 1 1 1 1 2 46 46 43 43 Vergennes 1 1 0 0 1 1 1 1 30 25 20 20 New Haven 0 0 0 0 1 1 3 3 4 4 33 33 Bridport 0 1 1 1 1 0 0 0 13 13 17 17 Shoreham 0 0 0 0 1 1 0 0 4 4 0 0 Chittenden County Burlington 5 5 5 5 14 14 14 16 518 499 541 536 Colchester 1 1 1 1 6 7 8 8 146 153 214 229 Essex 2 2 3 3 7 9 11 9 228 314 390 370 Milton 1 1 1 1 3 3 3 3 104 101 144 144 Winooski 1 1 1 1 2 3 3 2 69 89 83 63 S.Burlington 2 2 2 2 10 7 7 10 201 185 238 263 Franklin & Grand Isle Counties St. Albans 2 2 3 3 2 3 4 7 138 155 239 229 Swanton 1 1 1 1 0 0 0 2 35 35 51 45 Enosburg 1 1 1 1 0 0 0 0 40 40 40 40 Fairfax 2 1 1 1 0 1 1 2 15 18 40 32 Richford 1 2 2 2 0 0 0 0 30 30 50 50 Highgate 1 1 1 1 0 0 0 0 30 30 17 16 Data Source: Child Development Division Bright Futures Information System- August 2016 Vermont Department for Children and Families, Child Development Division

51
2018 Update
Increased availability of publicly-funded pre-k (including an assessment of how the pre-k available in the community meets the needs of the parents and children served by the program, and whether it is offered for a full school day) Based on information from VT Department for Children and Families, Child Development Division, there is no significant increase in the number of licensed child care centers or publicly funded pre-k in the CVHS service area. However, when looking at both public and privately operated State funded pre-k for the top six towns in each county with the rates of highest financial need, there was an increase in capacity for Chittenden and Franklin/Grand Isle Counties and a slight decrease in capacity in Addison County. Data provided by VT Department for Children and Families, Child Development Division does not specify the hours of service provided at each Act 166 prequalified providers. Act 166 specifies a minimum of 10 hours of service need to be provided and those hours can be imbedded in full day, full year child care centers or within part-day or full school-day school based services. Based on the 2016 Preschool Development Grants Annual Performance Report for Vermont from the U.S. Department of Education, the actual number of children who participated in full-school day preschool services funded through the State Preschool Development Grant was 412. These children were served in 17 different programs throughout the state. CVHS partnered with two of the sub-grantees to provide full-school day services in the Burlington and Milton school districts. Overall, the PDEG grant served over 100 fewer children than anticipated in 2016. Beginning in fall 2017, CVHS again partnered with Burlington School District to add an additional full-school day classroom. Based on current CVHS 2017-2018 PIR information, 52% of two-parent households have both parents employed or in school. In 79% of one-parent households, the primary provider is either working or in school. Among Early Head Start, 31% of two-parent households have both parents working or in school and 91% of single parents are either working or in school. This PIR information reinforces the significant need for care among Early Head Start families with only one parent in the household. Data Sources: Vermont Department for Children and Families, Child Development Division 2016 Preschool Development Grants Annual Performance Report for Vermont from the U.S. Department of Education CVHS PIR data

52
(v) Resources that are available in the community to address the needs of eligible children and their families;
There are lots of services available, and many caring professionals.
~Head Start Parent, CVHS Community Survey 2017 Champlain Valley Head Start is a program of Champlain Valley Office of Economic Opportunity which provides access to services to address a variety of economic and well-being needs. Additional CVOEO programs and services include Community Action, Food Shelves, Financial Futures, Housing Rights advocacy, Domestic & Sexual Violence advocacy, Weatherization, Fuel Assistance, and Income Tax assistance. CVHS actively engages in referral processes with all of the other CVOEO services to address needs identified by families. Vermont is home to over 4,000 nonprofit organizations, the majority of which address health and human service as well as educational needs (Fast Facts: The Economic Power of Vermont’s Nonprofit Sector, Common Good Vermont, 2015). The Common Good report identifies Chittenden County as the hub of nonprofit services with 24% of nonprofits are based in the county. Franklin County accounts for 8% of the state’s population yet only 3% of nonprofits are located within the county. A strong network of nonprofit organizations adds to a robust safety net of public benefit programs including Reach Up, 3Squares, WIC, Medicaid, and Child Care Financial Assistance. Vermont 2-1-1 is the statewide human services resource and referral network for the state. In 2015, Vermont 2-1-1 responded to over 38,000 calls for resource and referral information. Their database includes over 950 social services organizations and is available by phone, web, or mobile app 24-hours a day, 7 days a week.
Resources for Families in Champlain Valley
Type of Need Government Resources Available Community Resources Available
Health Dr. Dynasaur / Medicaid Visiting Nurses Association
Mental Health/Parenting/Wellness Strengthening Families Building Bright Futures
Designated Mental Health Agencies (NCSS, Howard Center, CSAC) Prevent Child Abuse Vermont
Nutrition WIC 3Squares Farm-to-Family
UVM Extension – EFNEP Food Shelves CSAs School/Center Based Programs
Adult Education/Training Department of Labor Vermont Adult Learning Vermont Works for Women Learning Together
Basic Needs DCF – Economic Services Child Care Financial Assistance
Community Action Shelter & Housing Services Faith-based Organizations

53
(vi) Strengths of the community
The community we live in will often go the extra mile to work with families and meet them where they are.
Communication is pretty good between different organizations. ~Community Service Provider, CVHS Community Survey 2017
Vermont was ranked 6th in the 2016 Kids Count Profile published by the Annie E. Casey Foundation with the most favorable ratings in the Education and Family & Community Domains. Overall, the report indicates a low teen birth rate, high rates of children with health insurance, and high percentage of children living with educated heads of household as indicators of community strengths. When Community Assessment respondents were asked to identify community strengths, the responses highlighted a strong sense of community, availability of a wide variety of services and resources, and a family-focused culture. It is no coincidence that Vermonter’s have a strong sense of commitment to families with young children. There has been considerable effort invested in the last 5 years towards improving the systems of early care and education, informing stakeholders of the importance of early brain development, and identification/allocation of resources to bring high quality care to the youngest Vermonters. A multitude of statewide, multi-disciplinary teams from the Governor’s Commission on Early Childhood, Blue Ribbon Commission, Let’s Grow Kids, Vermont Birth to Five, Voices for Vermont’s Children, Early Childhood Alliance, Building Bright Futures, and the various initiatives funded through the state Race to the Top grant have been working together to raise the platform of early care and education across the state.


![End of Key Stage Guidance[2] - School Business Services · EYFS Baseline Assessment Template CEM 2016.xml EYFS Baseline Assessment Template EE 2016.xml.EYFS Baseline Assessment NFER](https://static.fdocuments.in/doc/165x107/5f9dcea96318e64fd1777942/end-of-key-stage-guidance2-school-business-services-eyfs-baseline-assessment.jpg)