Community Acquired Pneumonia - sahivsoc.org Feldman - Community acquired... · • Aetiology of...
37
Opportunistic Infections Opportunistic Infections – Community Community Acquired Acquired Pneumonia Pneumonia Charles Feldman Professor of Pulmonology and Chief Physician Professor of Pulmonology and Chief Physician Charlotte Maxeke Johannesburg Academic Hospital University of the Witwatersrand
-
Upload
phunghuong -
Category
Documents
-
view
227 -
download
1
Transcript of Community Acquired Pneumonia - sahivsoc.org Feldman - Community acquired... · • Aetiology of...
Opportunistic Infections Opportunistic Infections ––
Community Community Acquired Acquired PneumoniaPneumonia
Charles Feldman
Professor of Pulmonology and Chief PhysicianProfessor of Pulmonology and Chief Physician
Charlotte Maxeke Johannesburg Academic Hospital
University of the Witwatersrand
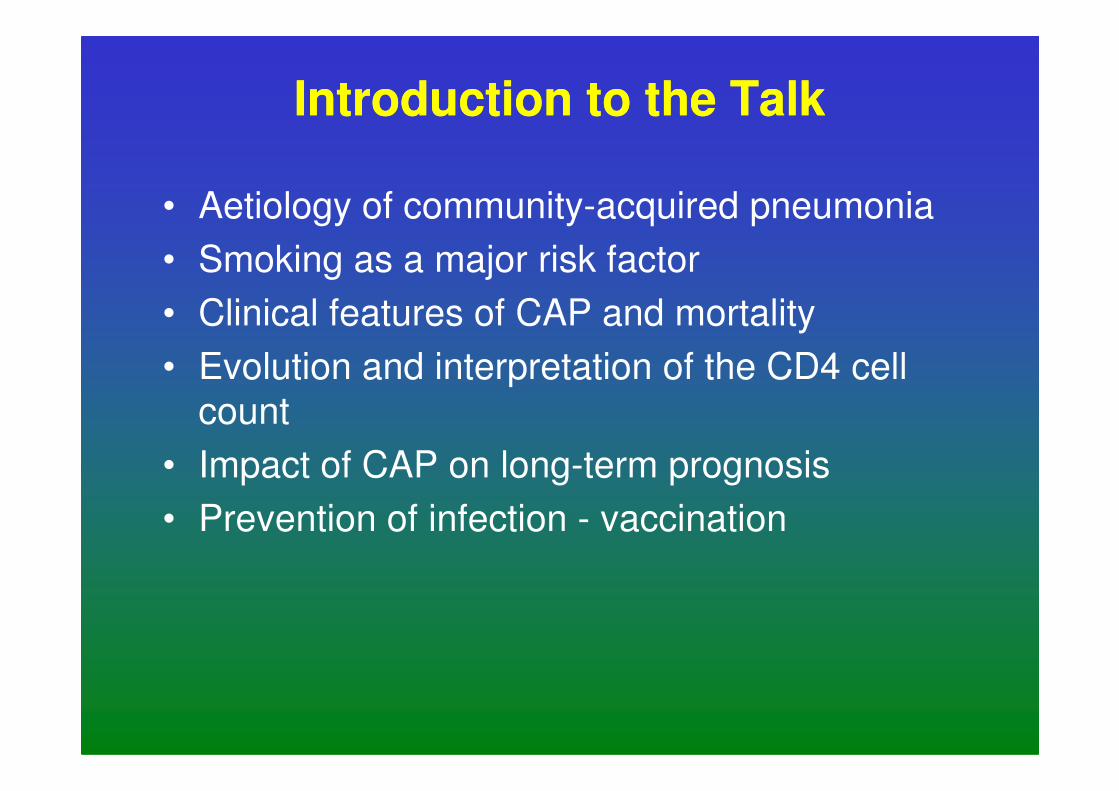
Introduction to the TalkIntroduction to the Talk
• Aetiology of community-acquired pneumonia
• Smoking as a major risk factor
• Clinical features of CAP and mortality
• Evolution and interpretation of the CD4 cell
countcount
• Impact of CAP on long-term prognosis
• Prevention of infection - vaccination
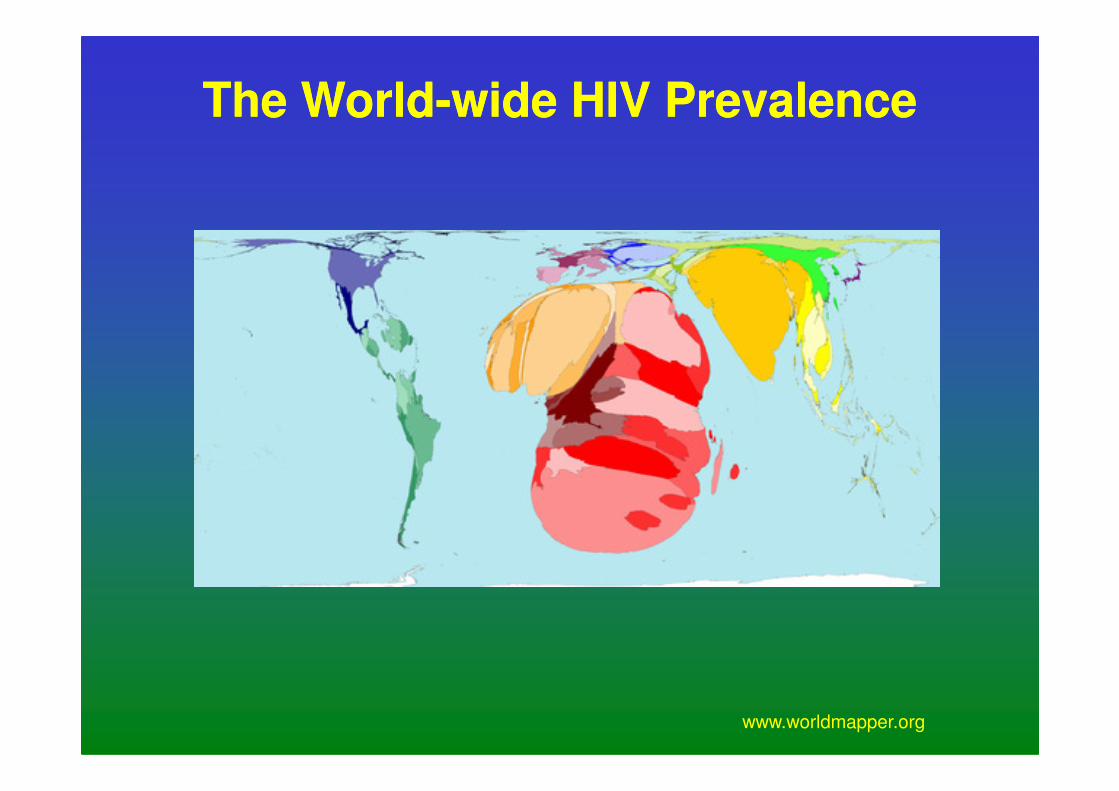
The WorldThe World--wide HIV Prevalencewide HIV Prevalence
www.worldmapper.org
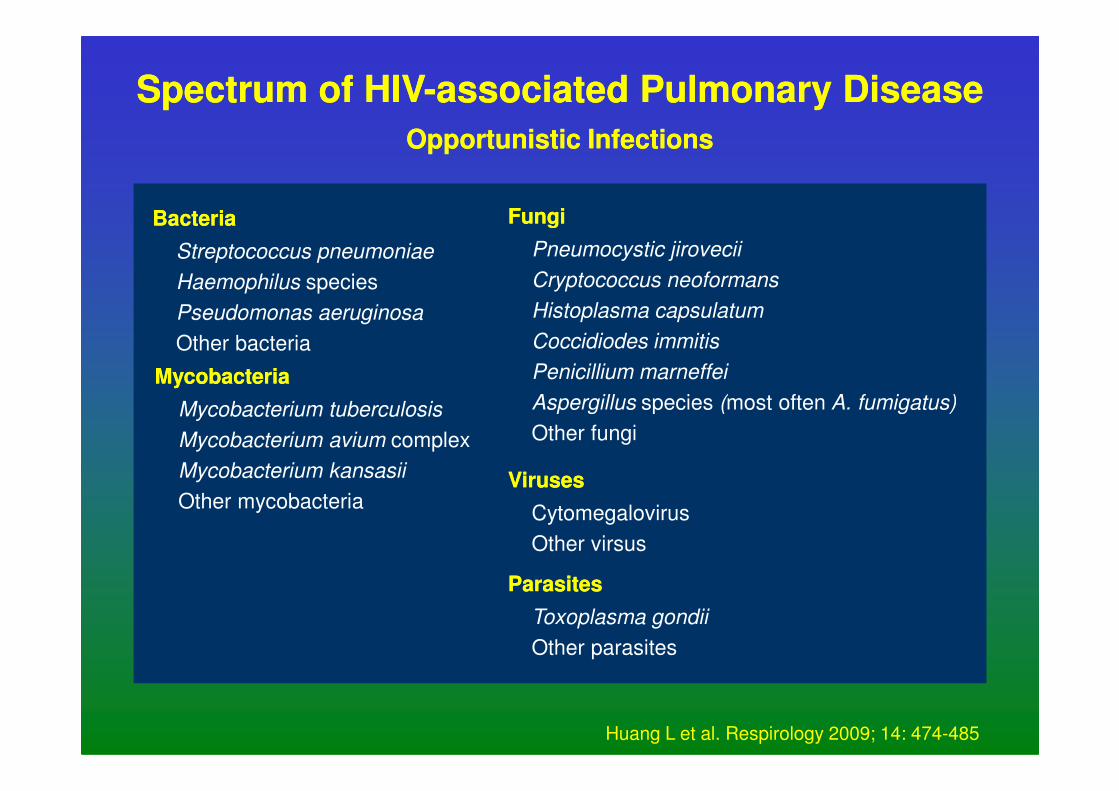
Spectrum of HIVSpectrum of HIV--associated Pulmonary Diseaseassociated Pulmonary Disease
Opportunistic InfectionsOpportunistic Infections
Bacteria Bacteria
Streptococcus pneumoniae
Haemophilus species
Pseudomonas aeruginosa
Other bacteria
Mycobacteria Mycobacteria
FungiFungi
Pneumocystic jirovecii
Cryptococcus neoformans
Histoplasma capsulatum
Coccidiodes immitis
Penicillium marneffei
Aspergillus species (most often A. fumigatus)Mycobacterium tuberculosis
Mycobacterium avium complex
Mycobacterium kansasii
Other mycobacteria
Aspergillus species (most often A. fumigatus)
Other fungi
VirusesViruses
Cytomegalovirus
Other virsus
ParasitesParasites
Toxoplasma gondii
Other parasites
Huang L et al. Respirology 2009; 14: 474-485
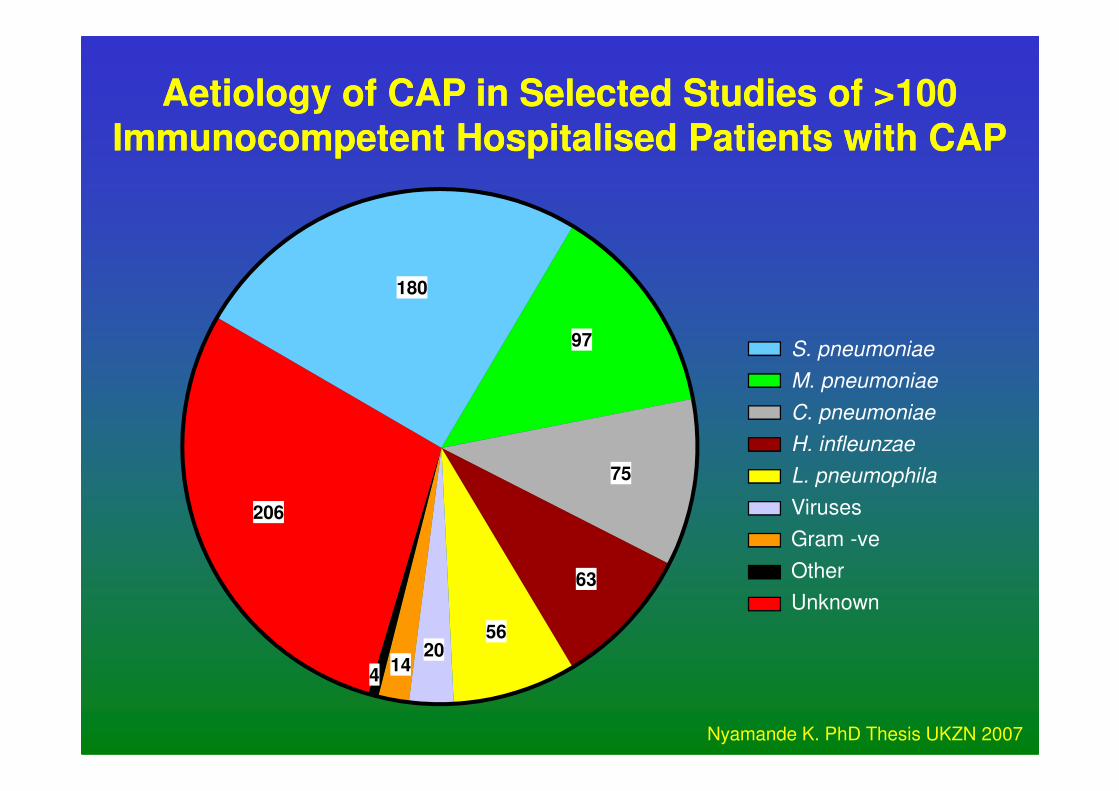
S. pneumoniae
M. pneumoniae
180
97
AetiologyAetiology of CAP in Selected Studies of >100 of CAP in Selected Studies of >100
ImmunocompetentImmunocompetent HospitalisedHospitalised Patients with CAPPatients with CAP
C. pneumoniae
H. infleunzae
L. pneumophila
Viruses
Gram -ve
Other
Unknown
75
63
56
1420
4
206
Nyamande K. PhD Thesis UKZN 2007
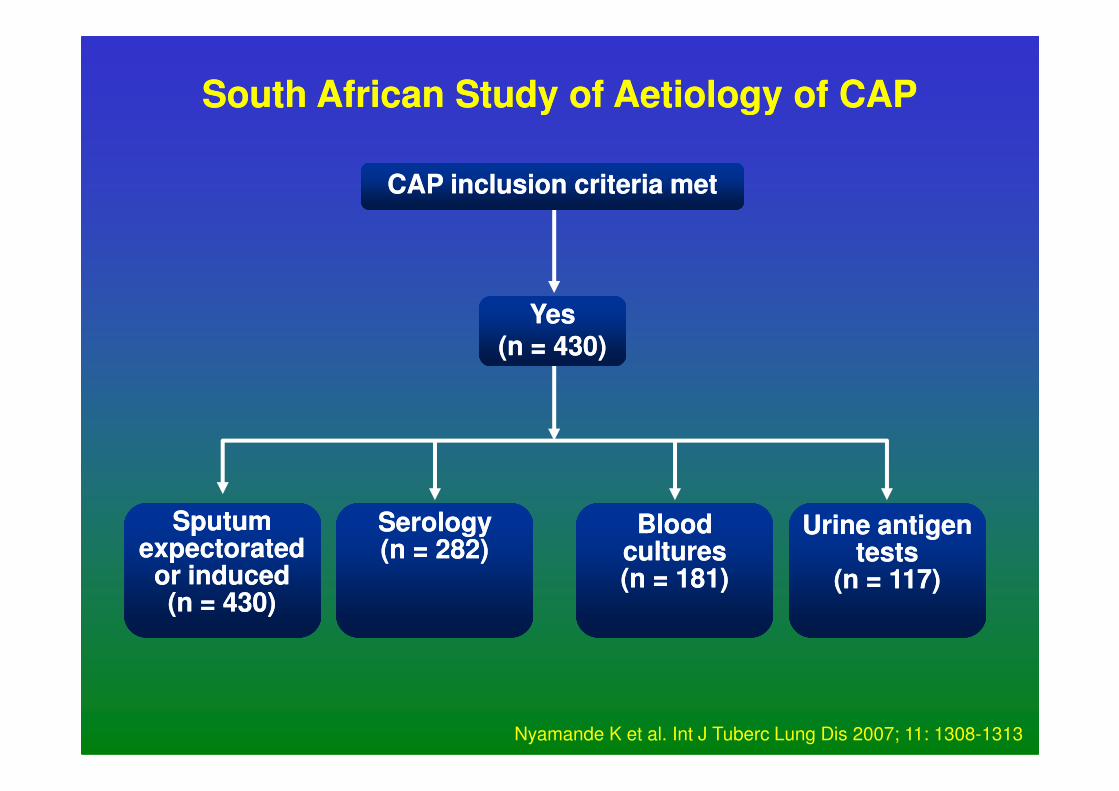
South African Study of South African Study of AetiologyAetiology of CAPof CAP
CAP inclusion criteria metCAP inclusion criteria met
YesYes(n = 430)(n = 430)
Sputum Sputum expectorated expectorated
or inducedor induced(n = 430)(n = 430)
Urine antigen Urine antigen teststests
(n = 117) (n = 117)
Blood Blood culturescultures(n = 181)(n = 181)
SerologySerology(n = 282)(n = 282)
Nyamande K et al. Int J Tuberc Lung Dis 2007; 11: 1308-1313
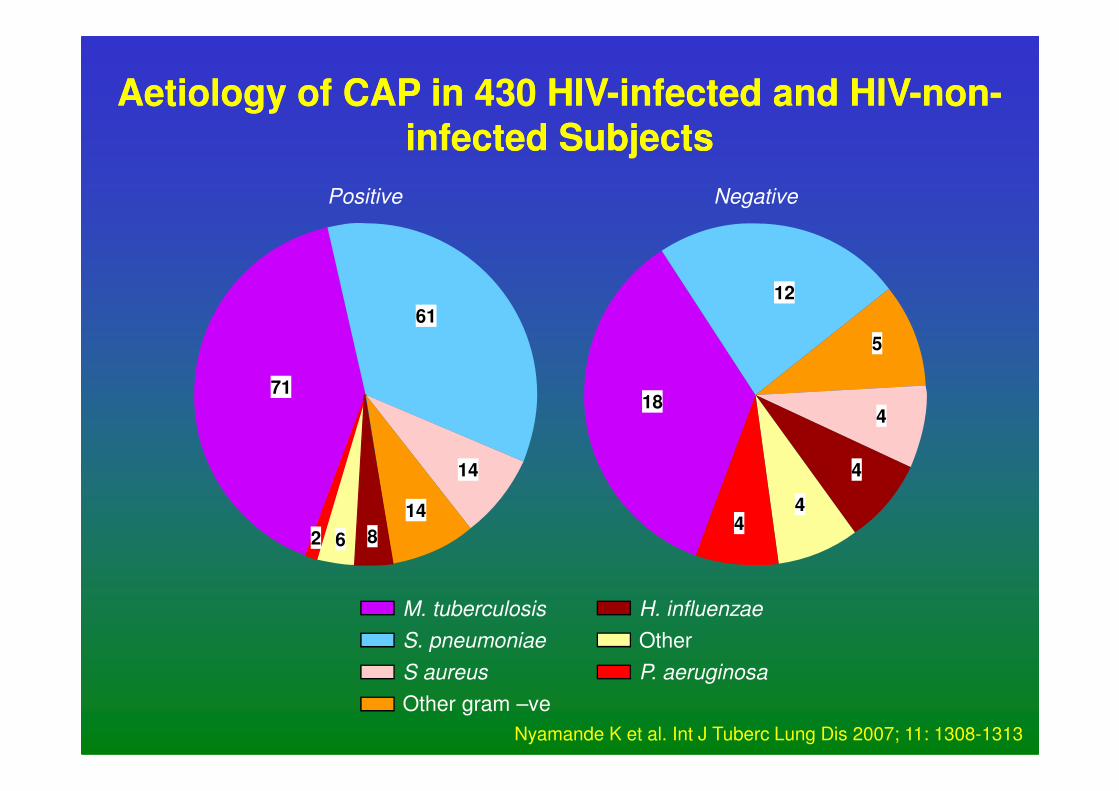
71
61
18
12
5
Positive Negative
AetiologyAetiology of CAP in 430 HIVof CAP in 430 HIV--infected and HIVinfected and HIV--nonnon--
infected Subjectsinfected Subjects
M. tuberculosis
S. pneumoniae
S aureus
Other gram –ve
71
14
14
62
184
4
44
H. influenzae
Other
P. aeruginosa
8
Nyamande K et al. Int J Tuberc Lung Dis 2007; 11: 1308-1313
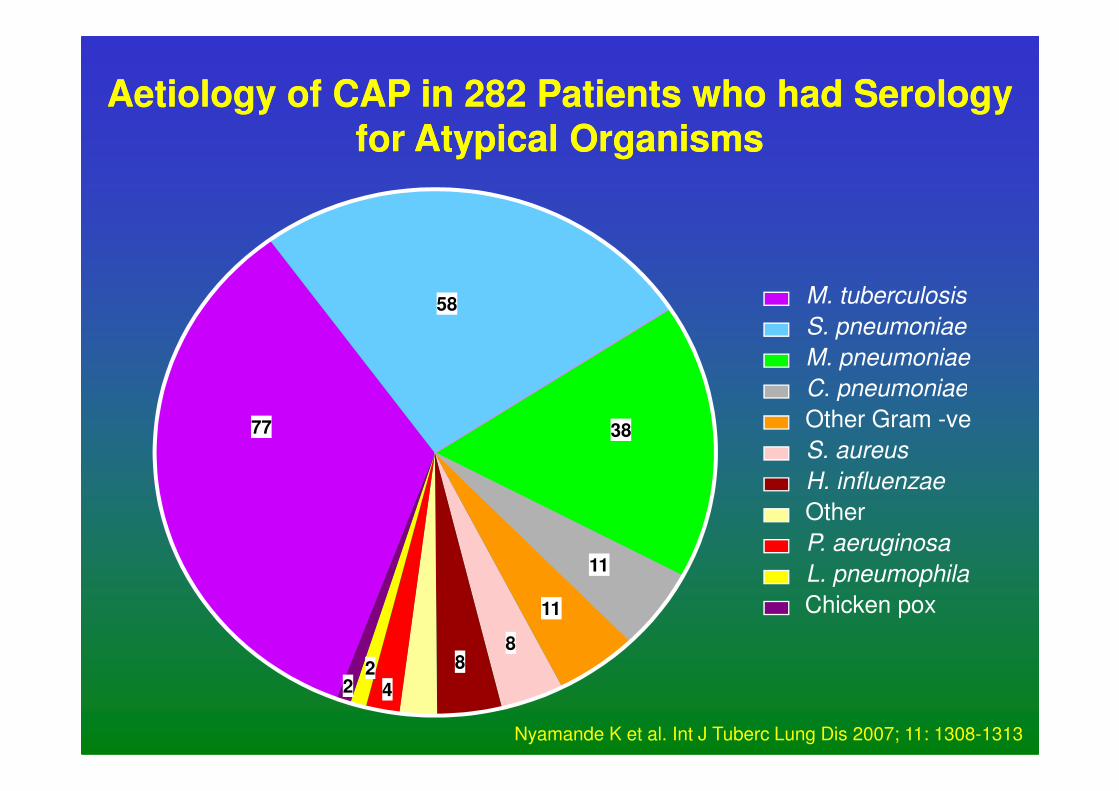
M. tuberculosis
S. pneumoniae
M. pneumoniae
C. pneumoniae
58
AetiologyAetiology of CAP in 282 Patients who had Serology of CAP in 282 Patients who had Serology
for Atypical Organismsfor Atypical Organisms
C. pneumoniae
Other Gram -ve
S. aureus
H. influenzae
Other
P. aeruginosa
L. pneumophila
Chicken pox
77 38
11
11
88
422
Nyamande K et al. Int J Tuberc Lung Dis 2007; 11: 1308-1313
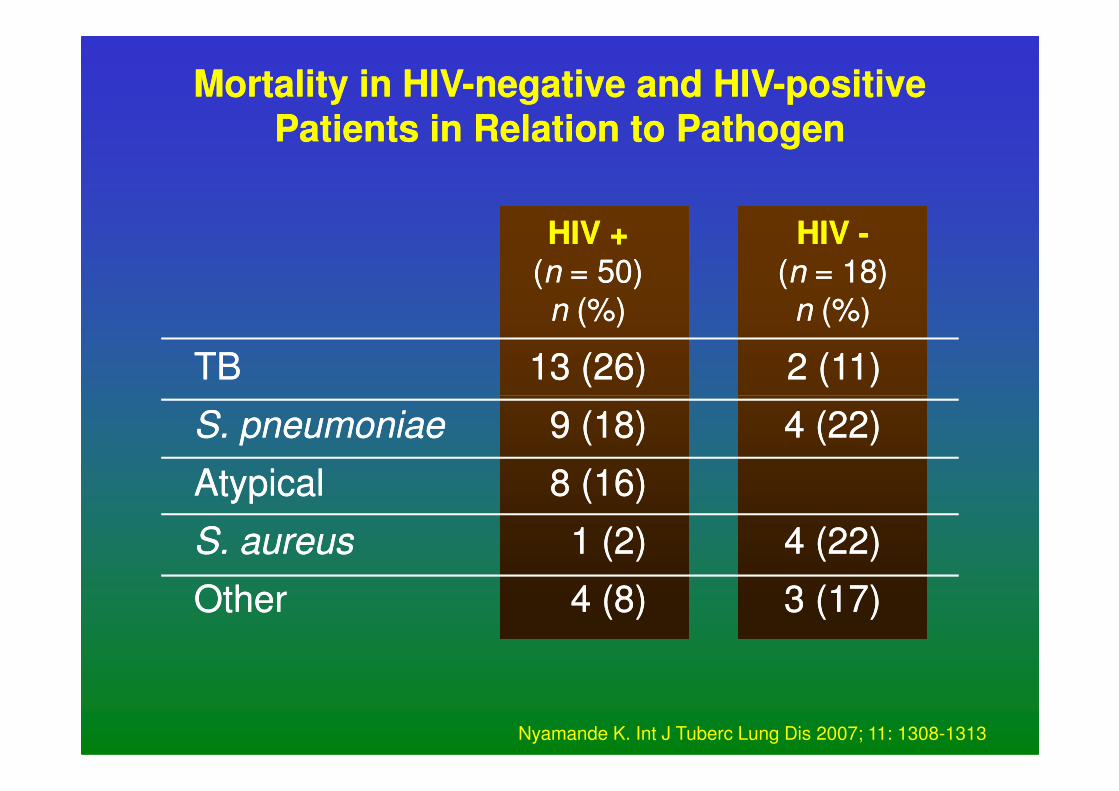
Mortality in HIVMortality in HIV--negative and HIVnegative and HIV--positive positive
Patients in Relation to PathogenPatients in Relation to Pathogen
TBTB
HIV +HIV +((nn = 50)= 50)
nn (%)(%)
HIV HIV --((nn = 18)= 18)
nn (%)(%)
13 (26)13 (26) 2 (11)2 (11)
S. pneumoniaeS. pneumoniae
AtypicalAtypical
S. aureusS. aureus
OtherOther
9 (18)9 (18)
8 (16)8 (16)
1 (2)1 (2)
4 (8)4 (8)
4 (22)4 (22)
4 (22)4 (22)
3 (17)3 (17)
Nyamande K. Int J Tuberc Lung Dis 2007; 11: 1308-1313
un
t (c
ells
/mm
)2
1 000
800
600
400
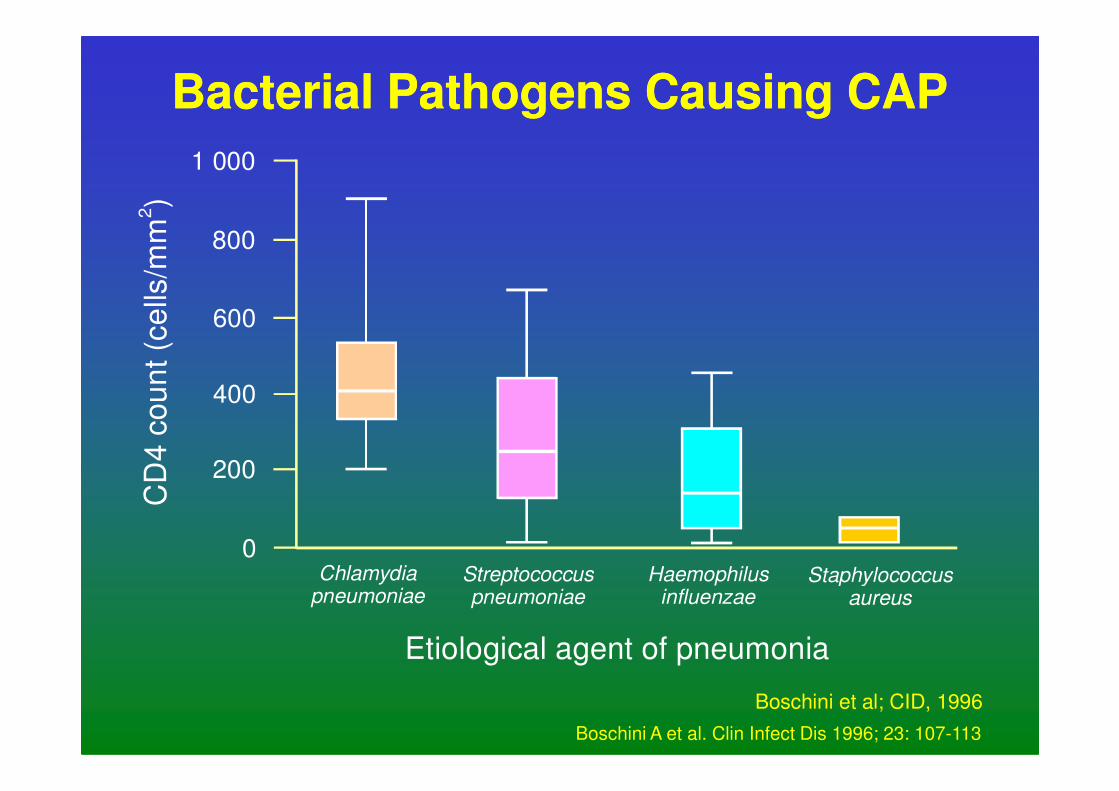
BacterialBacterial Pathogens Causing CAPPathogens Causing CAP
Chlamydiapneumoniae
Etiological agent of pneumonia
CD
4 c
ou 400
200
0Streptococcuspneumoniae
Haemophilusinfluenzae
Staphylococcusaureus
Boschini et al; CID, 1996
Boschini A et al. Clin Infect Dis 1996; 23: 107-113
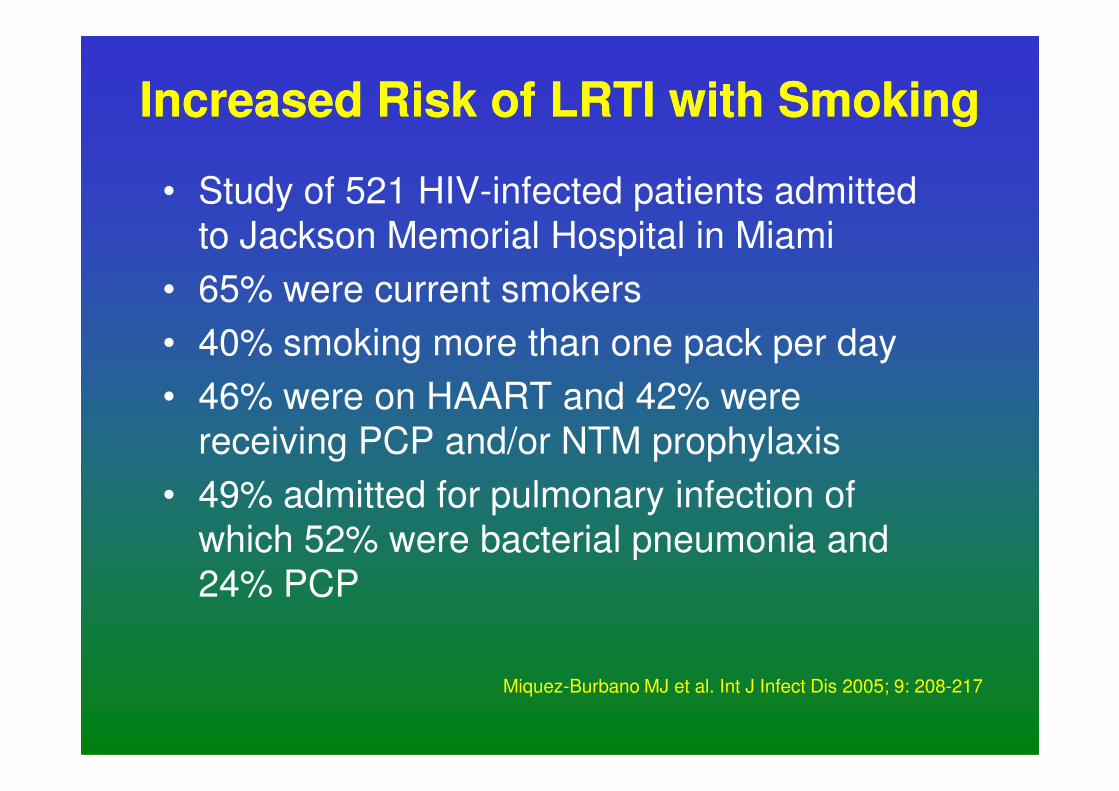
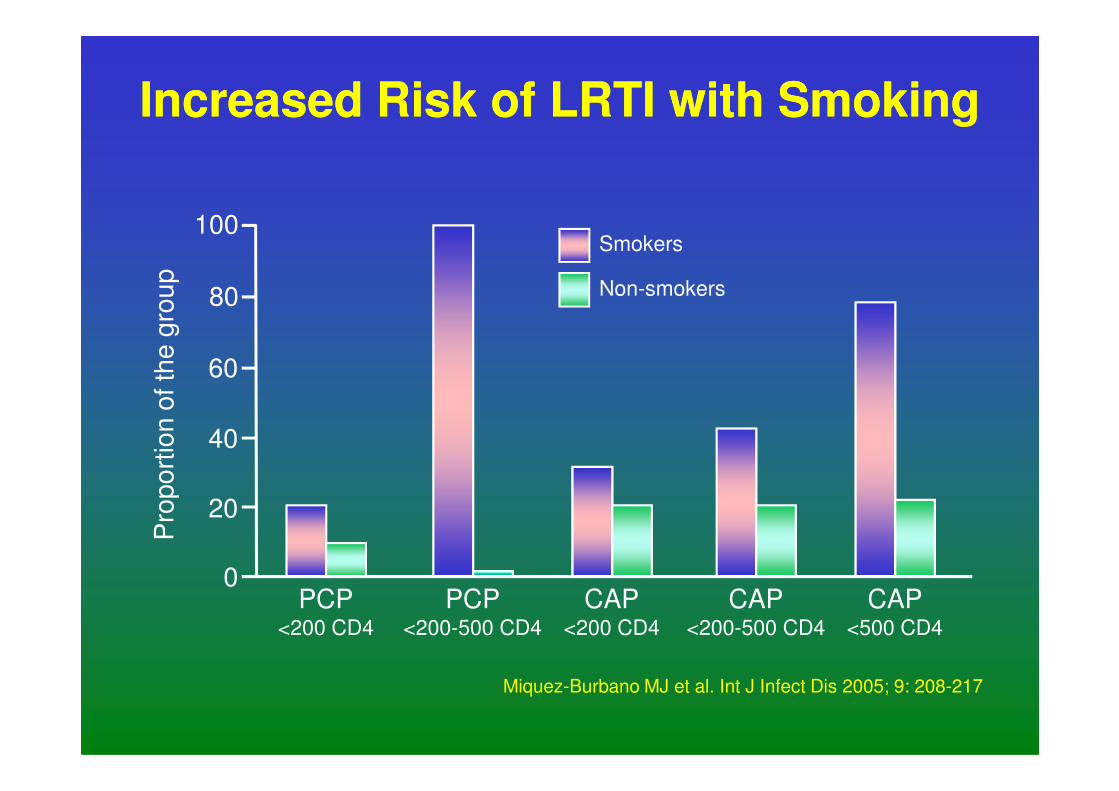
Increased Risk of LRTI with SmokingIncreased Risk of LRTI with Smoking
• Study of 521 HIV-infected patients admitted
to Jackson Memorial Hospital in Miami
• 65% were current smokers
• 40% smoking more than one pack per day
• 46% were on HAART and 42% were • 46% were on HAART and 42% were
receiving PCP and/or NTM prophylaxis
• 49% admitted for pulmonary infection of
which 52% were bacterial pneumonia and
24% PCP
Miquez-Burbano MJ et al. Int J Infect Dis 2005; 9: 208-217
100
Pro
po
rtio
n o
f th
e g
rou
p
80
60
Smokers
Non-smokers
Increased Risk of LRTI with SmokingIncreased Risk of LRTI with SmokingP
rop
ort
ion
of th
e g
rou
p
40
20
0PCP
<200 CD4
PCP<200-500 CD4
CAP<200 CD4
CAP<200-500 CD4
CAP<500 CD4
Miquez-Burbano MJ et al. Int J Infect Dis 2005; 9: 208-217
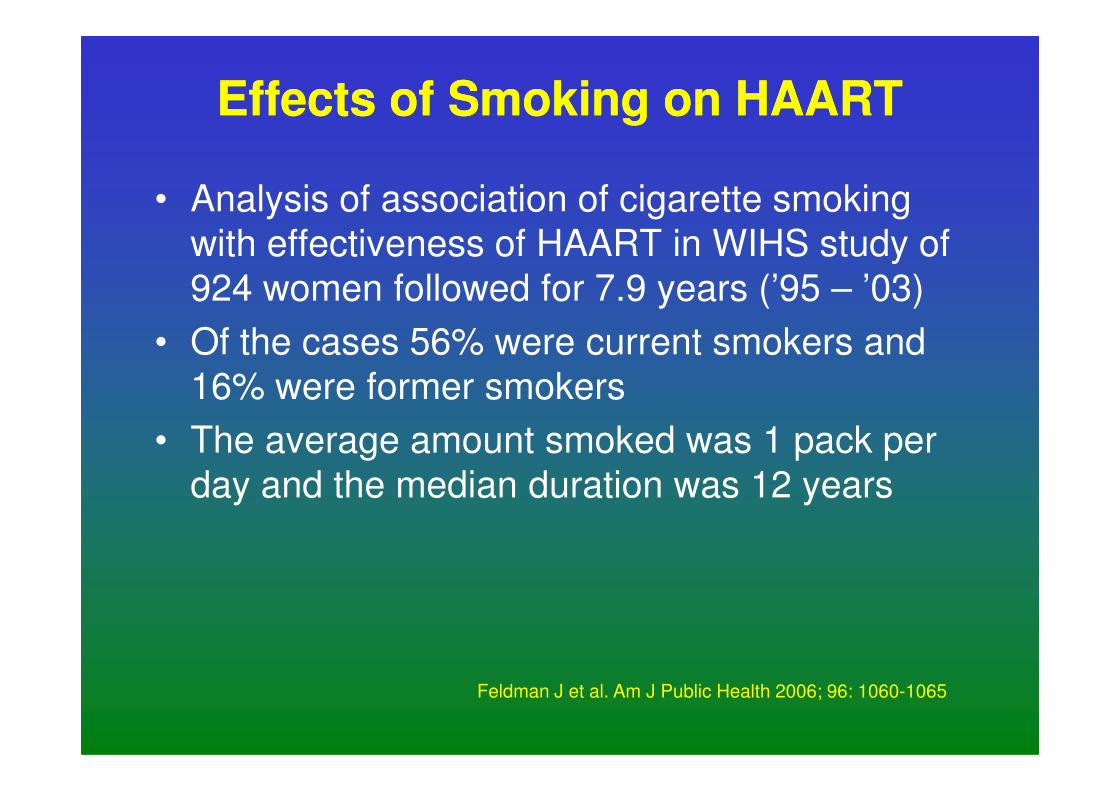
Effects of Smoking on HAARTEffects of Smoking on HAART
• Analysis of association of cigarette smoking
with effectiveness of HAART in WIHS study of
924 women followed for 7.9 years (’95 – ’03)
• Of the cases 56% were current smokers and
16% were former smokers16% were former smokers
• The average amount smoked was 1 pack per
day and the median duration was 12 years
Feldman J et al. Am J Public Health 2006; 96: 1060-1065
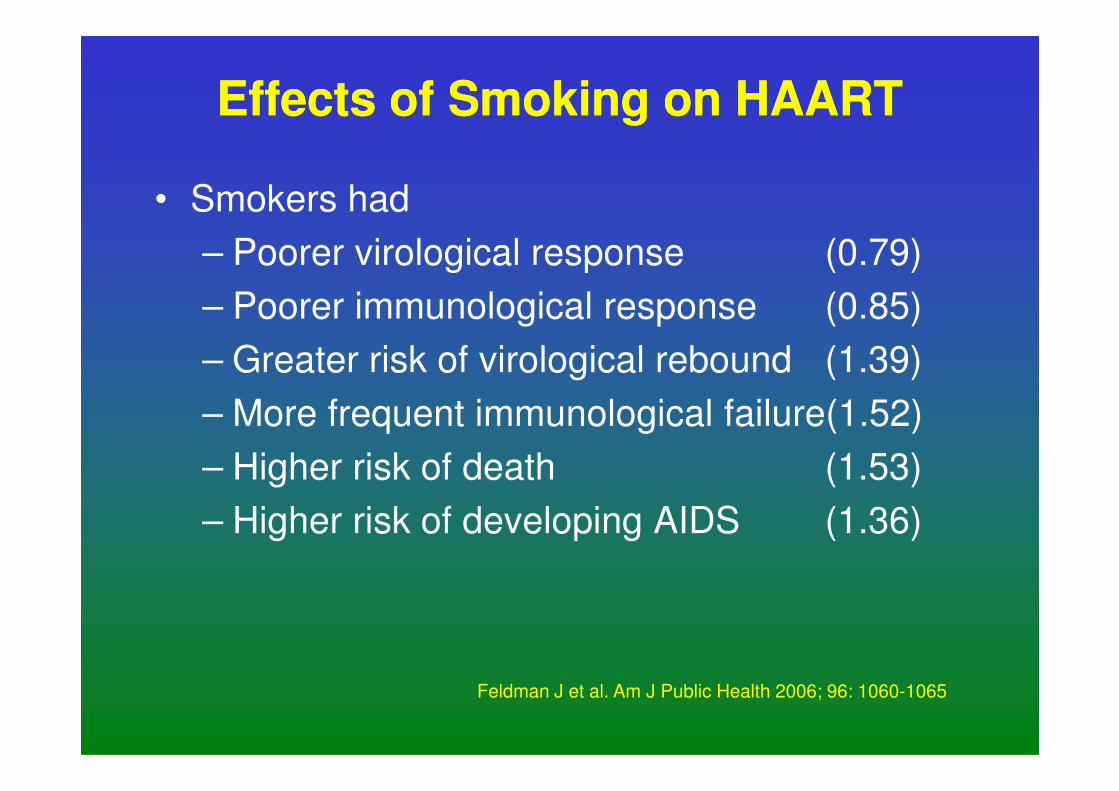
Effects of Smoking on HAARTEffects of Smoking on HAART
• Smokers had
– Poorer virological response (0.79)
– Poorer immunological response (0.85)
– Greater risk of virological rebound (1.39)
– More frequent immunological failure(1.52)– More frequent immunological failure(1.52)
– Higher risk of death (1.53)
– Higher risk of developing AIDS (1.36)
Feldman J et al. Am J Public Health 2006; 96: 1060-1065
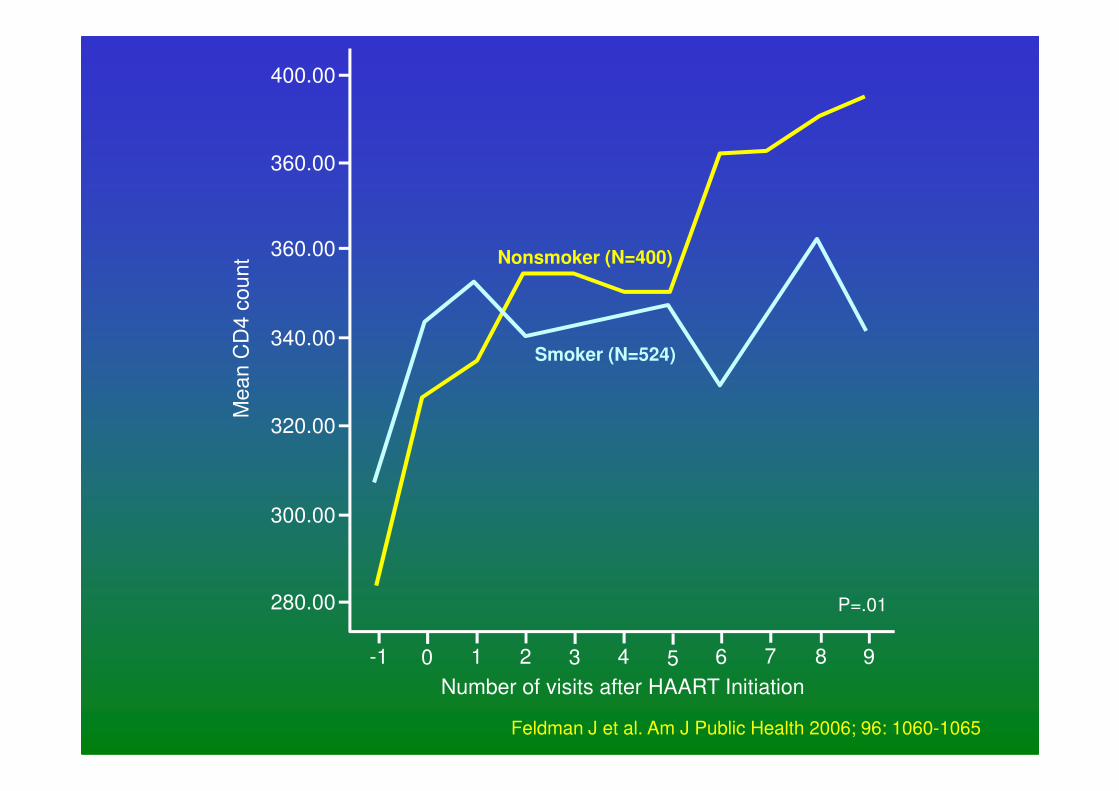
400.00
360.00
360.00
340.00
Me
an
CD
4 c
ou
nt Nonsmoker (N=400)
Smoker (N=524)
320.00
300.00
280.00
-1 0 1 2 3 4 5 6 7 8 9
Number of visits after HAART Initiation
Me
an
CD
4 c
ou
nt
P=.01
Feldman J et al. Am J Public Health 2006; 96: 1060-1065
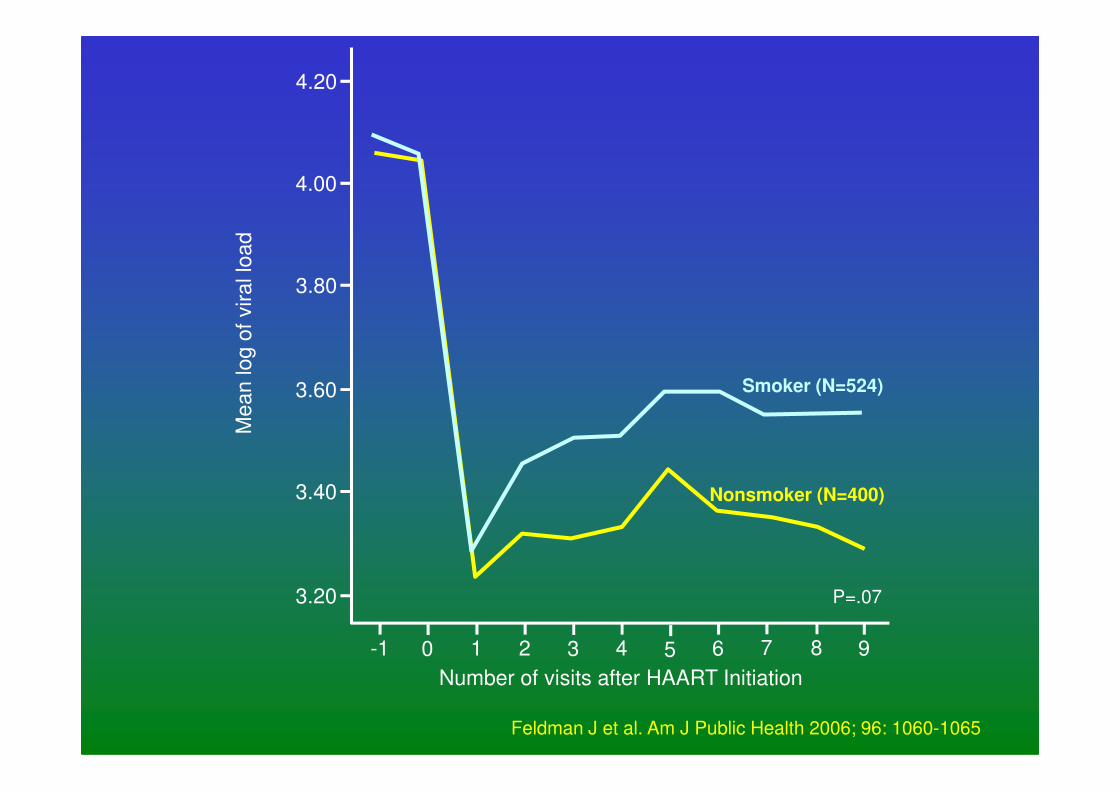
4.20
4.00
3.80
3.60
Me
an
lo
g o
f vir
al lo
ad
Smoker (N=524)3.60
3.40
3.20
-1 0 1 2 3 4 5 6 7 8 9
Number of visits after HAART Initiation
Me
an
lo
g o
f vir
al lo
ad
P=.07
Nonsmoker (N=400)
Smoker (N=524)
Feldman J et al. Am J Public Health 2006; 96: 1060-1065
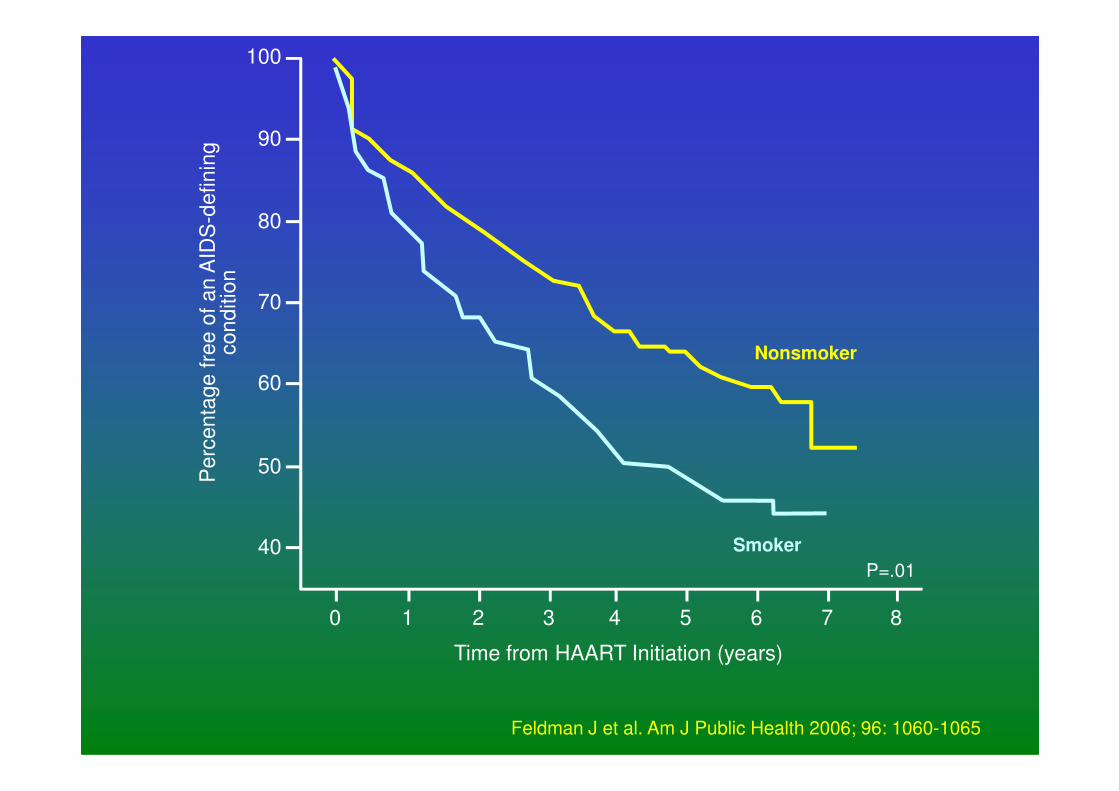
90
100
80
70
60
Pe
rce
nta
ge
fre
e o
f a
n A
IDS
-de
fin
ing
co
nd
itio
n
Nonsmoker
50
40
Pe
rce
nta
ge
fre
e o
f a
n A
IDS
0 1 2 3 4 5 6 7 8
P=.01
Time from HAART Initiation (years)
Smoker
Feldman J et al. Am J Public Health 2006; 96: 1060-1065
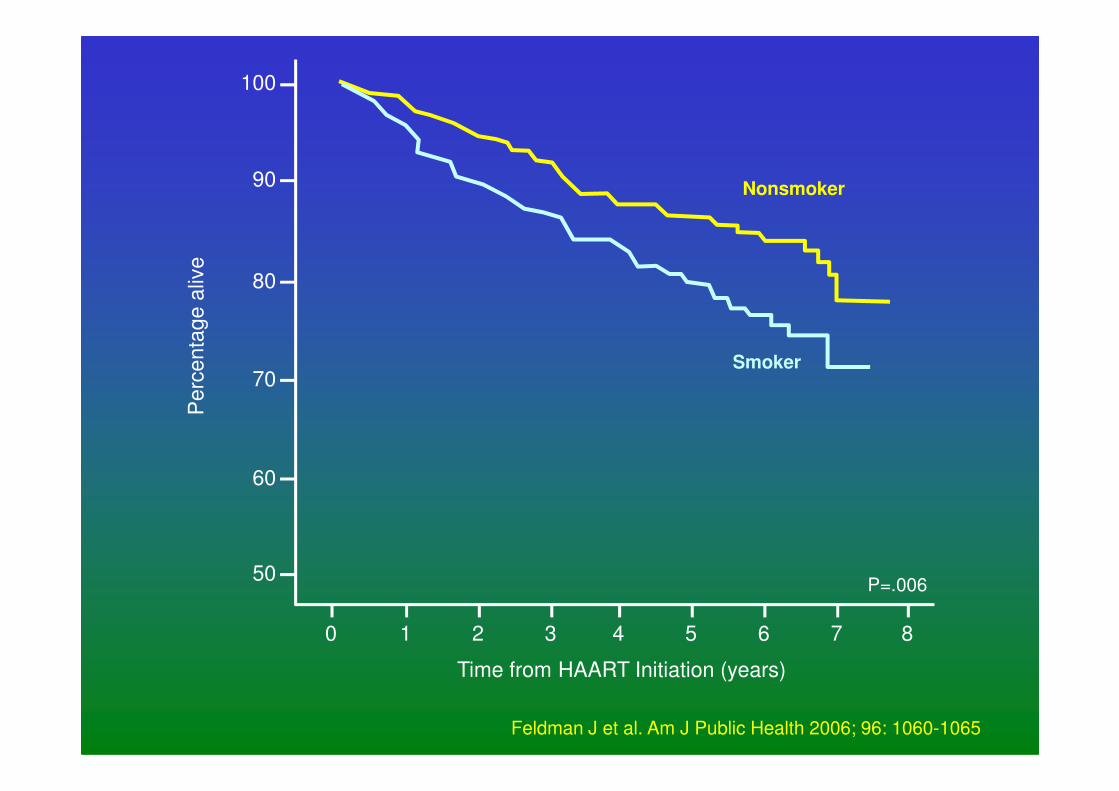
90
100
80
70
Pe
rce
nta
ge
aliv
e
Nonsmoker
Smoker
60
50
Pe
rce
nta
ge
aliv
e
0 1 2 3 4 5 6 7 8
P=.006
Time from HAART Initiation (years)
Feldman J et al. Am J Public Health 2006; 96: 1060-1065
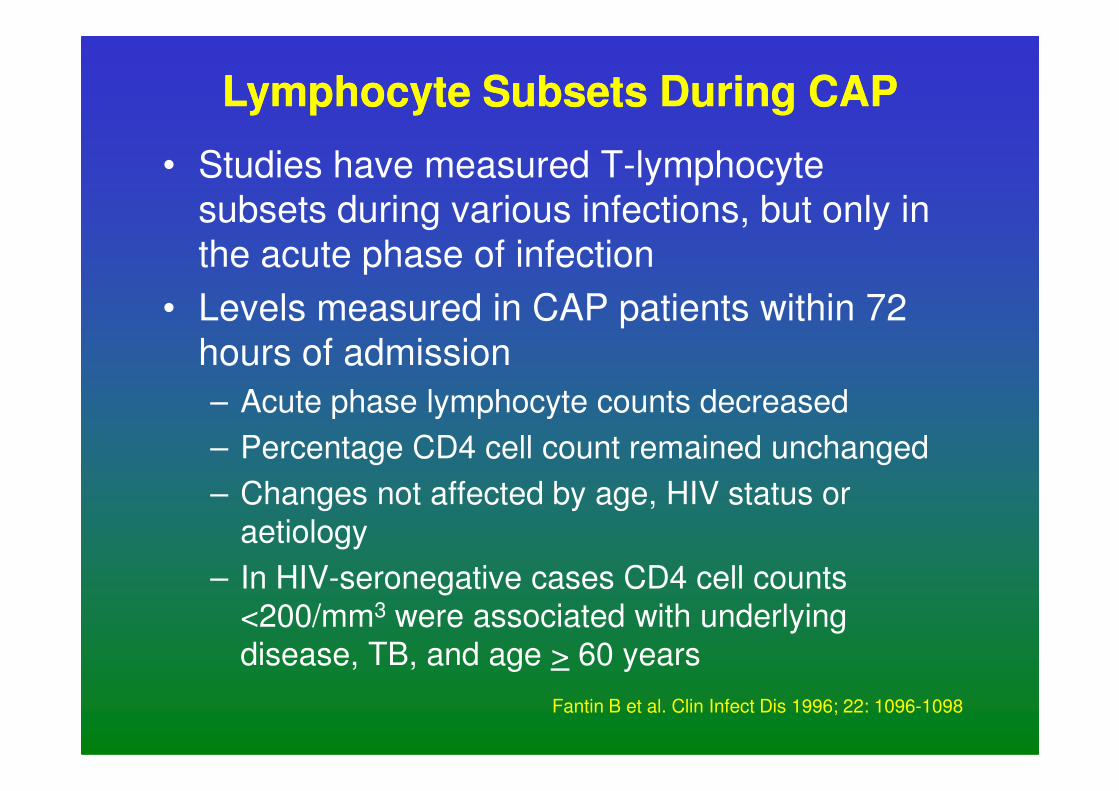
• Studies have measured T-lymphocyte
subsets during various infections, but only in
the acute phase of infection
• Levels measured in CAP patients within 72
hours of admission
– Acute phase lymphocyte counts decreased
Lymphocyte Subsets During CAPLymphocyte Subsets During CAP
– Acute phase lymphocyte counts decreased
– Percentage CD4 cell count remained unchanged
– Changes not affected by age, HIV status or
aetiology
– In HIV-seronegative cases CD4 cell counts
<200/mm3 were associated with underlying
disease, TB, and age > 60 years
Fantin B et al. Clin Infect Dis 1996; 22: 1096-1098
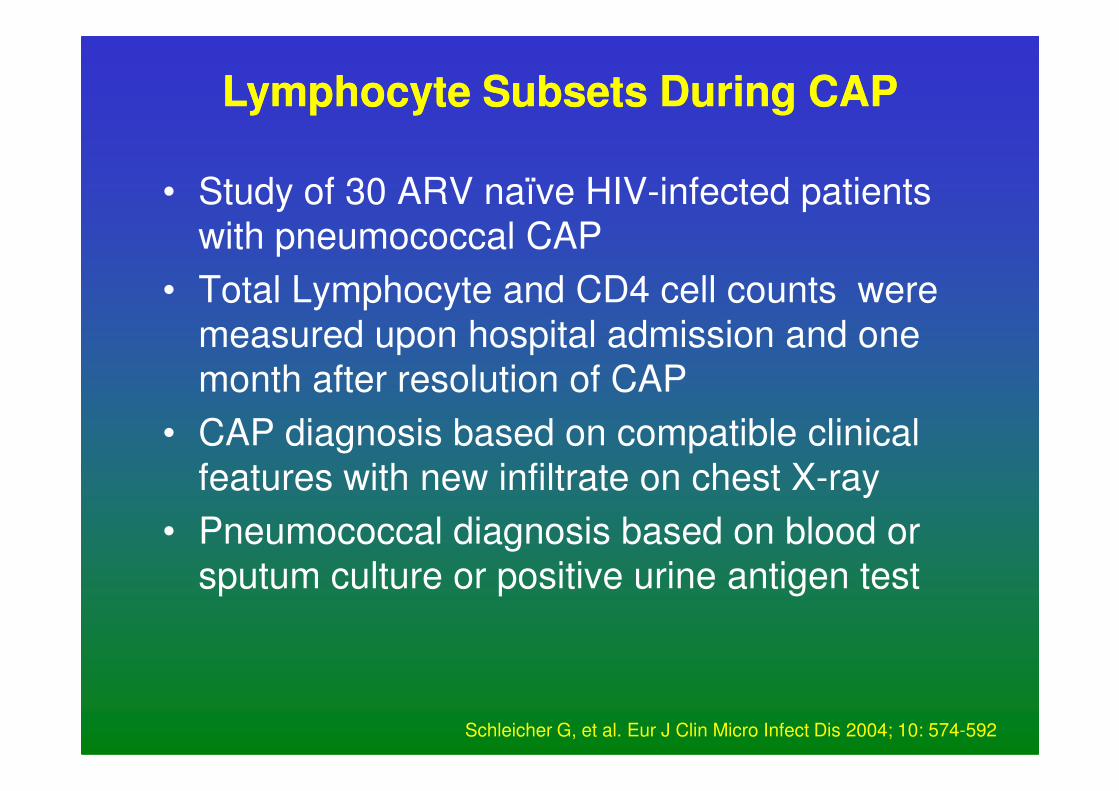
• Study of 30 ARV naïve HIV-infected patients
with pneumococcal CAP
• Total Lymphocyte and CD4 cell counts were
measured upon hospital admission and one
month after resolution of CAP
Lymphocyte Subsets During CAPLymphocyte Subsets During CAP
month after resolution of CAP
• CAP diagnosis based on compatible clinical
features with new infiltrate on chest X-ray
• Pneumococcal diagnosis based on blood or
sputum culture or positive urine antigen test
Schleicher G, et al. Eur J Clin Micro Infect Dis 2004; 10: 574-592
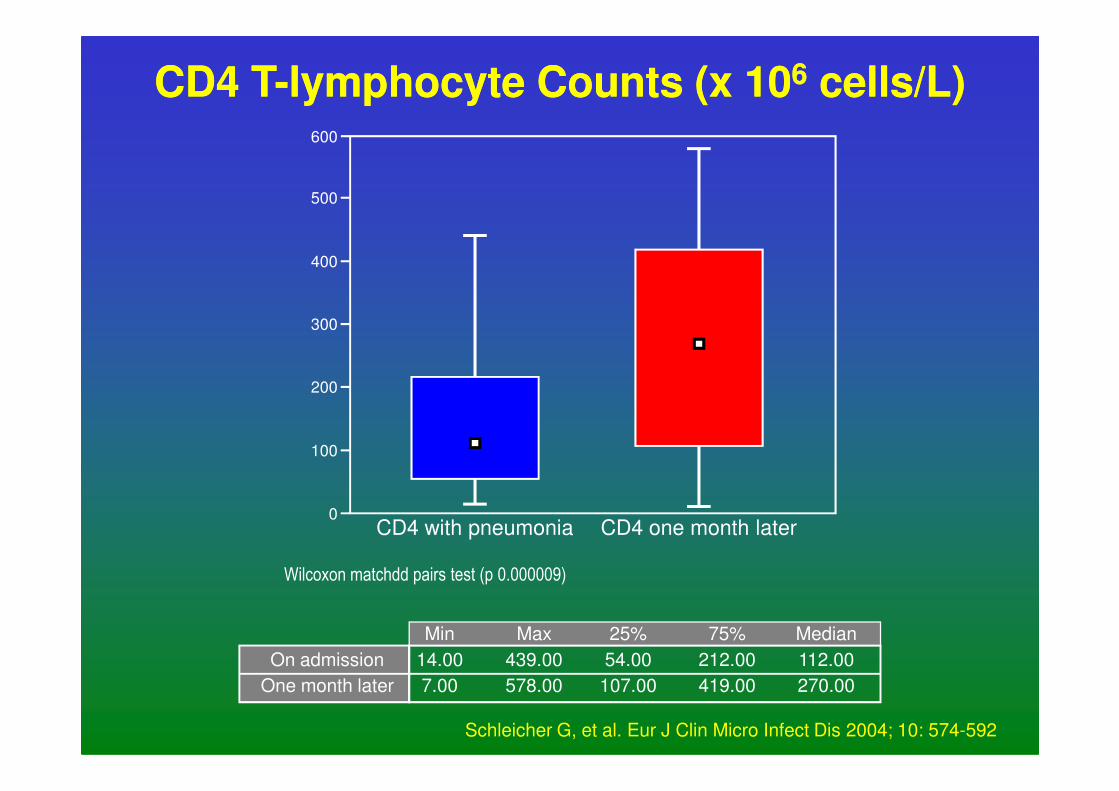
CD4 TCD4 T--lymphocyte Counts (x 10lymphocyte Counts (x 1066 cells/L)cells/L)600
500
400
300
200
CD4 with pneumonia CD4 one month later
200
100
0
Wilcoxon matchdd pairs test (p 0.000009)
Min
14.00
7.00
Max
439.00
578.00
25%
54.00
107.00
75%
212.00
419.00
Median
112.00
270.00
On admission
One month later
Schleicher G, et al. Eur J Clin Micro Infect Dis 2004; 10: 574-592
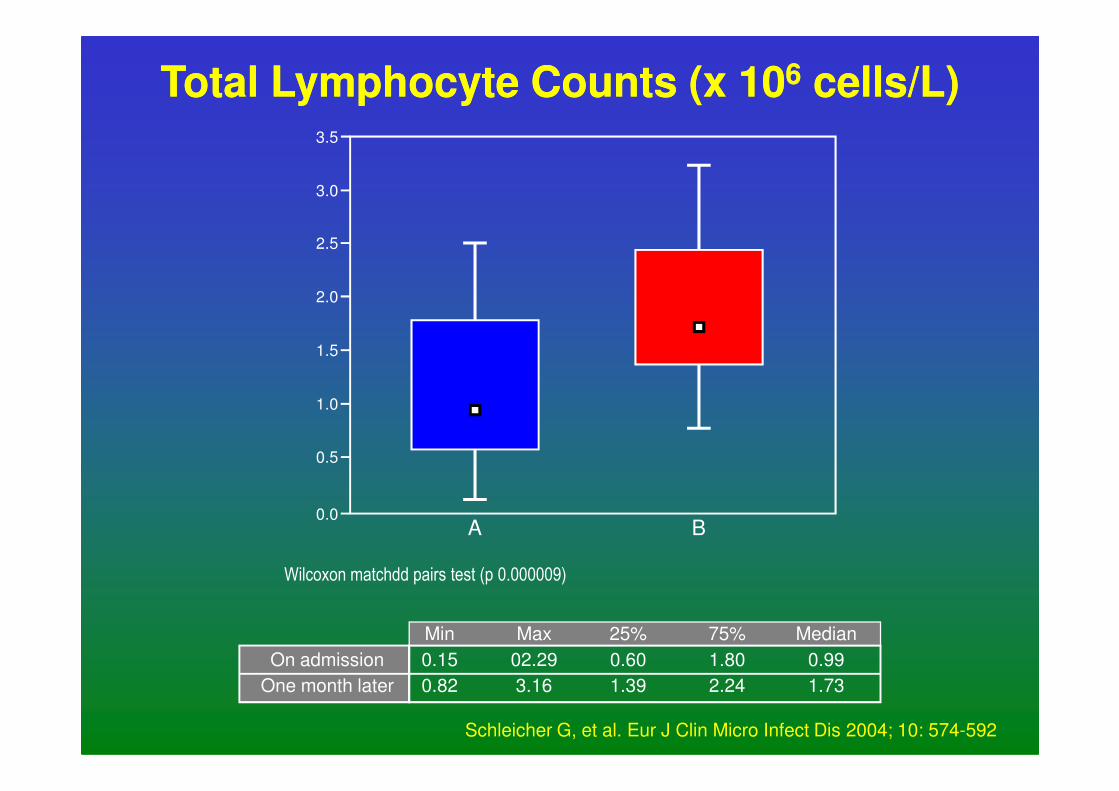
Total Lymphocyte Counts (x 10Total Lymphocyte Counts (x 1066 cells/L)cells/L)3.5
3.0
2.5
2.0
1.5
1.0
A B
1.0
0.0
0.5
Wilcoxon matchdd pairs test (p 0.000009)
Min
0.15
0.82
Max
02.29
3.16
25%
0.60
1.39
75%
1.80
2.24
Median
0.99
1.73
On admission
One month later
Schleicher G, et al. Eur J Clin Micro Infect Dis 2004; 10: 574-592
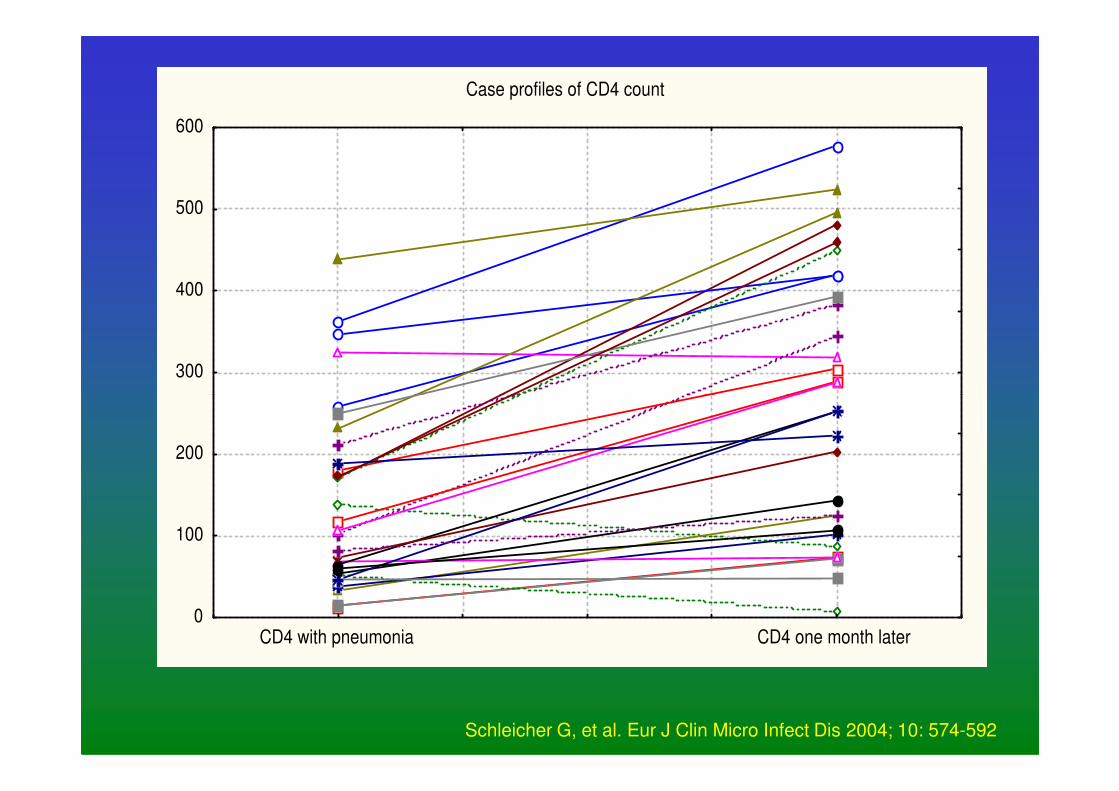
Case profiles of CD4 count
300
400
500
600
0
100
200
CD4 with pneumonia CD4 one month later
Schleicher G, et al. Eur J Clin Micro Infect Dis 2004; 10: 574-592
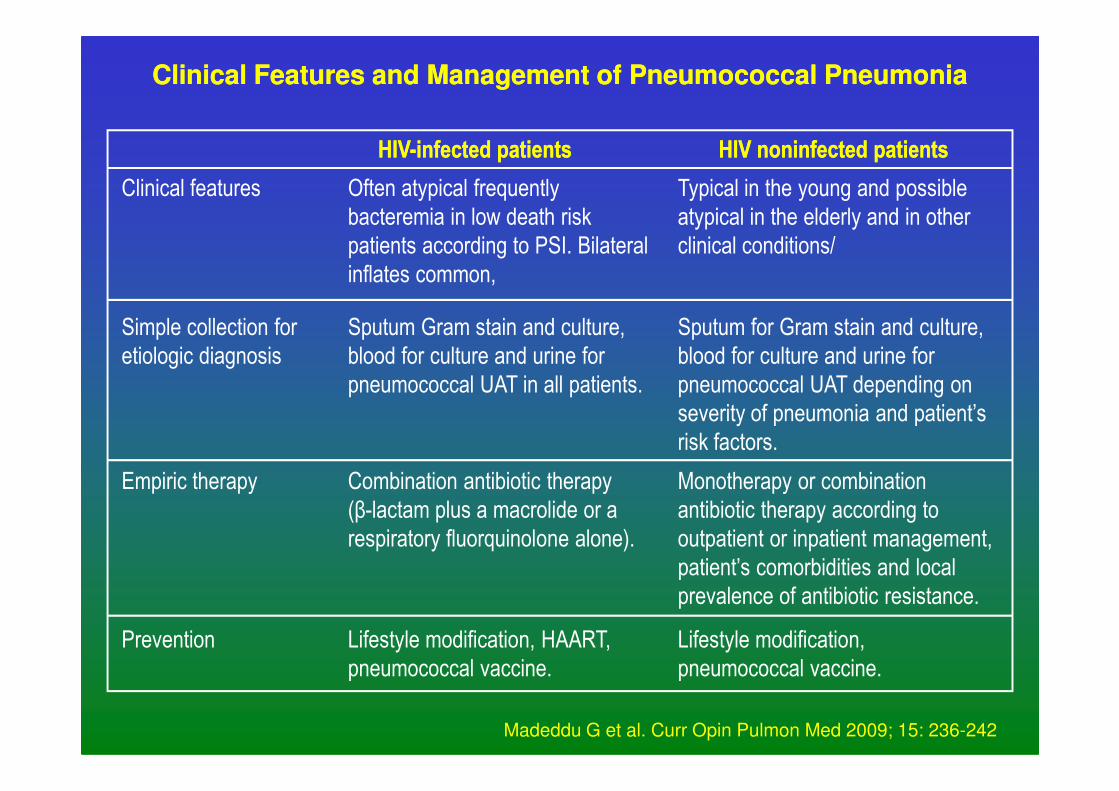
Clinical Features and Management of Pneumococcal Pneumonia Clinical Features and Management of Pneumococcal Pneumonia
Typical in the young and possible
atypical in the elderly and in other
clinical conditions/
Often atypical frequently
bacteremia in low death risk
patients according to PSI. Bilateral
inflates common,
Clinical features
Sputum for Gram stain and culture,
blood for culture and urine for
pneumococcal UAT depending on
Sputum Gram stain and culture,
blood for culture and urine for
pneumococcal UAT in all patients.
Simple collection for
etiologic diagnosis
HIVHIV--infected patientsinfected patients HIV HIV noninfectednoninfected patientspatients
pneumococcal UAT depending on
severity of pneumonia and patient’s
risk factors.
pneumococcal UAT in all patients.
Monotherapy or combination
antibiotic therapy according to
outpatient or inpatient management,
patient’s comorbidities and local
prevalence of antibiotic resistance.
Combination antibiotic therapy
(β-lactam plus a macrolide or a
respiratory fluorquinolone alone).
Empiric therapy
Lifestyle modification,
pneumococcal vaccine.
Lifestyle modification, HAART,
pneumococcal vaccine.
Prevention
Madeddu G et al. Curr Opin Pulmon Med 2009; 15: 236-242
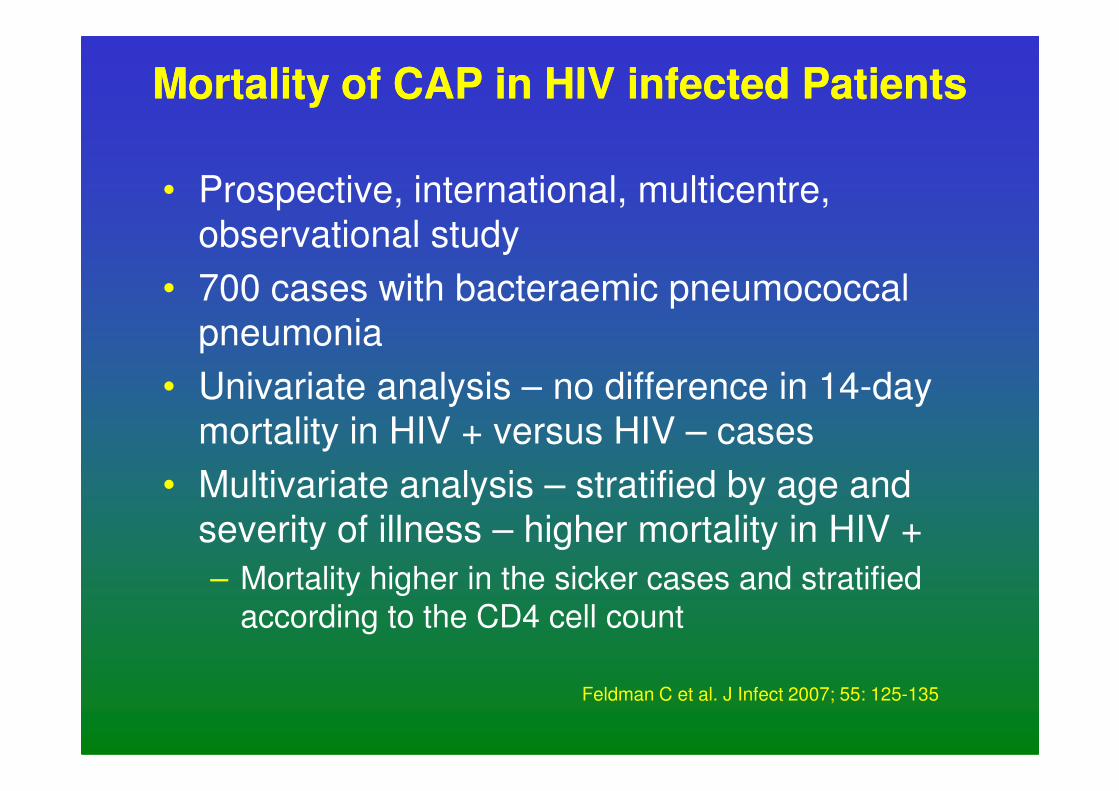
• Prospective, international, multicentre,
observational study
• 700 cases with bacteraemic pneumococcal
pneumonia
• Univariate analysis – no difference in 14-day
Mortality of CAP in HIV infected PatientsMortality of CAP in HIV infected Patients
• Univariate analysis – no difference in 14-day
mortality in HIV + versus HIV – cases
• Multivariate analysis – stratified by age and
severity of illness – higher mortality in HIV +
– Mortality higher in the sicker cases and stratified
according to the CD4 cell count
Feldman C et al. J Infect 2007; 55: 125-135
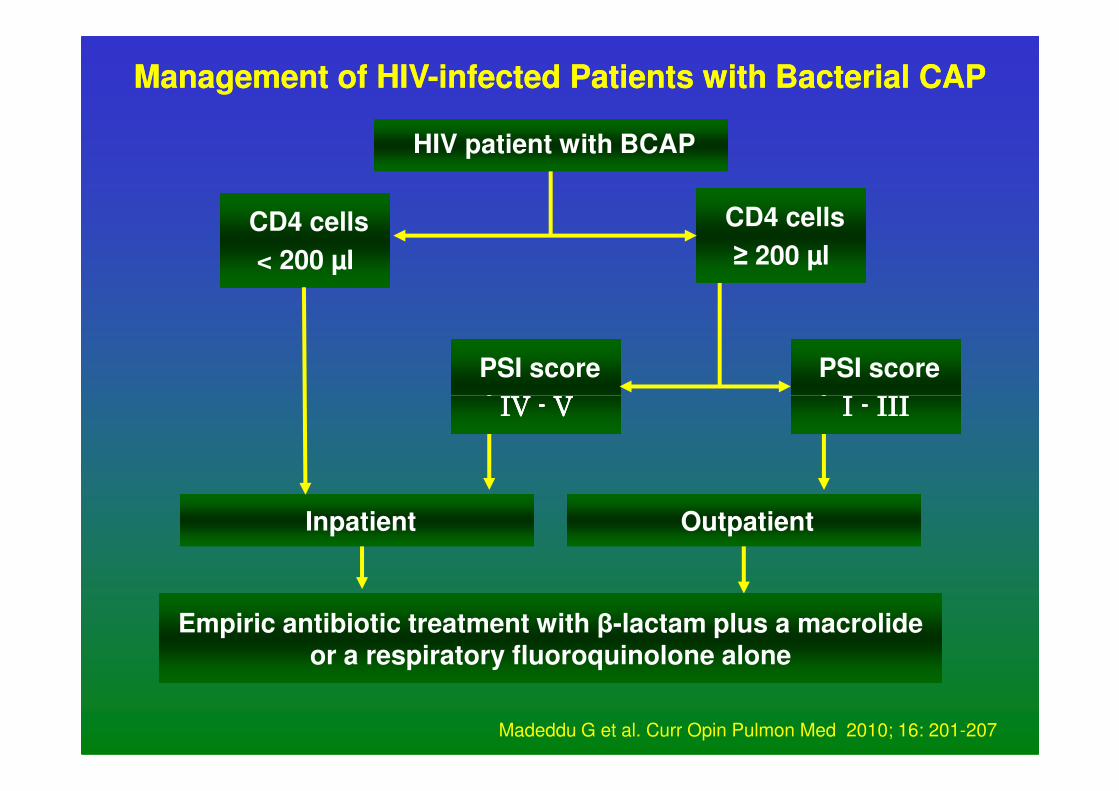
Management of HIVManagement of HIV--infected Patients with Bacterial CAPinfected Patients with Bacterial CAP
HIV patient with BCAP
CD4 cells
< 200 µl
CD4 cells
≥ 200 µl
PSI score
I I I I ---- IIIIIIIIIIII
PSI score
IV IV IV IV ---- VVVV I I I I ---- IIIIIIIIIIIIIV IV IV IV ---- VVVV
Outpatient Inpatient
Empiric antibiotic treatment with β-lactam plus a macrolide or a respiratory fluoroquinolone alone
Madeddu G et al. Curr Opin Pulmon Med 2010; 16: 201-207
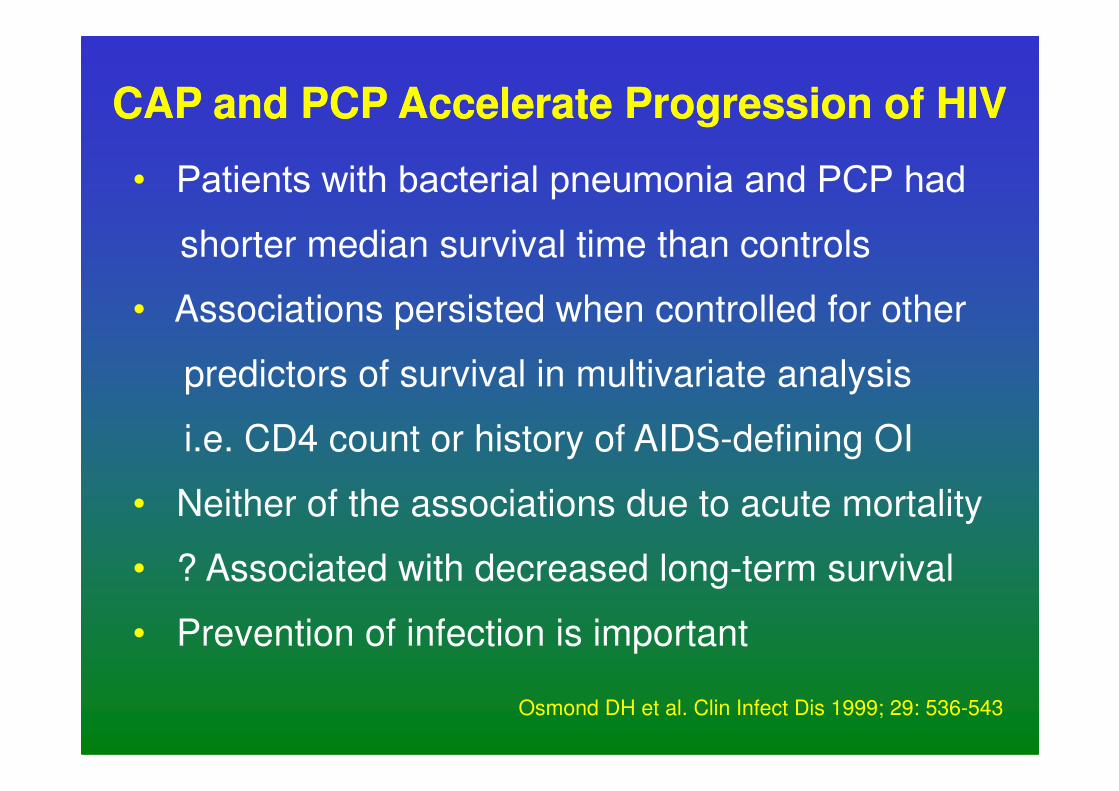
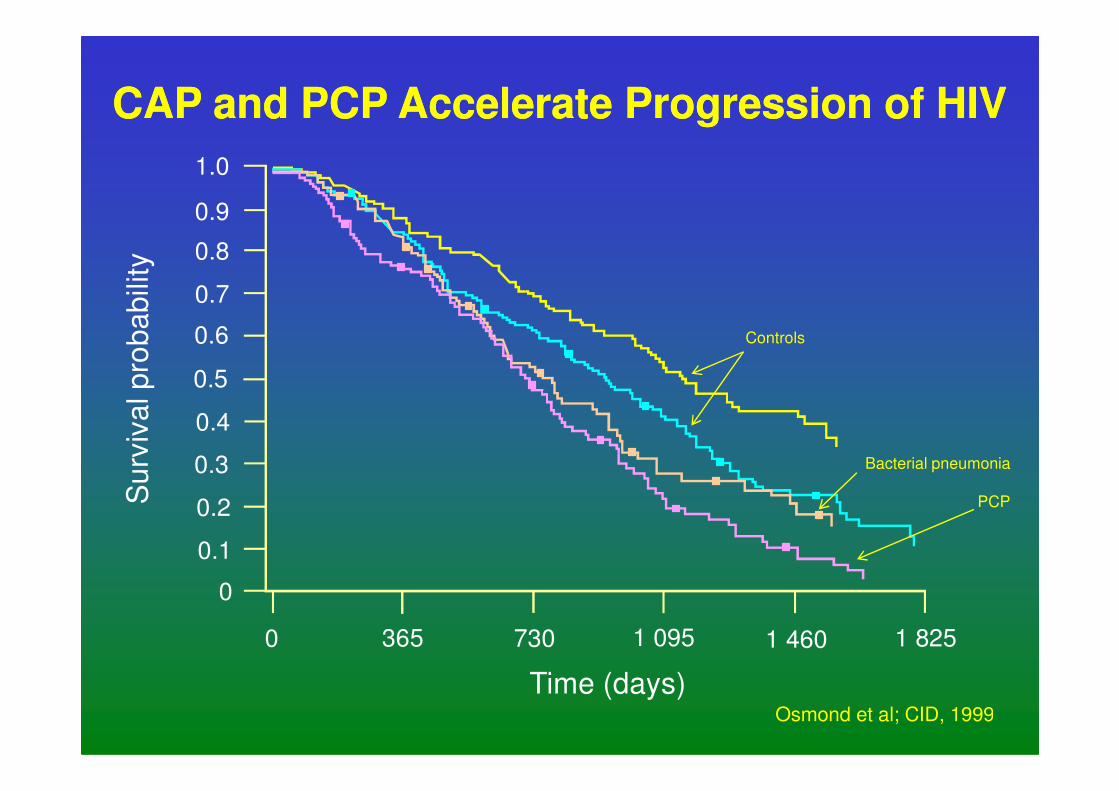
• Patients with bacterial pneumonia and PCP hadshorter median survival time than controls
• Associations persisted when controlled for other
predictors of survival in multivariate analysis
CAP and PCP Accelerate Progression of HIVCAP and PCP Accelerate Progression of HIV
i.e. CD4 count or history of AIDS-defining OI
• Neither of the associations due to acute mortality
• ? Associated with decreased long-term survival
• Prevention of infection is important
Osmond DH et al. Clin Infect Dis 1999; 29: 536-543
0.6
1.0l p
rob
ab
ility
0.7
0.5
0.9
0.8
CAP and PCP Accelerate Progression of HIVCAP and PCP Accelerate Progression of HIV
Controls
0 365 730 1 825
Time (days)
Su
rviv
al
1 095 1 460
Osmond et al; CID, 1999
0.4
0.3
0.2
0.1
0
Bacterial pneumonia
PCP
- 200
- 100 BPBP
BP
PCPPCP
- 2.0
- 1.0
Hg- 200
- 100 BPBP
BP
PCPPCP
- 2.0
- 1.0
Hg
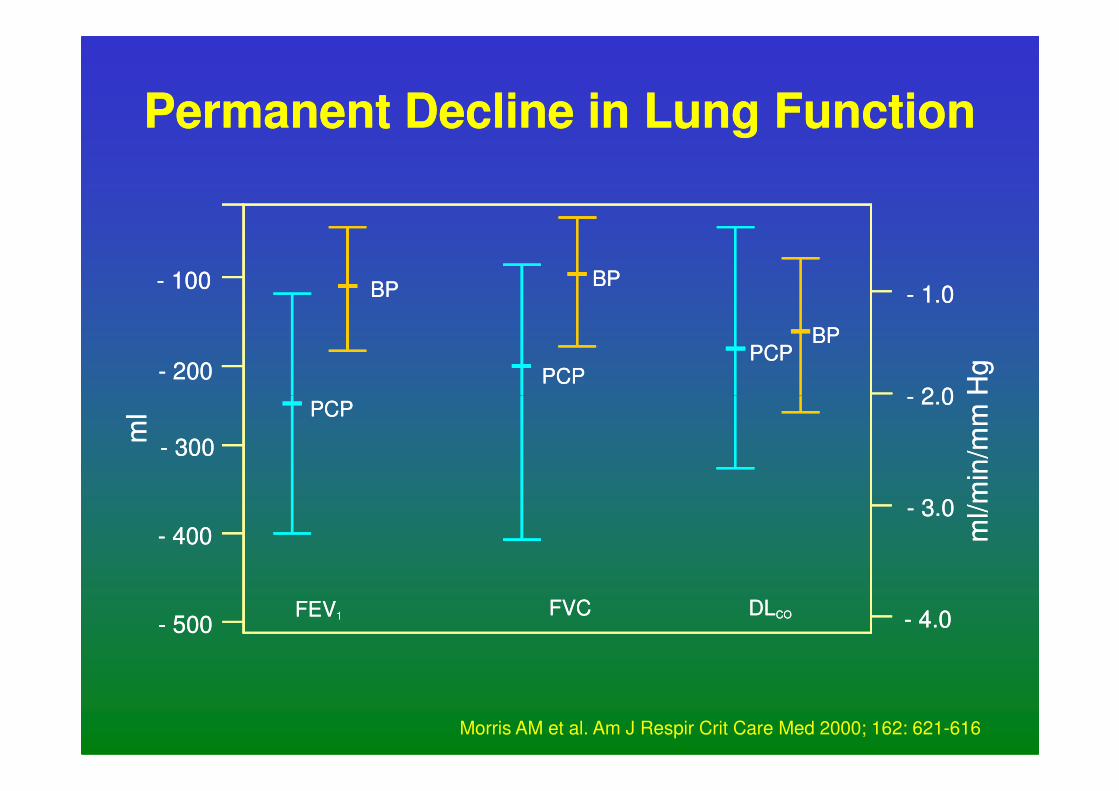
Permanent Decline in Lung FunctionPermanent Decline in Lung Function
FEV1
ml
- 500
- 400
- 300
PCP
FVC DLCO
- 2.0
- 3.0
- 4.0
ml/m
in/m
mH
FEV1
ml
- 500
- 400
- 300
PCP
FVC DLCO
- 2.0
- 3.0
- 4.0
ml/m
in/m
mH
Morris AM et al. Am J Respir Crit Care Med 2000; 162: 621-616
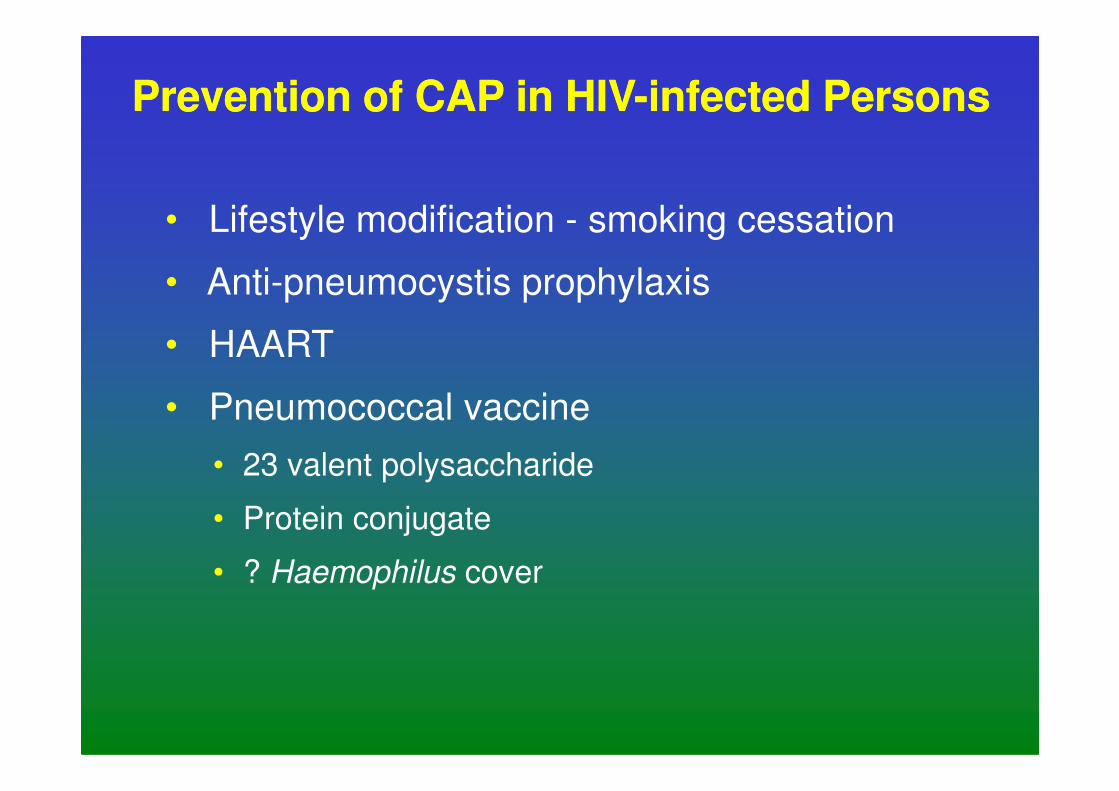
Prevention of CAP in HIVPrevention of CAP in HIV--infected Personsinfected Persons
• Lifestyle modification - smoking cessation
• Anti-pneumocystis prophylaxis
• HAART
• Pneumococcal vaccine• Pneumococcal vaccine
• 23 valent polysaccharide
• Protein conjugate
• ? Haemophilus cover
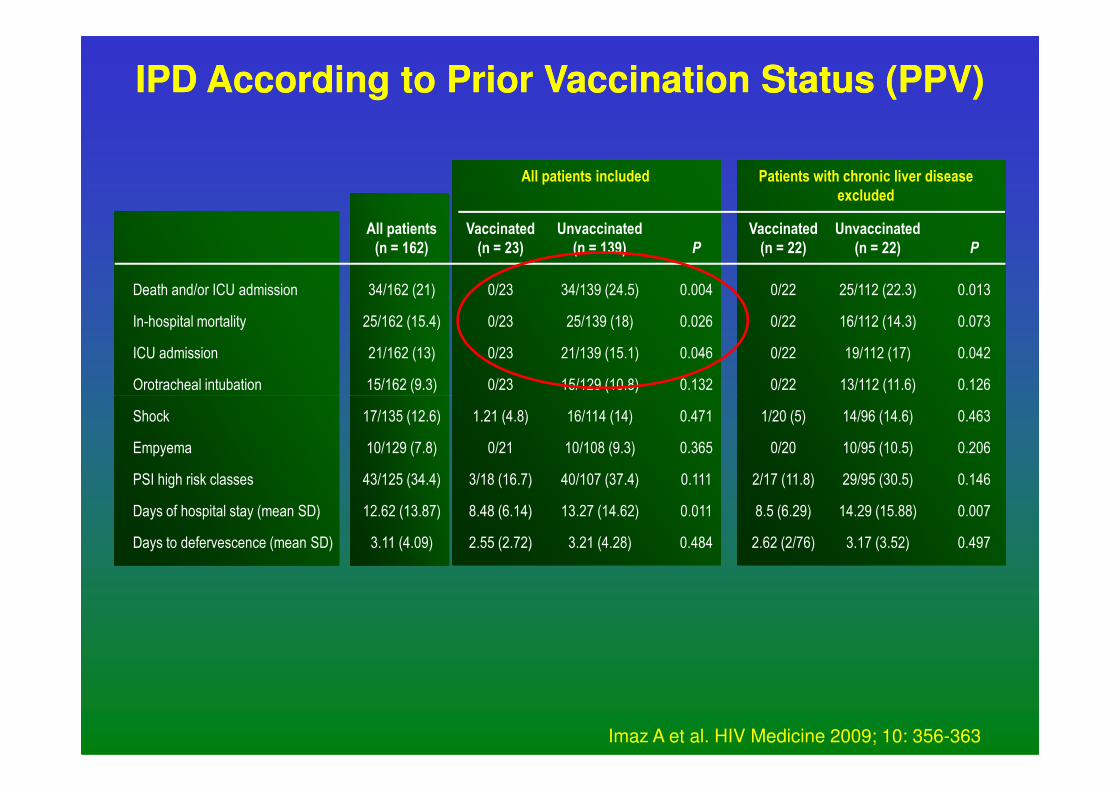
IPD According to Prior Vaccination Status (PPV)IPD According to Prior Vaccination Status (PPV)
Death and/or ICU admission
In-hospital mortality
ICU admission
Orotracheal intubation
34/162 (21)
25/162 (15.4)
21/162 (13)
15/162 (9.3)
0/22
0/22
0/22
0/22
25/112 (22.3)
16/112 (14.3)
19/112 (17)
13/112 (11.6)
0.013
0.073
0.042
0.126
Unvaccinated
(n = 22) P
Vaccinated
(n = 22)
0/23
0/23
0/23
0/23
34/139 (24.5)
25/139 (18)
21/139 (15.1)
15/129 (10.8)
0.004
0.026
0.046
0.132
P
Unvaccinated
(n = 139)
Vaccinated
(n = 23)
All patients
(n = 162)
Patients with chronic liver disease
excluded
All patients included
Shock
Empyema
PSI high risk classes
Days of hospital stay (mean SD)
Days to defervescence (mean SD)
17/135 (12.6)
10/129 (7.8)
43/125 (34.4)
12.62 (13.87)
3.11 (4.09)
1/20 (5)
0/20
2/17 (11.8)
8.5 (6.29)
2.62 (2/76)
14/96 (14.6)
10/95 (10.5)
29/95 (30.5)
14.29 (15.88)
3.17 (3.52)
0.463
0.206
0.146
0.007
0.497
1.21 (4.8)
0/21
3/18 (16.7)
8.48 (6.14)
2.55 (2.72)
16/114 (14)
10/108 (9.3)
40/107 (37.4)
13.27 (14.62)
3.21 (4.28)
0.471
0.365
0.111
0.011
0.484
Imaz A et al. HIV Medicine 2009; 10: 356-363
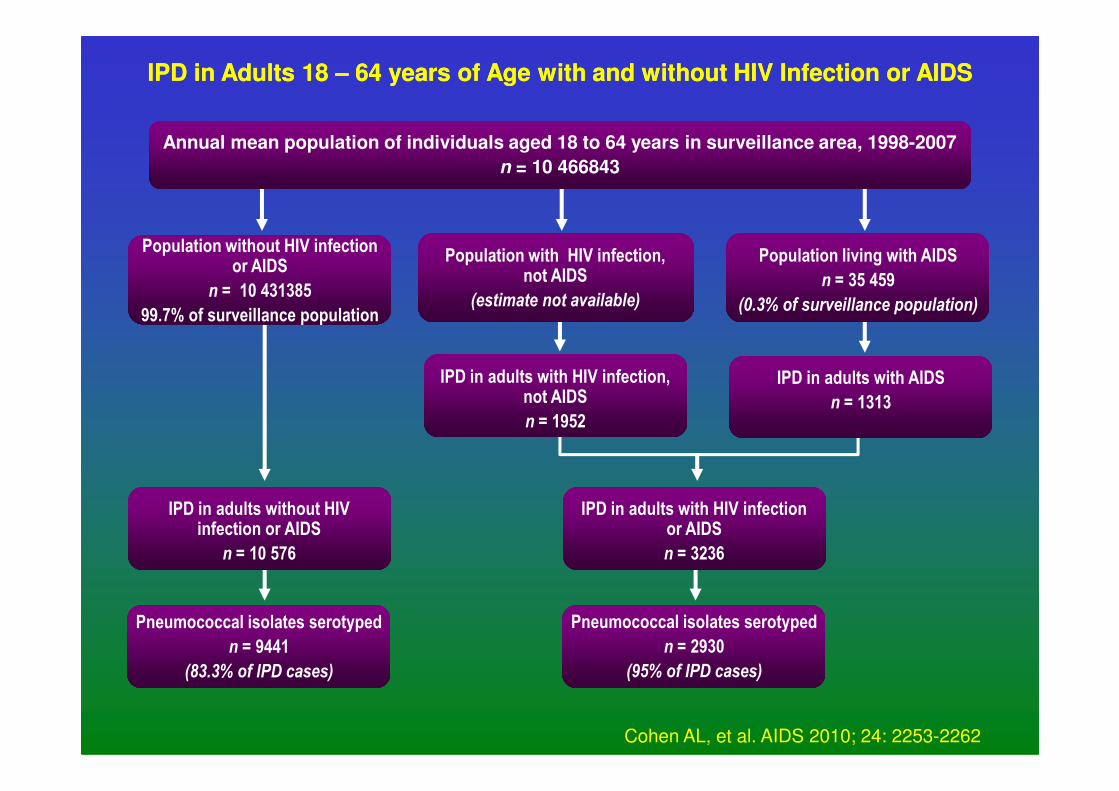
IPD in Adults 18 IPD in Adults 18 –– 64 years of Age with and without HIV Infection or AIDS64 years of Age with and without HIV Infection or AIDS
Annual mean population of individuals aged 18 to 64 years in surveillance area, 1998-2007
n = 10 466843
Population without HIV infection or AIDS
n = 10 431385
99.7% of surveillance population
Population with HIV infection, not AIDS
(estimate not available)
Population living with AIDS
n = 35 459
(0.3% of surveillance population)
IPD in adults with HIV infection, not AIDS
IPD in adults with AIDS
n = 1313
Pneumococcal isolates serotyped
n = 2930
(95% of IPD cases)
Pneumococcal isolates serotyped
n = 9441
(83.3% of IPD cases)
not AIDS
n = 1952n = 1313
IPD in adults without HIV infection or AIDS
n = 10 576
IPD in adults with HIV infection or AIDS
n = 3236
Cohen AL, et al. AIDS 2010; 24: 2253-2262
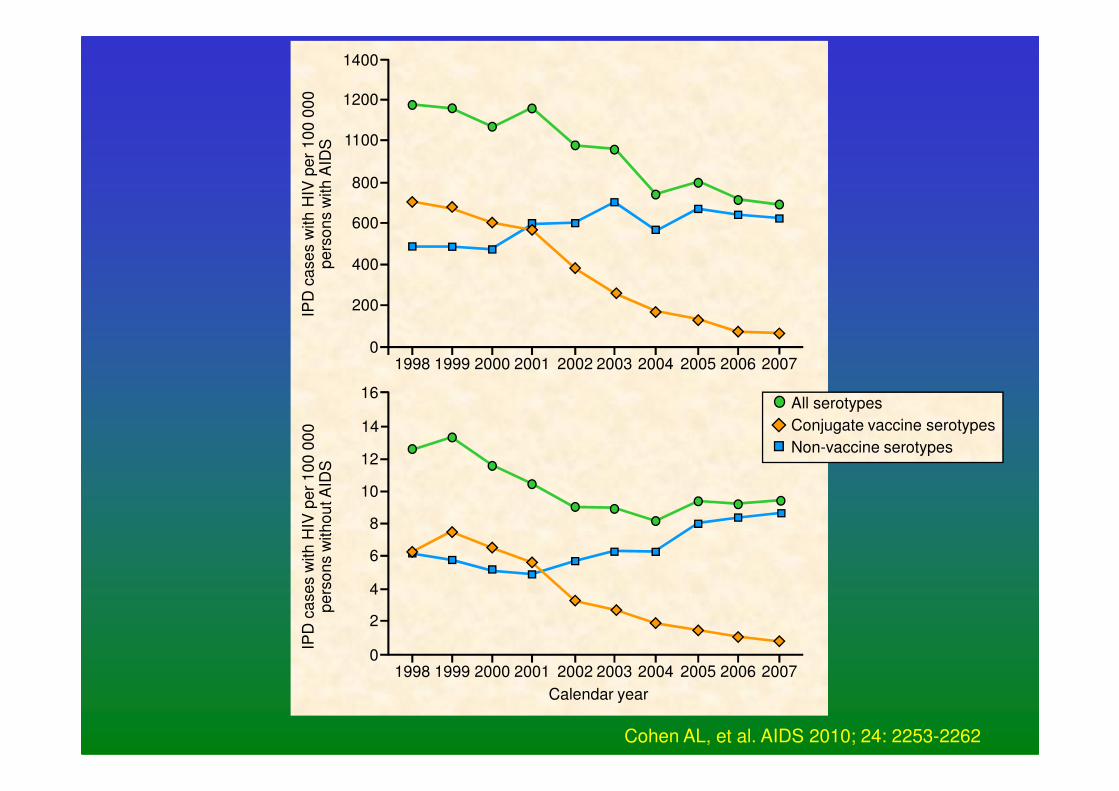
1400
1200
1100
800
600
400
200
01998 1999 2000 2001 2002 2003 2004 2005 2006 2007
IPD
ca
se
s w
ith
HIV
pe
r 1
00
00
0
pe
rso
ns w
ith
AID
S
16All serotypes
16
12
10
8
6
4
2
01998 1999 2000 2001 2002 2003 2004 2005 2006 2007
IPD
ca
se
s w
ith
HIV
pe
r 1
00
00
0
pe
rso
ns w
ith
ou
t A
IDS
14
Calendar year
All serotypes
Conjugate vaccine serotypes
Non-vaccine serotypes
Cohen AL, et al. AIDS 2010; 24: 2253-2262
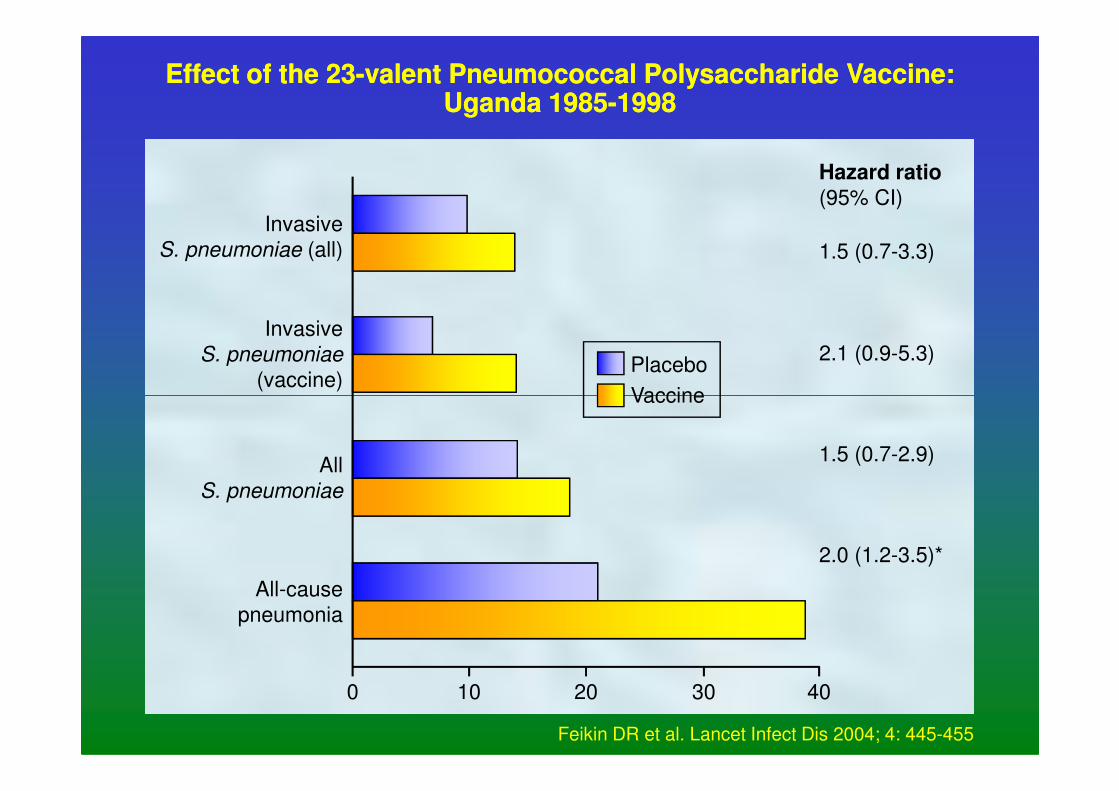
Effect of the 23Effect of the 23--valent Pneumococcal Polysaccharide Vaccine:valent Pneumococcal Polysaccharide Vaccine:Uganda 1985Uganda 1985--1998 1998
Invasive
S. pneumoniae (all)
Invasive
S. pneumoniae
(vaccine)
1.5 (0.7-3.3)
2.1 (0.9-5.3)
Hazard ratio
(95% CI)
Placebo
Vaccine
0 10 20 30 40
All
S. pneumoniae
All-cause
pneumonia
1.5 (0.7-2.9)
2.0 (1.2-3.5)*
Vaccine
Feikin DR et al. Lancet Infect Dis 2004; 4: 445-455
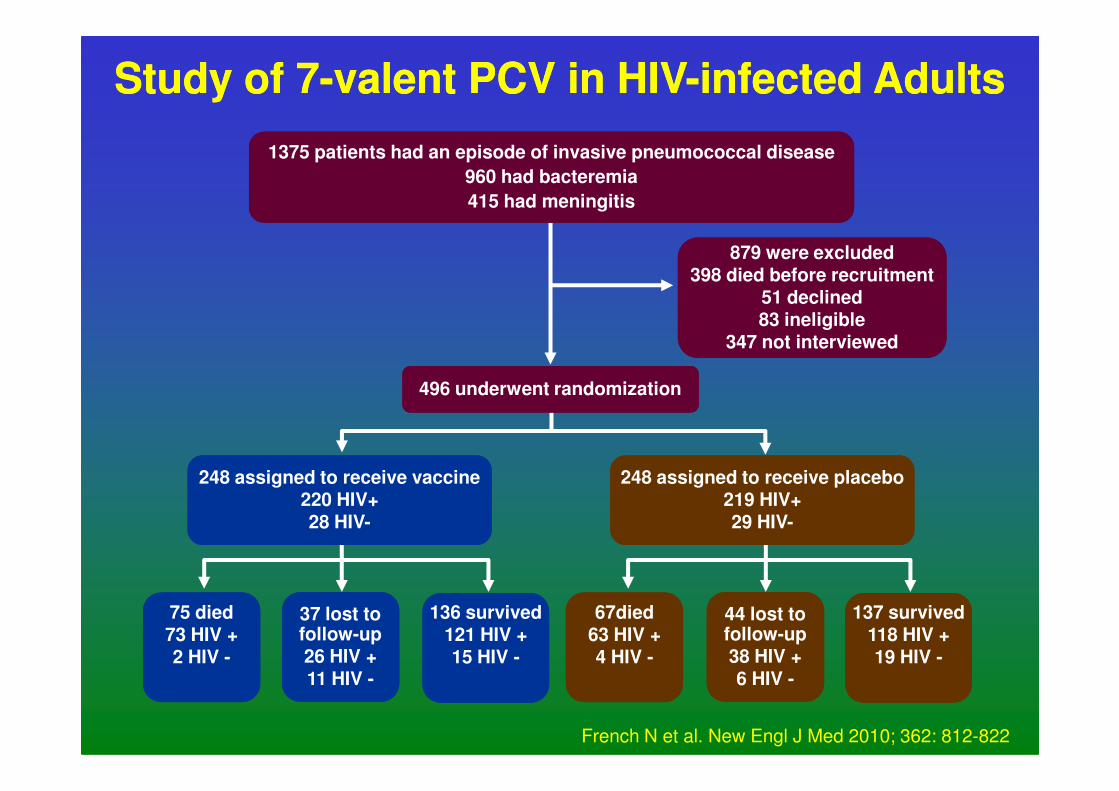
Study of 7Study of 7--valent PCV in HIVvalent PCV in HIV--infected Adultsinfected Adults
1375 patients had an episode of invasive pneumococcal disease
960 had bacteremia
415 had meningitis
879 were excluded398 died before recruitment
51 declined83 ineligible
347 not interviewed
496 underwent randomization496 underwent randomization
75 died73 HIV +2 HIV -
37 lost to follow-up26 HIV +11 HIV -
136 survived121 HIV +15 HIV -
67died63 HIV +4 HIV -
44 lost to follow-up38 HIV +6 HIV -
137 survived118 HIV +19 HIV -
248 assigned to receive vaccine220 HIV+28 HIV-
248 assigned to receive placebo219 HIV+29 HIV-
French N et al. New Engl J Med 2010; 362: 812-822
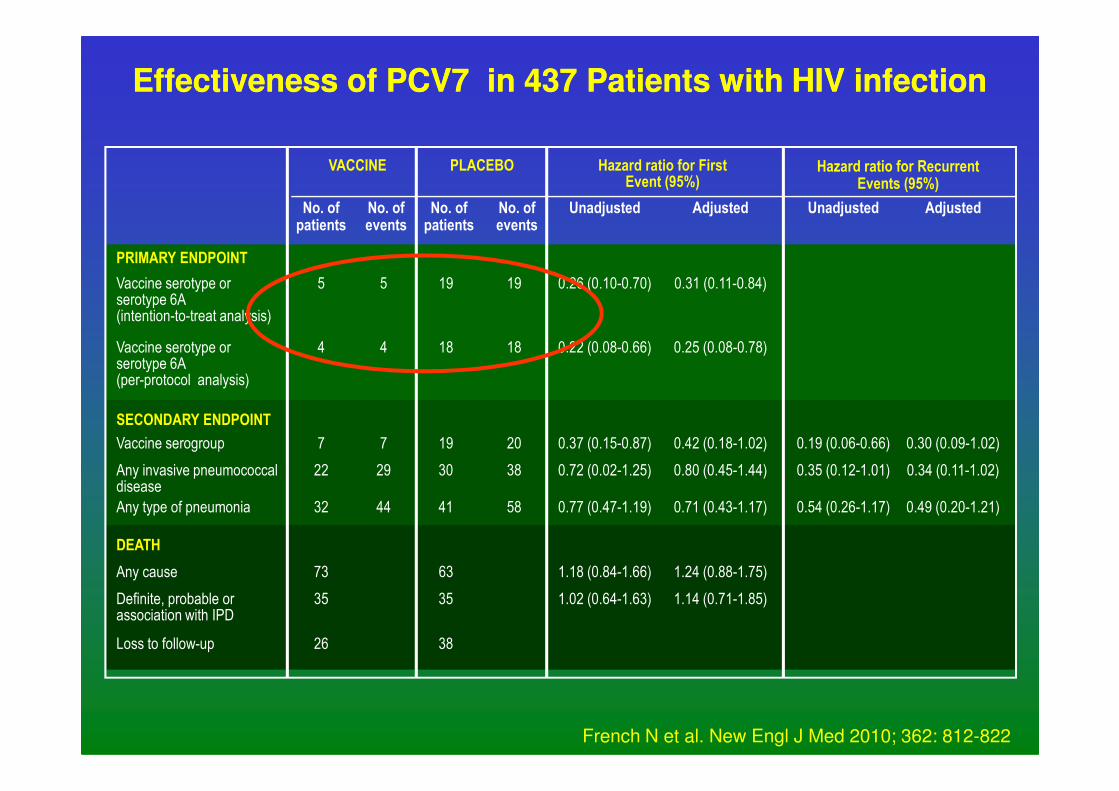
Effectiveness of PCV7 in 437 Patients with HIV infectionEffectiveness of PCV7 in 437 Patients with HIV infection
Vaccine serotype or serotype 6A(intention-to-treat analysis)
19
No. of patients
19
No. of events
Vaccine serotype or serotype 6A(per-protocol analysis)
18 18
PRIMARY ENDPOINT
5
No. of patients
5
No. of events
4 4
VACCINE
0.26 (0.10-0.70)
Unadjusted
0.31 (0.11-0.84)
Adjusted
0.22 (0.08-0.66) 0.25 (0.08-0.78)
Unadjusted Adjusted
PLACEBO Hazard ratio for First Event (95%)
Hazard ratio for Recurrent Events (95%)
Any cause 63
DEATH
Definite, probable or association with IPD
35
Loss to follow-up 38
Vaccine serogroup 19 20
SECONDARY ENDPOINT
Any invasive pneumococcal disease
30 38
Any type of pneumonia
73
35
26
7 7
22 29
32 44 41 58
1.18 (0.84-1.66) 1.24 (0.88-1.75)
1.02 (0.64-1.63) 1.14 (0.71-1.85)
0.37 (0.15-0.87) 0.42 (0.18-1.02)
0.72 (0.02-1.25) 0.80 (0.45-1.44)
0.77 (0.47-1.19) 0.71 (0.43-1.17)
0.19 (0.06-0.66) 0.30 (0.09-1.02)
0.35 (0.12-1.01) 0.34 (0.11-1.02)
0.54 (0.26-1.17) 0.49 (0.20-1.21)
French N et al. New Engl J Med 2010; 362: 812-822
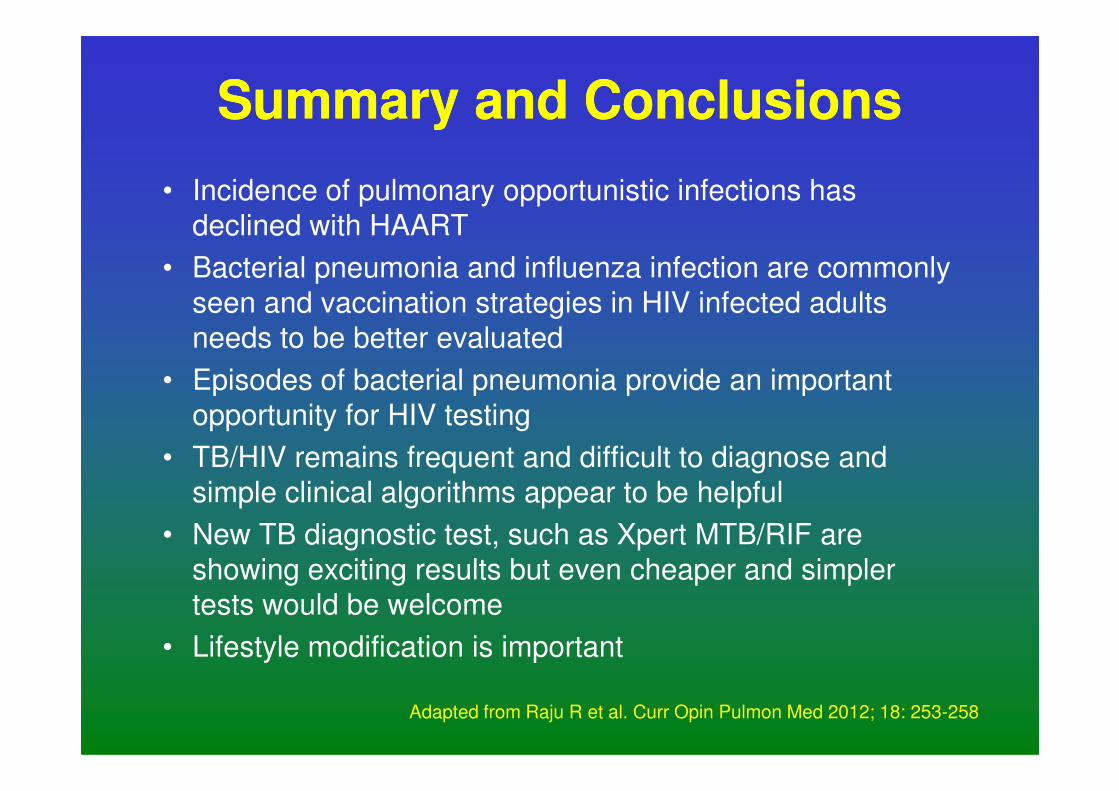
Summary and ConclusionsSummary and Conclusions
• Incidence of pulmonary opportunistic infections has
declined with HAART
• Bacterial pneumonia and influenza infection are commonly
seen and vaccination strategies in HIV infected adults
needs to be better evaluated
• Episodes of bacterial pneumonia provide an important • Episodes of bacterial pneumonia provide an important
opportunity for HIV testing
• TB/HIV remains frequent and difficult to diagnose and
simple clinical algorithms appear to be helpful
• New TB diagnostic test, such as Xpert MTB/RIF are
showing exciting results but even cheaper and simpler
tests would be welcome
• Lifestyle modification is important
Adapted from Raju R et al. Curr Opin Pulmon Med 2012; 18: 253-258