Commonwealth of Virginiahac.virginia.gov/subcommittee/compensation_retirement...January 26, 2012 12...
32
Commonwealth of Virginia Compensation and Health Benefits Department of Human Resource Management House Appropriations Committee Compensation and Retirement Subcommittee General Assembly Building, Richmond, VA January 26, 2012
Transcript of Commonwealth of Virginiahac.virginia.gov/subcommittee/compensation_retirement...January 26, 2012 12...

Commonwealth of Virginia Compensation and Health Benefits
Department of Human Resource Management
House Appropriations Committee Compensation and Retirement Subcommittee
General Assembly Building, Richmond, VA January 26, 2012

Leave Simplification

Leave Simplification
Governor postponed leave simplification
Notified employees by email on December 19, 2011
No legislation introduced by Governor
January 26, 2012 3

Time, Attendance, and Leave System (TAL)
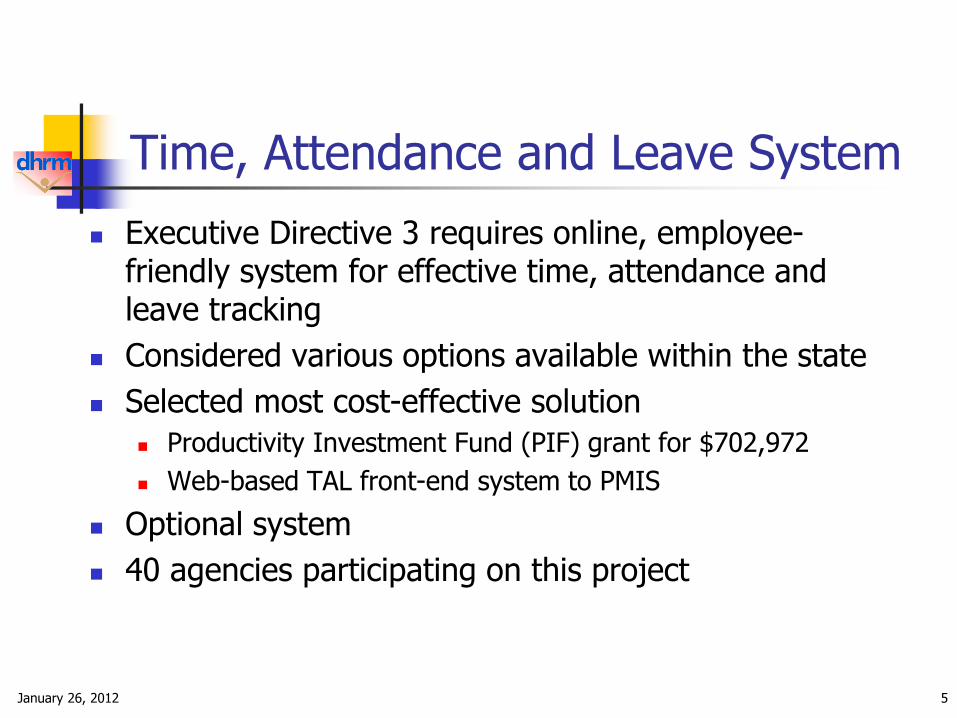
Time, Attendance and Leave System
Executive Directive 3 requires online, employee-friendly system for effective time, attendance and leave tracking
Considered various options available within the state
Selected most cost-effective solution
Productivity Investment Fund (PIF) grant for $702,972
Web-based TAL front-end system to PMIS
Optional system
40 agencies participating on this project
January 26, 2012 5

Compensation

January 26, 2012 7
Classified Employees
Salaries
Average salary $43,703
Median Salary $38,726
Lowest Salary $15,371
Highest Salary $247,890
Source: PMIS data as of December 31, 2011
January 26, 2012 8
Classified Employees
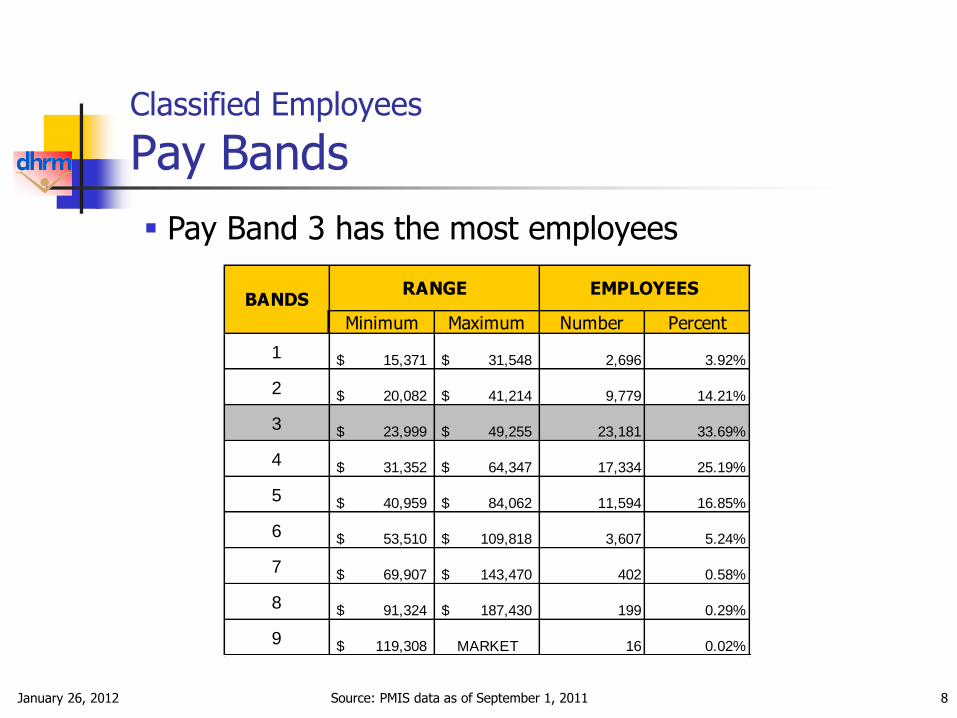
Pay Bands
Source: PMIS data as of September 1, 2011
Minimum Maximum Number Percent
1 15,371$ 31,548$ 2,696 3.92%
2 20,082$ 41,214$ 9,779 14.21%
3 23,999$ 49,255$ 23,181 33.69%
4 31,352$ 64,347$ 17,334 25.19%
5 40,959$ 84,062$ 11,594 16.85%
6 53,510$ 109,818$ 3,607 5.24%
7 69,907$ 143,470$ 402 0.58%
8 91,324$ 187,430$ 199 0.29%
9 119,308$ MARKET 16 0.02%
EMPLOYEESBANDS
RANGE
Pay Band 3 has the most employees

January 26, 2012 9
State Employee Salary Comparison
Pay Compression
Salary compression
New employees demand market rate
State salaries on average are below market
New hires potentially paid more than experienced employees
Lack of funding to address the issue
Salary inequities

January 26, 2012 10
State Employee Salary Comparison
Market Increases
Percent Increase
Fiscal Year
Source: Appropriation Acts
State employee salary increases lag the market 5% increase in FY11 for VRS Plan I state employees did not
increase take-home pay
0
1
2
3
4
5
6
7
State
Market
Linear (State)
Linear (Market)

January 26, 2012 11
State Employee Salary Comparison
CPI Increases 5% increase in FY11 for VRS Plan I state employees
did not increase take-home pay
0
1
2
3
4
5
6
7
96 97 98 99 0001 02 03 04 05 0607 08 09 10 11
State
CPI
Linear (State)
Linear (CPI)
Source: Appropriation Acts, Bureau of Labor Statistics
Percent Increase

January 26, 2012 12
State Employee Salary Comparison
Private Sector Salary
OccupationPrivate
IndustryState Deviation
Truck Driver, Light 27859 20,200 -37.92%
Cook 29277 25,343 -15.52%
Security Guard, Unarmed 27758 25,833 -7.45%
Laboratory Aide 27527 29837 7.74%
Mail Clerk 31708 27,178 -16.67%
Cashier 30898 31,439 1.72%
Secretary 37888 30,828 -22.90%
Yard Laborer/Janitorial Supv 43561 34,307 -26.97%
Maintenance Electrician 47411 38,742 -22.38%
Marketing Specialist 50337 43,010 -17.03%
Medical lab Tech 40795 44,284 7.88%
Accountant 51360 45,899 -11.90%
Social Worker (MSW) 53074 46,274 -14.69%
Employee Training Specialist 54122 46,515 -16.35%
Staff RN 61292 48,894 -25.36%
Internal Auditor 71412 49,970 -42.91%
Chemist 66557 56,615 -17.56%
Attorney 111825 58,326 -91.72%
HR Admin Supv 68989 62,896 -9.69%
Environmental Engineer 64329 64,096 -0.36%
Architect 80538 65,253 -23.42%
Physical Therapist 70996 79,326 10.50%
Systems Analysis Supv 83779 80,570 -3.98%
Data Base Administrator 90364 85,355 -5.87%
Generic Engineer Supv 105256 93,314 -12.80%
On average, State salaries for selected occupations are 16.62% below Private Industry
In 2008, JLARC found State compensation 12% below market
In a similar assessment in 2011, JLARC reported that the State’s total compensation package is only marginally competitive for recruitment
By the end of 2012, State salaries will be 23.1% below market due to cumulative market movements
Source: PMIS, Towers Watson, Spring 2010 and 2011

January 26, 2012 13
100.0
104.4108.5
115.5119.7
122.4 122.5124.8
130.5
136.1
142.1
147.4 147.9150.2
90
100
110
120
130
140
150
160
170
180
190
1997 1998 1999 2000 2001 2002 2003 2004 2005 2006 2007 2008 2009 2010
Federal State Local Private
State Employee Salary Comparison
Average Weekly Wage Indexed to 1997 weekly wage State wages are consistently below federal and
private wages
Source: Bureau of Labor Statistics
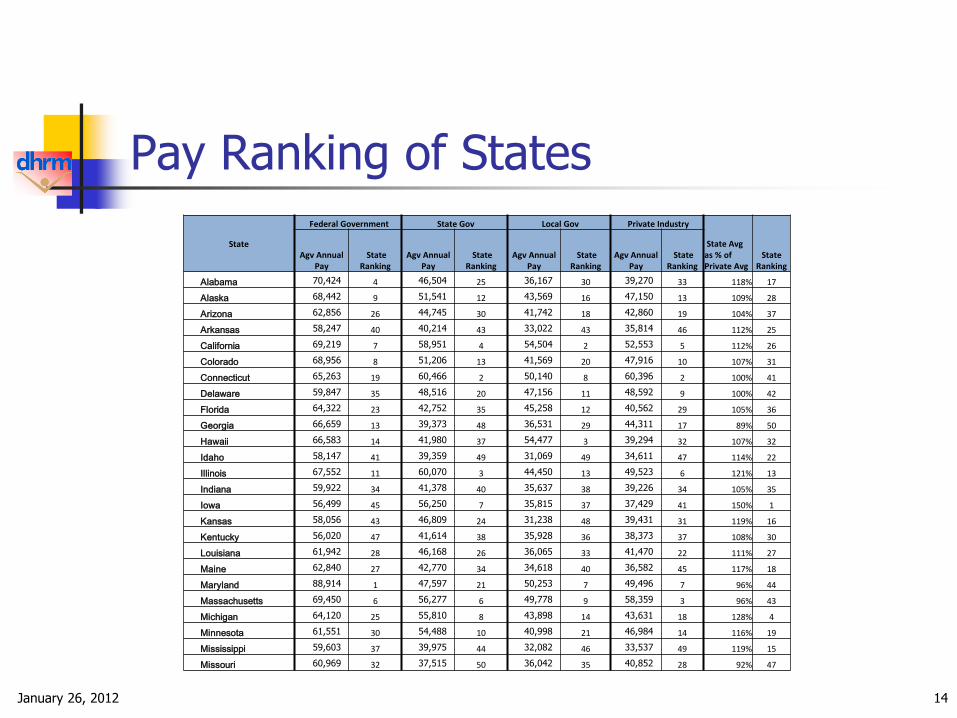
Pay Ranking of States
January 26, 2012 14
State
Federal Government State Gov Local Gov Private Industry
State Avg as % of Private Avg
State Ranking
Agv Annual Pay
State Ranking
Agv Annual Pay
State Ranking
Agv Annual Pay
State Ranking
Agv Annual Pay
State Ranking
Alabama 70,424 4 46,504 25 36,167 30 39,270 33 118% 17
Alaska 68,442 9 51,541 12 43,569 16 47,150 13 109% 28
Arizona 62,856 26 44,745 30 41,742 18 42,860 19 104% 37
Arkansas 58,247 40 40,214 43 33,022 43 35,814 46 112% 25
California 69,219 7 58,951 4 54,504 2 52,553 5 112% 26
Colorado 68,956 8 51,206 13 41,569 20 47,916 10 107% 31
Connecticut 65,263 19 60,466 2 50,140 8 60,396 2 100% 41
Delaware 59,847 35 48,516 20 47,156 11 48,592 9 100% 42
Florida 64,322 23 42,752 35 45,258 12 40,562 29 105% 36
Georgia 66,659 13 39,373 48 36,531 29 44,311 17 89% 50
Hawaii 66,583 14 41,980 37 54,477 3 39,294 32 107% 32
Idaho 58,147 41 39,359 49 31,069 49 34,611 47 114% 22
Illinois 67,552 11 60,070 3 44,450 13 49,523 6 121% 13
Indiana 59,922 34 41,378 40 35,637 38 39,226 34 105% 35
Iowa 56,499 45 56,250 7 35,815 37 37,429 41 150% 1
Kansas 58,056 43 46,809 24 31,238 48 39,431 31 119% 16
Kentucky 56,020 47 41,614 38 35,928 36 38,373 37 108% 30
Louisiana 61,942 28 46,168 26 36,065 33 41,470 22 111% 27
Maine 62,840 27 42,770 34 34,618 40 36,582 45 117% 18
Maryland 88,914 1 47,597 21 50,253 7 49,496 7 96% 44
Massachusetts 69,450 6 56,277 6 49,778 9 58,359 3 96% 43
Michigan 64,120 25 55,810 8 43,898 14 43,631 18 128% 4
Minnesota 61,551 30 54,488 10 40,998 21 46,984 14 116% 19
Mississippi 59,603 37 39,975 44 32,082 46 33,537 49 119% 15
Missouri 60,969 32 37,515 50 36,042 35 40,852 28 92% 47

Pay Ranking of States
January 26, 2012 15
State
Federal Government State Gov Local Gov Private Industry State Avg as % of Private Avg
State Ranking
Agv Annual Pay
State Ranking
Agv Annual Pay
State Ranking
Agv Annual Pay
State Ranking
Agv Annual Pay
State Ranking
Montana 57,117 44 41,303 41 33,898 41 33,244 50 124% 6
Nebraska 58,421 39 44,786 29 36,049 34 36,686 44 122% 10
Nevada 61,438 31 50,125 18 52,088 6 40,899 26 123% 9
New Hampshire 66,748 12 47,377 22 39,716 25 46,287 15 102% 40
New Jersey 70,330 5 63,263 1 56,993 1 55,736 4 114% 23
New Mexico 64,792 20 46,118 27 35,319 39 37,927 40 122% 11
New York 65,780 18 55,034 9 52,650 5 61,548 1 89% 49
North Carolina 58,908 38 44,544 31 38,499 26 40,874 27 109% 29
North Dakota 54,816 50 43,421 33 31,829 47 38,028 38 114% 20
Ohio 66,233 16 50,618 17 41,602 19 41,040 24 123% 7
Oklahoma 61,787 29 39,651 45 33,107 42 38,011 39 104% 38
Oregon 64,123 24 42,173 36 42,735 17 40,984 25 103% 39
Pennsylvania 64,532 22 51,723 11 43,747 15 45,325 16 114% 21
Rhode Island 73,950 3 58,945 5 52,975 4 42,525 20 139% 2
South Carolina 58,096 42 41,386 39 37,762 28 36,785 43 113% 24
South Dakota 55,560 48 41,185 42 29,731 50 33,887 48 122% 12
Tennessee 66,343 15 39,568 46 36,118 31 41,760 21 95% 46
Texas 65,804 17 45,279 28 39,872 24 47,610 12 95% 45
Utah 59,828 36 47,184 23 32,471 45 38,936 35 121% 14
Vermont 60,960 33 48,681 19 36,067 32 38,636 36 126% 5
Virginia 83,033 2 44,361 32 39,914 23 49,138 8 90% 48
Washington 67,646 10 51,006 14 47,655 10 47,861 11 107% 33
West Virginia 64,662 21 39,389 47 33,022 44 36,991 42 106% 34
Wisconsin 56,032 46 50,977 15 38,427 27 39,556 30 129% 3
Wyoming 55,247 49 50,846 16 40,138 22 41,258 23 123% 8
Virginia’s Ranking
• 2nd in Federal Government
• 8th in Private Industry • 23rd in Local Government • 32nd in State Government • 48th in State Average as a percent of Private average
Source: Bureau of Labor Statistics data based on payroll records of what is actually paid out to employees as reported quarterly to employment commissions
January 26, 2012 16
State Employee Salary Comparison
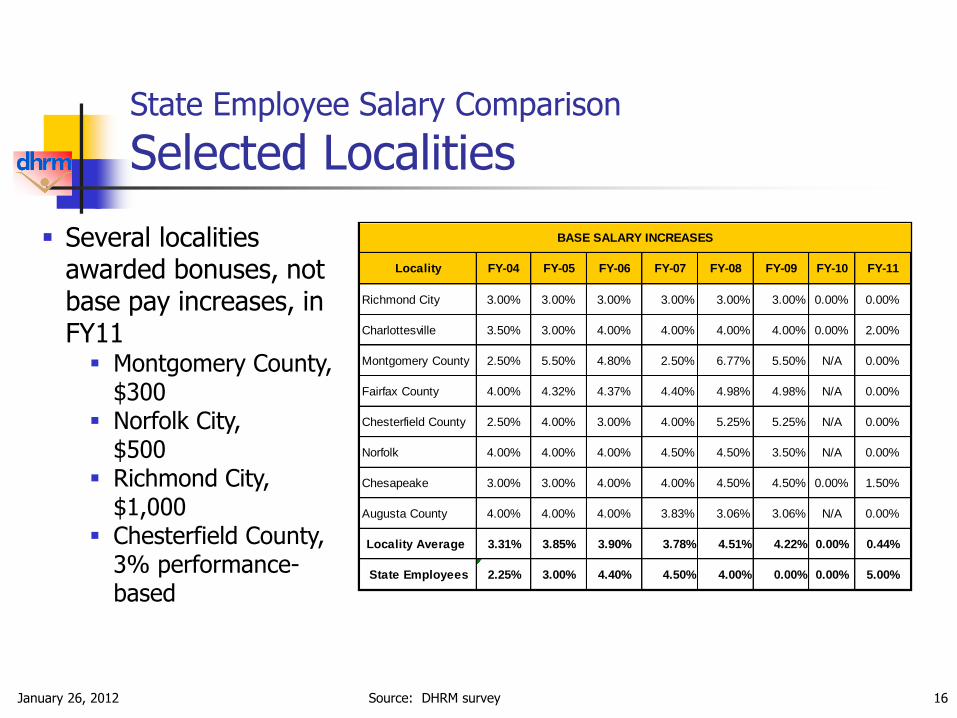
Selected Localities
Source: DHRM survey
Several localities awarded bonuses, not base pay increases, in FY11 Montgomery County,
$300 Norfolk City,
$500 Richmond City,
$1,000 Chesterfield County,
3% performance-based
Locality FY-04 FY-05 FY-06 FY-07 FY-08 FY-09 FY-10 FY-11
Richmond City 3.00% 3.00% 3.00% 3.00% 3.00% 3.00% 0.00% 0.00%
Charlottesville 3.50% 3.00% 4.00% 4.00% 4.00% 4.00% 0.00% 2.00%
Montgomery County 2.50% 5.50% 4.80% 2.50% 6.77% 5.50% N/A 0.00%
Fairfax County 4.00% 4.32% 4.37% 4.40% 4.98% 4.98% N/A 0.00%
Chesterfield County 2.50% 4.00% 3.00% 4.00% 5.25% 5.25% N/A 0.00%
Norfolk 4.00% 4.00% 4.00% 4.50% 4.50% 3.50% N/A 0.00%
Chesapeake 3.00% 3.00% 4.00% 4.00% 4.50% 4.50% 0.00% 1.50%
Augusta County 4.00% 4.00% 4.00% 3.83% 3.06% 3.06% N/A 0.00%
Locality Average 3.31% 3.85% 3.90% 3.78% 4.51% 4.22% 0.00% 0.44%
State Employees 2.25% 3.00% 4.40% 4.50% 4.00% 0.00% 0.00% 5.00%
BASE SALARY INCREASES

January 26, 2012 17
State Employee Salary Comparison
National Market
National trends
Average salary increase
2.7% in 2011
2.74% in 2012
Average salary range adjustment
1.59% in 2011
1.65% in 2011
Mercer reports companies freezing pay dropped from 1/3 of employers in 2009 to 5% in 2011
Source: DHRM Annual Salary Survey Report to the General Assembly and IOMA Report on Salary Surveys November 2011

January 26, 2012 18
State Employee Salary FY12
Budget Proposal
No base salary increase proposed
Proposes up to a 3% bonus to full-time state employees on Dec. 1, 2012
Must be employed by the Commonwealth as of April 1, 2011
Must still be employed as of November 24, 2012
Must have received at least “meets expectation” rating
Must have no active standards of conduct violations
State collectively must save at least twice the cost of the bonus ($160 million)
Cabinet secretaries will set savings targets for agencies within their secretariat
Each agency will be responsible to fund the cost of the bonus out of its unspent discretionary appropriations
Health Benefits

FY 2011
Enrollment by Plan
January 26, 2012 20
80%
8,0518%
2,2072%
5071%
9,1579%
Health Plan Enrollment FY 2011
COVA Care
Kaiser Permanente
HMOWaived Coverage
COVA HDHP
COVA Connect
81,80
24,745 27.5%
3,686 4.1%
12,867 14.3%
25,267 28.1%
4,288 4.8%
19,003 21.1%
COVA Care and COVA Connect FY 2011
Basic
Basic + Out of Network
Basic + Expanded Dental
Basic + Vsn, Hrng & Exp. Dental
Basic + Out of Network and Expanded Dental
Basic + All
101,727 employees eligible for state health benefits 92,570 enrolled in all plans

FY 2011
Cost Trends
Total program expense increased 2.9% in FY 11
Total program expense below FY 2009 costs
January 26, 2012 21
$0.0$100.0$200.0$300.0$400.0$500.0$600.0$700.0$800.0$900.0
$1,000.0
2007 2008 2009 2010 2011
Health Benefits Expense 2007-2011
(in millions)
Claims Administration
$885.1$759.0
$858.4 $914.3 $910.7
-10%
-5%
0%
5%
10%
15%
FY 08 FY 09 FY10 FY11
Health Benefits Expense Trend Year to Year
Claims Administration Total

FY 2011
Claims Expense
$841.3 million total claims paid in FY 11
3.1% increase in FY 11 from prior year
6.8 million total claims processed
3% increase in FY 11 from prior year
January 26, 2012 22
1%
73%
6%
20%
Fiscal Year 2011State Health Plans Claims Expense Claims Paid Total = $841,260,683
Medical$609,137,601
Mental Health$10,643,563
Prescription Drug$170,330,783
Dental$51,148,736
Mental Health
Inpatient Hospital
Outpatient Hospital
Physician DentalPrescription
Drug
2007 $8.3 $154.3 $134.5 $193.2 $45.0 $141.2
2008 $9.1 $178.5 $154.0 $214.3 $48.1 $158.1
2009 $9.0 $189.2 $172.8 $231.7 $50.4 $172.7
2010 $9.4 $190.3 $168.6 $233.9 $51.5 $161.9
2011 $10.6 $192.0 $178.2 $238.8 $51.1 $170.3
$0
$50
$100
$150
$200
$250
$300State Health Plan Claims Paid
FY 2007-2011

FY 2011
Total Cost Per Employee
$12,709 total cost per employee in FY 11
3.2% increase in FY 11 from prior year
January 26, 2012 23
2007 2008 2009 2010 2011
State Employer Cost Per Employee
$8,274 $9,224 $9,889 $9,656 $10,043
National Large Government Employers
$8,422 $9,226 $9,779 $9,996 $11,385
State Employee Cost $2,393 $2,533 $2,580 $2,658 $2,666
National Average Employee Cost
$5,300 $6,000 $6,820 $7,330 $8,008
$0
$2,000
$4,000
$6,000
$8,000
$10,000
$12,000 National and State Average Annual Cost Per Employee
$0
$5,000
$10,000
$15,000
2007 2008 2009 2010 2011
Total State Health Benefits Cost Per Employee*
Employer Cost (includes premium)Employee Cost (includes out-of-pocket and premium)
76%
78%
21%
22%
*Employee contribution to premium varies by dependent coverage. In general, premium represents 12 percent of total employee cost.
22%
78%
$10,667$11,757
$12,468
22%
78%
$12,314
79%
21%
79%
$12,709

Cost Drivers
January 26, 2012 24
“Top Ten” Claims Expense
Medical
Procedures
Chronic
Conditions
Prescription
Drugs
1. Musculoskeletal 1. Coronary artery
disease
1. Nexium
(stomach acid)
2. Neoplasms
(tumors) 2. Breast cancer
2. Lipitor
(high cholesterol)
3. Circulatory 3. Cerebrovascular
disease
3. Enbrel
(rheumatoid
arthritis)
4. V-Codes (health services not
classified as disease
or injury)
4. Diabetes 4. Crestor
(high cholesterol)
5. Ill-defined
symptoms
(undetermined
causes)
5. Hypertension
5. Humira
(rheumatoid
arthritis)
6. Digestive 6. Lung cancer 6. Singulair
(asthma/allergy)
7. Genitourinary 7. Skin cancer 7. Cymbalta
(depression)
8. Nervous
system/sense
organs
8. Obesity 8. Copaxone
(multiple sclerosis)
9. Accidental injury 9. Oral cancer 9. Actos
(diabetes)
10. Respiratory
10. Substance abuse 10. Advair Diskus
(asthma/COPD)
57.7% of
All Claims Expense
8.5% of
All Claims Expense
4.6% of
All Claims Expense
Expensive procedures Treatment of chronic conditions Prescription drug therapy cost Employee lifestyle
Smoking Physical activity level Overweight
Average employee age
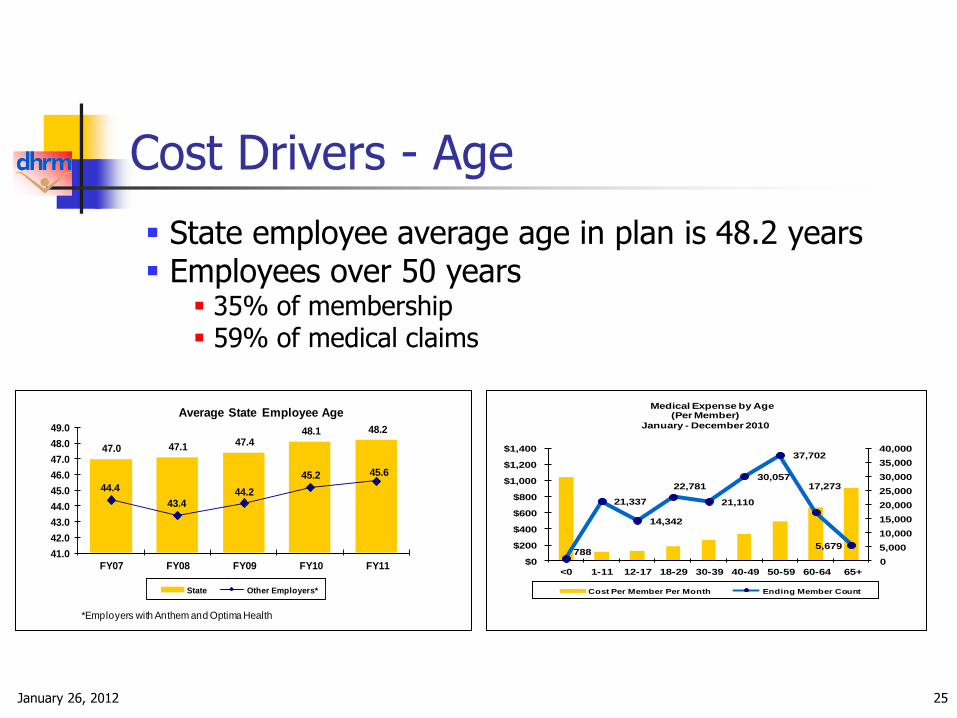
Cost Drivers - Age
January 26, 2012 25
47.0 47.1 47.448.1 48.2
44.4
43.444.2
45.2 45.6
41.0
42.0
43.0
44.0
45.0
46.0
47.0
48.0
49.0
FY07 FY08 FY09 FY10 FY11
Average State Employee Age
State Other Employers*
*Employers with Anthem and Optima Health
788
21,337
14,342
22,781
21,110
30,057
37,702
17,273
5,679
0
5,000
10,000
15,000
20,000
25,000
30,000
35,000
40,000
$0
$200
$400
$600
$800
$1,000
$1,200
$1,400
<0 1-11 12-17 18-29 30-39 40-49 50-59 60-64 65+
Medical Expense by Age(Per Member)
January - December 2010
Cost Per Member Per Month Ending Member Count
State employee average age in plan is 48.2 years Employees over 50 years
35% of membership 59% of medical claims

Cost Drivers - Lifestyle
6 conditions correlated to being overweight
$161 million in medical claims
26.5% of total medical expense
January 26, 2012 26
66%
87%
73%
65%
90%
81%
64%
80%
81%
62%
90%
75%
59%
94%
66%
65%
71%
63%
0% 20% 40% 60% 80% 100%
Body Mass Index <30.0
Cholesterol <240
Blood Pressure <140/90
State Employee Health Measures
National Average 2011 2010 2009 2008 2020 National Goal
Sources: CommonHealth biennial health checks and Healthy People 2020
29%
23%17%
15%
9%7%
2010
According to the National Institutes of Health, two-thirds of
American adults and one in three children are overweight or obese.
As the chart at the left indicates, six conditions that correlate with
being overweight represented more than $161 million, or 26.5
percent, of the state plans’ total medical expense in 2011.
About 7,100 employees in 2010 and 5,145 in 2011 took part in
health screenings through the CommonHealth wellness program.
While the group was better than the national average in normal
cholesterol and blood pressure levels, it ranked 6 percent above
average in body mass index of 30 or more, meaning that a higher
percentage of state employees are seriously overweight or obese.
14
26%
22%18%
16%
11%8%
Lifestyle Related Claims
Joint Degeneration Coronary Artery Disease Hypertension
Diabetes Hyperlipidemia GERD (reflux disease)
2007
27%
24%18%
15%
10%7%
2008
28%
23%18%
15%
9%7%
2009
31%
23%16%
15%
8%7%
2011
66%
87%
73%
65%
90%
81%
64%
80%
81%
62%
90%
75%
59%
94%
66%
65%
71%
63%
0% 20% 40% 60% 80% 100%
Body Mass Index <30.0
Cholesterol <240
Blood Pressure <140/90
State Employee Health Measures
National Average 2011 2010 2009 2008 2020 National Goal
Sources: CommonHealth biennial health checks and Healthy People 2020
Lifestyle Influences
$0.00
$5.00
$10.00
$15.00
$20.00
$25.00
$30.00
•Joint Degeneration
•Coronary Artery Disease
•Hypertension •Diabetes •Hyperlipidemia •GERD
Pla
n P
aid
PM
PM
2011 Lifestyle ImpactPlan Per Member Per Month
Plan Paid PMPM PPO Norm PMPM

FY 12
Procurements
Wellness engine proposals submitted January 17, 2012
Incorporates employee wellness and disease management services
Features health Web portal
Offers health decision support
Includes lifestyle and disease management
Provides incentive administration
Contains predictive modeling and reporting
Administers health risk questionnaire
Performs health screenings
January 26, 2012 27
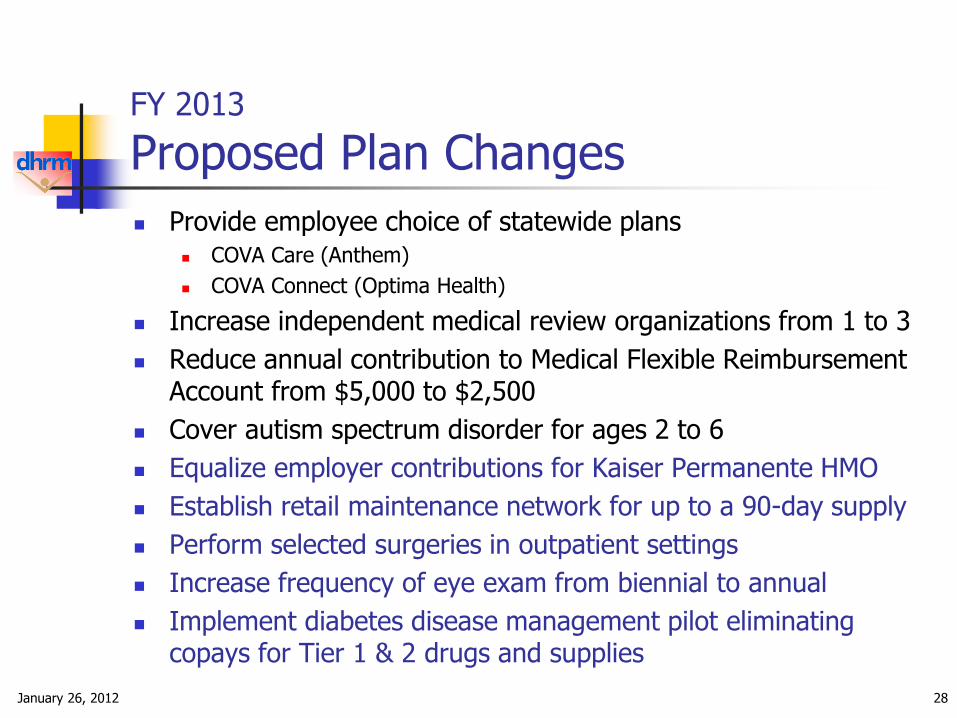
FY 2013
Proposed Plan Changes
Provide employee choice of statewide plans COVA Care (Anthem)
COVA Connect (Optima Health)
Increase independent medical review organizations from 1 to 3
Reduce annual contribution to Medical Flexible Reimbursement Account from $5,000 to $2,500
Cover autism spectrum disorder for ages 2 to 6
Equalize employer contributions for Kaiser Permanente HMO
Establish retail maintenance network for up to a 90-day supply
Perform selected surgeries in outpatient settings
Increase frequency of eye exam from biennial to annual
Implement diabetes disease management pilot eliminating copays for Tier 1 & 2 drugs and supplies
January 26, 2012 28

FY 2013 Proposed Premiums
January 26, 2012 29
PLAN Current Monthly Cost Proposed Monthly Change Proposed Monthly Cost
COVA Care Basic
Employee Only
Employee Plus One
Family Employee
Only Employee Plus One
Family Employee
Only Employee Plus One
Family
Employee $43 $102 $150 $7 $14 $15 $50 $116 $165
Employer $383 $686 $1,002 $46 $80 $124 $429 $766 $1,126
Subsidy $74 $137 $200 -$52 -$73 -$136 $22 $45 $64
TOTAL PREMIUM
$500 $925 $1,352 +$1 +$2 +$3 $501 $927 $1,355
0.9% projected renewal increase before design changes Early retirees pay the total premium

Bariatric Surgery Pilot Implemented new 12 month pre-surgery pilot program in lieu of
eliminating coverage for gastric bypass surgery Improve patient’s chances for successful surgery
Prepare patients for lifestyle changes
93% reduction in bariatric surgery claims FY 11 cost over projections
January 26, 2012 30
25
20
334
486
509
0 100 200 300 400 500 600
Total Bariatric Surgeries FY 2008 - 2012 YTD
2008
2009
2010
2011
2012 YTD
$10.2 $10.6
$5.9
$0.8 $0.7
$0.0
$2.0
$4.0
$6.0
$8.0
$10.0
$12.0
Total Bariatric Surgery Medical ExpenseFY 2008-2012 YTD
(in millions)
2008 2009 2010 2011 2012 YTD

Actuarial Audit
Auditor of Public Accounts conducted special review in FY 2011
Report Summary Commonwealth receives sound actuarial information to set employee health
care premiums and reserves
Commonwealth should at minimum fund an actuarially determined IBNR reserve
Appears to be sound support for actuarially determined funding of contingency reserve
Health Insurance Fund net assets fell below actuarially recommended amount as of June 30, 2011 due to premium subsidy
General Assembly may wish to consider reserve funding policy before adopting FY 2013 premiums and taking other HIF actions
Included several recommendations to improve Health Insurance Fund management
January 26, 2012 31

January 26, 2012 32
Resources
Department of Human Resource Management http://www.dhrm.virginia.gov
Annual Salary Survey http://www.dhrm.virginia.gov/reports/AnnualSalaryReport2011.pdf
Annual Health Benefits Report http://www.dhrm.virginia.gov/hbenefits/ohbcommunications/reports/annualreport2011.pdf
Review of State Employee Health Insurance Fund http://www.apa.virginia.gov/reports/HealthInsuranceFundSR2011.pdf