
Common Stock, par value $.01 per share SBH New York Stock ...
111
UNITED STATES SECURITIES AND EXCHANGE COMMISSION Washington, D.C. 20549 FORM 10-K ☒ ANNUAL REPORT PURSUANT TO SECTION 13 OR 15(d) OF THE SECURITIES EXCHANGE ACT OF 1934 FOR THE FISCAL YEAR ENDED: SEPTEMBER 30, 2019 -OR- ☐ TRANSITION REPORT PURSUANT TO SECTION 13 OR 15(d) OF THE SECURITIES EXCHANGE ACT OF 1934 For the transition period from _______________ to __________________ Commission File No. 1-33145 SALLY BEAUTY HOLDINGS, INC. (Exact name of registrant as specified in its charter) Delaware 36-2257936 (State or other jurisdiction of incorporation or organization) (I.R.S. Employer Identification No.) 3001 Colorado Boulevard 76210 Denton, Texas (Zip Code) (Address of principal executive offices) (940) 898-7500 (Registrant’s telephone number, including area code) Securities registered pursuant to Section 12(b) of the Act: Title of each class Trading Symbol Name of each exchange on which registered Common Stock, par value $.01 per share SBH New York Stock Exchange Securities registered pursuant to Section 12(g) of the Act: None Indicate by check mark if the registrant is a well-known seasoned issuer, as defined under Rule 405 of the Securities Act. YES ☒ NO ☐ Indicate by check mark if the registrant is not required to file reports pursuant to Section 13 or Section 15(d) of the Act. YES ☐ NO ☒ Indicate by check mark whether the registrant (1) has filed all reports required to be filed by Section 13 or 15(d) of the Securities Exchange Act of 1934 during the preceding 12 months (or for such shorter period that the registrant was required to file such reports), and (2) has been subject to such filing requirements for the past 90 days. YES ☒ NO ☐ Indicate by check mark whether the registrant has submitted electronically every Interactive Data File required to be submitted pursuant to Rule 405 of Regulation S-T (§232.405 of this chapter) during the preceding 12 months (or for such shorter period that the registrant was required to submit such files). YES ☒ NO ☐ Indicate by check mark whether the registrant is a large accelerated filer, an accelerated filer, a non-accelerated filer, a smaller reporting company, or an emerging growth company. See the definitions of “large accelerated filer,” “accelerated filer,” “smaller reporting company,” and “emerging growth company” in Rule 12b-2 of the Exchange Act. Large accelerated filer ☒ Accelerated filer ☐ Non-accelerated filer ☐ Smaller reporting company ☐ Emerging growth company ☐ If an emerging growth company, indicate by check mark if the registrant has elected not to use the extended transition period for complying with any new or revised financial accounting standards provided pursuant to Section13(a) of the Exchange Act. ☐ Indicate by check mark whether the registrant is a shell company (as defined in Rule 12b-2 of the Exchange Act.) YES ☐ NO ☒ The aggregate market value of registrant’s common stock held by non-affiliates of the registrant, based upon the closing price of a share of the registrant’s common stock on March 31, 2019 was approximately $2,202,239,000. At November 15, 2019, there were 116,326,372 shares of the registrant’s common stock outstanding. DOCUMENTS INCORPORATED BY REFERENCE Portions of the registrant’s Proxy Statement relating to the registrant’s 2020 Annual Meeting of Stockholders are incorporated by reference into Part III of this Annual Report on Form 10-K where indicated.
Transcript of Common Stock, par value $.01 per share SBH New York Stock ...

UNITED STATESSECURITIES AND EXCHANGE COMMISSION
Washington, D.C. 20549
FORM 10-K
☒☒ ANNUAL REPORT PURSUANT TO SECTION 13 OR 15(d) OF THE SECURITIES EXCHANGE ACT OF 1934
FOR THE FISCAL YEAR ENDED: SEPTEMBER 30, 2019
-OR-
☐☐ TRANSITION REPORT PURSUANT TO SECTION 13 OR 15(d) OF THE SECURITIES EXCHANGE ACT OF 1934
For the transition period from _______________ to __________________
Commission File No. 1-33145
SALLY BEAUTY HOLDINGS, INC.(Exact name of registrant as specified in its charter)
Delaware 36-2257936(State or other jurisdiction of incorporation or organization) (I.R.S. Employer Identification No.)
3001 Colorado Boulevard 76210Denton, Texas (Zip Code)
(Address of principal executive offices)
(940) 898-7500(Registrant’s telephone number, including area code)
Securities registered pursuant to Section 12(b) of the Act:
Title of each class Trading Symbol Name of each exchange on which registeredCommon Stock, par value $.01 per share SBH New York Stock Exchange
Securities registered pursuant to Section 12(g) of the Act: None
Indicate by check mark if the registrant is a well-known seasoned issuer, as defined under Rule 405 of the Securities Act. YES ☒ NO ☐
Indicate by check mark if the registrant is not required to file reports pursuant to Section 13 or Section 15(d) of the Act. YES ☐ NO ☒Indicate by check mark whether the registrant (1) has filed all reports required to be filed by Section 13 or 15(d) of the Securities Exchange Act of 1934 during the preceding 12 months (or for suchshorter period that the registrant was required to file such reports), and (2) has been subject to such filing requirements for the past 90 days. YES ☒ NO ☐Indicate by check mark whether the registrant has submitted electronically every Interactive Data File required to be submitted pursuant to Rule 405 of Regulation S-T (§232.405 of this chapter) duringthe preceding 12 months (or for such shorter period that the registrant was required to submit such files). YES ☒ NO ☐Indicate by check mark whether the registrant is a large accelerated filer, an accelerated filer, a non-accelerated filer, a smaller reporting company, or an emerging growth company. See the definitionsof “large accelerated filer,” “accelerated filer,” “smaller reporting company,” and “emerging growth company” in Rule 12b-2 of the Exchange Act.
Large accelerated filer ☒ Accelerated filer ☐ Non-accelerated filer ☐Smaller reporting company ☐ Emerging growth company ☐
If an emerging growth company, indicate by check mark if the registrant has elected not to use the extended transition period for complying with any new or revised financial accounting standardsprovided pursuant to Section13(a) of the Exchange Act. ☐
Indicate by check mark whether the registrant is a shell company (as defined in Rule 12b-2 of the Exchange Act.) YES ☐ NO ☒The aggregate market value of registrant’s common stock held by non-affiliates of the registrant, based upon the closing price of a share of the registrant’s common stock on March 31, 2019 wasapproximately $2,202,239,000. At November 15, 2019, there were 116,326,372 shares of the registrant’s common stock outstanding.
DOCUMENTS INCORPORATED BY REFERENCEPortions of the registrant’s Proxy Statement relating to the registrant’s 2020 Annual Meeting of Stockholders are incorporated by reference into Part III of this Annual Report on Form 10-K whereindicated.

TABLE OF CONTENTS
Page PART I ITEM 1. BUSINESS 1 ITEM 1A. RISK FACTORS 6 ITEM 1B. UNRESOLVED STAFF COMMENTS 20 ITEM 2. PROPERTIES 21 ITEM 3. LEGAL PROCEEDINGS 22 ITEM 4. MINE SAFETY DISCLOSURES 22 PART II ITEM 5. MARKET FOR REGISTRANT’S COMMON EQUITY, RELATED STOCKHOLDER MATTERS AND ISSUER PURCHASES OF
EQUITY SECURITIES
23
ITEM 6. SELECTED FINANCIAL DATA 25 ITEM 7. MANAGEMENT’S DISCUSSION AND ANALYSIS OF FINANCIAL CONDITION AND RESULTS OF OPERATIONS 26 ITEM 7A. QUANTITATIVE AND QUALITATIVE DISCLOSURES ABOUT MARKET RISK 36 ITEM 8. FINANCIAL STATEMENTS AND SUPPLEMENTARY DATA 37 ITEM 9. CHANGES IN AND DISAGREEMENTS WITH ACCOUNTANTS ON ACCOUNTING AND FINANCIAL DISCLOSURE 37 ITEM 9A. CONTROLS AND PROCEDURES 37 ITEM 9B. OTHER INFORMATION 38 PART III ITEM 10. DIRECTORS, EXECUTIVE OFFICERS AND CORPORATE GOVERNANCE 39 ITEM 11. EXECUTIVE COMPENSATION 39 ITEM 12. SECURITY OWNERSHIP OF CERTAIN BENEFICIAL OWNERS AND MANAGEMENT AND RELATED STOCKHOLDER
MATTERS
40
ITEM 13. CERTAIN RELATIONSHIPS AND RELATED TRANSACTIONS, AND DIRECTOR INDEPENDENCE 40 ITEM 14. PRINCIPAL ACCOUNTING FEES AND SERVICES 40 PART IV ITEM 15. EXHIBITS, FINANCIAL STATEMENT SCHEDULES 41 ITEM 16. FORM 10-K SUMMARY 44
i

In this Annual Report, references to “the Company,” “Sally Beauty,” “our company,” “we,” “our,” “ours” and “us” refer to Sally Beauty Holdings, Inc. and itsconsolidated subsidiaries unless otherwise indicated or the context otherwise requires.
CAUTIONARY NOTICE REGARDING FORWARD-LOOKING STATEMENTS
Statements in this Annual Report on Form 10-K and in the documents incorporated by reference herein which are not purely historical facts or which depend upon futureevents may constitute forward-looking statements within the meaning of Section 27A of the Securities Act of 1933, as amended, and Section 21E of the SecuritiesExchange Act of 1934, as amended, which we refer to as the Exchange Act. Words such as “anticipate,” “believe,” “estimate,” “expect,” “intend,” “plan,” “project,”“target,” “can,” “could,” “may,” “should,” “will,” “would,” “might,” “anticipates” or similar expressions may also identify such forward-looking statements.
Readers are cautioned not to place undue reliance on forward-looking statements as such statements speak only as of the date they were made and involve risks anduncertainties that could cause actual events or results to differ materially from the events or results described in the forward-looking statements. The most importantfactors which could cause our actual results to differ from our forward-looking statements are set forth in our description of risk factors in Item 1A to this Annual Reporton Form 10-K, which should be read in conjunction with the forward-looking statements in this report. Forward-looking statements speak only as of the date they aremade, and we do not undertake any obligation to update any forward-looking statement.
The events described in the forward-looking statements might not occur or might occur to a different extent or at a different time than we have described. As a result, ouractual results may differ materially from the results contemplated by these forward-looking statements.
ii
PART I
ITEM 1. BUSINESS
Our Company
Sally Beauty Holdings, Inc. is an international specialty retailer and distributor of professional beauty supplies with operations in North America, South America andEurope. We are one of the largest distributors of professional beauty supplies in the U.S. based on store count. At September 30, 2019, we operated two businesssegments, Sally Beauty Supply (“SBS”) and Beauty Systems Group (“BSG”), with 4,902 company-operated stores, 159 franchised stores and e-commerce platforms. SBStargets retail consumers, salons and salon professionals, while BSG exclusively targets salons and salon professionals. Within BSG, we also have one of the largestnetworks of distributor sales consultants (“DSCs”) for professional beauty products in North America, with approximately 748 sales consultants who sell directly tosalons and salon professionals.
We provide our customers with a wide variety of leading third-party branded and owned-brand professional beauty supplies, including hair color and care products,styling tools, skin and nail care products and other beauty items. For each of the fiscal years ended September 30, 2019, 2018 and 2017, over 80% of our consolidated netsales were from customers located in the U.S.
Our leading channel positions and multi-channel platform afford us several advantages, including hair color and hair care expertise, strong positioning with suppliers, theability to better service the highly fragmented beauty supply marketplace and economies of scale. Through our multi-channel platform, we are able to reach broad,diversified geographies, and customer segments using varying product assortments.
Our stores are conveniently located and offer a wide selection of competitively priced beauty products, beauty solutions and expertise delivered by our knowledgeablesalespeople. We also offer a comprehensive selection of multi-cultural products we believe further differentiates us from our competitors.
We believe that our DSCs distinguish us from other full-service/exclusive-channel distributors by providing us with a better understanding of our professional customers’needs. In addition to placing orders through our DSCs, our customers have the ability to order and pick up the products they need between visits from our DSCs byvisiting a nearby BSG store. We believe that our differentiated customer value proposition and strong brands drive customer loyalty.
Operating StrategyOur mission is to empower our customers to express themselves through hair. Our strategy is to be the expert and leader in hair color and care for the consumer and thesalon professional. We focus on hair color and care through our strategic product assortment, leading experiences in color, and building compelling customer experienceswhile also increasing our operating efficiency and profitability.Our strategic product assortment includes being the partner of choice for brands and influencers. We believe that we offer our customers a strong and differentiated valueproposition by providing salon-quality products, including an extensive collection of owned and exclusive-label brands and solutions at attractive prices.Our focus and experiences with color include a strong emphasis on our sales force. We believe our approach to recruiting, training, and compensation results in a highlyknowledgeable and effective sales force.Our goal is to create an appealing shopping environment that embraces the retail consumer and salon professional and highlights our extensive product offering. Webelieve that our initiatives to create a compelling shopping environment, over time, will help drive increased customer traffic to our stores and increase their salesproductivity.
Our digital strategy is evolving from a largely transactional-based experience to a more content-rich experience that enables customers to learn about the latest trends andtechniques from influencers and engages them with our latest product launches and research products. We believe that these efforts will, over time, drive traffic andimprove sales from these sites.
- 1 -
Professional Beauty Supply Industry Distribution Channels
The professional beauty supply industry serves end-users through four distribution channels:
Open-Line
This channel serves retail consumers and salon professionals through retail stores and e-commerce platforms. This channel is served by a large number of localizedretailers and distributors, with only a few having a regional or national presence and significant channel share. We believe that SBS, with its nationwide network of retailstores, is the largest open-line distributor in the U.S. In addition, SBS’s websites (including www.sallybeauty.com) and other e-commerce platforms, including our newSBS mobile commerce-based app, provide retail consumers and salon professionals access to product offerings and information beyond our retail stores.
Full-Service/Exclusive
This channel exclusively serves salons and salon professionals and distributes “professional-only” and other products for use in salons and for resale to consumers insalons. Many brands are distributed through exclusive arrangements with suppliers by geographic territory. BSG is one of the leading full-service distributors in the U.S.In addition, BSG offers its products for sale to salons and salon professionals through e-commerce platforms (including www.cosmoprofbeauty.com,www.cosmoprofequipment.com and the CosmoProf mobile commerce-based app).
Direct
This channel focuses on direct sales to salons and salon professionals by large manufacturers. This is the dominant form of distribution in Europe but represents a smallerchannel in the U.S. due to the highly fragmented nature of the U.S. salon industry, which makes direct distribution costs prohibitive for many manufacturers.
Mega-Salon Stores
In this channel, large-format salons are supplied directly by manufacturers due to their significant purchase requirements.
Key Industry and Business Trends
We believe the following key industry and business trends and characteristics will influence our business and our financial results going forward:
High level of marketplace fragmentation. The U.S. salon industry is highly fragmented with salons and barbershops. Given the fragmented and small-scale nature of thesalon industry, we believe that salon operators will continue to depend on full-service/exclusive distributors and open-line channels for a majority of their beauty supplypurchases.
Rapidly evolving consumer trends. Our industry is characterized by continuously changing fashion-related trends that drive new styles, including hair and nail styles, andcontinuing demand for beauty products. In addition, we expect millennials and the aging baby-boomer population in the U.S. to continue to drive sales growth in certainprofessional beauty product categories, including through an increase in the usage of hair color and care products.
Increasing use of owned and exclusive-label brand products. We offer an extensive range of owned and exclusive-label brand professional beauty products. Our lines ofowned and exclusive-label brand products have matured and become better known in our retail stores and e-commerce platforms, showing an increase in sales.
Growth in chair renting and frequent stocking needs. Salon professionals primarily rely on just-in-time inventory due to capital constraints and limited warehouse andshelf space. In addition, chair renters and suite renters, who now comprise a significant percentage of the total U.S. salon professionals, are often responsible forpurchasing their own supplies. The number of chair renters and suite renters has significantly increased as a percentage of total salon professionals in recent years, and weexpect this trend to continue. Chair renters and suite renters, given their smaller and more frequent purchase patterns, are dependent on frequent trips to professionalbeauty supply stores. We expect that these factors will continue to drive demand for conveniently located professional beauty supply stores, like BSG and SBS.
- 2 -
Business Segments
We operate in two business segments: (i) SBS, an open-line retailer of professional beauty supplies offering professional beauty supplies to both retail consumers andsalon professionals, in North America, South America and Europe, and (ii) BSG, including its franchise-based business Armstrong McCall, a full-service beauty supplydistributor offering professional brands directly to salons and salon professionals through our own sales force and professional-only stores, many in exclusivegeographical territories, in North America. SBS stores generally operate under the Sally Beauty banner, while BSG stores generally operate under the CosmoProf banner.
Neither the sales nor the product assortment for SBS or BSG are generally seasonal in nature.
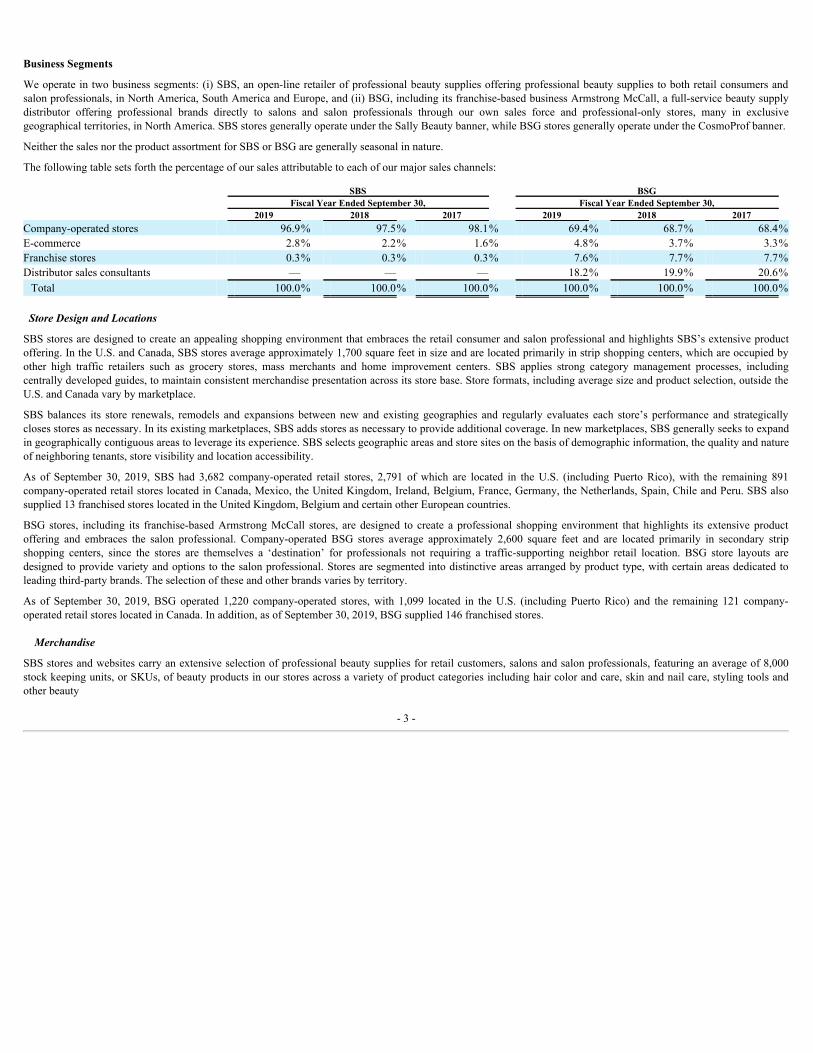
The following table sets forth the percentage of our sales attributable to each of our major sales channels:
SBS BSG Fiscal Year Ended September 30, Fiscal Year Ended September 30, 2019 2018 2017 2019 2018 2017
Company-operated stores 96.9% 97.5% 98.1% 69.4% 68.7% 68.4%E-commerce 2.8% 2.2% 1.6% 4.8% 3.7% 3.3%Franchise stores 0.3% 0.3% 0.3% 7.6% 7.7% 7.7%Distributor sales consultants — — — 18.2% 19.9% 20.6%Total 100.0% 100.0% 100.0% 100.0% 100.0% 100.0%
Store Design and Locations
SBS stores are designed to create an appealing shopping environment that embraces the retail consumer and salon professional and highlights SBS’s extensive productoffering. In the U.S. and Canada, SBS stores average approximately 1,700 square feet in size and are located primarily in strip shopping centers, which are occupied byother high traffic retailers such as grocery stores, mass merchants and home improvement centers. SBS applies strong category management processes, includingcentrally developed guides, to maintain consistent merchandise presentation across its store base. Store formats, including average size and product selection, outside theU.S. and Canada vary by marketplace.
SBS balances its store renewals, remodels and expansions between new and existing geographies and regularly evaluates each store’s performance and strategicallycloses stores as necessary. In its existing marketplaces, SBS adds stores as necessary to provide additional coverage. In new marketplaces, SBS generally seeks to expandin geographically contiguous areas to leverage its experience. SBS selects geographic areas and store sites on the basis of demographic information, the quality and natureof neighboring tenants, store visibility and location accessibility.
As of September 30, 2019, SBS had 3,682 company-operated retail stores, 2,791 of which are located in the U.S. (including Puerto Rico), with the remaining 891company-operated retail stores located in Canada, Mexico, the United Kingdom, Ireland, Belgium, France, Germany, the Netherlands, Spain, Chile and Peru. SBS alsosupplied 13 franchised stores located in the United Kingdom, Belgium and certain other European countries.
BSG stores, including its franchise-based Armstrong McCall stores, are designed to create a professional shopping environment that highlights its extensive productoffering and embraces the salon professional. Company-operated BSG stores average approximately 2,600 square feet and are located primarily in secondary stripshopping centers, since the stores are themselves a ‘destination’ for professionals not requiring a traffic-supporting neighbor retail location. BSG store layouts aredesigned to provide variety and options to the salon professional. Stores are segmented into distinctive areas arranged by product type, with certain areas dedicated toleading third-party brands. The selection of these and other brands varies by territory.
As of September 30, 2019, BSG operated 1,220 company-operated stores, with 1,099 located in the U.S. (including Puerto Rico) and the remaining 121 company-operated retail stores located in Canada. In addition, as of September 30, 2019, BSG supplied 146 franchised stores.
Merchandise
SBS stores and websites carry an extensive selection of professional beauty supplies for retail customers, salons and salon professionals, featuring an average of 8,000stock keeping units, or SKUs, of beauty products in our stores across a variety of product categories including hair color and care, skin and nail care, styling tools andother beauty
- 3 -
products. SBS’s stores and e-commerce platforms carry products from one or more of the leading manufacturers in each category, including third-party brands such asWella®, Clairol®, OPI®, Conair® and Hot Shot Tools®, as well as an extensive selection of owned and exclusive-label brand products. We believe that delivering anextensive selection of leading third-party, owned and exclusive-label brand professional beauty products at attractive prices through knowledgeable sales associates andconvenient store locations is what differentiates SBS. Additionally, we believe that carrying a wide selection of the latest premier branded merchandise is critical for SBSin building long-term relationships with its customers and attracting new customers. As beauty trends continue to evolve, SBS will continue to offer the changingprofessional beauty product assortment necessary to meet the needs of retail consumers and salon professionals.
In addition, SBS offers an extensive selection of owned and exclusive-label brand professional beauty products that are only available at SBS stores and through its e-commerce platforms. We believe that SBS’s owned and exclusive-label brand products offer equal or better quality products than higher-priced leading third-partybrands, providing the customer attractive alternatives to those brands at lower prices. Generally, SBS’s owned-brand products have higher gross margins than the leadingthird-party branded products and, we believe, offer continued growth potential. During the fiscal year ended September 30, 2019, owned and exclusive-label brandproducts accounted for approximately 45% of SBS’s product sales in the U.S. and Canada. SBS intends to continue to invest in the growth of its owned and exclusive-label brands and to actively promote these products.
BSG’s stores and e-commerce platforms carry an extensive selection of third-party branded products, such as Paul Mitchell®, Wella®, Matrix®, Schwarzkopf®, Kenra®,Goldwell®, Joico® and Chi®, for salons and salon professionals at competitive prices. We feature an average of 10,500 SKUs of beauty products in our BSG stores acrossa variety of product categories including hair color and care, skin and nail care, styling tools and other beauty items. Additionally, BSG has exclusive and non-exclusivedistribution rights for well-known brands in certain geographies with several key vendors. As part of its growth strategy, BSG continues to pursue the acquisition ofadditional distribution rights. We believe that carrying an extensive selection of branded merchandise is critical to maintaining relationships with our professionalcustomers.
We believe BSG is the largest full-service distributor of professional beauty supplies in North America exclusively targeting salons and salon professionals. ThroughBSG’s large store base, e-commerce platforms and sales force, including Armstrong McCall, BSG is able to access a significant portion of the highly fragmentedU.S. professional beauty salon products industry.
Marketing and Advertising
We continue to invest in new talent and capabilities in our digital commerce, brand marketing and strategy and global sourcing. As part of this effort, we have realignedour marketing and digital functions to create a new structure in which every team supports and fuels the growth for both SBS and BSG. This allows us to leverage strong,centralized teams for areas such as e-commerce, loyalty and brand strategy, rather than trying to build duplicative capabilities for both segments.
SBS’s marketing programs are designed to drive customer traffic by differentiating SBS as a source of professional advice, solutions and salon-quality products atcompetitive prices, all backed by our “Love It or Return It” guarantee.
We continuously adapt our marketing initiatives and adjust our media and messaging mix to achieve a high return on our marketing and advertising dollars. We targetexisting and potential customers through an integrated marketing approach designed to reach the customer through a variety of media, including digital advertising, email,social media, text messaging, direct mail and print advertising.
We continue to refine the strategy for sallybeauty.com and other e-commerce platforms, shifting from largely transactional-based to a more content-rich experience thatenables customers to learn about the latest trends and techniques from influencers, engage in our latest product launches and research products. We frequently update thehome page to enhance its appeal to our existing and prospective customers. In addition, we continue to refine our internal processes and partnerships to increase traffic tothe website. Many of our customers research products on our site before visiting a store. Beyond generating e-commerce sales, we believe our website and new SBSmobile app are important vehicles to reach consumers researching beauty products online who could potentially visit our stores as a result of their experience on ourwebsite or our SBS mobile app.
- 4 -
SBS’s customer loyalty and customer relationship management (“CRM”) programs, in the U.S. and Canada, allow SBS the opportunity to collect valuable point-of-salecustomer data as a means of increasing its understanding of customers’ needs and enhancing its ability to market to them in more personalized, relevant ways. Wecontinue to assess and update our customer loyalty and CRM programs in an effort to further enhance the customer experience and promote repeat sales from both retailcustomers and salon professionals. In our fiscal year 2019, we replaced our existing loyalty program, which required a nominal annual fee for discounts, with a moretraditional points-based loyalty program. Outside the U.S. and Canada, our customer loyalty and marketing programs vary by marketplace.
BSG’s marketing programs are designed primarily to promote its extensive selection of brand name products at competitive prices and to educate, motivate and empowerits customers to grow professionally. BSG communicates on a frequent basis with its customers and potential customers, and distributes promotional material throughmultiple communication channels, including trade shows, educational events, store personnel, DSCs, print mail, e-mail, text and social media. In addition, we believe thatBSG’s websites (www.cosmoprofequipment.com and www.cosmoprofbeauty.com ) and the CosmoProf mobile commerce-based app enhance other efforts intended topromote awareness of BSG’s products by salons and salon professionals.
As of September 30, 2019, BSG had a network of 748 DSCs, which exclusively consult, support and sell directly to salons and salon professionals. In order to provide aknowledgeable sales consultant team, BSG actively recruits and trains individuals with industry knowledge or sales experience. We believe that DSCs with broad productknowledge and direct sales experience are more successful in driving sales. Our sales commission program is an important component of our DSCs compensation, whichis designed to drive sales and to focus DSCs on selling products that are best suited to individual salons and salon professionals.
Our Customers
We appeal to a wide demographic consumer profile and offer an extensive selection of professional-grade beauty products sold directly to retail consumers, salons andsalon professionals. Historically, these factors have provided us with reduced exposure to downturns in economic conditions in the countries in which we operate.
Our Competition
The global beauty industry is highly competitive. SBS competes with domestic and international beauty product wholesale and retail outlets, including local and regionalopen-line beauty supply stores, professional-only beauty supply stores, mass merchandisers, online retailers, drug stores, department stores and supermarkets, as well assalons that sell hair care products. BSG competes primarily with domestic and international beauty product wholesale suppliers, including online retailers, andmanufacturers selling professional beauty products directly to salons and individual salon professionals. The primary competitive factors in the beauty productsdistribution industry are the price at which branded and owned-brand products are sold to customers; exclusive distribution contracts; the quality, perceived value,consumer brand name recognition, packaging and variety of the products sold; customer service; the efficiency of distribution networks; and the availability of desirablestore locations.
We face competition from certain manufacturers that use their own sales forces to distribute their professional beauty products directly or that align themselves with ourcompetitors. Some of these manufacturers are vertically integrating through the acquisition of distributors and stores. We also face competition from authorized andunauthorized retailers and internet sites offering professional salon-only products.
Our Suppliers
We purchase our merchandise directly from manufacturers through supply contracts and by purchase orders. For the fiscal year 2019, our five largest suppliers – Coty,Inc., the Professional Products Division of L'Oreal USA S/D, Inc., or L’Oreal, John Paul Mitchell Systems, Conair Corporation, and Henkel AG & Co. KGaA –accounted for approximately 45% of our consolidated merchandise purchases. Products are purchased from these and many other manufacturers on an at-will basis orunder contracts which can generally be terminated without cause upon 90 days or less notice or expire without express rights of renewal.
- 5 -

Our Employees
As of September 30, 2019, we employed approximately 30,050 full-time and part-time employees.
Regulation
We are subject to a wide variety of laws and regulations, which historically have not had a material effect on our business. For example, in the U.S., most of the productssold and the content and methods of advertising and marketing utilized are subject to both federal and state regulations administered by a host of federal and stateagencies, including, in each case, one or more of the following: the Food and Drug Administration, or FDA, the Federal Trade Commission and the Consumer ProductsSafety Commission. The transportation and disposal of many of our products are also subject to federal and state regulation. State and local agencies regulate manyaspects of our business. We also face comprehensive regulation outside the U.S., focused primarily on product labeling and safety issues.
As of September 30, 2019, SBS and BSG supplied franchised stores located in the U.S., Mexico and certain countries in Europe. As a result of these franchisor-franchiseerelationships, we are subject to regulation when offering and selling franchises in the applicable countries. The applicable laws and regulations affect our businesspractices, as franchisor, in a number of ways, including restrictions placed upon the offering, renewal, termination and disapproval of assignment of franchises. To date,these laws and regulations have not had a material effect upon our operations.
Access to Public Filings
Our Annual Report on Form 10-K, our Quarterly Reports on Form 10-Q and our Current Reports on Form 8-K, and amendments to such reports are available, withoutcharge, on our website, www.sallybeautyholdings.com, as soon as reasonably possible after they are filed electronically with the Securities and Exchange Commission, orSEC, under the Exchange Act. The SEC maintains an internet site that contains our reports, proxy and information statements, and other information that we fileelectronically with the SEC at www.sec.gov. We will provide copies of such reports to any person, without charge, upon written request to our Investor RelationsDepartment at our principal office. The information found on our website shall not be considered to be part of this or any other report filed with or furnished to the SEC.
ITEM 1A. RISK FACTORS
The following describes risks that we believe to be material to our business. If any of the following risks or uncertainties actually occurs, our business, financial conditionand operating results could be materially and adversely affected. This report also contains forward-looking statements and the following risks could cause our actualresults to differ materially from those anticipated in such forward-looking statements.
The beauty products distribution industry is highly competitive and is consolidating.
The beauty products distribution industry is highly fragmented and competitive, and there are few significant barriers to entry into the marketplaces for most of the typesof products we sell. SBS competes with other domestic and international beauty product wholesale and retail outlets, including local and regional open-line beauty supplystores, professional-only beauty supply stores, salons, mass merchandisers, online retailers, drug stores and supermarkets. BSG competes with other domestic andinternational beauty product wholesale and retail suppliers and with manufacturers selling professional beauty products directly to salons and individual salonprofessionals. We also face competition from authorized and unauthorized retailers as well as e-commerce retailers offering professional salon-only and other products.The availability of diverted professional salon products in unauthorized large format retail stores such as drug stores, grocery stores and others could also have a negativeimpact on our business. The primary competitive factors in the beauty products distribution industry are the price at which we purchase branded and owned-brandproducts from manufacturers and the price at which we resell them to our customers, the quality, perceived value, consumer brand name recognition, packaging andvariety of the products we sell, customer service, the efficiency of our distribution network, and the availability of desirable store locations. Competitive conditions maylimit our ability to maintain prices or may require us to reduce prices in efforts to retain business or channel share, particularly because customers are able to quickly andconveniently comparison shop and determine real-time product availability using digital tools, which can lead to decisions driven solely by price, the functionality of thedigital tools, or a combination of these and other factors. We must compete by offering a
- 6 -

consistent and convenient shopping experience for our customers regardless of the ultimate sales channel. Some of our competitors have greater financial and otherresources than we do and are less leveraged than our business, and may therefore be able to spend more aggressively on advertising and promotional activities andrespond more effectively to changing business and economic conditions. We expect existing competitors, business partners and new entrants to the beauty productsdistribution industry to constantly revise or improve their business models in response to challenges from competing businesses, including ours. If these competitorsintroduce changes or developments that we cannot address in a timely or cost-effective manner, our business may be adversely affected.
In addition, our industry is consolidating, which may give our suppliers and our competitors increased negotiating leverage and greater marketing resources, resulting in amore effective way to compete with us. For instance, we may lose customers if those competitors which have broad geographic reach attract additional salons (individualand chain) that are currently BSG customers, or if professional beauty supply manufacturers align themselves with our competitors or begin selling direct to customers.Not only does consolidation in distribution pose risks from competing distributors, but it may also place more leverage in the hands of those manufacturers, resulting insmaller margins on products sold through our network.
If we are unable to compete effectively in our marketplace or if competitors divert our customers away from our networks, it would adversely impact our business,financial condition and results of operations.
We may be unable to anticipate and effectively respond to changes in consumer preferences and buying trends in a timely manner.
Our success depends in part on our ability to anticipate, gauge and react in a timely manner to changes in consumer spending patterns and preferences for specific beautyproducts. If we do not timely identify and properly respond to evolving trends and changing consumer demands for beauty products in the geographies in which wecompete, our sales may decline significantly. Furthermore, we may accumulate additional inventory and be required to mark down unsold inventory to prices that aresignificantly lower than normal prices, which would adversely impact our margins and could further adversely impact our business, financial condition and results ofoperations. Additionally, a large percentage of our SBS product sales come from our owned and exclusive-label brand products. The development and promotion of theseowned and exclusive-label brand products often occur well before these products are sold in our stores. As a result, the success of these owned and exclusive-label brandproducts is largely dependent on our ability to develop products that meet future consumer preferences at prices that are acceptable to our customers. Furthermore, wemay have to spend a significant amount on the advertising and marketing of our owned and exclusive-label brands to drive customer awareness of these brands. There canbe no assurance that any new owned and exclusive-label brand will meet consumer preferences, gain acceptance among our customer base or generate sales to becomeprofitable or to cover the costs of its development and promotion, which would also adversely impact our margins and could adversely impact our business, financialcondition and results of operations.
In addition, we depend on our inventory management and information technology systems in order to replenish inventories and deliver products to store locations inresponse to customer demands. Any systems-related problems could result in difficulties satisfying the demands of customers that, in turn, could adversely affect oursales and profitability. In addition, our failure to manage inventory levels appropriately during any period could adversely affect our results of operations and profitability.We also rely on vendor relationships to provide us with access to the latest beauty products that meet the changing demands of our customers. If we are unable tomaintain these relationships, our ability to meet these demands will be impaired. See below “-We depend upon manufacturers who may be unable to provide products ofadequate quality or who may be unwilling to continue to supply products to us.”
We expect continuously changing fashion-related trends and consumer tastes to influence future demand for beauty products. Changes in consumer tastes and fashiontrends can have an impact on our financial performance. If we are unable to anticipate and respond to trends in the marketplace for beauty products and changingconsumer demands, our business could suffer.
Our future success depends in part on our ability to successfully implement our strategic initiatives to improve the customer experience, attract new customers andimprove the sales productivity of our stores.
We continue the implementation of a significant number of strategic initiatives designed to ‘play to win’ by focusing on our color and care business, to improve our retailfundamentals, to improve our digital capabilities and to improve our cost structure. There can be no assurance that these strategic initiatives will be successful.Furthermore,
- 7 -
we are investing significant resources in these initiatives and the costs of the initiatives may outweigh their benefits. If these strategic initiatives are not successful, oursame store sales will suffer and our growth prospects, financial results, profitability and cash flows will also be adversely impacted.
Our restructuring program may not be successful or we may not fully realize the expected cost savings and/or operating efficiencies from our restructuring plans.
Our ability to grow profitably depends in large part on our ability to successfully control or reduce our operating expenses. In furtherance of this strategy, we haveengaged in ongoing activities to reduce or control costs, some of which are complicated and require us to expend significant resources to implement. As we previouslyannounced in fiscal years 2017, 2018 and 2019, we have implemented, and plan to continue to implement, restructuring plans to transform the Company for the futureand support long-term sales growth and profitability. The program is intended to touch all aspects of the business, enhance operating capabilities, create greaterefficiencies and take advantage of our considerable scale. Restructuring plans present significant potential risks that may impair our ability to achieve anticipatedoperating enhancements and/or cost reductions, or otherwise harm our business, including higher than anticipated costs in implementing our restructuring plan, as well asmanagement distraction. As part of our overhead reduction, we have reduced our corporate and operations headcount, including management level, distribution and fieldemployees. These reductions, as well as employee attrition, could result in the potential loss of specific knowledge relating to our company, operations and industry thatcould be difficult to replace. Also, we now operate with fewer employees, who have assumed additional duties and responsibilities. The restructuring program andworkforce changes may negatively impact communication, morale, management cohesiveness and effective decision-making, which could have an adverse impact on ourbusiness operations, internal controls, customer experience, sales and results of operations. Despite these cost control plans, our costs may continue to increase for theforeseeable future. Furthermore, we continue to make significant investments in our strategic initiatives. We cannot assure you that our strategic initiatives and costcontrol efforts will result in the increased profitability, cost savings or other benefits that we expect, which could have a material adverse effect on our business, financialcondition and results of operations.
Our same store sales and quarterly financial performance may fluctuate for a variety of reasons.
Our same store sales and quarterly results of operations have fluctuated in the past and we expect them to continue to fluctuate in the future. A variety of factors affect oursame store sales and quarterly financial performance, including:
• the success of our strategic initiatives;
• changes in our merchandising strategy or mix;
• our ability to increase sales and meet forecasted levels of profitability at our stores;
• our ability to anticipate and effectively respond to changing consumer preferences and buying trends in the geographies that our stores serve;
• the effectiveness of our inventory management processes and systems;
• a portion of a typical new store’s sales (or sales we make over our e-commerce channels) coming from customers who previously shopped at other existingstores;
• expenditures on our distribution system;
• the timing and effectiveness of our marketing activities, particularly our ability to drive new retail traffic into our stores at an acceptable cost and ourpromotions;
• the effects of severe weather events or other natural disasters;
• actions by our existing or new competitors;
• fluctuations over time in the cost to us of products we sell; and
• worldwide economic conditions and, in particular, the retail sales environment in the U.S.
- 8 -

Accordingly, our results, including same store sales, for any one fiscal quarter are not necessarily indicative of the results to be expected for any other quarter, and mayeven decrease, which could have a material adverse effect on our business, financial condition and results of operations.
We depend upon manufacturers who may be unable to provide products of adequate quality or who may be unwilling to continue to supply products to us.
We do not manufacture any products we sell, and instead purchase our products from recognized brand manufacturers and private label fillers. We depend on a limitednumber of manufacturers for a significant percentage of the products we sell. For example, there can be no assurances as to the impact, if any, that Coty Inc.’s recentacquisition of the fragrances, color cosmetics, and hair color divisions of Procter & Gamble will have on our ability to continue to source products from these divisions atcurrent prices and volumes.
Since we purchase products from many manufacturers and fillers under at-will contracts and contracts which can be terminated without cause upon 90 days’ notice orless, or which expire without express rights of renewal, manufacturers and fillers could discontinue sales to us immediately or upon short notice. Some of our contractswith manufacturers may be terminated if we fail to meet specified minimum purchase requirements. If minimum purchase requirements are not met, we do not havecontractual assurances of continued supply. In lieu of termination, a manufacturer may also change the terms upon which it sells, for example, by raising prices orbroadening distribution to third parties. Infrequently, a supplier will seek to terminate a distribution relationship through legal action. For these and other reasons, we maynot be able to acquire desired merchandise in sufficient quantities or on acceptable terms in the future.
Changes in SBS’s and BSG’s relationships with suppliers occur often, and could positively or negatively impact the net sales and operating earnings of both businesssegments. Some of our suppliers may seek to decrease their reliance on distribution intermediaries, including full-service/exclusive and open-line distributors like BSGand SBS, by promoting their own distribution channels, as discussed above. These suppliers may offer advantages, such as lower prices, when their products arepurchased from distribution channels they control. If our access to supplier-provided products were to diminish relative to our competitors or we were not able topurchase products at the same prices as our competitors, our business could be materially and adversely affected. Also, consolidation among suppliers may increase theirnegotiating leverage, thereby providing them with competitive advantages that may increase our costs and reduce our revenues, adversely affecting our business, financialcondition and results of operations. Therefore, there can be no assurance that the impact of these developments, if they were to occur, will not adversely impact revenue toa greater degree than we currently expect or that our efforts to mitigate the impact of these developments will be successful. If the impact of these developments is greaterthan we expect or our efforts to mitigate the impact of these developments are not successful, this could have a material adverse effect on our business, financial conditionor results of operations.
Any significant interruption in the supply of products by manufacturers and fillers could disrupt our ability to deliver merchandise to our stores and customers in atimely manner, which could have a material adverse effect on our business, financial condition and results of operations.
Manufacturers and owned and exclusive-label brand fillers of beauty supply products are subject to certain risks that could adversely impact their ability to provide uswith their products on a timely basis, including inability to procure ingredients, industrial accidents, environmental events, strikes and other labor disputes, unionorganizing activity, disruptions in logistics or information systems, loss or impairment of key manufacturing sites, product quality control, safety, licensing requirementsand other regulatory issues, as well as natural disasters and other external factors over which neither they nor we have control.
In addition, we directly source many of our owned and exclusive-label brand products, including, but not limited to, styling tools, salon equipment, sundries and otherpromotional products, from foreign third-party manufacturers and many of our vendors also use overseas sourcing to manufacture some or all of their products. Any eventcausing a sudden disruption of manufacturing or imports from such foreign countries, including the imposition of additional or increased import restrictions, duties ortariffs, political instability, labor disputes, local business practices, legal or economic restrictions on overseas suppliers’ ability to produce and deliver products or acts ofwar or terrorism, could materially harm our operations to the extent they affect the production, shipment or receipt of merchandise. Our operating results depend to someextent on the orderly operation of our receiving and distribution processes,
- 9 -

which depend on manufacturers’ adherence to shipping schedules and our effective management of our distribution facilities and capacity.
If a material interruption of supply occurs, or a significant manufacturer or filler ceases to supply us or materially decreases its supply to us, we may not be able to acquireproducts with similar quality and consumer brand name recognition as the products we currently sell or to acquire such products in sufficient quantities to meet ourcustomers’ demands or on favorable terms to our business, any of which could adversely impact our business, financial condition and results of operations.
Fluctuations in the price, availability and quality of inventory may result in higher cost of goods, which we may not be able to pass on to the customers.
Our suppliers are increasingly passing on higher production costs, which may impact our ability to maintain or grow our margins. The price and availability of rawmaterials may be impacted by demand, regulation, weather and other factors. Additionally, manufacturers have and may continue to have increases in othermanufacturing costs, such as transportation, labor and benefit costs. These increases in production costs result in higher merchandise costs to us. We may not always beable to pass on those cost increases to our customers, which could have a material adverse effect on our business, financial condition and results of operations.
If products sold by us are found to be defective in labeling or content, our credibility and that of the brands we sell may be harmed, marketplace acceptance of ourproducts may decrease, and we may be exposed to liability in excess of our products liability insurance coverage and manufacturer indemnities.
We do not control the production process for the products we sell. We may not be able to identify a defect in a product we purchase from a manufacturer or owned andexclusive-label brand filler before we offer such product for resale. In many cases, we rely on representations of manufacturers and fillers about the products we purchasefor resale regarding the composition, manufacture and safety of the products, as well as the compliance of our product labels with government regulations. Our sale ofcertain products exposes us to potential product liability claims, recalls or other regulatory or enforcement actions initiated by federal, state or foreign regulatoryauthorities or through private causes of action. Such claims, recalls or actions could be based on allegations that, among other things, the products sold by us aremisbranded, contain contaminants or impermissible ingredients, provide inadequate instructions regarding their use or misuse, or include inadequate warnings concerningflammability or interactions with other substances. Claims against us could also arise as a result of the misuse by purchasers of such products or as a result of their use ina manner different than the intended use. We may be required to pay for losses or injuries actually or allegedly caused by the products we sell and to recall any productwe sell that is alleged to be or is found to be defective.
Any actual defects or allegations of defects in products sold by us could result in adverse publicity and harm our credibility or the credibility of the manufacturer, whichcould adversely affect our business, financial condition and results of operations. Although we may have indemnification rights against the manufacturers of many of theproducts we distribute and rights as an “additional insured” under the manufacturers’ insurance policies, it is not certain that any manufacturer or insurer will befinancially solvent and capable of making payment to any party suffering loss or injury caused by products sold by us. Further, some types of actions and penalties,including many actions or penalties imposed by governmental agencies and punitive damages awards, may not be remediable through reliance on indemnity agreementsor insurance. Furthermore, potential product liability claims may exceed the amount of indemnity or insurance coverage or be excluded under the terms of an indemnityagreement or insurance policy and claims for indemnity or reimbursement by us may require us to expend significant resources and may take years to resolve. If we areforced to expend significant resources and time to resolve such claims or to pay material amounts to satisfy such claims, it could have an adverse effect on our business,financial condition and results of operations.
We could be adversely affected if we do not comply with current laws and regulations or if we become subject to additional or more stringent laws and regulations.
We are subject to a number of federal, state and local laws and regulations in the U.S., as well as applicable laws and regulations in each foreign marketplace in which wedo business. These laws and regulations govern the composition, packaging, labeling and safety of the products we sell, as well as the methods we use to sell and importthese products. Non-compliance with applicable laws and regulations of governmental authorities, including the FDA and similar authorities in other jurisdictions, by usor the manufacturers and fillers of the products sold by us
- 10 -
could result in fines, product recalls and enforcement actions, and otherwise restrict our ability to market certain products, which could adversely affect our business,financial condition and results of operations.
In addition, the laws and regulations applicable to us or manufacturers of the products sold by us may become more stringent. For example, the State of California, wherewe operate a number of stores, currently enforces legislation commonly referred to as “Proposition 65” that requires that “clear and reasonable” warnings be given toconsumers who are exposed to chemicals known to the State of California to cause cancer or reproductive toxicity. Although we have sought to comply with Proposition65 requirements, there can be no assurance that we will not be adversely affected by litigation or other actions relating to Proposition 65 or future legislation that issimilar or related thereto. Continued legal compliance with new and existing regulations, such as Proposition 65 and other federal or state-level safe consumer productregulations, could require the review and possible reformulation or relabeling of certain products, as well as the possible removal of some products from the marketplace.Failure to comply with these new and existing regulations could result in significant fines or damages, in addition to costs and expenses to defend claims related thereto.Legal compliance could also lead to considerably higher internal regulatory costs. Manufacturers may try to recover some or all of any increased costs of compliance byincreasing the prices at which we purchase products, and we may not be able to recover some or all of such increased cost in our own prices to our customers. We are alsosubject to state and local laws and regulations that affect our franchisor-franchisee relationships. Increased compliance costs and the loss of sales of certain products dueto more stringent or new laws and regulations could adversely affect our business, financial condition and results of operations.
Laws and regulations impact our business in many areas that have no direct relation to the products we sell. One area of intense regulation is that of the relationships wehave with our employees, including, for example, compliance with many different wage and hour and nondiscrimination related regulatory schemes and, in the U.S.,compliance with the 2010 Patient Protection and Affordable Care Act. Violation of any of the laws or regulations governing our business or the assertion of individual orclass-wide claims could have an adverse effect on our business, financial condition and results of operations.
The United Kingdom’s vote to leave the European Union (“EU”) could adversely impact our business, results of operations and financial condition.
There is substantial uncertainty surrounding the United Kingdom’s 2016 vote to leave the EU (“Brexit”), which is currently scheduled for January 31, 2020. Any impactof Brexit depends on the terms of the United Kingdom’s withdrawal from the EU, if it ultimately occurs. The ongoing uncertainty within the United Kingdom’sgovernment and Parliament on the status of a withdrawal agreement could lead to economic stagnation until an ultimate resolution with respect to Brexit occurs. Suchuncertainty also sustains the possibility of a “hard Brexit,” in which the United Kingdom leaves the EU without a withdrawal agreement and associated transition periodin place. A hard Brexit would likely cause significant market and economic disruption and negatively impact customer experience and service quality, and could depressthe demand for our services.
Even if an agreement setting forth the terms of the United Kingdom’s withdrawal from the EU is approved, the withdrawal could result in a global economic downturn.The United Kingdom also could lose access to the single EU market and to the global trade deals negotiated by the EU on behalf of its members, depressing tradebetween the United Kingdom and other countries, which would negatively impact our international operations. Additionally, we may face new regulations regarding tradeand employees, among others, in the United Kingdom. Compliance with such regulations could be costly, negatively impacting our business, results of operations andfinancial condition. Brexit could also adversely affect European and worldwide economic and market conditions and could contribute to instability in global financial andforeign exchange markets, including volatility in the value of the Euro and the British pound sterling.
Our e-commerce businesses may be unsuccessful or, if successful, may divert sales from our stores.
We offer many of our beauty products for sale through our e-commerce businesses in the U.S. (such as www.sallybeauty.com, www.cosmoprofbeauty.com ,www.cosmoprofequipment.com and mobile commerce-based apps) and abroad. As a result, we encounter risks and difficulties frequently experienced by internet-basedbusinesses, including risks related to our ability to attract and retain customers on a cost-effective basis and our ability to operate, support, expand and develop our e-commerce operations, websites and software and other related operational systems.
- 11 -

Although we believe that our participation in both e-commerce and physical store sales is a distinct advantage for us due to synergies and the potential for new customers,supporting product offerings through both of these channels could create issues that have the potential to adversely affect our results of operations. For example, if our e-commerce businesses successfully grow, they may do so in part by attracting existing customers, rather than new customers, who choose to purchase products from usonline rather than from our physical stores, thereby reducing the financial performance of our stores. In addition, offering different products through each channel couldcause conflicts and cause some of our current or potential internet customers to consider competing distributors of beauty products. In addition, offering products throughour e-commerce channels (particularly directly to consumers through our professional business) could cause some of our current or potential vendors to considercompeting internet offerings of their products either directly or through competing distributors. As we continue to grow our e-commerce businesses, the impact ofattracting existing rather than new customers, of conflicts between product offerings online and through our stores, and of opening up our channels to increased internetcompetition could have a material adverse impact on our business, financial condition and results of operations, including future growth and same store sales.Furthermore, our recent initiatives to upgrade our e-commerce platforms may not be successful in driving traffic to our websites and increasing our online sales in thelong term, which could adversely impact our net sales.
Diversion of professional products sold by BSG could have an adverse impact on our revenues.
The majority of the products that BSG sells, including those sold by our Armstrong McCall franchisees, are meant to be used exclusively by salons and individual salonprofessionals or sold exclusively to their retail consumers. However, despite our efforts to prevent diversion, incidents of product diversion occur, whereby our productsare sold by these purchasers (and possibly by other bulk purchasers such as franchisees) to wholesalers and ultimately to general merchandise retailers, among others.These retailers, in turn, sell such products to consumers. The diverted product may be old, tainted or damaged and sold through unapproved outlets, all of which coulddiminish the value of the particular brand. In addition, such diversion may result in lower net sales for BSG should consumers choose to purchase diverted products fromretailers rather than purchasing from our customers, or choose other products altogether because of the perceived loss of brand prestige.
In the BSG arena, product diversion is generally prohibited under our manufacturers’ contracts, and we are often under a contractual obligation to stop selling to salons,salon professionals and other bulk purchasers which engage in product diversion. If we fail to comply with our anti-diversion obligations under these manufacturers’contracts, including any known diversion of products sold through our Armstrong McCall franchisees, these contracts could be adversely affected or even terminated. Inaddition, our investigation and enforcement of our anti-diversion obligations may result in reduced sales to our customer base, thereby decreasing our revenues andprofitability.
BSG’s financial results are affected by the financial results of BSG’s franchised-based business (Armstrong McCall).
BSG receives revenue from its sale of products to Armstrong McCall franchisees. Accordingly, a portion of BSG’s financial results is to an extent dependent upon theoperational and financial success of these franchisees, including their implementation of BSG’s strategic plans. If sales trends or economic conditions worsen forArmstrong McCall’s franchisees, their financial results may worsen. Additionally, the failure of Armstrong McCall franchisees to renew their franchise agreements, anyrequirement that Armstrong McCall restructure its franchise agreements in connection with such renewals, or any failure of Armstrong McCall to meet its obligationsunder its franchise agreements, could result in decreased revenues for BSG or create legal issues with our franchisees or with manufacturers.
Furthermore, our franchisees may not run the stores and sales teams according to our standards, which could have a material adverse effect on our brand reputation andour business.
We may not be able to successfully identify acquisition candidates or successfully complete desirable acquisitions, and any acquisition could prove difficult tointegrate, disrupt our business or have an adverse effect on our results of operations.
In the past several years, we have completed multiple acquisitions and we intend to pursue additional acquisitions in the future. We actively review acquisition prospectsthat we believe would complement our existing lines of
- 12 -

business, increase the size and geographic scope of our operations or otherwise offer profitable growth and operating efficiency opportunities. There can be no assurancethat we will continue to identify suitable acquisition candidates.
If suitable candidates are identified, we may be unable to reach agreeable acquisition terms with such candidates or may not have access to sufficient funds to completesuch acquisitions. We compete against many other companies, some of which are larger and have greater financial and other resources than we do. Increased competitionfor acquisition candidates could result in fewer acquisition opportunities and higher acquisition prices. In addition, we are highly leveraged and the agreements governingour indebtedness contain limits on our ability to incur additional debt to pay for acquisitions. We may be unable to finance acquisitions that would increase our growth orimprove our financial and competitive position. To the extent that debt financing is available to finance acquisitions, our net indebtedness could increase as a result of anyacquisitions. Internationally, regulatory requirements, trade barriers and due diligence difficulties, among other considerations, make acquiring suitable foreign candidatesmore difficult, time-consuming and expensive.
Any acquisitions that we do make may be difficult to integrate profitably into our business and may entail numerous risks, including:
• difficulties in assimilating acquired operations, stores or products, including the loss of key employees from acquired businesses;
• difficulties and costs associated with integrating and evaluating the distribution or information systems and/or internal control systems of acquiredbusinesses;
• difficulties in competing with existing stores or business or diverting sales from our existing stores or business;
• expenses associated with the amortization of identifiable intangible assets;
• problems retaining key technical, operational and administrative personnel;
• diversion of management’s attention from our core business, including loss of management focus on marketplace developments;
• complying with foreign regulatory requirements, including multi-jurisdictional competition rules and restrictions on trade/imports;
• enforcement of intellectual property rights in foreign countries;
• adverse effects on existing business relationships with suppliers and customers, including the potential loss of suppliers of the acquired businesses;
• operating inefficiencies and negative impact on profitability;
• entering geographic areas or channels in which we have limited or no prior experience; and
• those related to general economic and political conditions, including legal and other barriers to cross-border investment in general, or by U.S. companies inparticular.
In addition, during the acquisition process, we may fail or be unable to discover some of the liabilities of businesses that we acquire. These liabilities may result from aprior owner’s noncompliance with applicable laws and regulations. Acquired businesses may also not perform as we expect or we may not be able to obtain the expectedfinancial improvements in the acquired businesses.
If we are unable to optimize our store base by profitably opening and operating new stores and closing less profitable stores, our business, financial condition andresults of operations may be adversely affected.
Our future growth strategy depends in part on our ability to optimize and profitably operate our stores in existing and additional geographic areas, including ininternational geographies. While the capital requirements to open a SBS or BSG store, excluding inventory, vary from geography to geography, such capital requirementshave historically been relatively low in the U.S. and Canada. Despite these relatively low opening costs, we may not be able to open all the new stores we plan to openand we may be unable to optimize our store base by closing stores that are unprofitable or open stores that are profitable, any of which could have a material adverseimpact on our
- 13 -

business, financial condition and results of operations. There are several factors that could affect our ability to open and profitably operate new stores, including:
• the inability to identify and acquire suitable sites or to negotiate acceptable leases for such sites;
• proximity to existing stores that may reduce the new store’s sales or the sales of existing stores;
• difficulties in adapting our distribution and other operational and management systems to an expanded network of stores;
• the level of sales made through our e-commerce channels and the potential that sales through our e-commerce channels will divert sales from our stores;
• the potential inability to obtain adequate financing to fund expansion because of our high leverage and limitations on our ability to issue equity under ourcredit agreements, among other things;
• increased (and sometimes unanticipated) costs associated with opening stores in international locations;
• difficulties in obtaining any governmental and third-party consents, permits and licenses;
• limitations on capital expenditures which may be included in financing documents that we enter into; and
• difficulties in adapting existing operational and management systems to the requirements of national or regional laws and local ordinances.
In addition, as we continue to open new stores, our management, as well as our financial, distribution and information systems, and other resources will be subject togreater demands. If our personnel and systems are unable to successfully manage this increased burden, our business, financial condition and results of operations may bematerially affected.
The political, social and economic conditions in the geographies we serve may affect consumer purchases of discretionary items such as beauty products and salonservices, which could have a material adverse effect on our business, financial condition and results of operations.
Our results of operations may be materially affected by conditions in the global capital markets and the economy and regulatory environment generally, both in the U.S.and internationally. Concerns over inflation, employment, tax laws, energy costs, geopolitical issues, terrorism, the availability and cost of credit, the mortgage market,sovereign and private banking systems, sovereign deficits and increasing debt burdens and the real estate and other financial markets in the U.S. and Europe havecontributed to increased volatility and diminished expectations for the U.S. and certain foreign economies. We appeal to a wide demographic consumer profile and offeran extensive selection of beauty products sold directly to retail consumers and salons and salon professionals. Continued uncertainty in the economy could adverselyimpact consumer purchases of discretionary items such as beauty products, as well as adversely impact the frequency of salon services performed by professionals usingproducts purchased from us. Factors that could affect consumers’ willingness to make such discretionary purchases include: general business conditions, levels ofemployment, interest rates, tax rates, the availability of consumer credit and consumer confidence in future economic conditions. In the event of a prolonged economicdownturn or acute recession, consumer spending habits could be adversely affected and we could experience lower than expected net sales. The economic climate couldalso adversely affect our vendors. The occurrence of any of these events could have a material adverse effect on our business, financial condition and results ofoperations.
Use of social media may adversely impact our reputation.
There has been a substantial increase in the use of social media platforms, including blogs, social media websites and other forms of digital communications, whichallows access to a broad audience of consumers and other interested persons. Negative commentary regarding us or the products we sell may be posted on social mediaplatforms or other electronic means at any time and may be adverse to our reputation or business. Customers value readily available information and often act on suchinformation without further investigation and without regard to its accuracy. The harm may be immediate without allowing us an opportunity for redress or correction.
We also use social media platforms as marketing tools. For example, we maintain Facebook, Twitter, Instagram and Pinterest accounts. As laws and regulations rapidlyevolve to govern the use of these platforms and devices, the failure by us, our employees or third parties acting at our direction to abide by applicable laws and regulationsin the
- 14 -

use of these platforms and devices could adversely impact our business, financial condition and results of operations.
In addition, we have agreements with a variety of industry influencers, and we feature industry influencers in our advertising and marketing efforts and may include themin some of our branding. Further, many industry influencers use our products and feature our products through their own platforms. Actions taken by these individualscould harm our brand image, net revenues and profitability.
If we are unable to protect our intellectual property rights, specifically our trademarks and service marks, our ability to compete could be negatively impacted.
We rely upon trade secrets and know-how to develop and maintain our competitive position. Our trademarks, certain of which are material to our business, are registeredor legally protected in the U.S., Canada and other countries in which we operate. The success of our business depends to a certain extent upon the value associated withour intellectual property rights. We own certain trademark and service mark rights used in connection with our business including, but not limited to, “Sally,” “SallyBeauty,” “Sally Beauty Supply,” “BSG,” “CosmoProf,” “Proclub,” “Armstrong McCall,” “ion,” “Beyond the Zone” and “Salon Services.” We protect our intellectualproperty rights through a variety of methods, including, but not limited to, applying for and obtaining trademark protection in the U.S., Canada and other countriesthroughout the world in which our business operates. We also rely on trade secret laws, in addition to confidentiality agreements with vendors, employees, consultantsand others who have access to our proprietary information. While we intend to vigorously protect our trademarks against infringement, we may not be successful. Inaddition, the laws of certain foreign countries may not protect our intellectual property rights to the same extent as the laws of the U.S. The costs required to protect ourintellectual property rights and trademarks are expected to continue to be substantial.
We may have to defend our rights in intellectual property that we use in certain of our products, and we could be found to infringe the intellectual property rights ofothers, which could be disruptive and expensive to our business.
The industry in which we operate is characterized by the need for a large number of copyrights, trade secrets and trademarks and by frequent litigation based onallegations of infringement or other violations of intellectual property rights. A third-party may at any time assert that our products violate such party’s intellectualproperty rights. Successful intellectual property claims against us could result in significant financial liabilities and/or prevent us from selling certain of our products. Inaddition, the resolution of infringement claims may require us to redesign our products, to obtain licenses to use intellectual property belonging to third parties, whichmay not be attainable on reasonable terms, or to cease using the intellectual property altogether. Moreover, any intellectual property claim, regardless of its merits, couldbe expensive and time-consuming to defend against and could divert the attention of management. As a result, claims based on allegations of infringement or otherviolations of intellectual property rights, regardless of outcome, could have a material adverse effect on our business, financial condition and results of operations.
We may be adversely affected by any disruption in our information technology systems.
Our operations are dependent upon our information technology systems, which encompass all of our major business functions. We rely upon such information technologysystems to manage and replenish inventory, to fill and ship customer orders on a timely basis, to coordinate our sales activities across all of our products and services, tocoordinate our administrative activities and to protect confidential information that we receive and maintain about our customers, employees and other third parties. Asubstantial disruption in our information technology systems for any prolonged time period (arising from, for example, system capacity limits from unexpected increasesin our volume of business, outages or delays in our service) could result in delays in receiving inventory and supplies or filling customer orders and adversely affect ourcustomer service and relationships. Such delays, problems or costs may have a material adverse effect on our business, financial condition and results of operations.
As our operations grow in both size and scope, we continuously need to improve and upgrade our systems and infrastructure while maintaining their reliability andintegrity. The expansion of our systems and infrastructure will require us to commit substantial financial, operational and technical resources before the volume of ourbusiness increases, with no assurance that the volume of business will increase. For example, we are currently introducing new point-of-sale systems, which we anticipatewill provide significant benefits, including our customers shopping
- 15 -

experience. In addition, we are in the process of implementing a new merchandising and supply chain platform, which we anticipate will improve our merchandisingcapabilities and our ability to position inventory across our nodes. The development and implementation of new systems and any other future upgrades to our systems andinformation technology may require significant costs and divert our management’s attention and other resources from our core business. There are also no assurances thatthese new systems and upgrades will provide us with the anticipated benefits and efficiencies. Many of our systems are proprietary, and as a result our options are limitedin seeking third-party help with the operation and upgrade of those systems. There can be no assurance that the time and resources our management will need to devote tooperations and upgrades, any delays due to the installation of any upgrade (and customer issues therewith), any resulting service outages, or the impact on the reliabilityof our data from any upgrade or any legacy system, will not have a material adverse effect on our business, financial condition or results of operations.
We have experienced data security incidents.
As previously disclosed, we experienced data security incidents during the fiscal years 2014 and 2015 (together, the “data security incidents”). The data security incidentsinvolved the unauthorized installation of malicious software (malware) on our information technology systems, including our point-of-sale systems that, may have placedat risk certain payment card data for some transactions. The costs that the Company has incurred in connection with the data security incidents include assessments frompayment card networks, professional advisory fees, legal costs and expenses relating to investigating and remediating the data security incidents. We may have alsosuffered reputational harm due to multiple data security incidents and may incur additional costs and expenses related to the data security incidents in the future. Asdetailed above, these costs may result from potential additional liabilities to payment card networks, governmental or third-party investigations, proceedings or litigation,legal and other fees necessary to defend against any potential liabilities or claims, and further investigatory and remediation costs. The potential liabilities or otherremedies against us related to the data security incidents may have a material adverse impact on our business, financial condition and operating results.
Unauthorized access to confidential information and data on our information technology systems and security and data breaches could materially adversely affectour business, financial condition and operating results.
As part of our operations, we receive and maintain information about our customers, employees and other third parties. We have physical, technical and proceduralsafeguards in place that are designed to protect information and protect against security and data breaches as well as fraudulent transactions and other activities. Despitethese safeguards and our other security processes and protections, we cannot be assured that all of our systems and processes are free from vulnerability to securitybreaches (through cyber-attacks, which are evolving and becoming increasingly sophisticated, physical breach or other means) or inadvertent data disclosure by thirdparties or us. A significant data security breach, including misappropriation of our customers’ or employees’ confidential information, could result in significant costs tous, which may include, among others, potential liabilities to payment card networks for reimbursements of credit card fraud and card reissuance costs, including fines andpenalties, potential liabilities from governmental or third-party investigations, proceedings or litigation, legal, forensic and consulting fees and expenses, costs anddiversion of management attention required for investigation and remediation actions, and the negative impact on our reputation and loss of confidence of our customers,suppliers and others, any of which could have a material adverse impact on our business, financial condition and operating results.
In response to the data security incidents, we have taken and are continuing to take actions to further strengthen the security of our information technology systems,including adopting payment terminals with end-to-end encryption technology in order to enhance the security of our credit card payment systems. Nevertheless, there canbe no assurance that our security upgrades will be effective, that we will not suffer a similar criminal attack in the future, that unauthorized parties will not gain access toconfidential information, or that any such incident will be discovered promptly. In particular, we understand that the techniques used by criminals to obtain unauthorizedaccess to sensitive data change frequently and often are not recognized until launched against a target; accordingly, we may be unable to anticipate these techniques orimplement adequate preventative measures. The failure to promptly detect, determine the extent of and appropriately respond to a significant data security breach couldhave a material adverse impact on our business, financial condition and operating results.
- 16 -
If we fail to attract and retain highly skilled management and other personnel, our business, financial condition and results of operations may be harmed.
Our success has depended, and will continue to depend, in large part on our ability to attract and retain senior executives who possess extensive knowledge, experienceand managerial skill applicable to our business. Significant leadership changes or executive management transitions involve inherent risk and any failure to ensure theeffective transfer of knowledge and a smooth transition could hinder our strategic planning, execution and future performance. In addition, from time to time, keyexecutive personnel leave our Company and we may not be successful in attracting, integrating and retaining the personnel required to grow and operate our businessprofitably. While we strive to mitigate the negative impact associated with the loss of a key executive employee, an unsuccessful transition or loss could significantlydisrupt our operations and could have a material adverse effect on our business, financial condition and results of operations.
We are also dependent on training, motivating and managing our store employees that interact with our customers on a daily basis. Competition for these types ofqualified employees is intense and the failure to attract, retain and properly train qualified and motivated employees could result in decreased customer satisfaction, lossof customers, and lower sales.
The occurrence of natural disasters or acts of violence or terrorism could adversely affect our operations and financial performance.
The occurrence of natural disasters or acts of violence or terrorism could result in physical damage to our properties, the temporary closure of stores or distributioncenters, the temporary lack of an adequate work force, the temporary or long-term disruption in the supply of products (or a substantial increase in the cost of thoseproducts) from domestic or foreign suppliers, the temporary disruption in the delivery of goods to our distribution centers (or a substantial increase in the cost of thosedeliveries), the temporary reduction in the availability of products in our stores, and/or the temporary reduction in visits to stores by customers. If one or more naturaldisasters or acts of violence or terrorism were to impact our business, we could, among other things, incur significantly higher costs and longer lead times associated withdistributing products. Furthermore, insurance costs associated with our business may rise significantly in the event of a large scale natural disaster or act of violence orterrorism.
Any significant interruption in the operations of our distribution facilities could disrupt our ability to deliver merchandise to our stores, full service customers or e-commerce customers in a timely manner, which could have a material adverse effect on our business, financial condition, profitability and cash flows.
We distribute products to our stores without supplementing such deliveries with direct-to-store arrangements from vendors or wholesalers. We are a retailer carryingbeauty products that change on a regular basis in response to beauty trends, which makes the success of our operations particularly vulnerable to disruptions in ourdistribution infrastructure. Any significant interruption in the operation of our supply chain infrastructure, such as disruptions in our information systems, disruptions inoperations due to fire or other catastrophic events, labor disagreements or shipping and transportation problems, could drastically reduce our ability to receive and processorders and provide products and services to our stores, full service customers or e-commerce customers, which could have a material adverse effect on our business,financial condition, profitability and cash flows.
We are a holding company with no operations of our own, and we depend on our subsidiaries for cash.
We are a holding company and do not have any material assets or operations other than ownership of equity interests of our subsidiaries. Our operations are conductedalmost entirely through our subsidiaries, and our ability to generate cash to meet our obligations or to pay dividends is highly dependent on the earnings of, and receipt offunds from, our subsidiaries through dividends or intercompany loans. The ability of our subsidiaries to generate sufficient cash flow from operations to allow us andthem to make scheduled payments on our obligations will depend on their future financial performance, which will be affected by a range of economic, competitive andbusiness factors, many of which are outside of our control. We cannot assure you that the cash flow and earnings of our operating subsidiaries will be adequate for oursubsidiaries to service their debt obligations. If our subsidiaries do not generate sufficient cash flow from operations to satisfy corporate obligations, we may have to:undertake alternative financing plans (such as refinancing), restructure debt, sell assets, reduce or delay capital investments, or seek to raise additional capital. We cannotassure you that any such alternative refinancing would be possible, that any assets could be sold, or, if sold, of the timing of the sales and the amount of proceeds realizedfrom those sales, that additional financing could be obtained on acceptable terms, if at all, or that additional financing would be
- 17 -

permitted under the terms of our various debt instruments then in effect. Our inability to generate sufficient cash flow to satisfy our obligations, or to refinance ourobligations on commercially reasonable terms, would have an adverse effect on our business, financial condition and results of operations.
Our previously announced share repurchase program could affect the price of our common stock and increase volatility and may be suspended or terminated at anytime, which may result in a decrease in the trading price of our common stock.
Repurchases pursuant to our share repurchase program could affect our stock price and increase its volatility. The existence of a share repurchase program could alsocause our stock price to be higher than it would be in the absence of such a program and could potentially reduce the market liquidity for our stock. There can be noassurance that any share repurchases will enhance stockholder value because the market price of our common stock may decline below the levels at which werepurchased shares of common stock. Although our share repurchase program is intended to enhance long-term stockholder value, short-term stock price fluctuationscould reduce the program’s effectiveness. Furthermore, the program does not obligate the Company to repurchase any dollar amount or number of shares of commonstock, and may be suspended or discontinued at any time and any suspension or discontinuation could cause the market price of our stock to decline.
A portion of our indebtedness is subject to floating interest rates.
Borrowings under our ABL facility and the variable portion of our term loan B are at variable rates of interest and expose us to interest rate risk. If interest rates were toincrease, our debt service obligations on the variable rate indebtedness referred to above would increase even if the principal amount borrowed remained the same, andour net income and cash flows will correspondingly decrease. We are currently party to, and in the future, we may enter into additional, derivative instruments, such asinterest rate caps, to reduce our exposure to changes in interest rates. However, we may not maintain derivative instruments with respect to all of our variable rateindebtedness, and any instruments we enter into may not fully mitigate our interest rate risk.
In addition, amounts drawn under our ABL facility and the variable portion of our term loan B may bear interest rates in relation to the London Interbank Offered Rate(“LIBOR”). In 2017, the United Kingdom’s Financial Conduct Authority, which regulates LIBOR, announced that it intends to phase out LIBOR by the end of 2021. It isunclear if LIBOR will cease to exist at that time or if new methods of calculating LIBOR will be established such that it continues to exist after 2021. The expected phaseout of LIBOR could cause market volatility or disruption and may adversely affect our access to the capital markets and cost of funding. Furthermore, while both theABL facility and the variable portion of our term loan B contain “fallback” provisions providing for alternative rate calculations in the event LIBOR is unavailable, these“fallback” provisions may not adequately address the actual changes to LIBOR or successor rates.
Currency exchange rate fluctuations could result in higher costs and decreased margins and earnings.
Many of our products are sold outside of the United States. As a result, we conduct transactions in various currencies, which increase our exposure to fluctuations inforeign currency exchange rates relative to the U.S. dollar. Our international revenues and expenses generally are derived from sales and operations in foreign currencies,and these revenues and expenses could be affected by currency fluctuations, including amounts recorded in foreign currencies and translated into U.S. dollars forconsolidated financial reporting. Currency exchange rate fluctuations could also disrupt the business of the independent manufacturers that produce our products bymaking their purchases of raw materials more expensive and more difficult to finance. Foreign currency fluctuations could have an adverse effect on our results ofoperations and financial condition.
We have substantial debt and may incur substantial additional debt, which could adversely affect our financial health, our ability to obtain financing in the futureand our ability to react to changes in our business.
As of September 30, 2019, certain of our subsidiaries, including Sally Holdings LLC, which we refer to as Sally Holdings, had an aggregate principal amount ofapproximately $1,610.1 million of outstanding debt, including capital lease obligations.
- 18 -

Our substantial debt could have significant consequences. For example, it could:
• make it more difficult for us to satisfy our obligations to our lenders, resulting in possible defaults on and acceleration of such indebtedness;
• limit our ability to obtain additional financing for working capital, capital expenditures, acquisitions, debt service requirements or general corporatepurposes;
• require us to dedicate a substantial portion of our cash flow from operations to the payment of principal and interest on our indebtedness, thereby reducingthe availability of such cash flows to fund working capital, capital expenditures, share repurchases and other general corporate purposes;
• restrict the ability of our subsidiaries to pay dividends or otherwise transfer assets to us, which could limit our ability to conduct repurchases of our ownequity securities or pay dividends to our stockholders, thereby limiting our ability to enhance stockholder value through such transactions;
• increase our vulnerability to general adverse economic and industry conditions, including interest rate fluctuations (because a portion of our borrowings areat variable rates of interest), including borrowings under our $500 million asset-based senior secured loan facility, which we refer to as the “ABL facility”and a portion of our term loan B;
• place us at a competitive disadvantage compared to our competitors with proportionately less debt or comparable debt at more favorable interest rates andthat, as a result, may be better positioned to withstand economic downturns;
• limit our ability to refinance indebtedness or cause the associated costs of such refinancing to increase; and
• limit our flexibility to adjust to changing market conditions and ability to withstand competitive pressures, or prevent us from carrying out capital spendingthat is necessary or important to our growth strategy and efforts to improve operating margins or our business.
Any of the foregoing impacts of our substantial indebtedness could have a material adverse effect on our business, financial condition and results of operations.
In addition, we and our subsidiaries may incur substantial additional indebtedness in the future. As of September 30, 2019, our ABL facility provided us commitments foradditional borrowings of up to approximately $482.0 million, subject to borrowing base limitations. If new debt is added to our current debt levels, the related risks thatwe face would increase, and we may not be able to meet all our debt obligations.
The agreements and instruments governing our debt contain restrictions and limitations that could significantly impact our ability to operate our business.
The agreement governing our ABL facility contains covenants that, among other things, restrict Sally Holdings and its subsidiaries’ ability to:
• change their line of business;
• engage in certain mergers, consolidations and transfers of all or substantially all of their assets;
• make certain dividends, share repurchases and other distributions;
• make acquisitions of all of the business or assets of, or stock representing beneficial ownership of, any person;
• dispose of certain assets;
• make voluntary prepayments on the senior notes or make amendments to the terms thereof;
• prepay certain other debt or amend specific debt agreements;
• change the fiscal year of Sally Holdings or its direct parent; and
• create or incur negative pledges.
- 19 -

In addition, if Sally Holdings fails to maintain a specified minimum level of borrowing capacity under the ABL facility, it will then be obligated to maintain a specifiedfixed-charge coverage ratio. Our ability to comply with these covenants in future periods will depend on our ongoing financial and operating performance, which in turnwill be subject to economic conditions and to financial, market and competitive factors, many of which are beyond our control. Our ability to comply with thesecovenants in future periods will also depend substantially on the pricing of our products, our success at implementing cost reduction initiatives and our ability tosuccessfully implement our overall business strategy.
The indentures governing the senior notes and our institutional term loan also contain restrictive covenants that, among other things, limit our ability and the ability ofSally Holdings and its restricted subsidiaries to:
• dispose of assets;
• incur additional indebtedness (including guarantees of additional indebtedness);
• pay dividends, repurchase stock or make other distributions;
• prepay subordinated debt;
• create liens on assets;
• make investments (including joint ventures);
• engage in mergers, consolidations or sales of all or substantially all of Sally Holdings’ assets;
• engage in certain transactions with affiliates; and
• permit restrictions on Sally Holdings’ subsidiaries’ ability to pay dividends.
The restrictions in the indentures governing our senior notes and the covenants in our institutional term loan, and the terms of our ABL facility and the institutional termloan may prevent us from taking actions that we believe would be in the best interest of our business and may make it difficult for us to successfully execute our businessstrategy or effectively compete with companies that are not similarly restricted. We may also incur future debt obligations that might subject us to additional restrictivecovenants that could affect our financial and operational flexibility. We cannot assure you that our subsidiaries, which are borrowers under these agreements, will begranted waivers or amendments to these agreements if they are unable to comply with these agreements, or that we will be able to refinance our debt on terms acceptableto us, or at all.
Our ability to comply with the covenants and restrictions contained in the senior notes and the institutional term loan, and the terms of our ABL facility may be affectedby economic, financial and industry conditions beyond our control. The breach of any of these covenants and restrictions could result in a default under either the ABLfacility, the institutional term loan or the indentures that would permit the applicable lenders or senior note holders, as the case may be, to declare all amounts outstandingthereunder to be due and payable, together with accrued and unpaid interest. If we are unable to repay debt, lenders having secured obligations, such as the lenders underthe ABL facility, could proceed against the collateral securing the debt. In any such case, our subsidiaries may be unable to borrow under the ABL facility and may not beable to repay the amounts due under the senior notes and the institutional term loan. This could have serious consequences to our financial condition and results ofoperations and could cause us to become bankrupt or insolvent.
ITEM 1B. UNRESOLVED STAFF COMMENTS
Not applicable.
- 20 -

ITEM 2. PROPERTIES
Substantially all of our stores and a number of our warehouse and remote office locations are leased while our corporate headquarters in Denton, Texas and threewarehouses/distribution centers are owned. The average store lease is for a term of five years with customary renewal options. The following table provides the number ofstores in the U.S. and certain international locations, as of September 30, 2019:
SBS BSG
Location Company-Operated Franchise
Company-Operated Franchise
United States (excluding Puerto Rico) 2,753 — 1,097 146 Puerto Rico 38 — 2 — International:
United Kingdom 249 4 — — Mexico 248 — — — Canada 139 — 121 — France 76 1 — — Belgium 48 2 — — Chile 37 — — — Netherlands 30 — — — Spain 26 — — —
Other 38 6 — — Total International 891 13 121 —
Total Store Count 3,682 13 1,220 146
The following table provides locations for our significant offices and warehouses and our corporate headquarters, as of September 30, 2019:
Location Type of Facility Sq. Feet BusinessSegment
Company-Owned Properties: Denton, Texas Corporate Headquarters 200,000 N/AReno, Nevada Warehouse 253,000 SBSColumbus, Ohio Warehouse 246,000 SBSJacksonville, Florida Warehouse 237,000 SBS
Leased Properties: Fort Worth, Texas (a) Warehouse 494,000 SBS & BSGGreenville, Ohio Office, Warehouse 246,000 BSGFresno, California Warehouse 200,000 BSGBlackburn, Lancashire, England Warehouse 195,000 SBSSpartanburg, South Carolina Warehouse 190,000 BSGPottsville, Pennsylvania Office, Warehouse 140,000 BSGClackamas, Oregon Warehouse 104,000 BSGGhent, Belgium Office, Warehouse 94,000 SBSRonse, Belgium Office, Warehouse 91,000 SBSGuadalupe, Nuevo Leon, Mexico Warehouse 78,000 SBSCalgary, Alberta, Canada Warehouse 62,000 BSGMississauga, Ontario, Canada Warehouse 60,000 BSG
(a) As of September 30, 2019, we have entered into a lease agreement, but this facility has not opened.
- 21 -

ITEM 3. LEGAL PROCEEDINGS
We are involved, from time to time, in various claims and lawsuits incidental to the conduct of our business in the ordinary course. We carry insurance coverage in suchamounts in excess of our self-insured retention as we believe to be reasonable under the circumstances and that may or may not cover any or all of our liabilities inrespect of these matters. We do not believe that the ultimate resolution of these matters will have a material adverse impact on our consolidated financial position, cashflows or results of operations.
We are subject to a number of U.S., federal, state and local laws and regulations, as well as the laws and regulations applicable in each foreign country or jurisdiction inwhich we do business. These laws and regulations govern, among other things, the composition, packaging, labeling and safety of the products we sell, the methods weuse to sell these products and the methods we use to import these products. We believe that we are in material compliance with such laws and regulations, although noassurance can be provided that this will remain true going forward.
ITEM 4. MINE SAFETY DISCLOSURES
Not applicable
- 22 -

PART II
ITEM 5. MARKET FOR REGISTRANT’S COMMON EQUITY, RELATED STOCKHOLDER MATTERS AND ISSUER PURCHASES OF EQUITYSECURITIES
Market for the Registrant’s Common Equity
Market Information
Our common stock is listed on the New York Stock Exchange under the symbol “SBH.”
Holders
As of November 15, 2019, there were 648 stockholders of record of our common stock.
Dividends
We have not declared or paid dividends at any time during the two fiscal years prior to the date of this Annual Report. We currently anticipate that we will retain futureearnings to support investments in our business, to repay outstanding debt or to return capital to shareholders through share repurchases. Any determination to paydividends will be made at the discretion of our Board of Directors and will depend on our financial condition, results of operations, contractual restrictions, cashrequirements and other factors that our Board of Directors deem relevant.
We depend on our subsidiaries for cash that we would use to pay dividends. However, the terms of our debt agreements and instruments significantly restrict the ability ofour subsidiaries to make certain restricted payments to us and our ability to pay dividends. Additionally, we and our subsidiaries may incur substantial additionalindebtedness in the future that may severely restrict or prohibit our subsidiaries from making distributions, paying dividends or making loans to us.
- 23 -

Performance Graph
The following performance graph and related information shall not be deemed “filed” with the Securities and Exchange Commission, nor shall such information beincorporated by reference into any future filing under the Securities Act of 1933 or Securities Exchange Act of 1934, each as amended, except to the extent that wespecifically incorporate it by reference into such filing.
The following graph illustrates the five-year comparative total return among Sally Beauty Holdings, Inc., the S&P 500 Index (“S&P 500”) and the Dow Jones U.S.Specialty Retailers Index (“DJ US Specialty Retailers”) assuming that $100 was invested on September 30, 2014 and that dividends, if any, were reinvested. The DJ USSpecialty Retailers is a non-managed index and provides a comprehensive view of issuers, including our common stock, that are primarily in the U.S. retail sector.
Fiscal year ended September 30, 2014 September 30, 2015 September 30, 2016 September 30, 2017 September 30, 2018 September 30, 2019 Sally Beauty Holdings, Inc. $ 100.00 $ 86.77 $ 93.83 $ 71.54 $ 67.19 $ 54.40 S&P 500 100.00 99.39 114.72 136.07 160.44 167.27 DJ US Specialty Retailers 100.00 123.60 122.17 137.89 206.20 195.30
Purchases of Equity Securities by the Issuer and Affiliated Purchasers
The following table provides information about the Company’s repurchases of shares of its common stock during the three months ended September 30, 2019:
Fiscal Period
Total Numberof Shares
Purchased (1)
AveragePrice Paidper Share
Total Number of SharesPurchased as
Part of PubliclyAnnounced Plans or
Programs (1)(2)
Approximate DollarValue of Shares that
May Yet Be PurchasedUnder the Plans or
Programs July 1 through July 31, 2019 — $ — — $ 834,098,375 August 1 through August 31, 2019 3,562,426 13.07 3,562,426 787,477,748 September 1 through September 30, 2019 — — — 787,477,748
Total this quarter 3,562,426 $ 13.07 3,562,426 $ 787,477,748
(1) The table above does not include 36,926 shares of the Company’s common stock surrendered by grantees during the three months ended September 30, 2019 to satisfy taxwithholding obligations due upon the vesting of equity-based awards under the Company’s share-based compensation plans.
(2) On August 31, 2017, we announced that our Board of Directors had approved a share repurchase program authorizing us to repurchase up to $1.0 billion of our commonstock over an approximate four-year period expiring on September 30, 2021 (the “2017 Share Repurchase Program”).
- 24 -

ITEM 6. SELECTED FINANCIAL DATA
The following table presents selected financial data of Sally Beauty for each of the years in the five-year period ended September 30, 2019 (dollars and shares inthousands, except per share data):
Fiscal Year Ended September 30, 2019 2018 2017 2016 2015
Results of operations: Net sales $ 3,876,411 $ 3,932,565 $ 3,938,317 $ 3,952,618 $ 3,834,343 Cost of goods sold 1,965,869 1,988,152 1,973,422 1,988,678 1,936,492 Gross profit 1,910,542 1,944,413 1,964,895 1,963,940 1,897,851
Selling, general and administrative expenses(a) 1,452,751 1,484,209 1,463,619 1,465,643 1,402,525 Restructuring (682) 33,615 22,679 — — Operating earnings 458,473 426,589 478,597 498,297 495,326
Interest expense(b) 96,309 98,162 132,899 144,237 116,842 Earnings before provision for income taxes 362,164 328,427 345,698 354,060 378,484
Provision for income taxes 90,541 70,380 130,622 131,118 143,397 Net earnings $ 271,623 $ 258,047 $ 215,076 $ 222,942 $ 235,087
Earnings per share Basic $ 2.27 $ 2.09 $ 1.56 $ 1.51 $ 1.50 Diluted $ 2.26 $ 2.08 $ 1.56 $ 1.50 $ 1.49
Weighted average shares, basic 119,636 123,190 137,533 147,179 156,353 Weighted average shares, diluted 120,283 123,832 138,176 148,803 158,226 Operating data:
Number of stores, including franchises (at end of period): SBS 3,695 3,761 3,782 3,781 3,673 BSG 1,366 1,395 1,368 1,338 1,294 Consolidated 5,061 5,156 5,150 5,119 4,967
Distributor sales consultants (at end of period) 748 820 829 914 938 Same store sales growth (decline)(c): SBS 0.4% (1.5)% (1.6)% 1.7% 1.7%BSG 0.2% (1.5)% 1.3% 5.5% 5.7%Consolidated 0.3% (1.5)% (0.7)% 2.9% 2.9%
Financial condition (at end of period): Cash and cash equivalents $ 71,495 $ 77,295 $ 63,759 $ 86,622 $ 140,038 Inventory 952,907 944,338 930,855 907,337 885,214 Property, plant and equipment, net 319,628 308,357 313,717 319,558 270,847 Total assets 2,098,446 2,097,414 2,099,007 2,095,038 2,063,392 Long-term debt, excluding current maturities 1,594,542 1,768,808 1,771,853 1,783,294 1,786,839 Stockholders’ deficit(d) (60,323) (268,556) (363,616) (276,166) (297,821)
(a) In the fiscal years 2019, 2018, 2017, 2016 and 2015, selling, general and administrative expenses include depreciation and amortization of $107.7 million, $108.8 million, $112.3million, $99.7 million and $89.4 million, respectively.
(b) In the fiscal years 2017 and 2016, interest expense reflects a loss on extinguishment of debt of $28.0 million and $33.3 million, respectively, related to our refinancing of certainoutstanding senior notes in the ordinary course of our business.
(c) For the purpose of calculating our same store sales metrics, we compare the current period sales for stores open for 14 months or longer as of the last day of a month with thesales for these stores for the comparable period in the prior fiscal year. Our same store sales are calculated in constant U.S. dollars and include e-commerce sales from onlycertain digital platforms, but do not generally include the sales from stores relocated until 14 months after the relocation. The sales from stores acquired are excluded from oursame store sales calculation until 14 months after the acquisition.
(d) Stockholders’ deficit for the fiscal years 2019, 2018, 2017, 2016 and 2015 reflects the repurchase and retirement of 3.6 million shares, 10.0 million shares, 16.1 million shares,7.8 million shares and 8.1 million shares of our common stock at a cost of $46.6 million, $165.9 million, $346.1 million, $207.3 million and $227.6 million, respectively, undershare repurchase programs approved by the Company’s Board of Directors.
- 25 -

ITEM 7. MANAGEMENT’S DISCUSSION AND ANALYSIS OF FINANCIAL CONDITION AND RESULTS OF OPERATIONS
The following section discusses management’s view of the financial condition as of September 30, 2019 and 2018, and the results of operations and cash flows for thethree fiscal years in the period ended September 30, 2019, of Sally Beauty. This section should be read in conjunction with the audited consolidated financial statementsof Sally Beauty and the related notes included elsewhere in this Annual Report. This Management’s Discussion and Analysis of Financial Condition and Results ofOperations section may contain forward-looking statements. See “Cautionary Notice Regarding Forward-Looking Statements” and “Risk Factors” for a discussion of theuncertainties, risks and assumptions associated with these forward-looking statements that could cause results to differ materially from those reflected in such forward-looking statements.
Highlights of the Fiscal Year Ended September 30, 2019:
• Consolidated net sales for the fiscal year ended September 30, 2019, decreased $56.2 million, or 1.4%, to $3,876.4 million, compared to the priorfiscal year. Consolidated net sales for the fiscal year ended September 30, 2019, include a negative impact from changes in foreign currency exchangerates of $31.9 million, or 0.8% of consolidated net sales;
• Consolidated same store sales increased 0.3% and consolidated e-commerce sales increased by 29.4% compared to the prior fiscal year;
• Consolidated gross profit for the fiscal year ended September 30, 2019, decreased by $33.9 million, or 1.7%, to $1,910.5 million, compared to theprior fiscal year. Gross margin decreased 10 basis points to 49.3% for the fiscal year ended September 30, 2019, compared to the prior fiscal year;
• Consolidated operating earnings for the fiscal year ended September 30, 2019, increased $31.9 million, or 7.5%, to $458.5 million, compared to theprior fiscal year. Operating margin increased 100 basis points to 11.8% for the fiscal year ended September 30, 2019, compared to the prior fiscalyear;
• Consolidated net earnings increased $13.6 million, or 5.3%, to $271.6 million, compared to the prior fiscal year;
• Diluted earnings per share for the fiscal year ended September 30, 2019, were $2.26 compared to $2.08 for the prior fiscal year;
• Cash provided by operations was $320.4 million for the fiscal year ended September 30, 2019, compared to $372.7 million for the prior fiscal year;
• During the year, we strategically paid down an additional $115.0 million aggregate principle of our term loan B and repurchased approximately $64.8million aggregate principal amount of our 2023 and 2025 senior notes;
• We repurchased and retired approximately 3.6 million shares of our common stock under the 2017 Share Repurchase Program at an aggregate cost of$46.6 million; and
• In September 2019, we entered into a multi-year agreement with Alliance Data’s card services business to launch a private label credit card for bothSBS and BSG to benefit our retail and professional customers.
Business Strategy Update
We continue to make solid progress against our transformation as we play to win by focusing on hair color and hair care, improve our retail fundamentals, advance ourdigital commerce capabilities and drive cost out of the business. As part of this effort, we made progress on our supply chain modernization effort, reduced our debtlevels, and rolled out new e-commerce tools such as the Sally Beauty Supply app.
During the year, we began rolling out a new point-of-sale system in both SBS and BSG nationwide, which will allow our store associates to better serve our customers.
In February 2019, we announced our supply chain modernization plans to gain efficiencies and cost savings. During the fiscal year 2019, we have closed selectfulfillment centers, including in the U.S. and within Europe, and identified a location in Texas and signed a lease agreement for a new approximately 500,000 square footautomated
- 26 -
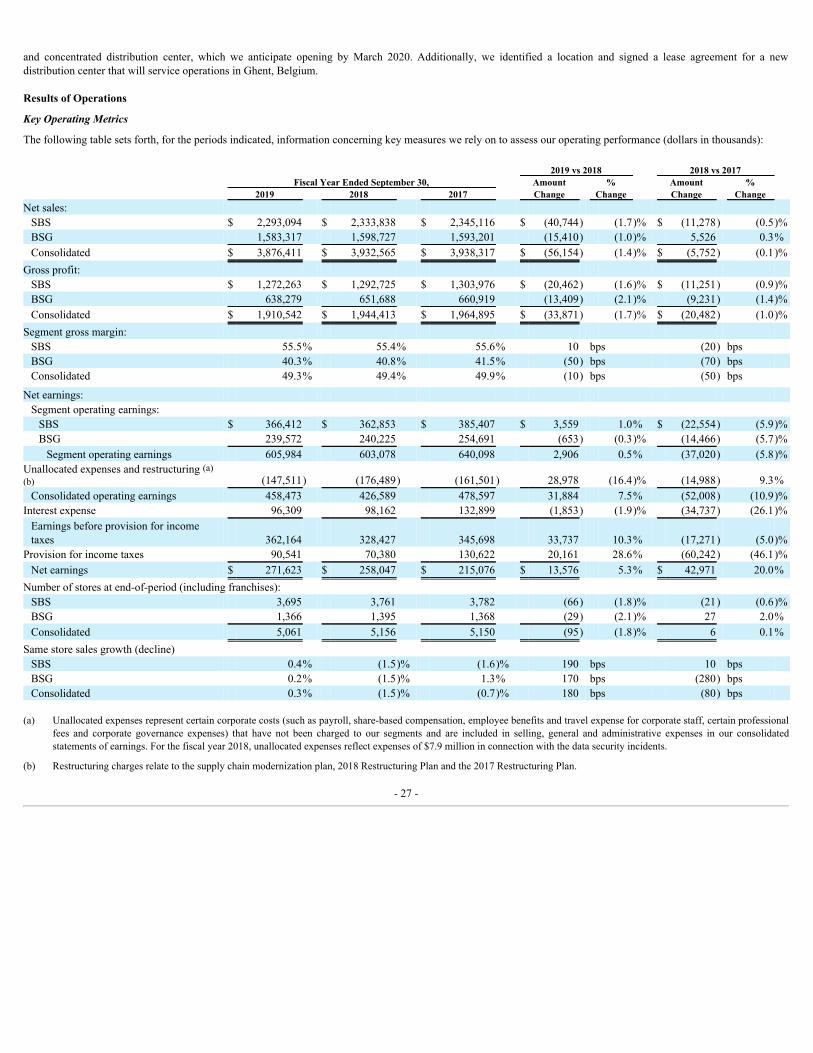
and concentrated distribution center, which we anticipate opening by March 2020. Additionally, we identified a location and signed a lease agreement for a newdistribution center that will service operations in Ghent, Belgium.
Results of Operations
Key Operating Metrics
The following table sets forth, for the periods indicated, information concerning key measures we rely on to assess our operating performance (dollars in thousands):
2019 vs 2018 2018 vs 2017 Fiscal Year Ended September 30, Amount % Amount % 2019 2018 2017 Change Change Change Change
Net sales: SBS $ 2,293,094 $ 2,333,838 $ 2,345,116 $ (40,744) (1.7)% $ (11,278) (0.5)%BSG 1,583,317 1,598,727 1,593,201 (15,410) (1.0)% 5,526 0.3%Consolidated $ 3,876,411 $ 3,932,565 $ 3,938,317 $ (56,154) (1.4)% $ (5,752) (0.1)%
Gross profit: SBS $ 1,272,263 $ 1,292,725 $ 1,303,976 $ (20,462) (1.6)% $ (11,251) (0.9)%BSG 638,279 651,688 660,919 (13,409) (2.1)% (9,231) (1.4)%Consolidated $ 1,910,542 $ 1,944,413 $ 1,964,895 $ (33,871) (1.7)% $ (20,482) (1.0)%
Segment gross margin: SBS 55.5% 55.4% 55.6% 10 bps (20) bps BSG 40.3% 40.8% 41.5% (50) bps (70) bps Consolidated 49.3% 49.4% 49.9% (10) bps (50) bps
Net earnings: Segment operating earnings: SBS $ 366,412 $ 362,853 $ 385,407 $ 3,559 1.0% $ (22,554) (5.9)%BSG 239,572 240,225 254,691 (653) (0.3)% (14,466) (5.7)%Segment operating earnings 605,984 603,078 640,098 2,906 0.5% (37,020) (5.8)%
Unallocated expenses and restructuring (a)(b) (147,511) (176,489) (161,501) 28,978 (16.4)% (14,988) 9.3%Consolidated operating earnings 458,473 426,589 478,597 31,884 7.5% (52,008) (10.9)%
Interest expense 96,309 98,162 132,899 (1,853) (1.9)% (34,737) (26.1)%Earnings before provision for incometaxes 362,164 328,427 345,698 33,737 10.3% (17,271) (5.0)%
Provision for income taxes 90,541 70,380 130,622 20,161 28.6% (60,242) (46.1)%Net earnings $ 271,623 $ 258,047 $ 215,076 $ 13,576 5.3% $ 42,971 20.0%
Number of stores at end-of-period (including franchises): SBS 3,695 3,761 3,782 (66) (1.8)% (21) (0.6)%BSG 1,366 1,395 1,368 (29) (2.1)% 27 2.0%Consolidated 5,061 5,156 5,150 (95) (1.8)% 6 0.1%
Same store sales growth (decline) SBS 0.4% (1.5)% (1.6)% 190 bps 10 bps BSG 0.2% (1.5)% 1.3% 170 bps (280) bps Consolidated 0.3% (1.5)% (0.7)% 180 bps (80) bps
(a) Unallocated expenses represent certain corporate costs (such as payroll, share-based compensation, employee benefits and travel expense for corporate staff, certain professional
fees and corporate governance expenses) that have not been charged to our segments and are included in selling, general and administrative expenses in our consolidatedstatements of earnings. For the fiscal year 2018, unallocated expenses reflect expenses of $7.9 million in connection with the data security incidents.
(b) Restructuring charges relate to the supply chain modernization plan, 2018 Restructuring Plan and the 2017 Restructuring Plan.
- 27 -

The Fiscal Year Ended September 30, 2019 compared to the Fiscal Year Ended September 30, 2018
Net Sales
SBS. The decrease in net sales for SBS was primarily driven by the following (in thousands):
Foreign currency exchange $ (27,395)Stores outside same store sales (18,040)Same store sales 4,578 Other (a) 113 Total $ (40,744)
(a) Other consists of non-store sales, which include catalog and internet sales of our Sinelco Group subsidiaries.
SBS experienced lower unit volume, including lower customer traffic and the impact of fewer company-operated stores, partially offset by a positive impact fromincrease in average unit prices, resulting from price increases and a promotional efficiency effort (which reduced promotions that provided ‘free’ units, such as Buy One,Get One offers).
BSG. The decrease in net sales for BSG was driven by the following (in thousands):
Distributor sales consultants $ (12,092)Foreign currency exchange (4,534)Same store sales 1,722 Other (a) (506)Total $ (15,410)
(a) Other consists of stores outside same store sales and sales to our franchisees.
BSG experienced a decrease in unit volume, including from the impact of fewer company-operated stores, partially offset by an increase in average unit prices (resultingprimarily from the introduction of certain third-party brands with higher average unit prices in the preceding 12 months).
Gross Profit
SBS. SBS’s gross profit decreased as a result of lower sales, partially offset by a higher gross margin. The higher gross margin reflects improved gross margins in ourU.S. and Canadian operations, from price increases and promotional efficiency efforts, partially offset by weaker gross margins in our European operations.
BSG. BSG’s gross profit decreased as a result of lower sales and a lower gross margin. The decrease in the gross margin was primarily a result of challenges related tothe ongoing merchandising transformation.
Selling, General and Administrative Expenses
Consolidated. Consolidated selling, general and administrative expenses decreased primarily as a result of lower compensation and compensation-related expenses,lower advertising expenses, no expenses related to the data security incidents and the positive impact from changes in foreign currency exchange rates. This decrease waspartially offset by higher facility expenses and expenses related to our information technology systems.
SBS. SBS’s selling, general and administrative expenses decreased $24.0 million, or 2.6% for the fiscal year ended September 30, 2019. This decrease was primarily as aresult of the impact of the 2018 Restructuring Plan, our recently implemented field structure realignment and store labor hour optimization initiatives (net of labor rateinflation), the positive impact from changes in the foreign currency exchange rate of approximately $11.3 million and lower advertising expense of $6.7 million. Thisdecrease was partially offset by higher facility costs of $2.3 million and the impact of the reduction of an estimated casualty loss related to hurricanes of $2.4 millionduring fiscal year 2018.
BSG. BSG’s selling, general and administrative expenses decreased $12.8 million, or 3.1% for the fiscal year ended September 30, 2019. This decrease was primarily asa result of as a result of the impact of the 2018 Restructuring
- 28 -

Plan, lower sales commissions of $3.5 million, lower advertising expenses of $2.9 million and a positive impact from changes in foreign currency exchange rate ofapproximately $1.4 million.
Unallocated. Unallocated selling, general and administrative expenses increased $5.3 million, or 3.7%, for the fiscal year ended September 30, 2019. This increase isprimarily a result of higher expenses related to our information technology systems and no comparable positive adjustments related to our actuarially determinedinsurance liabilities in the current year compared to $6.9 million in the prior year. These increases were partially offset by no expenses related to the data securityincidents compared to $7.9 million in the prior year.
Restructuring
For the fiscal year ended September 30, 2019, we recognized a $8.4 million gain resulting from the sale of our secondary headquarters and fulfillment center in Denton,Texas, and our Marinette, Wisconsin, fulfillment center in connection with the supply chain modernization plan, partially offset by charges of $7.7 million in connectionwith our supply chain modernization plan and the 2018 Restructuring Plan. For the fiscal year ended September 30, 2018, we incurred restructuring charges ofapproximately $33.6 million in connection with the 2018 Restructuring Plan. See Note 18 of the Notes to Consolidated Financial Statements included in Item 8 of thisAnnual Report for more information about our restructuring plans.
Interest Expense
Interest expense decreased as a result of fewer borrowings under the ABL facility during the current fiscal year and lower outstanding principal balances on our seniornotes and term loan B. This decrease was partially offset by a higher interest rate on our term loan B variable tranche.
Provision for Income Taxes
For the fiscal year ended September 30, 2019 and 2018, our effective tax rate was 25.0% and 21.4%, respectively. The increase in the effective tax rate was due primarilyto the impact of U.S. Tax Reform in the prior year, partially offset by a decrease in our federal statutory tax rate this year to 21.0% compared to 24.5% in the prior year.See Note 14 of the Notes to Consolidated Financial Statements included in Item 8 of this Annual Report for more information about the impact of the U.S. Tax Reform onour consolidated financial statements.
The Fiscal Year Ended September 30, 2018 compared to the Fiscal Year Ended September 30, 2017
Net Sales
SBS. The decrease in net sales for SBS was primarily driven by a decrease in same store sales of approximately $23.7 million and lower net sales from new company-operated stores of approximately $17.9 million, partially offset by the positive impact from changes in foreign currency exchange rates of approximately $30.1 million.
SBS experienced lower unit volume, including lower customer traffic, partially offset by a positive impact from an increase in average unit prices, resulting primarilyfrom select price increases in certain geographical areas of the U.S. and a change in product mix (to higher-priced products) resulting from shifts in customer preferences.
BSG. The increase in net sales for BSG was driven by the impact of the Chalut acquisition, net of the impact of Peerless sales in the prior year now included in samestore sales, of approximately $10.1 million, the positive impact from changes in foreign currency exchange rates of approximately $3.0 million and higher net sales fromother sales channels of approximately $7.2 million, partially offset by decreases in sales by our DSCs of approximately $11.1 million and same store sales ofapproximately $3.8 million. Net sales from other sales channels include sales from new company-operated stores, sales to our franchisees and sales by our DSCs.
BSG experienced an increase in average unit prices (resulting primarily from the introduction of certain third-party brands with higher average unit prices in thepreceding 12 months), partially offset by a decrease in unit volume (notwithstanding the impact of incremental sales from 28 company-operated stores opened or acquiredduring the last 12 months). In addition, we were impacted by vendor supply chain issues that negatively affected BSG’s net sales by approximately $13 million.
- 29 -

Gross Profit
SBS. SBS’s gross profit decreased as a result of lower sales and a lower gross margin. This decrease reflects a change in geographic sales mix, as a result of lower-marginnon-U.S. sales making up a greater portion of total segment sales, and higher coupon redemption, compared to the prior fiscal year.
BSG. BSG’s gross profit decreased as a result of a lower gross margin, partially offset by higher sales. BSG’s gross margin decrease was driven by opportunisticpurchases that were not repeated from the prior year and lower vendor allowances.
Selling, General and Administrative Expenses
Consolidated. Consolidated selling, general and administrative expenses increased primarily as a result of the negative impact from changes in foreign currencyexchange rates, the impact from the Chalut acquisition, higher expenses related to the data security incidents and higher facility expenses. These increases were partiallyoffset by a reduction of estimated casualty loss and no comparable casualty loss this fiscal year, positive impact from gift card breakage, positive adjustments toactuarially determined insurance liabilities and cost reduction initiatives, related to our restructuring plans. Consolidated selling, general and administrative expenses, as apercentage of net sales, increased 50 basis points to 37.7% for the fiscal year ended September 30, 2018.
SBS. SBS’s selling, general and administrative expenses increased primarily as a result of the negative impact from changes in the foreign currency exchange rate ofapproximately $13.2 million, higher facility expense of $5.0 million and higher advertising expense of $2.0 million. These increases were partially offset by the impact ofthe reduction of prior year’s estimated casualty loss, in connection with natural disasters that occurred in the fourth quarter of our fiscal year 2017, and no comparablecasualty losses this fiscal year, in the aggregate, of $6.5 million and by positive impact from gift card breakage of $2.1 million in the current fiscal year.
BSG. BSG’s selling, general and administrative expenses increased primarily as a result of the incremental operating expenses associated with Chalut of $8.6 million andhigher facility expenses of $3.3 million. These increases were partially offset by lower commission expense of $3.0 million, advertising expense of $1.5 million andintangible asset amortization expense of $1.3 million, resulting from the impact of intangible assets that became fully amortized in the preceding 12 months.
Unallocated. Unallocated selling, general and administrative expenses increased $4.1 million, or 2.9%, for the fiscal year ended September 30, 2018. This increaseincludes expenses related to the previously disclosed data security incidents of $7.9 million and higher professional fees of $1.7 million. See Note 10 of the Notes toConsolidated Financial Statements included in Item 8 of this Annual Report for more information about the data security incidents. This increase was partially offset bylower compensation and compensation-related expenses of $4.3 million primarily due to the results of the 2018 Restructuring Plan. In addition, for our actuariallydetermined insurance liabilities, we recorded net positive adjustments of $6.9 million in fiscal year 2018 as a result of a decrease in our estimated future payments,compared to positive adjustments of $5.7 million in fiscal year 2017.
Restructuring Charges
Restructuring charges increased $10.9 million for the fiscal year ended September 30, 2018. During the fiscal year ended September 30, 2018, we incurred restructuringcharges of approximately $33.6 million in connection with the 2018 Restructuring Plan, including severance and related expenses of approximately $15.6 million,consulting expenses of $10.9 million and other costs of $7.1 million. During the fiscal year ended September 30, 2017, we incurred restructuring charges ofapproximately $22.7 million in connection with the 2017 Restructuring Plan, including severance and related expenses of $12.1 million, facility closure expenses of $6.7million and other expenses of $3.9 million. See Note 18 of the Notes to Consolidated Financial Statements included in Item 8 of this Annual Report for more informationabout our restructuring plans.
Interest Expense
Interest expense decreased as a result of a loss on extinguishment of debt of $28.0 million in the prior fiscal year, compared to $0.9 million in the current fiscal year.These losses were the result of our redemption of certain senior notes in July 2017 with the proceeds from the term loan B with lower interest rates in the prior fiscal yearand from the repricing of the variable-rate tranche of the term loan B in the current fiscal year. The lower interest rate on the
- 30 -

term loan B reduced interest expense by $8.8 million. The decrease was offset in part by incremental interest expense of $1.3 million in connection with borrowings underthe ABL facility.
Provision for Income Taxes
The provision for income taxes was $70.4 million and $130.6 million, resulting in an effective tax rate of 21.4% and 37.8%, for the fiscal year ended September 30, 2018and 2017, respectively. The decrease in the effective tax rate was due primarily to the impact of the U.S. Tax Reform. More specifically, we recognized a provisionalincome tax benefit of $37.7 million in connection with the revaluation of our deferred income tax assets and liabilities, including a benefit related to the adoption ofincome tax method changes of $2.7 million, and a provisional income tax charge of $11.7 million for federal and state income taxes applicable to accumulated butundistributed earnings of our foreign operations. See Note 14 of the Notes to Consolidated Financial Statements included in Item 8 of this Annual Report for moreinformation about the impact of the U.S. Tax Reform on our consolidated financial statements.
Liquidity and Capital Resources
We are highly leveraged and a substantial portion of our liquidity needs will arise from debt service on our outstanding indebtedness and from funding the costs ofoperations, working capital, capital expenditures and opportunistic share repurchases. Working capital (current assets less current liabilities) increased $43.6 million to$707.5 million at September 30, 2019, compared to $663.9 million at September 30, 2018, resulting primarily from the reduction in accounts payable and accruedliabilities and the increase in vendor receivables included in accounts receivable, other. The ratio of current assets to current liabilities was 2.55 to 1.00 at September 30,2019, compared to 2.35 to 1.00 at September 30, 2018.
At September 30, 2019, cash and cash equivalents were $71.5 million. Based upon the current level of operations and anticipated growth, we anticipate that existing cashbalances (excluding certain amounts permanently invested in connection with foreign operations), funds expected to be generated by operations and funds available underthe ABL facility will be sufficient to meet our working capital requirements, potential acquisitions, finance anticipated capital expenditures, including informationtechnology upgrades and store remodels, debt repayment and opportunistic share repurchases over the next 12 months. For the foreseeable future, we will prioritizeneeded investments in our business that we believe will deliver value for shareholders, and will consider measured debt repayment within our ratings guidance as well asopportunistic share repurchases.
We utilize our ABL facility for the issuance of letters of credit, for certain working capital and liquidity needs and to manage normal fluctuations in our operational cashflow. In that regard, we may from time to time draw funds under the ABL facility for general corporate purposes including funding of capital expenditures, acquisitions,interest payments due on our indebtedness, paying down other debt and share repurchases. During the fiscal year ended September 30, 2019, the weighted averageinterest rate on our borrowings under the ABL facility was 4.64%. The amounts drawn are generally paid down with cash provided by our operating activities. As ofSeptember 30, 2019, 2018, Sally Holdings had $482.0 million available for borrowings under the ABL facility, subject to borrowing base limitations, as reduced by $18.0million in outstanding letters of credit.
Share Repurchase Programs
During the fiscal years ended September 30, 2019, 2018 and 2017, we repurchased and subsequently retired approximately 3.6 million shares, 10.0 million shares and16.1 million shares, respectively, of our common stock under the 2017 Share Repurchase Program or the 2014 Share Repurchase Program at a cost of $46.6 million,$165.9 million and $346.1 million, respectively. We funded these share repurchases with cash from operations and borrowings under the ABL facility. As of September30, 2019, we had approximately $787.5 million of additional share repurchase authorization remaining under the 2017 Share Repurchase Program.
Historical Cash Flows
For the fiscal years 2019, 2018 and 2017, our primary sources of cash have been funds provided by operating activities and, when necessary, borrowings under our ABLfacility, as appropriate. The primary non-operating uses of cash during the past three years were for share repurchases, debt service and capital expenditures.
- 31 -

The following table shows our sources and uses of cash for the periods presented (in thousands):
Fiscal Year Ended September 30, 2019 2018 Change 2018 2017 Change
Net cash provided by operating activities $ 320,415 $ 372,661 $ (52,246) $ 372,661 $ 343,286 $ 29,375 Net cash used by investing activities (95,867) (95,313) (554) (95,313) (89,625) (5,688)Net cash used by financing activities (229,308) (263,282) 33,974 (263,282) (277,303) 14,021 Effect of foreign currency exchange rate changes on cash and cash equivalents (1,040) (530) (510) (530) 779 (1,309)Net increase (decrease) in cash and cash equivalents $ (5,800) $ 13,536 $ (19,336) $ 13,536 $ (22,863) $ 36,399
Net Cash Provided by Operating Activities
Net cash provided by operating activities decreased for the fiscal year ended September 30, 2019, compared to the fiscal year ended September 30, 2018, primarily due toa focused reduction of accounts payable and the timing of vendor receivables.
Net cash provided by operating activities increased for the fiscal year ended September 30, 2018, compared to the fiscal year ended September 30, 2017, primarily due tofavorable cash impact of improved net earnings and accrued liabilities, partially offset by the unfavorable impact by deferred taxes and merchandise purchases.
Net Cash Used by Investing Activities
Net cash used by investing activities increased slightly for the fiscal year ended September 30, 2019, compared to the fiscal year ended September 30, 2018, due to anincrease in capital expenditures primarily from investments in our information technology systems, partially offset by proceeds received from the sale our secondaryheadquarters and fulfillment center in Denton, Texas and our fulfillment center in Marinette, Wisconsin, and as a result of not having any significant acquisitions in thecurrent year.
Net cash used by investing activities increased for the fiscal year ended September 30, 2018, compared to the fiscal year ended September 30, 2017, primarily due to theacquisition of Chalut.
Net Cash Used by Financing Activities
Net cash used by financing activities decreased for the fiscal year ended September 30, 2019, compared to the fiscal year ended September 30, 2018, driven by fewershares repurchased, partially offset by additional debt reduction.
Net cash used by financing activities decreased for the fiscal year ended September 30, 2018, compared to the fiscal year ended September 30, 2017, primarily due to adecrease in share repurchases of $180.2 million. This decrease was partially offset by lower net debt proceeds, primarily from repayments on the ABL facility and termloan B.
Long-Term Debt
At September 30, 2019, we have $1,609.3 million in outstanding principal under a term loan B and senior notes, not including capital leases, unamortized debt issuancecosts or debt discounts, in the aggregate, of $16.4 million. There were no outstanding balances under the ABL facility at September 30, 2019. See Note 11 of the Notes toConsolidated Financial Statements in Item 8 contained in this Annual Report for additional information about our debt.
We are currently in compliance with the agreements and instruments governing our debt, including our financial covenants.
Capital Requirements
During the fiscal year ended September 30, 2019, we had total capital expenditures of approximately $118.7 million, including amounts incurred but not paid ofapproximately $26.2 million, primarily in connection with information technology projects and store remodels and maintenance.
- 32 -

Contractual Obligations
The following table summarizes our contractual obligations at September 30, 2019 (in thousands):
Payments Due by Period
Less than1 year 1-3 years 3-5 years More than
5 years Total Long-term debt obligations, including interest(a) $ 82,148 $ 162,566 $ 1,066,628 $ 733,019 $ 2,044,361 Obligations under operating leases(b) 174,578 232,818 95,747 40,545 543,688 Purchase obligations(c) 13,553 23,412 — — 36,965 Other long-term obligations(d)(e) 3,857 5,963 3,502 5,016 18,338 Total $ 274,136 $ 424,759 $ 1,165,877 $ 778,580 $ 2,643,352
(a) Long-term debt obligations include obligations under capital leases and future interest payments on our debt outstanding as of September 30, 2019. The amounts shown
above do not include unamortized discount or deferred debt issuance costs reflected in our consolidated balance sheets since those amounts do not represent contractualobligations.
(b) The amounts reported for operating leases do not include common area maintenance (CAM), property taxes or other executory costs. The amounts shown above do notinclude immaterial contingent liabilities for operating leases for which we are liable in the event of default by a franchisee.
(c) Purchase obligations reflect legally binding non-cancellable agreements that are entered into by us to purchase goods or services, that specify minimum quantities to bepurchased and with fixed or variable price provisions. Amounts shown do not reflect open purchase orders, mainly for merchandise, to be fulfilled within one year, whichare generally cancellable or contracts that tend to be reoccurring in nature and similar in amount year over year.
(d) Other long-term obligations, including current portion, principally represent obligations under insurance and self-insurance programs. These obligations are included inaccrued liabilities and other liabilities, as appropriate, in our consolidated balance sheets.
(e) The table above does not include an estimated $2.0 million of unrecognized tax benefits due to uncertainty regarding the realization and timing of the related future cashflows, if any.
The information contained in the table above with regards to our long-term debt obligations is based on the current terms of such debt obligations and does not reflect anyassumptions about our ability or intent to refinance any of our debt either on or before their maturity. In the event that we refinance some or all of debt either on or beforetheir maturity, actual payments for some of the periods shown may differ materially from the amounts reported herein. In addition, other future events, including potentialincreases in interest rates, could cause actual payments to differ materially from these amounts.
Off-Balance Sheet Financing Arrangements
At September 30, 2019, we did not have any off-balance sheet financing arrangements other than obligations under operating leases and letters of credit, as discussedabove.
Inflation
We believe inflation did not have a material effect on our results of operations during each of the three fiscal years in the period ended September 30, 2019. However,during the past few years, in the U.S., we have experienced an increase in labor and real estate costs (including store rent and other occupancy expenses). Employeecompensation and real estate expenses represent our two most significant operating expense categories. A material increase in labor and real estate costs in the future,particularly for an extended period of time, could have a material adverse effect on our results of operations.
Critical Accounting Estimates
The preparation of our consolidated financial statements requires us to make estimates and assumptions that affect the reported amounts of assets and liabilities at eachbalance sheet date, reported amount of revenues and expenses for each reporting period presented, and related disclosures of contingent liabilities. Actual results maydiffer from these estimates. We believe these estimates and assumptions are reasonable. We consider accounting policies to be
- 33 -

critical when they require us to make assumptions about matters that are highly uncertain at the time the accounting estimate is made and when different estimates that wereasonably could have used have a material effect on the presentation of our consolidated financial condition, changes in consolidated financial condition or consolidatedresults of operations.
Our critical accounting estimates relate to the valuation of inventory, vendor rebates and concessions, retention of risk, income taxes, assessment of long-lived assets andintangible assets for impairment and share-based payments.
Valuation of Inventory
Inventory is stated at the lower of cost, determined using the first-in, first-out (“FIFO”) method, or net realizable value. In assessing the net realizable value of inventory,we consider several key factors including estimates of the future demand for our products, historical turn-over rates, the age and sales history of the inventory, andhistoric as well as anticipated changes in SKUs. When necessary, we adjust the carrying value of inventory for estimated inventory shrinkage and damage. We estimateinventory shrinkage between physical counts and product damage based upon our historical experience. Actual results differing from these estimates could significantlyaffect our inventory and cost of goods sold. Inventory shrinkage and damage expense, in the aggregate, averaged less than 1.0% of consolidated net sales in fiscal years2019, 2018 and 2017. A 10% increase or decrease in our estimate of inventory shrinkage and damage at September 30, 2019, would impact net earnings by approximately$2.2 million.
Vendor Rebates and Concessions
We deem cash consideration received from a supplier to be a reduction of the cost of goods sold unless it is in exchange for an asset or service or a reimbursement of aspecific, incremental, identifiable cost incurred by us in selling the vendor’s products. The majority of cash consideration we receive is considered to be a reduction ofinventory and a subsequent reduction in cost of goods sold as the related products are sold. We consider the facts and circumstances of the various contractual agreementswith vendors in order to determine the appropriate classification of amounts received in our consolidated statements of earnings. We record cash consideration expectedto be received from vendors in accounts receivables, other at the amount we believe will be collected. These receivables could be significantly affected if the actualamounts subsequently collected differ from our expectations. A 10% increase or decrease in these receivables at September 30, 2019, would impact net earnings byapproximately $3.9 million.
Insurance
We retain a substantial portion of the risk related to employee health (primarily in the U.S.), workers’ compensation, general and product liability. However, we maintainstop-loss coverage to limit the exposure related to certain insurance risks. We base our health insurance liability estimate on trends in claim payment history, historicaltrends in claims incurred but not yet reported, and other components such as expected increases in medical costs, projected premium costs and the number of planparticipants. Additionally, we base our estimates for workers’ compensation, general and product liability on an actuarial analysis performed by an independent third-party actuary. We review our insurance liability on a regular basis and adjust our accruals accordingly.
Changes in facts and circumstances may lead to a change in the estimated liability due to revisions of the estimated ultimate costs that affect our liability insurancecoverage. Our liabilities could be significantly affected if actual results differ from our expectations or prior actuarial analyses. A 10% increase or decrease in ourinsurance liabilities at September 30, 2019, would impact net earnings by approximately $1.5 million.
The changes in our insurance liabilities were as follows (in thousands):
Fiscal Year Ended September 30, 2019 2018
Balance at beginning of period $ 19,956 $ 24,743 Self-insurance expense 63,963 66,581 Payments, net of employee contributions (63,625) (71,368)Balance at end of period $ 20,294 $ 19,956
- 34 -

Income Taxes
We record income tax provisions in our consolidated financial statements based on an estimate of current income tax liabilities. The development of these provisionsrequires judgments about tax positions, potential outcomes and timing. If we prevail in tax matters for which provisions have been established or are required to settlematters in excess of established provisions, our effective tax rate for a particular period could be significantly affected.
Additionally, deferred income taxes are recognized for the future tax consequences attributable to differences between our financial statement carrying amounts of assetsand liabilities and their respective tax bases. Deferred tax assets and liabilities are measured using enacted tax rates expected to apply to taxable income in the years inwhich temporary differences are estimated to be recovered or settled. We believe that it is more-likely-than-not that our results of operations in the future will generatesufficient taxable income to realize our deferred tax assets, net of the valuation allowance currently recorded. We have recorded a valuation allowance to account foruncertainties regarding the recoverability of certain deferred tax assets, primarily foreign loss carryforwards. In the future, if we determine that certain deferred tax assetswill not be realizable, the related adjustments could significantly affect our effective tax rate at that time. An estimated tax benefit related to an uncertain tax position isrecorded in our consolidated financial statements only after determining a more-likely-than-not probability that the uncertain tax position will withstand challenge, if any,from applicable taxing authorities.
Assessment of Long-Lived Assets and Intangible Assets for Impairment
Long-lived assets, such as property and equipment, including store equipment, and purchased intangible assets subject to amortization are reviewed for impairmentwhenever events or changes in circumstances indicate that the carrying amount of an asset may not be fully recoverable. The recoverability of long-lived assets andintangible assets subject to amortization is assessed by comparing the net carrying amount of each asset to its total estimated undiscounted future cash flows expected tobe generated by the asset. If the carrying amount of an asset exceeds the sum of its undiscounted future cash flows, an impairment charge is recognized by the amount bywhich the carrying amount of the asset exceeds the estimated fair value of the asset.
Goodwill represents the excess of the purchase price over the fair value of the net assets acquired in a business combination. Goodwill and intangible assets withindefinite lives are not amortized; rather, they are reviewed for impairment at least annually, and whenever events or changes in circumstances indicate it is more-likely-than-not that the value of the asset may be impaired. For the purpose of reviewing goodwill for impairment, we aggregate components of our operating segments withsimilar economic characteristics into a reporting unit.
When assessing goodwill and intangible assets with indefinite lives for potential impairment, we compare the carrying amount of the asset to its fair value. In addition, weconsider whether the value of an asset has been impaired by evaluating if various factors (including current operating results, anticipated future results and cash flows,and relevant market and economic conditions) indicate a possible impairment.
Based on our assessments and after considering potential triggering events, we recognized impairment losses of $4.4 million in the fiscal year ended September 30, 2017,in connection with our long-lived assets and intangible assets. No material impairment losses were recognized in fiscal years 2019 or 2018.
Share-Based Payments
The amount of share-based compensation expense related to stock option awards is determined based on the fair value of each stock option award on the date of grant.The fair value of each stock option is estimated using the Black-Scholes option pricing model. The amount of expense recognized in connection with stock option awardsis significantly affected by our estimates.
The amount of share-based compensation expense related to performance-based restricted stock awards is determined based on the fair value of each award on the date ofgrant, which is based on the closing market price of our common stock on the date of grant. In addition, we record periodic expense (which is estimated quarterly) inconnection with performance-based awards based on our estimate of the number of awards actually expected to vest. This requires that we estimate our futureperformance over the performance period (generally three years) associated with each award. Actual performance could differ from these estimates and couldsignificantly affect the amount and timing of recognition of our share-based compensation expense related to performance-based awards.
- 35 -

If actual results are not consistent with our estimate or assumptions, we may be exposed to changes in share-based compensation expense that could be material. A 10%change in our share-based compensation expense for the year ended September 30, 2019, would affect net earnings by approximately $0.7 million.
Recent Accounting Pronouncements
See Note 3 of the Notes to Consolidated Financial Statements in Item 8 — “Financial Statements and Supplementary Data” contained in this Annual Report forinformation about recent accounting pronouncements.
ITEM 7A. QUANTITATIVE AND QUALITATIVE DISCLOSURES ABOUT MARKET RISK
As a multinational corporation, we are subject to certain market risks including risks resulting from our exposure to foreign currency fluctuations, changes in interest ratesand government actions. We consider a variety of practices to manage these market risks, including, when deemed appropriate, the use of derivative financial instruments.Currently, we do not purchase or hold any derivative instruments for speculative or trading purposes, and are restricted from engaging in, by our debt and creditagreements.
Foreign currency exchange rate risk
We are exposed to potential gains or losses from foreign currency fluctuations affecting net investments in subsidiaries (including intercompany balances not permanentlyinvested) and earnings denominated in foreign currencies, as well as exposure resulting from the purchase of merchandise by certain of our subsidiaries in a currencyother than their functional currency and from the sale of products and services among the parent company and subsidiaries with a functional currency different from theparent or among subsidiaries with different functional currencies. Our primary exposures are to changes in exchange rates for the U.S. dollar versus the Euro, the Britishpound sterling, the Canadian dollar, and the Mexican peso. In addition, we currently have exposure to the currencies of certain countries located in South America andfrom time to time we may have exposure to changes in the exchange rate for the British pound sterling versus the Euro in connection with the sale of products andservices among certain of our European subsidiaries. For each of the fiscal years 2019, 2018 and 2017, less than 20% of our consolidated net sales were made incurrencies other than the U.S. dollar.
A 10% increase or decrease in the exchange rates for the U.S. dollar versus the foreign currencies to which we have exposure, would have impacted our consolidated netsales by approximately 1.8% in the fiscal year 2019, and would have impacted our consolidated net assets by approximately 2.4% at September 30, 2019.
As more fully discussed in Note 12 in the Notes to Consolidated Financial Statements included in Item 8 of this Annual Report, we use, from time to time, foreignexchange forward contracts to mitigate exposure to changes in foreign currency exchange rates.
Interest rate risk
We are sensitive to interest rate fluctuations as a result of borrowings under our ABL facility and the variable-rate tranche of our term loan B. At September 30, 2019,there were no borrowings outstanding under the ABL facility and the term loan B had $424.0 million outstanding principal balance under the variable-rate tranche. Basedon our September 30, 2019 floating interest rate debt, a 0.1 percentage point interest rate increase would impact interest expense by $0.4 million.
As more fully discussed in Note 12 in the Notes to Consolidated Financial Statements included in Item 8 of this Annual Report, we use, from time to time, derivativeinstruments in order to manage risk relating to cash flows and interest rate exposure.
Credit risk
We are exposed to credit risk in connection with certain assets, primarily accounts receivable. We provide credit to customers in the ordinary course of business andperform ongoing credit evaluations. We believe that our exposure of credit risk with respect to trade receivables is largely mitigated by our broad customer base and thatour allowance for doubtful accounts is sufficient to cover customer credit risks at September 30, 2019.
- 36 -

Our derivative instruments expose us to credit risk in the event of default by a counterparty. We believe that such exposure is mitigated by the substantial resources andstrong creditworthiness of the counterparties to our derivative instruments at September 30, 2019. In the event that a counterparty defaults in its obligation under ourderivative instruments, we could incur substantial financial losses. However, at the present time, no such losses are deemed probable.
ITEM 8. FINANCIAL STATEMENTS AND SUPPLEMENTARY DATA
See “Index to Financial Statements” which is located on page 47 of this Annual Report.
ITEM 9. CHANGES IN AND DISAGREEMENTS WITH ACCOUNTANTS ON ACCOUNTING AND FINANCIAL DISCLOSURE
None.
ITEM 9A. CONTROLS AND PROCEDURES
Background. Attached as exhibits to this Annual Report on Form 10-K are certifications of our Chief Executive Officer (“CEO”) and our Chief Financial Officer(“CFO”), which are required in accordance with Rule 13a-14 of the Exchange Act. This “Controls and Procedures” section includes information concerning the controlsand controls evaluation referred to in the certifications. Part II, Item 8 — Financial Statements and Supplementary Data of this Annual Report on Form 10-K sets forth theattestation report of KPMG LLP, our independent registered public accounting firm, regarding its audit of our internal control over financial reporting. This sectionshould be read in conjunction with the certifications and the KPMG attestation report for a more complete understanding of the topics presented.
Controls Evaluation and Related CEO and CFO Certifications. Our management, with the participation of our CEO and CFO, conducted an evaluation of theeffectiveness of the design and operation of our disclosure controls and procedures as of the end of the period covered by this Annual Report. The controls evaluation wasconducted by our Disclosure Committee, comprised of senior representatives from our finance, accounting, internal audit, and legal departments under the supervision ofour CEO and CFO.
Certifications of our CEO and our CFO, which are required in accordance with Rule 13a-14 of the Exchange Act, are attached as exhibits to this Annual Report. This“Controls and Procedures” section includes the information concerning the controls evaluation referred to in the certifications, and it should be read in conjunction withthe certifications for a more complete understanding of the topics presented.
Limitations on the Effectiveness of Controls. We do not expect that our disclosure controls and procedures will prevent all errors and all fraud. A system of controls andprocedures, no matter how well conceived and operated, can provide only reasonable, not absolute, assurance that the objectives of the system are met. Because of thelimitations in all such systems, no evaluation can provide absolute assurance that all control issues and instances of fraud, if any, within the Company have been detected.Furthermore, the design of any system of controls and procedures is based in part upon certain assumptions about the likelihood of future events, and there can be noassurance that any design will succeed in achieving its stated goals under all potential future conditions, regardless of how unlikely. Because of these inherent limitationsin a cost-effective system of controls and procedures, misstatements or omissions due to error or fraud may occur and not be detected.
Scope of the Controls Evaluation. The evaluation of our disclosure controls and procedures included a review of their objectives and design, our implementation of thecontrols and procedures and the effect of the controls and procedures on the information generated for use in this Annual Report. In the course of the evaluation, wesought to identify whether we had any data errors, control problems or acts of fraud and to confirm that appropriate corrective action, including process improvements,was being undertaken if needed. This type of evaluation is performed on a quarterly basis so that conclusions concerning the effectiveness of our disclosure controls andprocedures can be reported in our Quarterly Reports on Form 10-Q and our Annual Reports on Form 10-K. Many of the components of our disclosure controls andprocedures are also evaluated by our internal audit department, by our legal department and by personnel in our finance organization. The overall goals of these variousevaluation activities are to monitor our disclosure controls and procedures on an ongoing basis, and to maintain them as dynamic systems that change as conditionswarrant.
- 37 -

Conclusions regarding Disclosure Controls. Based on the required evaluation of our disclosure controls and procedures, our CEO and CFO have concluded that, as ofSeptember 30, 2019, we maintain disclosure controls and procedures that are effective in providing reasonable assurance that information required to be disclosed by usin the reports that we file or submit under the Exchange Act is recorded, processed, summarized and reported within the time periods specified in the SEC’s rules andforms, and that such information is accumulated and communicated to our management, including our CEO and CFO, as appropriate to allow timely decisions regardingrequired disclosure.
Management’s Annual Report on Internal Control over Financial Reporting.
Management of the Company, including the CEO and CFO, is responsible for establishing and maintaining adequate internal control over financial reporting as defined inRule 13a-15(f) under the Exchange Act. Our internal control system was designed to provide reasonable assurance to management and our Board of Directors regardingthe reliability of financial reporting and the preparation of financial statements for external purposes in accordance with generally accepted accounting principles.
All internal control systems, no matter how well designed, have inherent limitations. A system of internal controls may become inadequate over time because of changesin conditions or deterioration in the degree of compliance with the policies or procedures. Therefore, even those systems determined to be effective can provide onlyreasonable assurance with respect to financial statement preparation and presentation.
Management assessed the effectiveness of our internal control over financial reporting as of September 30, 2019 using the criteria set forth by the Committee ofSponsoring Organizations of the Treadway Commission (“COSO”) in Internal Control-Integrated Framework (2013). Based on this assessment, management hasconcluded that, as of September 30, 2019, our internal control over financial reporting was effective to provide reasonable assurance regarding the reliability of financialreporting and the preparation of financial statements for external purposes in accordance with generally accepted accounting principles based on such criteria.
Report of Independent Registered Public Accounting Firm. Please refer to KPMG’s Report of Independent Registered Public Accounting Firm on Internal Control overFinancial Reporting on page F-1 of the financial statements, which begin on page 47 of this Annual Report.
Changes in Internal Control over Financial Reporting. During our last fiscal quarter there have been no changes in our internal control over financial reporting that havematerially affected, or are reasonably likely to materially affect, our internal control over financial reporting.
ITEM 9B. OTHER INFORMATION
None.
- 38 -

PART III
ITEM 10. DIRECTORS, EXECUTIVE OFFICERS AND CORPORATE GOVERNANCE
The Board of Directors has adopted: (i) Corporate Governance Guidelines and a (ii) Code of Business Conduct and Ethics that apply to directors, officers and employees.Copies of these documents and the committee charters are available on our website at www.sallybeautyholdings.com and are available in print to any person, withoutcharge, upon written request to our Vice President of Investor Relations. We intend to disclose on our website at www.sallybeautyholdings.com any substantiveamendment to, or waiver from, a provision of the Code of Business Conduct and Ethics that applies to these individuals or persons performing similar functions.
Delinquent Section 16(a) Reports
Section 16(a) of the Exchange Act requires our directors and executive officers, and certain persons who own more than ten percent of a registered class of our equitysecurities, to file with the SEC initial reports of ownership and reports of changes in ownership of common stock and other security interests of Sally Beauty Holdings,Inc.
To our knowledge, based solely on a review of SEC EDGAR filings and written representations that no other reports were required during the fiscal year endedSeptember 30, 2019, we believe that all of our directors and officers complied with all Section 16(a) filing requirements during fiscal year 2019, except: Mark Spinks whoinadvertently failed to file on a timely basis one Form 4 with respect to the disposition of 11,538 shares of our common stock on November 13, 2018, and the followingpersons, each of whom inadvertently failed to file one Form 4 with respect to the receipt of shares of our common stock on September 30, 2018: Marshall Eisenberg(7,175 shares); Linda Heasley (7,175 shares); John Miller (7,175 shares); Kelly Mooney (717 shares); Denise Paulonis (2,901 shares); and Edward Rabin (5,381 shares).A remedial report has been filed with respect to each such exception.
The additional information required by Item 10 of this Annual Report on Form 10-K is incorporated herein by reference from our Proxy Statement related to the 2020Annual Meeting of Stockholders under the headings “Proposal 1 – Election of Directors,” “Executive Officers,” “Corporate Governance, the Board, and Its Committees”and “Report of the Audit Committee.”
ITEM 11. EXECUTIVE COMPENSATION
The information required by Item 11 of this Annual Report on Form 10-K is incorporated herein by reference from our Proxy Statement related to the 2020 AnnualMeeting of Stockholders under the headings “Directors’ Compensation and Benefits,” “Narrative Discussion of Director Compensation Table,” “CompensationDiscussion and Analysis,” “Compensation Committee Report,” “Executive Compensation” and “Compensation Committee Interlocks and Insider Participation.”
- 39 -

ITEM 12. SECURITY OWNERSHIP OF CERTAIN BENEFICIAL OWNERS AND MANAGEMENT AND RELATED STOCKHOLDER MATTERS
The information required by Item 12 of this Annual Report on Form 10-K is incorporated herein by reference from our Proxy Statement related to the 2020 AnnualMeeting of Stockholders under the heading “Beneficial Ownership of Company’s Stock.”
EQUITY COMPENSATION PLAN INFORMATIONThe following table gives information as of September 30, 2019, about our common stock that may be issued under all of our existing equity compensation plans:
Plan Category
Number of securities to beissued upon exercise of
outstanding options, warrantsand rights (1)
(a)
Weighted average exercise priceof outstanding options, warrants
and rights (2)(b)
Number of securities remainingavailable for future issuanceunder equity compensationplans (excluding securitiesreflected in column (a)) (3)
(c) Equity compensation plans approved by security holders 5,899,482 $ 22.08 7,794,919 Equity compensation plans not approved by security holders N/A N/A N/A
Total 5,899,482 $ 22.08 7,794,919
(1) Includes options issued and available for exercise and shares available for issuance in connection with past awards under the Sally Beauty Holdings, Inc. 2019 Omnibus
Incentive Plan (the “2019 Plan”) and predecessor share-based compensation plans. The Company currently grants awards only under the 2019 Plan.
(2) Calculation of weighted-average exercise price of outstanding awards includes stock options, but does not include shares of restricted stock or restricted stock units thatconvert to shares of common stock for no consideration.
(3) Represents shares that are available for issuance pursuant to the 2019 Plan, all of which are available as full value awards.
ITEM 13. CERTAIN RELATIONSHIPS AND RELATED TRANSACTIONS, AND DIRECTOR INDEPENDENCE
The information required by Item 13 of this Annual Report on Form 10-K is incorporated herein by reference from our Proxy Statement related to the 2020 AnnualMeeting of Stockholders under the headings “Corporate Governance, the Board, and Its Committees,” “Compensation Committee Interlocks and Insider Participation”and “Certain Relationships and Related Party Transactions.”
ITEM 14. PRINCIPAL ACCOUNTING FEES AND SERVICES
The information required by Item 14 of this Annual Report on Form 10-K is incorporated herein by reference from our Proxy Statement related to the 2020 AnnualMeeting of Stockholders under the heading “Proposal 3 – Ratification of Selection of Auditors.”
- 40 -

PART IV
ITEM 15. EXHIBITS, FINANCIAL STATEMENT SCHEDULES
Documents filed as part of this Annual Report:
(a) List of Financial Statements and Financial Statement Schedules
See “Index to Financial Statements” which is located on page 47 of this Annual Report.
(b) Exhibits
The following exhibits are filed as part of this Annual Report or are incorporated herein by reference:
Exhibit No. Description
3.1 Third Restated Certificate of Incorporation of Sally Beauty Holdings, Inc., dated January 30, 2014, which is incorporated herein by reference fromExhibit 3.3 to the Company’s Current Report on Form 8-K filed on January 30, 2014
3.2 Amended and Restated Bylaws of Sally Beauty Holdings, Inc., dated April 26, 2017, which is incorporated herein by reference from Exhibit 3.1 to theCompany’s Current Report on Form 8-K filed on April 28, 2017
4.1
Amended and Restated Credit Agreement dated July 6, 2017 among the Borrowers, the Guarantors, the Lenders party thereto, the AdministrativeAgent, the Collateral Agent, the Syndication Agent and the Documentation Agent (as such terms are defined therein), which is incorporated herein byreference from Exhibit 4.2 to the Company’s Current Report on Form 8-K filed on July 6, 2017 †
4.2
Amended and Restated Security Agreement by Sally Holdings LLC, Beauty Systems Group LLC, Sally Beauty Supply LLC, as the domesticborrowers and the other domestic borrowers and domestic guarantors party hereto from time to time and Bank of America, N.A. as collateral agentdated as of July 26, 2013, which is incorporated herein by reference from Exhibit 4.4 to the Company’s Annual Report on Form 10-K filed onNovember 14, 2013 †
4.3
Amended and Restated General Security Agreement by Beauty Systems Group (Canada), Inc., as the Canadian borrower and Bank of America, N.A.,(acting through its Canada branch), as Canadian agent dated as of July 26, 2013, which is incorporated herein by reference from Exhibit 4.5 to theCompany’s Annual Report on Form 10-K filed on November 14, 2013 †
4.4
Joinder to Loan Documents, dated as of December 20, 2011, by and among Sally Holdings LLC, Beauty Systems Group LLC, Sally Beauty SupplyLLC, Beauty Systems Group (Canada), Inc., SBH Finance B.V., the Guarantors named therein, Sally Beauty Holdings, Inc., Sally Investment HoldingsLLC and Bank of America, N.A., as administrative agent and as collateral agent, which is incorporated herein by reference from Exhibit 4.10 to theCompany’s Quarterly Report on Form 10-Q filed on February 2, 2012 †
4.5
Joinder to Loan Documents, dated as of May 28, 2015, by and among Sally Holdings LLC, Beauty Systems Group LLC, Sally Beauty Supply LLC,Beauty Systems Group (Canada), Inc., SBH Finance B.V., the Guarantors named therein, Sally Beauty Military Supply LLC, Loxa Beauty LLC andBank of America, N.A., as administrative agent and as collateral agent, which is incorporated herein by reference from Exhibit 4.1 to the Company’sQuarterly Report on Form 10-Q filed on August 6, 2015 †
4.6 Indenture, dated as of May 18, 2012, by and among Sally Holdings LLC, Sally Capital Inc. and Wells Fargo Bank, National Association, which isincorporated herein by reference from Exhibit 4.1 to the Company’s Current Report on Form 8-K filed on May 18, 2012
4.7
Second Supplemental Indenture, dated as of October 29, 2013, by and among Sally Holdings LLC, Sally Capital Inc., the guarantors listed therein andWells Fargo Bank, National Association (including the form of Note attached as an exhibit thereto), which is incorporated herein by reference fromExhibit 4.2 to the Company’s Current Report on Form 8-K filed on October 29, 2013
- 41 -

Exhibit No. Description
4.8
Third Supplemental Indenture, dated as of May 28, 2015, by and among Loxa Beauty LLC , Sally Beauty Military Supply LLC, Sally Holdings LLC,Sally Capital Inc., each existing Parent Guarantor and Subsidiary Guarantor listed therein and Wells Fargo Bank, National Association, which isincorporated herein by reference from Exhibit 4.2 to the Company’s Quarterly Report on Form 10-Q filed on August 6, 2015
4.9
Third Supplemental Indenture, dated as of May 28, 2015, by and among Loxa Beauty LLC , Sally Beauty Military Supply LLC, Sally Holdings LLC,Sally Capital Inc., each existing Parent Guarantor and Subsidiary Guarantor listed therein and Wells Fargo Bank, National Association, which isincorporated herein by reference from Exhibit 4.3 to the Company’s Quarterly Report on Form 10-Q filed on August 6, 2015
4.10
Third Supplemental Indenture, dated as of December 3, 2015, by and among Sally Holdings LLC, Sally Capital Inc., the guarantors listed therein andWells Fargo Bank, National Association (including the form of Note attached as an exhibit thereto), which is incorporated herein by reference fromExhibit 4.2 to the Company’s Current Report on Form 8-K filed on December 3, 2015
4.11
Credit Agreement dated July 6, 2017 among the Borrowers, the Parent Guarantors, the Administrative Agent, the Syndication Agent, theDocumentation Agent, and the Lenders party thereto (as such terms are defined therein), which is incorporated herein by reference from Exhibit 4.1 tothe Company’s Current Report on Form 8-K filed on July 6, 2017 †
4.12
Amendment No. 1 dated March 27, 2018 to Credit Agreement dated July 6, 2017 among the Borrowers, the Parent Guarantors, the AdministrativeAgent, the Syndication Agent, the Documentation Agent, and the Lenders party thereto (as such terms are defined therein), which is incorporatedherein by reference from Exhibit 10.2 to the Company’s Quarterly Report on Form 10-Q filed on May 3, 2018
10.1
Tax Allocation Agreement, dated as of June 19, 2006, among Alberto-Culver Company, New Aristotle Holdings, Inc., New Sally Holdings, Inc. andSally Holdings, Inc., which is incorporated herein by reference from Exhibit 10.1 to Amendment No. 3 to the Company’s Registration Statement onForm S-4 (File No. 333-136259) filed on October 10, 2006
10.2
First Amendment to the Tax Allocation Agreement, dated as of October 3, 2006, among Alberto-Culver Company, New Aristotle Holdings, Inc., NewSally Holdings, Inc. and Sally Holdings, Inc., which is incorporated herein by reference from Exhibit 10.2 to Amendment No. 3 to the Company’sRegistration Statement on Form S-4 (File No. 333-136259) filed on October 10, 2006
10.3
Second Amendment to the Tax Allocation Agreement, dated as of October 26, 2006, among Alberto-Culver Company, New Aristotle Holdings, Inc.,New Sally Holdings, Inc. and Sally Holdings, Inc., which is incorporated herein by reference from Exhibit 10.01 to the Company’s Current Report onForm 8-K filed on October 30, 2006
10.4 Sally Beauty Holdings, Inc. 2007 Omnibus Incentive Plan, which is incorporated herein by reference from Exhibit 4.4 to the Company’s RegistrationStatement on Form S-8 filed on May 3, 2007
10.5 2007 Form of Restricted Stock Unit Agreement for Independent Directors pursuant to the Sally Beauty Holdings, Inc. 2007 Omnibus Incentive Plan,which is incorporated herein by reference from Exhibit 10.3 to the Company’s Current Report on Form 8-K filed on April 27, 2007
10.6 2009 Form of Restricted Stock Unit Agreement for Independent Directors pursuant to the Sally Beauty Holdings, Inc. 2007 Omnibus Incentive Plan,which is incorporated herein by reference from Exhibit 10.24 to the Company’s Annual Report on Form 10-K filed on November 20, 2008
10.7 Tax Sharing Agreement, dated as of November 16, 2006, made and entered into by and among Sally Beauty Holdings, Inc., Sally Investment HoldingsLLC and Sally Holdings LLC, which is incorporated herein by reference from Exhibit 10.14 of the Quarterly Report on Form 10-Q of Sally HoldingsLLC and Sally Capital Inc. filed on August 29, 2007
- 42 -

Exhibit No. Description
10.8 2010 Form of Restricted Stock Unit Agreement for Independent Directors pursuant to the Sally Beauty Holdings, Inc. 2007 Omnibus Incentive Plan,which is incorporated herein by reference from Exhibit 10.29 to the Company’s Annual Report on Form 10-K filed on November 19, 2009
10.9 2010 Form of Restricted Stock Agreement for Employees pursuant to the Sally Beauty Holdings, Inc. 2007 Omnibus Incentive Plan, which isincorporated herein by reference from Exhibit 10.30 to the Company’s Annual Report on Form 10-K filed on November 19, 2009
10.10 2010 Form of Stock Option Agreement for Employees pursuant to the Sally Beauty Holdings, Inc. 2007 Omnibus Incentive Plan, which is incorporatedherein by reference from Exhibit 10.31 to the Company’s Annual Report on Form 10-K filed on November 19, 2009
10.11 Form of Amended and Restated Indemnification Agreement with Directors, which is incorporated herein by reference from Exhibit 10.33 to theCompany’s Annual Report on Form 10-K filed on November 19, 2009
10.12 Sally Beauty Holdings, Inc. Amended and Restated 2010 Omnibus Incentive Plan, which is incorporated herein by reference from Exhibit 10.39 to theCompany’s Annual Report on Form 10-K filed on November 15, 2012
10.13 2011 Form of Restricted Stock Agreement for Employees pursuant to the Sally Beauty Holdings, Inc. Amended and Restated 2010 Omnibus IncentivePlan, which is incorporated herein by reference from Exhibit 10.33 to the Company’s Annual Report on Form 10-K filed on November 18, 2010
10.14 2011 Form of Stock Option Agreement for Employees pursuant to the Sally Beauty Holdings, Inc. Amended and Restated 2010 Omnibus IncentivePlan, which is incorporated herein by reference from Exhibit 10.34 to the Company’s Annual Report on Form 10-K filed on November 18, 2010
10.15
2011 Form of Restricted Stock Unit Agreement for Independent Directors pursuant to the Sally Beauty Holdings, Inc. Amended and Restated 2010Omnibus Incentive Plan, which is incorporated herein by reference from Exhibit 10.25 to the Company’s Annual Report on Form 10-K filedNovember 15, 2012
10.16 2016 Form of Performance Unit Award Agreement pursuant to the Sally Beauty Holdings, Inc. Amended and Restated 2010 Omnibus Incentive Plan,which is incorporated herein by reference from Exhibit 10.1 to the Company’s Quarterly Report on Form 10-Q filed on February 4, 2016
10.17
Sally Beauty Holdings, Inc. 2019 Omnibus Incentive Plan, which is incorporated herein by reference from Appendix A to the Company’s DefinitiveProxy Statement on Schedule 14A filed on December 19, 2018
10.18
2019 Form of Performance Unit Award Agreement pursuant to the Sally Beauty Holdings, Inc. 2019 Omnibus Incentive Plan, which is incorporatedherein by reference from Exhibit 10.1 to the Company’s Quarterly Report on Form 10-Q filed on February 5, 2019
10.19
2019 Form of Restricted Stock Unit Agreement for Independent Directors pursuant to the Sally Beauty Holding, Inc. 2019 Omnibus Incentive Plan,which is incorporated herein by reference from Exhibit 10.2 to the Company’s Quarterly Report on Form 10-Q filed on February 5, 2019
10.20 2019 Form of Stock Option Agreement pursuant to the Sally Beauty Holdings, Inc. 2019 Omnibus Incentive Plan*
10.21 2019 Form of Restricted Stock Agreement pursuant to the Sally Beauty Holdings, Inc. 2019 Omnibus Incentive Plan*
- 43 -
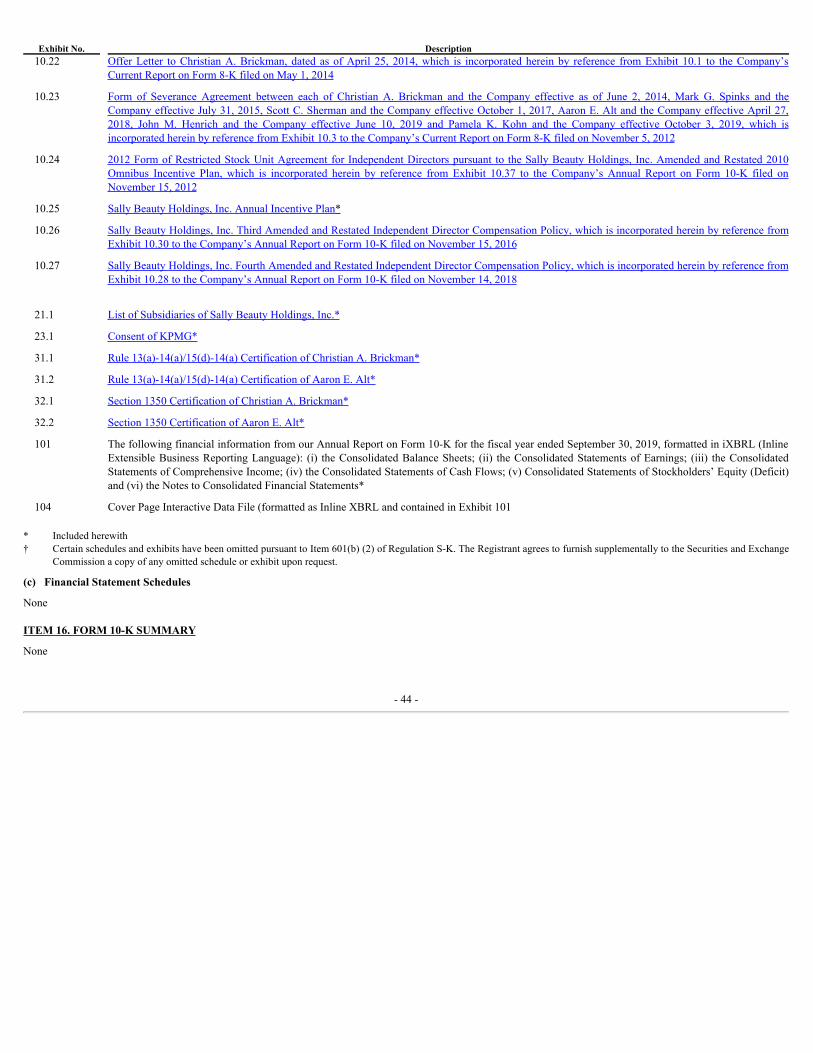
Exhibit No. Description
10.22 Offer Letter to Christian A. Brickman, dated as of April 25, 2014, which is incorporated herein by reference from Exhibit 10.1 to the Company’sCurrent Report on Form 8-K filed on May 1, 2014
10.23
Form of Severance Agreement between each of Christian A. Brickman and the Company effective as of June 2, 2014, Mark G. Spinks and theCompany effective July 31, 2015, Scott C. Sherman and the Company effective October 1, 2017, Aaron E. Alt and the Company effective April 27,2018, John M. Henrich and the Company effective June 10, 2019 and Pamela K. Kohn and the Company effective October 3, 2019, which isincorporated herein by reference from Exhibit 10.3 to the Company’s Current Report on Form 8-K filed on November 5, 2012
10.24
2012 Form of Restricted Stock Unit Agreement for Independent Directors pursuant to the Sally Beauty Holdings, Inc. Amended and Restated 2010Omnibus Incentive Plan, which is incorporated herein by reference from Exhibit 10.37 to the Company’s Annual Report on Form 10-K filed onNovember 15, 2012
10.25 Sally Beauty Holdings, Inc. Annual Incentive Plan*
10.26 Sally Beauty Holdings, Inc. Third Amended and Restated Independent Director Compensation Policy, which is incorporated herein by reference fromExhibit 10.30 to the Company’s Annual Report on Form 10-K filed on November 15, 2016
10.27
Sally Beauty Holdings, Inc. Fourth Amended and Restated Independent Director Compensation Policy, which is incorporated herein by reference fromExhibit 10.28 to the Company’s Annual Report on Form 10-K filed on November 14, 2018
21.1 List of Subsidiaries of Sally Beauty Holdings, Inc.*
23.1 Consent of KPMG*
31.1 Rule 13(a)-14(a)/15(d)-14(a) Certification of Christian A. Brickman*
31.2 Rule 13(a)-14(a)/15(d)-14(a) Certification of Aaron E. Alt*
32.1 Section 1350 Certification of Christian A. Brickman*
32.2 Section 1350 Certification of Aaron E. Alt*
101
The following financial information from our Annual Report on Form 10-K for the fiscal year ended September 30, 2019, formatted in iXBRL (InlineExtensible Business Reporting Language): (i) the Consolidated Balance Sheets; (ii) the Consolidated Statements of Earnings; (iii) the ConsolidatedStatements of Comprehensive Income; (iv) the Consolidated Statements of Cash Flows; (v) Consolidated Statements of Stockholders’ Equity (Deficit)and (vi) the Notes to Consolidated Financial Statements*
104 Cover Page Interactive Data File (formatted as Inline XBRL and contained in Exhibit 101 * Included herewith† Certain schedules and exhibits have been omitted pursuant to Item 601(b) (2) of Regulation S-K. The Registrant agrees to furnish supplementally to the Securities and Exchange
Commission a copy of any omitted schedule or exhibit upon request.
(c) Financial Statement Schedules
None
ITEM 16. FORM 10-K SUMMARY
None
- 44 -

SIGNATURES
Pursuant to the requirements of Section 13 or 15(d) of the Securities Exchange Act of 1934, the registrant has duly caused this report to be signed on its behalf by theundersigned, thereunto duly authorized, on the 22nd day of November, 2019.
SALLY BEAUTY HOLDINGS, INC.
By: /s/ Christian A. BrickmanChristian A. BrickmanPresident, Chief Executive Officer and Director
By: /s/ Aaron E. AltAaron E. AltSenior Vice President, Chief Financial Officer and President – Sally Beauty Supply
By: /s/ Kenneth M. NewtonKenneth M. NewtonInterim Controller and InterimPrincipal Accounting Officer
- 45 -

Pursuant to the requirements of the Securities Exchange Act of 1934, this report has been signed below by the following persons on behalf of the registrant and in thecapacities and on the dates indicated.
Signature Title Date
/s/ Christian A. Brickman President, Chief Executive Officer and Director (PrincipalExecutive Officer)
November 22, 2019
Christian A. Brickman
/s/ Aaron E. Alt
Senior Vice President, Chief Financial Officer and President –Sally Beauty Supply(Principal Financial Officer)
November 22, 2019Aaron E. Alt
/s/ Kenneth M. Newton Interim Controller and Interim Principal Accounting Officer(Principal Accounting Officer)
November 22, 2019
Kenneth M. Newton
/s/ Robert R. McMaster Chairman of the Board of Directors November 22, 2019Robert R. McMaster
/s/ Marshall E. Eisenberg Director November 22, 2019Marshall E. Eisenberg
/s/ Diana S. Ferguson Director November 22, 2019Diana S. Ferguson
/s/ David W. Gibbs Director November 22, 2019David W. Gibbs
/s/ Linda Heasley Director November 22, 2019Linda Heasley
/s/ Joseph C. Magnacca Director November 22, 2019Joseph C. Magnacca
/s/ John A. Miller Director November 22, 2019John A. Miller
/s/ P. Kelly Mooney Director November 22, 2019P. Kelly Mooney
/s/ Susan R. Mulder Director November 22, 2019Susan R. Mulder
/s/ Denise Paulonis Director November 22, 2019Denise Paulonis
/s/ Edward W. Rabin Director November 22, 2019Edward W. Rabin
- 46 -

SALLY BEAUTY HOLDINGS, INC. AND SUBSIDIARIES
Financial StatementsYears ended September 30, 2019, 2018 and 2017
INDEX TO FINANCIAL STATEMENTS
Page
Report of Independent Registered Public Accounting Firm F-1Consolidated Financial Statements: Consolidated Balance Sheets as of September 30, 2019 and 2018 F-3Consolidated Statements of Earnings for the years ended September 30, 2019, 2018 and 2017 F-4Consolidated Statements of Comprehensive Income for the years ended September 30, 2019, 2018 and 2017 F-5Consolidated Statements of Cash Flows for the years ended September 30, 2019, 2018 and 2017 F-6Consolidated Statements of Stockholders’ Deficit for the years ended September 30, 2019, 2018 and 2017 F-7Notes to Consolidated Financial Statements for the years ended September 30, 2019, 2018 and 2017 F-8
- 47 -
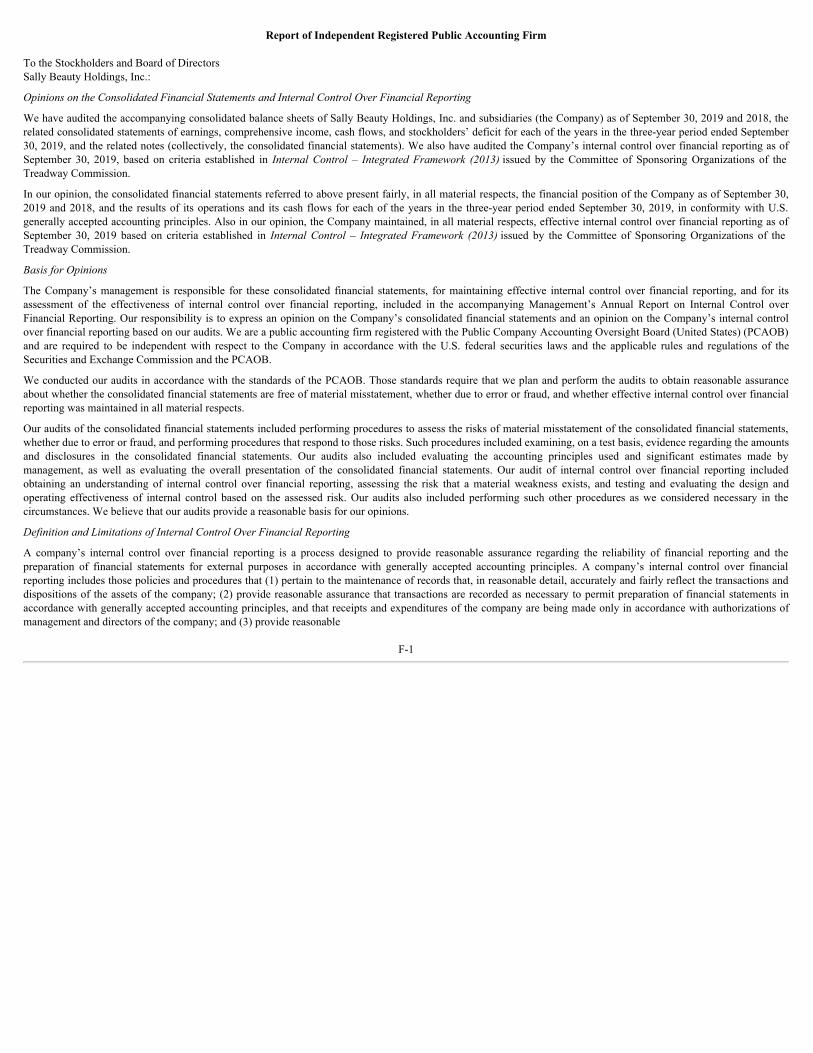
Report of Independent Registered Public Accounting Firm
To the Stockholders and Board of DirectorsSally Beauty Holdings, Inc.:
Opinions on the Consolidated Financial Statements and Internal Control Over Financial Reporting
We have audited the accompanying consolidated balance sheets of Sally Beauty Holdings, Inc. and subsidiaries (the Company) as of September 30, 2019 and 2018, therelated consolidated statements of earnings, comprehensive income, cash flows, and stockholders’ deficit for each of the years in the three-year period ended September30, 2019, and the related notes (collectively, the consolidated financial statements). We also have audited the Company’s internal control over financial reporting as ofSeptember 30, 2019, based on criteria established in Internal Control – Integrated Framework (2013) issued by the Committee of Sponsoring Organizations of theTreadway Commission.
In our opinion, the consolidated financial statements referred to above present fairly, in all material respects, the financial position of the Company as of September 30,2019 and 2018, and the results of its operations and its cash flows for each of the years in the three-year period ended September 30, 2019, in conformity with U.S.generally accepted accounting principles. Also in our opinion, the Company maintained, in all material respects, effective internal control over financial reporting as ofSeptember 30, 2019 based on criteria established in Internal Control – Integrated Framework (2013) issued by the Committee of Sponsoring Organizations of theTreadway Commission.
Basis for Opinions
The Company’s management is responsible for these consolidated financial statements, for maintaining effective internal control over financial reporting, and for itsassessment of the effectiveness of internal control over financial reporting, included in the accompanying Management’s Annual Report on Internal Control overFinancial Reporting. Our responsibility is to express an opinion on the Company’s consolidated financial statements and an opinion on the Company’s internal controlover financial reporting based on our audits. We are a public accounting firm registered with the Public Company Accounting Oversight Board (United States) (PCAOB)and are required to be independent with respect to the Company in accordance with the U.S. federal securities laws and the applicable rules and regulations of theSecurities and Exchange Commission and the PCAOB.
We conducted our audits in accordance with the standards of the PCAOB. Those standards require that we plan and perform the audits to obtain reasonable assuranceabout whether the consolidated financial statements are free of material misstatement, whether due to error or fraud, and whether effective internal control over financialreporting was maintained in all material respects.
Our audits of the consolidated financial statements included performing procedures to assess the risks of material misstatement of the consolidated financial statements,whether due to error or fraud, and performing procedures that respond to those risks. Such procedures included examining, on a test basis, evidence regarding the amountsand disclosures in the consolidated financial statements. Our audits also included evaluating the accounting principles used and significant estimates made bymanagement, as well as evaluating the overall presentation of the consolidated financial statements. Our audit of internal control over financial reporting includedobtaining an understanding of internal control over financial reporting, assessing the risk that a material weakness exists, and testing and evaluating the design andoperating effectiveness of internal control based on the assessed risk. Our audits also included performing such other procedures as we considered necessary in thecircumstances. We believe that our audits provide a reasonable basis for our opinions.
Definition and Limitations of Internal Control Over Financial Reporting
A company’s internal control over financial reporting is a process designed to provide reasonable assurance regarding the reliability of financial reporting and thepreparation of financial statements for external purposes in accordance with generally accepted accounting principles. A company’s internal control over financialreporting includes those policies and procedures that (1) pertain to the maintenance of records that, in reasonable detail, accurately and fairly reflect the transactions anddispositions of the assets of the company; (2) provide reasonable assurance that transactions are recorded as necessary to permit preparation of financial statements inaccordance with generally accepted accounting principles, and that receipts and expenditures of the company are being made only in accordance with authorizations ofmanagement and directors of the company; and (3) provide reasonable
F-1

assurance regarding prevention or timely detection of unauthorized acquisition, use, or disposition of the company’s assets that could have a material effect on thefinancial statements.
Because of its inherent limitations, internal control over financial reporting may not prevent or detect misstatements. Also, projections of any evaluation of effectivenessto future periods are subject to the risk that controls may become inadequate because of changes in conditions, or that the degree of compliance with the policies orprocedures may deteriorate.
Critical Audit Matter
The critical audit matter communicated below is a matter arising from the current period audit of the consolidated financial statements that was communicated or requiredto be communicated to the audit committee and that: (1) relates to accounts or disclosures that are material to the consolidated financial statements and (2) involved ourespecially challenging, subjective, or complex judgment. The communication of the critical audit matter does not alter in any way our opinion on the consolidatedfinancial statements, taken as a whole, and we are not, by communicating the critical audit matter below, providing a separate opinion on the critical audit matter or on theaccounts or disclosures to which it relates.
Evaluation of vendor rebates and concessions
As discussed in Note 2 to the consolidated financial statements, other accounts receivable of $61.4 million consists primarily of amounts earned from theCompany’s vendors under contractual agreements (collectively referred to as vendor rebates and concessions). These agreements are often specific to aparticular product or promotion for a specified period of time, which results in a high volume of agreements, each with potentially non-standardized termsand conditions governing how the rebate is earned and calculated. Therefore, the inputs used to calculate the vendor rebates and concessions, which caninclude financial and non-financial data from multiple sources, will vary depending on the specific terms of the agreements.
We identified the evaluation of vendor rebates and concessions as a critical audit matter because of the challenging auditor judgment required to assess thenon-standardized terms of the agreements and the nature and source of the inputs used in the recognition of the receivable.
The primary procedures we performed to address this critical audit matter included the following. We tested certain internal controls over the Company’sprocess to calculate vendor rebates and concessions, including controls over the derivation of key inputs and the evaluation of the contractual terms of theagreements. For a sample of the vendor rebates and concessions, we evaluated the nature and source of the inputs used, and the terms of the contractualagreements. We recalculated the amount of the receivable based on the inputs and the terms of the agreements. We also compared the amount of cashreceived to the amount previously recognized by the Company for a sample of the vendor rebates and concessions that were collected subsequent to yearend.
/s/ KPMG LLP
We have served as the Company’s auditor since 2006.
Dallas, TexasNovember 22, 2019
F-2

SALLY BEAUTY HOLDINGS, INC. AND SUBSIDIARIESConsolidated Balance SheetsSeptember 30, 2019 and 2018
(In thousands, except par value data)
2019 2018 Assets Current assets:
Cash and cash equivalents $ 71,495 $ 77,295 Trade accounts receivable, net 43,136 48,417 Accounts receivable, other 61,403 42,073 Inventory 952,907 944,338 Other current assets 34,612 42,960
Total current assets 1,163,553 1,155,083 Property and equipment, net 319,628 308,357 Goodwill 530,786 535,925 Intangible assets, excluding goodwill, net 62,051 72,698 Other assets 22,428 25,351
Total assets $ 2,098,446 $ 2,097,414 Liabilities and Stockholders’ Deficit Current liabilities:
Current maturities of long-term debt $ 1 $ 5,501 Accounts payable 278,688 303,241 Accrued liabilities 169,054 180,287 Income taxes payable 8,336 2,144
Total current liabilities 456,079 491,173 Long-term debt 1,594,542 1,768,808 Other liabilities 27,757 30,022 Deferred income tax liabilities, net 80,391 75,967
Total liabilities 2,158,769 2,365,970 Stockholders’ deficit:
Common stock, $0.01 par value. Authorized 500,000 shares; 116,986 and 120,145 shares issued and 116,725 and 119,926 shares outstanding at September 30, 2019 and 2018, respectively 1,167 1,199 Preferred stock, $0.01 par value. Authorized 50,000 shares; none issued — — Additional paid-in capital — — Accumulated earnings (deficit) 55,797 (179,764)Accumulated other comprehensive loss, net of tax (117,287) (89,991)
Total stockholders’ deficit (60,323) (268,556)Total liabilities and stockholders’ deficit $ 2,098,446 $ 2,097,414
The accompanying notes are an integral part to these consolidated financial statements.
F-3
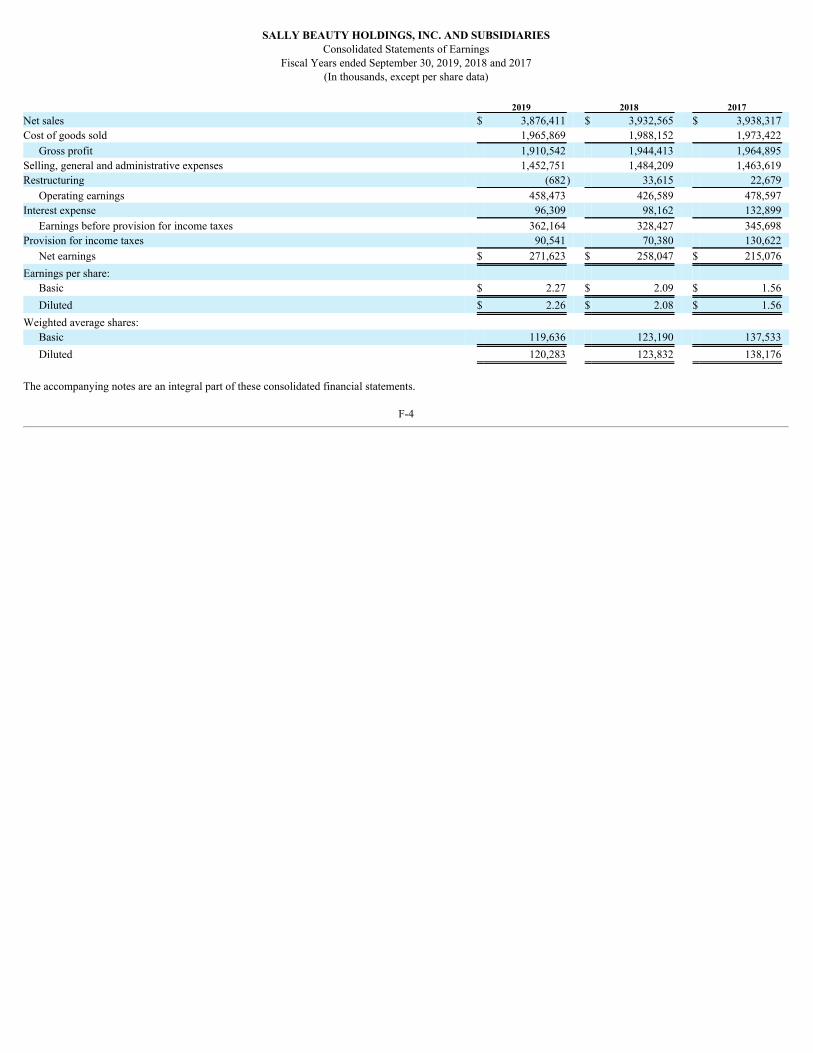
SALLY BEAUTY HOLDINGS, INC. AND SUBSIDIARIESConsolidated Statements of Earnings
Fiscal Years ended September 30, 2019, 2018 and 2017(In thousands, except per share data)
2019 2018 2017
Net sales $ 3,876,411 $ 3,932,565 $ 3,938,317 Cost of goods sold 1,965,869 1,988,152 1,973,422
Gross profit 1,910,542 1,944,413 1,964,895 Selling, general and administrative expenses 1,452,751 1,484,209 1,463,619 Restructuring (682) 33,615 22,679
Operating earnings 458,473 426,589 478,597 Interest expense 96,309 98,162 132,899
Earnings before provision for income taxes 362,164 328,427 345,698 Provision for income taxes 90,541 70,380 130,622
Net earnings $ 271,623 $ 258,047 $ 215,076 Earnings per share:
Basic $ 2.27 $ 2.09 $ 1.56 Diluted $ 2.26 $ 2.08 $ 1.56
Weighted average shares: Basic 119,636 123,190 137,533 Diluted 120,283 123,832 138,176
The accompanying notes are an integral part of these consolidated financial statements.
F-4
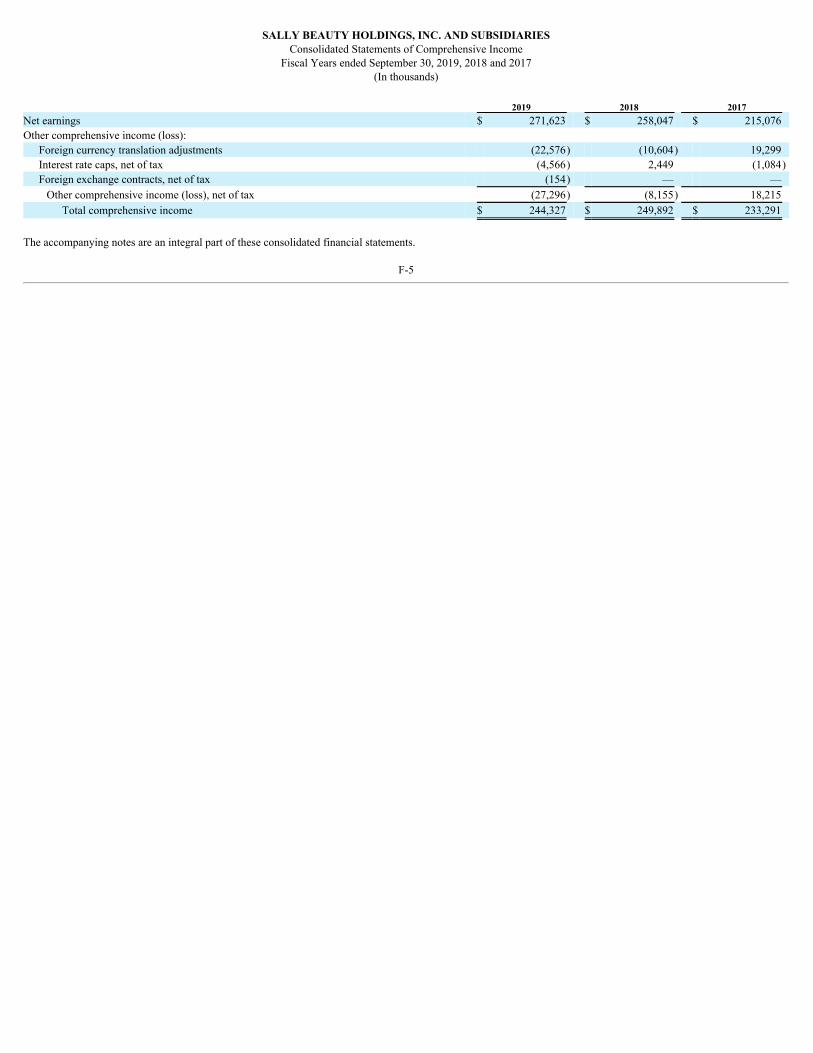
SALLY BEAUTY HOLDINGS, INC. AND SUBSIDIARIESConsolidated Statements of Comprehensive Income
Fiscal Years ended September 30, 2019, 2018 and 2017(In thousands)
2019 2018 2017
Net earnings $ 271,623 $ 258,047 $ 215,076 Other comprehensive income (loss):
Foreign currency translation adjustments (22,576) (10,604) 19,299 Interest rate caps, net of tax (4,566) 2,449 (1,084)Foreign exchange contracts, net of tax (154) — — Other comprehensive income (loss), net of tax (27,296) (8,155) 18,215
Total comprehensive income $ 244,327 $ 249,892 $ 233,291
The accompanying notes are an integral part of these consolidated financial statements.
F-5

SALLY BEAUTY HOLDINGS, INC. AND SUBSIDIARIESConsolidated Statements of Cash Flows
Fiscal Years ended September 30, 2019, 2018 and 2017(In thousands)
2019 2018 2017
Cash Flows from Operating Activities: Net earnings $ 271,623 $ 258,047 $ 215,076 Adjustments to reconcile net earnings to net cash provided by operating activities:
Depreciation and amortization 107,658 108,829 112,323 Share-based compensation expense 9,180 10,519 10,507 Amortization of deferred financing costs 3,786 3,832 3,264 Net loss/(gain) on disposal and impairment of assets (7,544) 181 8,464 Net loss on extinguishment of debt 951 876 27,981 Deferred income taxes 5,532 (20,538) 14,122 Changes in (exclusive of effects of acquisitions):
Trade accounts receivable 4,399 (1,949) 702 Accounts receivable, other (20,432) 2,743 (7,520)Inventory (20,272) (16,450) (16,343)Other current assets 7,418 12,164 1,480 Other assets (3,225) 48 (6,700)Accounts payable and accrued liabilities (42,719) 4,592 (18,779)Income taxes payable 6,144 (221) 323 Other liabilities (2,084) 9,988 (1,614)
Net cash provided by operating activities 320,415 372,661 343,286 Cash Flows from Investing Activities:
Payments for property and equipment (107,755) (86,507) (89,666)Proceeds from sales of property and equipment 15,312 369 41 Acquisitions, net of cash acquired (3,424) (9,175) —
Net cash used by investing activities (95,867) (95,313) (89,625)Cash Flows from Financing Activities:
Proceeds from issuance of long-term debt 593,504 461,819 1,277,250 Repayments of long-term debt (777,538) (558,599) (1,216,643)Debt issuance costs — (1,151) (8,376)Payments for common stock repurchased (47,434) (166,701) (346,873)Proceeds from exercises of stock options 2,160 1,350 17,339
Net cash used by financing activities (229,308) (263,282) (277,303)Effect of foreign exchange rate changes on cash and cash equivalents (1,040) (530) 779
Net increase (decrease) in cash and cash equivalents (5,800) 13,536 (22,863)Cash and cash equivalents, beginning of period 77,295 63,759 86,622 Cash and cash equivalents, end of period $ 71,495 $ 77,295 $ 63,759 Supplemental Cash Flow Information:
Interest paid $ 95,171 $ 90,077 $ 141,883 Income taxes paid $ 83,783 $ 70,253 $ 114,553 Capital expenditures incurred but not paid $ 26,233 $ 15,315 $ 8,367
The accompanying notes are an integral part of these consolidated financial statements.
F-6

SALLY BEAUTY HOLDINGS, INC. AND SUBSIDIARIESConsolidated Statements of Stockholders’ Deficit
Fiscal Years ended September 30, 2019, 2018 and 2017(In thousands)
Additional Accumulated Accumulated Other Total Common Stock Paid-in Earnings Comprehensive Stockholders’ Shares Amount Capital (Deficit) Income (Loss) Deficit Balance at September 30, 2016 $ 144,571 $ 1,446 $ — $ (177,561) $ (100,051) $ (276,166)Net earnings — — — 215,076 — 215,076 Other comprehensive income — — — — 18,215 18,215 Repurchases of common stock (16,072) (161) (25,299) (320,591) — (346,051)Share-based compensation 122 1 10,506 — — 10,507 Stock issued for stock options 964 10 14,793 — — 14,803 Balance at September 30, 2017 129,585 1,296 — (283,076) (81,836) (363,616)Net earnings — — — 258,047 — 258,047 Other comprehensive loss, net of tax
— — — — (8,155) (8,155)
Repurchases of common stock (9,987) (100) (11,866) (154,735) — (166,701)Share-based compensation 178 2 10,517 — — 10,519 Stock issued for stock options 150 1 1,349 — — 1,350 Balance at September 30, 2018 119,926 1,199 — (179,764) (89,991) (268,556)Net earnings — — — 271,623 — 271,623 Other comprehensive loss, net of tax
— — — — (27,296) (27,296)
Repurchases of common stock (3,562) (36) (11,336) (36,062) — (47,434)Share-based compensation 209 2 9,178 — — 9,180 Stock issued for stock options 152 2 2,158 — — 2,160 Balance at September 30, 2019 $ 116,725 $ 1,167 $ — $ 55,797 $ (117,287) $ (60,323) The accompanying notes are an integral part of these consolidated financial statements.
F-7
Sally Beauty Holdings, Inc. and SubsidiariesNotes to Consolidated Financial Statements
Fiscal Years ended September 30, 2019, 2018 and 2017 1. Basis of Presentation
The consolidated financial statements included herein have been prepared in accordance with accounting principles generally accepted in the United States (“GAAP”).All significant intercompany accounts and transactions have been eliminated in consolidation.
2. Significant Accounting Policies
The preparation of financial statements in conformity with GAAP requires us to interpret and apply accounting standards and to develop and follow accounting policiesconsistent with such standards. The following is a summary of the significant accounting policies used in preparing our consolidated financial statements.
Use of Estimates
In accordance with GAAP, management makes estimates and assumptions that affect the reported amounts of assets, liabilities, revenues and expenses, and disclosure ofcontingent liabilities in the consolidated financial statements. Actual results may differ from these estimates in amounts that may be material to our consolidated financialstatements.
Cash and Cash Equivalents
Cash represents currency on hand, debt and credit card receivable and third-party online payment systems transactions, while cash equivalents consist of highly liquidinvestments which have an original maturity of three months or less. Cash and cash equivalents are stated at cost, which approximates fair value.
Trade Accounts Receivable and Accounts Receivable, Other
Trade accounts receivable consist of credit extended directly to certain customers who meet our credit requirements in the ordinary course of business and are stated attheir carrying values, net of an allowance for doubtful accounts. Our allowance for doubtful accounts is regularly reviewed on the basis of our historical collection dataand current customer information. Customer account balances are written off against the allowance after all means of collection have been exhausted and the potential forrecovery is considered remote. At September 30, 2019 and 2018, our allowance for doubtful accounts was $1.7 million and $1.8 million, respectively.
Other accounts receivable consist primarily of amounts due from vendors under various contractual agreements and include volume rebates and other promotionalconsiderations.
Inventory and Cost of Goods Sold
Inventory is stated at the lower of cost (FIFO) or net realizable value. Inventory cost reflects actual product costs, the cost of transportation to our distribution centers andcertain shipping and handling costs, such as freight from the distribution centers to the stores and handling costs incurred at the distribution centers. When assessing thenet realizable value of inventory, we consider several factors including estimates of future demand for our products, historical turn-over rates, the age and sales history ofthe inventory, and historic and anticipated changes in stock keeping units.
Physical inventory counts are performed at substantially all stores and significant distribution centers at least annually. Upon completion of physical inventory counts, ourconsolidated financial statements are adjusted to reflect actual quantities on hand. Between physical counts, we estimate inventory shrinkage based on our historicalexperience. We have policies and processes in place that are intended to minimize inventory shrinkage.
Cost of goods sold includes actual product costs, the cost of transportation to our distribution centers, operating cost associated with our distribution centers (includingemployee compensation expense, depreciation and amortization, rent and other occupancy-related expenses), vendor rebates and allowances, inventory shrinkage andcertain
F-8

Sally Beauty Holdings, Inc. and SubsidiariesNotes to Consolidated Financial Statements
Fiscal Years ended September 30, 2019, 2018 and 2017 shipping and handling costs, such as freight from the distribution centers to the stores. All other shipping and handling costs are included in selling, general andadministrative expenses when incurred.
We deem cash consideration received from a supplier to be a reduction of the cost of inventory purchased, unless it is in exchange for an asset or service or areimbursement of a specific, incremental, identifiable cost incurred by us in selling the vendor’s products. The majority of cash consideration we receive is considered tobe a reduction of inventory and a subsequent reduction in cost of goods sold as the related products are sold.
Lease Accounting
The majority of our lease agreements are for company-operated stores, warehouse/distribution facilities and office space and are accounted for as operating leases. Rentexpense (including any rent abatements or escalation charges) is recognized on a straight-line basis from the date we take possession of the property to begin preparationof the site for occupancy to the end of the lease term, including renewal options that are considered reasonably assured. Certain lease agreements to which we are a partyprovide for contingent rents that are determined as a percentage of revenues in excess of specified levels. We record a contingent rent liability, along with thecorresponding rent expense, when the specified levels of revenue have been achieved or when we determine that achieving the specified levels of revenue during thefiscal year is probable.
Certain lease agreements to which we are a party provide for tenant improvement allowances. Tenant improvement allowances are recorded as deferred lease credits,included in accrued liabilities and other liabilities, as appropriate, on our consolidated balance sheets, and amortized on a straight-line basis over the lease term (includingrenewal options that are determined reasonably assured) as a reduction of rent expense. The amortization period used for deferred lease credits is generally consistentwith the amortization period used for the constructed leasehold improvement asset for a given office, store or warehouse facility.
Property and Equipment
Property and equipment are recorded at cost and depreciated using the straight-line method over the estimated useful lives of the assets. Leasehold improvements aredepreciated or amortized over the lesser of the estimated useful lives of the assets or the term of the related lease, including renewals considered reasonably assured.Expenditures for maintenance and repairs are included in selling, general and administrative expenses when incurred, while expenditures for major renewals andimprovements that substantially extend the useful life of an asset are capitalized.
The following table summarizes our property and equipment balances and their estimated useful lives (dollars in thousands): Life September 30, (in years) 2019 2018
Land N/A $ 10,061 $ 11,130 Buildings and building improvements 5 – 40 53,132 64,251 Leasehold improvements 2 – 10 281,195 274,848 Furniture, fixtures and equipment 2 – 10 634,525 569,149 Total property and equipment, gross 978,913 919,378
Accumulated depreciation and amortization (659,285) (611,021)Total property and equipment, net $ 319,628 $ 308,357
Depreciation expense for the fiscal years 2019, 2018 and 2017 was $96.1 million, $97.2 million and $99.2 million, respectively, and is included in selling, general andadministrative expenses in our consolidated statements of earnings.
Valuation of Long-Lived Assets and Definite-lived Intangible Assets
Long-lived assets, such as property and equipment, including store equipment, and purchased intangibles subject to amortization are reviewed for impairment wheneverevents or changes in circumstances indicate that the carrying amount of an asset may not be fully recoverable. The recoverability of long-lived assets and intangible assetssubject to amortization is assessed by comparing the net carrying amount of each asset to the total estimated undiscounted future cash flows expected to be generated bythe asset. If the carrying amount of an asset exceeds its undiscounted
F-9

Sally Beauty Holdings, Inc. and SubsidiariesNotes to Consolidated Financial Statements
Fiscal Years ended September 30, 2019, 2018 and 2017 future cash flows, an impairment charge is recognized for the amount by which the carrying amount of the asset exceeds the estimated fair value of the asset.
Goodwill and Indefinite-lived Intangible Assets
Goodwill
Goodwill represents the excess of the purchase price over the fair value of the net assets acquired in a business combination. Goodwill is tested for impairment at leastannually, as of January 31st, and whenever indications of potential impairment exist. Components within the same reportable segment are aggregated and deemed a singlereporting unit if the components have similar economic characteristics. As of September 30, 2019, our reporting units consisted of Sally Beauty Supply (“SBS”) andBeauty Systems Group (“BSG”). We assign goodwill to the reporting unit which consolidates the acquisition.
When assessing goodwill for impairment, we perform a quantitative assessment to compare the fair value of each reporting unit to its carrying value, including goodwill.Fair value is measured based on the discounted cash flow method. Based on our assessments, the fair value of each reporting unit exceeded its carrying value, andaccordingly, we have not recorded any impairment charges related to goodwill in the current or prior fiscal years presented.
Indefinite-lived Intangible Assets
Our intangible assets with indefinite lives consist of trade names acquired in business combinations. Upon acquisition of these identifiable intangible assets, we base ourvaluation on the information and assumptions available to us at the time of acquisition, using income and market approaches to determine fair value. These assets areevaluated for impairment annually or whenever indications of potential impairment exist. When assessing intangible assets with indefinite lives for impairment, wecompare the fair value of each asset against its carrying value. Fair value is based on the relief from royalty method. Based on our assessments, no material impairmentcharges related to intangible assets were recorded in the current or prior fiscal years presented.
Self-Insurance Programs
We self-insure the risks related to workers’ compensation, general and auto liability, property and certain employee-related healthcare benefits. We have obtained third-party excess insurance coverage to limit our exposure per occurrence and aggregate cash outlay.
We record an estimated liability for the ultimate cost of claims incurred and unpaid as of the balance sheet date, which includes claims filed and estimated losses incurredbut not yet reported. We estimate the ultimate cost based on an analysis of our historical data and actuarial estimates. These estimates are reviewed on a regular basis toensure that the recorded liability is adequate. The current and long-term portions of these liabilities are recorded at their present value and included in accrued liabilitiesand other liabilities in our consolidated balance sheets, respectively.
Revenue Recognition
Substantially all of our revenue is derived through the sale of merchandise. Revenue is recognized net of estimated sales returns and sales taxes. We estimate sales returnsbased on historical data. Additionally, we have assessed all revenue streams for principal versus agent considerations and have concluded we are the principal for alltransactions.
See Note 16 for additional information regarding the disaggregation of our sales revenue.
Merchandise Revenues
The majority of our revenue comes from the sale of products in our company-operated stores. These sales generally have one single performance obligation and therevenue is recognized at the point of sale. However, discounts and incentives issued at the point of sale to entice a customer to a future purchase are treated as a separateperformance obligation. As such, we allocate a portion of the revenue generated from the point of sale to each of the additional performance obligations separately usingexplicitly stated amounts or our best estimate using historical data.
F-10

Sally Beauty Holdings, Inc. and SubsidiariesNotes to Consolidated Financial Statements
Fiscal Years ended September 30, 2019, 2018 and 2017 We also sell merchandise on our online platforms, to our franchisees and by using distributor sales consultants. These sales generally have one single performanceobligation and revenue is recognized upon the shipment of the merchandise. Any shipping and handling fees charged to the customer are recognized as revenue, whileany shipping and handling costs to get the merchandise shipped is recognized in cost of goods sold.
We extend credit to certain customers, primarily salon professionals, which generally have 30 day payment terms. Based on the nature of theses receivables, nosignificant financing component exists.
Gift Cards
The revenue from the sale of our gift cards is recognized at the time the gift card is used to purchase merchandise, which is generally within one year from the date ofpurchase. Our gift cards do not carry expiration dates or impose post-sale fees. Based on historical experience, a certain amount of our gift cards will not be redeemed,also referred to as “gift card breakage.” We recognize revenue related to gift card breakage within revenue in our consolidated statements of earnings over timeproportionately to historical redemption patterns. The gift cards are issued and represent liabilities of either of our operating entities, Sally Beauty Supply LLC or BeautySystems Group LLC, which are both limited liability companies formed in the state of Virginia.
Customer Loyalty Rewards
We launched our new Sally Beauty Rewards Loyalty Program nationwide during the first quarter of fiscal year 2019 to the U.S. and Canada, which enables customers toearn points based on their status for every dollar spent on merchandise purchased in our SBS stores and through our sallybeauty.com website, including on our new SBSmobile commerce-based app. When a specific tier has been reached, a customer will receive a certificate which can be used at any of our U.S. and Canadian SBS stores orthrough our sallybeauty.com website on their next purchase. Based on the rewards loyalty program policies, points expire after twelve months of inactivity andcertificates will expire after a specific time period from the date of issuance. Certificates generated from our rewards loyalty program provide a material right tocustomers and represent a separate performance obligation. Rewards loyalty points are accrued at the standalone value per point, net of estimated breakage, and areincluded within accrued liabilities on our consolidated balance sheets. We recognize the revenue when the customer redeems the certificate. Points and certificates areissued by and represent liabilities of Sally Beauty Supply LLC.
Private Label Credit Card
In September 2019, we signed a multi-year agreement with a third-party bank (the “Bank”) to launch a private label credit card (the “Program”). Under the agreement, theBank will manage and extend credit to our SBS and BSG customers and we will provide licensing to our brand, marketing services and facilitate credit applications. TheBank will be the sole owner of the private label credit card accounts and takes on the risk of default by the private label card holders. As of September 30, 2019, Programoperations have not yet commenced. In connection with signing the agreement, we received a refundable payment from the Bank that we recorded as deferred revenuewithin other liabilities on our consolidated balance sheets and will recognize on a straight-line basis over the initial term of the agreement into net sales in ourconsolidated statements of earnings.
Pursuant to the agreement, the Bank will reimburse us for certain expenses we incur for the launch and marketing of the Program. Amounts reimbursed are recognized innet sales in our consolidated statements of earnings. In addition, we can earn other amounts from the Bank, including incentive payments for achieving performancetargets and the activation of credit cards.
The following table shows the amount of contract liabilities on our consolidated balance sheets as of September 30, 2019 and 2018 (in thousands): September 30, Contracts Balance Sheet Classification 2019 2018 Gift cards Accrued liabilities $ 4,558 $ 4,144 Rewards loyalty program Accrued liabilities 8,308 1,165 Total liability $ 12,866 $ 5,309
F-11

Sally Beauty Holdings, Inc. and SubsidiariesNotes to Consolidated Financial Statements
Fiscal Years ended September 30, 2019, 2018 and 2017
Advertising Costs
Advertising costs relate mainly to print advertisements, digital marketing, trade shows and product education for salon professionals. Advertising costs incurred inconnection with print advertisements are expensed the first time the advertisement is run. Other advertising costs are expensed when incurred. Advertising costs were$73.3 million, $83.4 million and $82.0 million for the fiscal years 2019, 2018 and 2017, respectively, and are included in selling, general and administrative expenses inour consolidated statements of earnings.
Share-based Compensation
We measure the cost of services received from our employees and directors in exchange for an award of equity instruments based on the fair value of the award on thedate of grant which are expensed ratably over the vesting period. We recognize the impact of forfeitures as they occur. Share-based compensation expense is included inselling, general and administrative expenses in our consolidated statements of earnings.
Income Taxes
We recognize deferred income taxes for the estimated future tax consequences attributable to temporary differences between the financial statement carrying amounts ofexisting assets and liabilities and their respective tax bases. Deferred tax assets and liabilities are measured using enacted tax rates expected to apply to taxable income inthe years in which temporary differences are anticipated to be recovered or settled. The effect on deferred taxes of a change in income tax rates is recognized in theconsolidated statements of earnings in the period of enactment. A valuation allowance is recorded to reduce the carrying amounts of deferred tax assets to the amountexpected to be realized unless it is more-likely-than-not that such assets will be realized in full. The estimated tax benefit of an uncertain tax position is recorded in ourconsolidated financial statements only after determining a more-likely-than-not probability that the uncertain tax position will withstand challenge, if any, from applicabletaxing authorities.
Foreign Currency
The functional currency of each of our foreign operations is generally the respective local currency. Balance sheet accounts are translated into U.S. dollars (our reportingcurrency) at the rates of exchange in effect at the balance sheet date, while the results of operations and cash flows are generally translated using average exchange ratesfor the periods presented. Individually material transactions, if any, are translated using the actual rate of exchange on the transaction date. The resulting translationadjustments are recorded as a component of accumulated other comprehensive loss in our consolidated balance sheets.
Foreign currency transaction gains or losses, including changes in the fair value (i.e., marked-to-market adjustments) of certain foreign exchange contracts we hold, areincluded in selling, general and administrative expenses in our consolidated statements of earnings when incurred and were not significant in any of the periods presentedin the accompanying consolidated financial statements.
3. Accounting Changes and Recent Accounting Pronouncements
Accounting Changes
In May 2014, the FASB issued ASU No. 2014-09, Revenue from Contracts with Customers (“ASU No. 2014-09”), which introduced new guidance that established howan entity should measure revenue in connection with its sale of goods and services to a customer based on the consideration to which the entity expects to be entitled inexchange for each of those goods and services. On October 1, 2018, we adopted ASU No. 2014-09 using the modified retrospective transition method. Additionally, inconnection with the adoption, we designed changes to our internal control procedures and updated processes to ensure appropriate recognition and presentation offinancial information. This adoption did not have a material effect on our consolidated financial statements or on our internal controls over financial reporting. We do notbelieve that the adoption will have a material effect on our consolidated financial statements on an ongoing basis. The comparative periods continue to be presented underthe accounting standards in effect during those periods.
In connection with the adoption of ASU No. 2014-09, we now present our sales returns allowance on a gross basis rather than a net liability basis. As such, we recognizea return asset from the right to recover merchandise from
F-12

Sally Beauty Holdings, Inc. and SubsidiariesNotes to Consolidated Financial Statements
Fiscal Years ended September 30, 2019, 2018 and 2017 customers (included in other current assets) and a return liability from the amount to be returned to the customer (included in accrued liabilities) within our consolidatedbalance sheets. Additionally, we now recognize revenue for our gift cards not expected to be redeemed (“gift card breakage”) within revenue in our consolidatedstatements of earnings.
The following tables set forth the impact of adopting this standard on our consolidated balance sheets as of September 30, 2019 and our consolidated statements ofearnings for the fiscal year ended September 30, 2019 (in thousands):
Effect of ASU No. 2014-09 Adoption on Consolidated Balance Sheet Excluding ASU No. 2014-09 ASU No. 2014-09 As reported Effect Effect Accounts receivable, other $ 61,403 $ 58,968 $ 2,435 Accrued liabilities $ 169,054 $ 166,619 $ 2,435
Effect of ASU No. 2014-09 Adoption on Consolidated Statement of Earnings Excluding ASU No. 2014-09 ASU No. 2014-09 As reported Effect Effect Net Sales $ 3,876,411 $ 3,876,136 $ 275 Gross Profit 1,910,542 1,910,267 275 Selling, general and administrative expenses $ 1,452,751 $ 1,452,476 $ 275
Recent Accounting Pronouncements
In February 2016, the FASB issued ASU No. 2016-02, Leases, which will require most leases to be reported on the balance sheet as a right-of-use asset and a leaseliability. Under the new guidance, the lease liability must be measured initially based on the present value of future lease payments, subject to certain conditions. Theright-of-use asset must be measured initially based on the amount of the liability, plus certain initial direct costs. The new guidance further requires that leases beclassified at inception as either (a) operating leases or (b) finance leases. For operating leases, periodic expense will generally be flat (straight-line) throughout the life ofthe lease. For finance leases, periodic expense will decline (similar to capital leases under prior rules) over the life of the lease. The new standard must be adopted using amodified retrospective transition method, but companies can adopt using the effective date method or the comparative method. For public companies, this standard iseffective for fiscal years, and interim periods within those fiscal years, beginning after December 15, 2018. We will adopt this pronouncement on October 1, 2019 usingthe effective date method.
We have completed a preliminary assessment of the potential impact of adopting ASU No. 2016-02 on our consolidated financial statements. At September 30, 2019, weestimate that the adoption of ASU No. 2016-02 would have resulted in recognition of a lease liability in the estimated amount of approximately $500.0 million and aright-of-use asset for a similar amount, which will be adjusted by reclassifications of existing lease assets and liability, on our consolidated balance sheet. We arecurrently in the final stages of implementing changes to our processes, controls and systems and expect to be compliant upon required adoption of the new standard. Wedo not believe adoption of ASU No. 2016-02 will have a material impact on our consolidated results of operations or consolidated cash flows. The amount of the right-of-use asset and the lease liability we ultimately recognize may materially differ from this preliminary estimate, including as a result of future organic growth in ourbusiness, changes in interest rates, and potential acquisitions.
F-13

Sally Beauty Holdings, Inc. and SubsidiariesNotes to Consolidated Financial Statements
Fiscal Years ended September 30, 2019, 2018 and 2017
4. Fair Value Measurements
Our financial instruments consist of cash equivalents, trade and other accounts receivable, accounts payable, derivative instruments, including foreign exchange contractsand interest rate caps, and debt. The carrying amounts of cash equivalents, trade and other accounts receivable and accounts payable approximate their respective fairvalues due to the short-term nature of these financial instruments.
We measure on a recurring basis and disclose the fair value of our financial instruments under the provisions of ASC Topic 820, Fair Value Measurement, as amended(“ASC 820”). We define “fair value” as the price that would be received to sell an asset or paid to transfer a liability (i.e., the exit price) in an orderly transaction betweenmarket participants at the measurement date. ASC 820 establishes a three-level hierarchy for measuring fair value and requires an entity to maximize the use ofobservable inputs and minimize the use of unobservable inputs when measuring fair value. This valuation hierarchy is based upon the transparency of inputs to thevaluation of an asset or liability on the measurement date. The three levels of that hierarchy are defined as follows:
Level 1 - Unadjusted quoted prices in active markets for identical assets or liabilities;
Level 2 - Unadjusted quoted prices in active markets for similar assets or liabilities; or unadjusted quoted prices for identical or similar assets or liabilities inmarkets that are not active; or inputs other than quoted prices that are observable for the asset or liability; or inputs that are derived principally from or corroboratedby observable market data; and
Level 3 - Unobservable inputs for the asset or liability.
Fair value on recurring basis
Consistent with the fair value hierarchy, we categorized our financial assets and liabilities as follows (in thousands):
As of September 30, Classification Pricing Category 2019 2018
Financial Assets Interest rate caps Other assets Level 2 344 8,367
Financial Liabilities
None
The fair value for interest rate caps were measured using widely accepted valuation techniques, such as discounted cash flow analyses, and observable inputs, such asmarket interest rates.
Other fair value disclosures
Carrying amounts and the related estimated fair value of our long-term debt, excluding capital lease obligations, are as follows: As of September 30, 2019 2018
Pricing Category Carrying
Value Fair Value Carrying
Value Fair Value Long-term debt
Senior notes Level 1 885,296 898,814 $ 950,000 $ 911,490 Other long-term debt Level 2 724,000 709,830 844,500 824,068
Total debt $ 1,609,296 $ 1,608,644 $ 1,794,500 $ 1,735,558
The fair value of the senior notes was measured using unadjusted quoted market prices. The fair value of other long-term debt was measured using quoted market pricesfor similar debt securities in active markets or widely accepted valuation techniques, such as discounted cash flow analyses, using observable inputs, such as marketinterest rates.
F-14
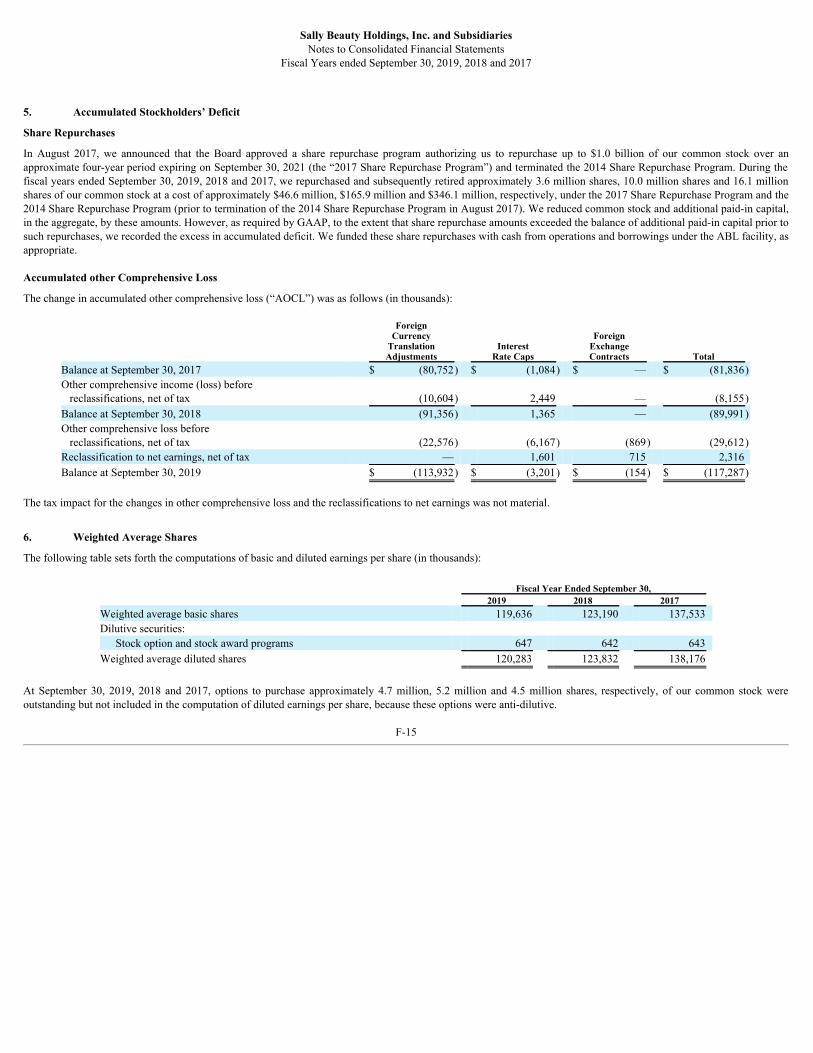
Sally Beauty Holdings, Inc. and SubsidiariesNotes to Consolidated Financial Statements
Fiscal Years ended September 30, 2019, 2018 and 2017
5. Accumulated Stockholders’ Deficit
Share Repurchases
In August 2017, we announced that the Board approved a share repurchase program authorizing us to repurchase up to $1.0 billion of our common stock over anapproximate four-year period expiring on September 30, 2021 (the “2017 Share Repurchase Program”) and terminated the 2014 Share Repurchase Program. During thefiscal years ended September 30, 2019, 2018 and 2017, we repurchased and subsequently retired approximately 3.6 million shares, 10.0 million shares and 16.1 millionshares of our common stock at a cost of approximately $46.6 million, $165.9 million and $346.1 million, respectively, under the 2017 Share Repurchase Program and the2014 Share Repurchase Program (prior to termination of the 2014 Share Repurchase Program in August 2017). We reduced common stock and additional paid-in capital,in the aggregate, by these amounts. However, as required by GAAP, to the extent that share repurchase amounts exceeded the balance of additional paid-in capital prior tosuch repurchases, we recorded the excess in accumulated deficit. We funded these share repurchases with cash from operations and borrowings under the ABL facility, asappropriate.
Accumulated other Comprehensive Loss
The change in accumulated other comprehensive loss (“AOCL”) was as follows (in thousands):
ForeignCurrency
TranslationAdjustments
InterestRate Caps
ForeignExchangeContracts Total
Balance at September 30, 2017 $ (80,752) $ (1,084) $ — $ (81,836)Other comprehensive income (loss) before reclassifications, net of tax (10,604) 2,449 — (8,155)Balance at September 30, 2018 (91,356) 1,365 — (89,991)Other comprehensive loss before reclassifications, net of tax (22,576) (6,167) (869) (29,612)Reclassification to net earnings, net of tax — 1,601 715 2,316 Balance at September 30, 2019 $ (113,932) $ (3,201) $ (154) $ (117,287)
The tax impact for the changes in other comprehensive loss and the reclassifications to net earnings was not material.
6. Weighted Average Shares
The following table sets forth the computations of basic and diluted earnings per share (in thousands):
Fiscal Year Ended September 30, 2019 2018 2017
Weighted average basic shares 119,636 123,190 137,533 Dilutive securities:
Stock option and stock award programs 647 642 643 Weighted average diluted shares 120,283 123,832 138,176
At September 30, 2019, 2018 and 2017, options to purchase approximately 4.7 million, 5.2 million and 4.5 million shares, respectively, of our common stock wereoutstanding but not included in the computation of diluted earnings per share, because these options were anti-dilutive.
F-15
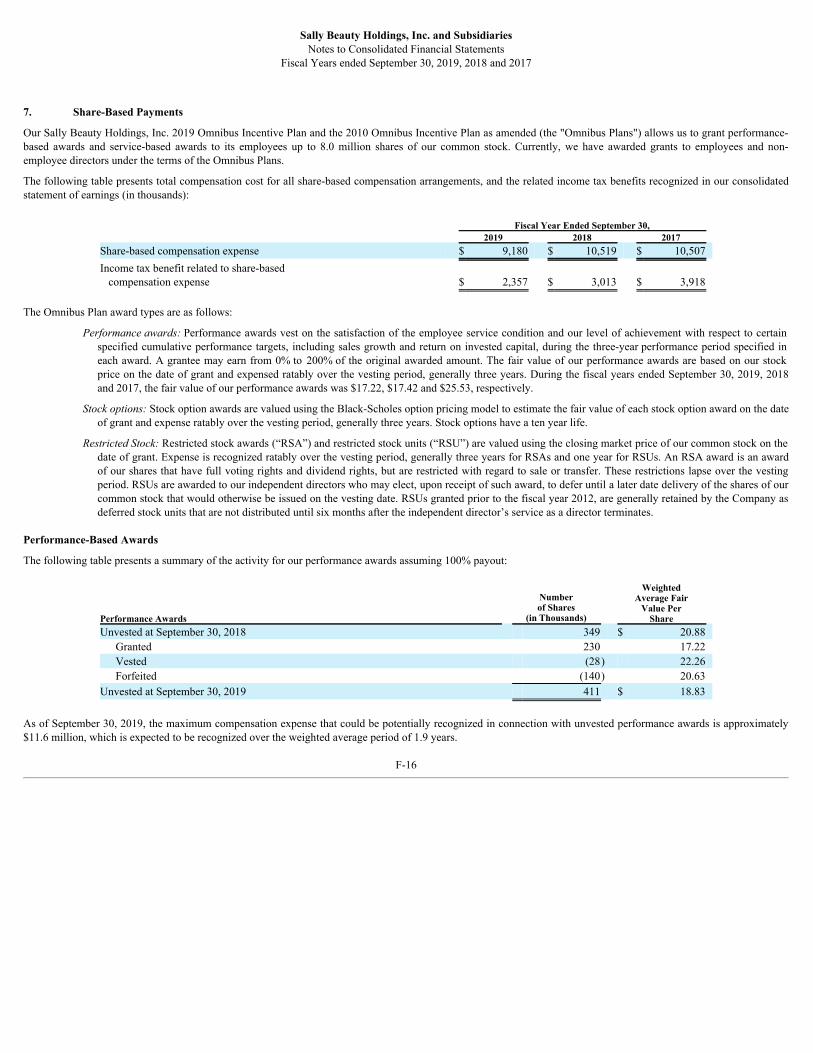
Sally Beauty Holdings, Inc. and SubsidiariesNotes to Consolidated Financial Statements
Fiscal Years ended September 30, 2019, 2018 and 2017
7. Share-Based Payments
Our Sally Beauty Holdings, Inc. 2019 Omnibus Incentive Plan and the 2010 Omnibus Incentive Plan as amended (the "Omnibus Plans") allows us to grant performance-based awards and service-based awards to its employees up to 8.0 million shares of our common stock. Currently, we have awarded grants to employees and non-employee directors under the terms of the Omnibus Plans.
The following table presents total compensation cost for all share-based compensation arrangements, and the related income tax benefits recognized in our consolidatedstatement of earnings (in thousands):
Fiscal Year Ended September 30, 2019 2018 2017
Share-based compensation expense $ 9,180 $ 10,519 $ 10,507 Income tax benefit related to share-based compensation expense $ 2,357 $ 3,013 $ 3,918
The Omnibus Plan award types are as follows:
Performance awards: Performance awards vest on the satisfaction of the employee service condition and our level of achievement with respect to certainspecified cumulative performance targets, including sales growth and return on invested capital, during the three-year performance period specified ineach award. A grantee may earn from 0% to 200% of the original awarded amount. The fair value of our performance awards are based on our stockprice on the date of grant and expensed ratably over the vesting period, generally three years. During the fiscal years ended September 30, 2019, 2018and 2017, the fair value of our performance awards was $17.22, $17.42 and $25.53, respectively.
Stock options: Stock option awards are valued using the Black-Scholes option pricing model to estimate the fair value of each stock option award on the dateof grant and expense ratably over the vesting period, generally three years. Stock options have a ten year life.
Restricted Stock: Restricted stock awards (“RSA”) and restricted stock units (“RSU”) are valued using the closing market price of our common stock on thedate of grant. Expense is recognized ratably over the vesting period, generally three years for RSAs and one year for RSUs. An RSA award is an awardof our shares that have full voting rights and dividend rights, but are restricted with regard to sale or transfer. These restrictions lapse over the vestingperiod. RSUs are awarded to our independent directors who may elect, upon receipt of such award, to defer until a later date delivery of the shares of ourcommon stock that would otherwise be issued on the vesting date. RSUs granted prior to the fiscal year 2012, are generally retained by the Company asdeferred stock units that are not distributed until six months after the independent director’s service as a director terminates.
Performance-Based Awards
The following table presents a summary of the activity for our performance awards assuming 100% payout:
Performance Awards
Numberof Shares
(in Thousands)
WeightedAverage Fair
Value PerShare
Unvested at September 30, 2018 349 $ 20.88 Granted 230 17.22 Vested (28) 22.26 Forfeited (140) 20.63
Unvested at September 30, 2019 411 $ 18.83
As of September 30, 2019, the maximum compensation expense that could be potentially recognized in connection with unvested performance awards is approximately$11.6 million, which is expected to be recognized over the weighted average period of 1.9 years.
F-16

Sally Beauty Holdings, Inc. and SubsidiariesNotes to Consolidated Financial Statements
Fiscal Years ended September 30, 2019, 2018 and 2017
Service-Based Awards
Stock Option Awards
The following table presents a summary of the activity for our stock option awards:
Number ofOutstanding
Options(in Thousands)
WeightedAverageExercise
Price
WeightedAverage
RemainingContractual
Term(in Years)
AggregateIntrinsic
Value(in Thousands)
Outstanding at September 30, 2018 5,405 $ 23.04 5.4 $ 3,161 Granted 948 18.14 Exercised (152) 14.34 Forfeited or expired (1,299) 24.09
Outstanding at September 30, 2019 4,902 $ 22.08 5.8 $ 670 Exercisable at September 30, 2019 4,054 $ 23.00 5.1 $ 670
The weighted average assumptions used in the Black-Scholes model relating to the valuation of our stock options are as follows:
Fiscal Year Ended September 30, 2019 2018 2017
Expected life (in years) 5.0 5.0 5.0 Expected volatility for the Company’s common stock 30.5% 27.4% 25.3%Risk-free interest rate 3.0% 2.1% 1.3%Dividend yield 0.0% 0.0% 0.0%
The expected life of options awarded represents the period of time that such options are expected to be outstanding and is based on our historical experience. The risk-freeinterest rate is based on the zero-coupon U.S. Treasury notes with a term comparable to the expected life of an award at the date of the grant. Since we do not currentlyexpect to pay dividends, the dividend yield used for this purpose is 0%.
The weighted average fair value per share at the date of grant of the stock options awarded during the fiscal years 2019, 2018 and 2017 was $5.86, $4.84 and $6.37,respectively. The aggregate fair value of stock options that vested during the fiscal years 2019, 2018 and 2017 was $5.1 million, $7.7 million and $13.1 million,respectively.
The aggregate intrinsic value of options exercised during the fiscal years 2019, 2018 and 2017 was $0.9 million, $1.3 million and $7.7 million, respectively. The totalcash received during the fiscal years 2019, 2018 and 2017 from these option exercises was $2.2 million, $1.4 million and $17.3 million, respectively, and the tax benefitrealized for the tax deductions from these option exercises was $0.2 million, $0.3 million and $2.9 million, respectively.
At September 30, 2019, approximately $4.4 million of total unrecognized compensation costs related to unvested stock option awards are expected to be recognized overthe weighted average period of 1.7 years.
F-17
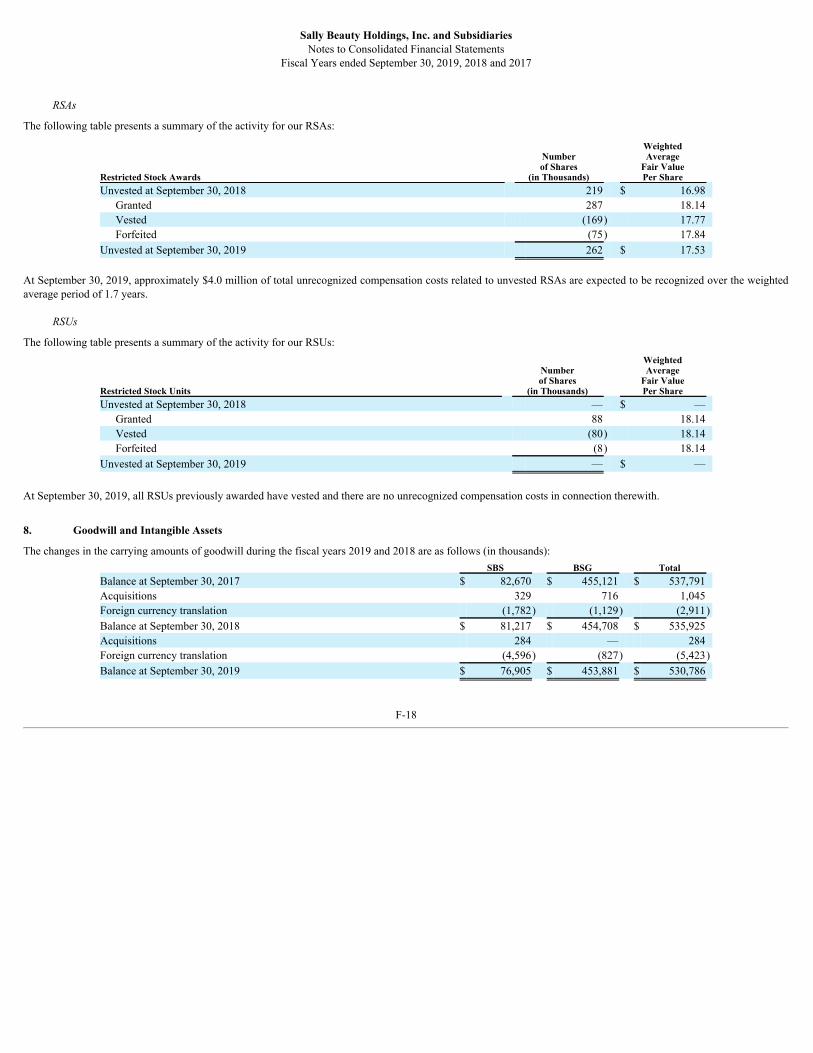
Sally Beauty Holdings, Inc. and SubsidiariesNotes to Consolidated Financial Statements
Fiscal Years ended September 30, 2019, 2018 and 2017
RSAs
The following table presents a summary of the activity for our RSAs:
Restricted Stock Awards
Numberof Shares
(in Thousands)
WeightedAverage
Fair ValuePer Share
Unvested at September 30, 2018 219 $ 16.98 Granted 287 18.14 Vested (169) 17.77 Forfeited (75) 17.84
Unvested at September 30, 2019 262 $ 17.53
At September 30, 2019, approximately $4.0 million of total unrecognized compensation costs related to unvested RSAs are expected to be recognized over the weightedaverage period of 1.7 years.
RSUs
The following table presents a summary of the activity for our RSUs:
Restricted Stock Units
Numberof Shares
(in Thousands)
WeightedAverage
Fair ValuePer Share
Unvested at September 30, 2018 — $ — Granted 88 18.14 Vested (80) 18.14 Forfeited (8) 18.14
Unvested at September 30, 2019 — $ —
At September 30, 2019, all RSUs previously awarded have vested and there are no unrecognized compensation costs in connection therewith.
8. Goodwill and Intangible Assets
The changes in the carrying amounts of goodwill during the fiscal years 2019 and 2018 are as follows (in thousands): SBS BSG Total
Balance at September 30, 2017 $ 82,670 $ 455,121 $ 537,791 Acquisitions 329 716 1,045 Foreign currency translation (1,782) (1,129) (2,911)Balance at September 30, 2018 $ 81,217 $ 454,708 $ 535,925 Acquisitions 284 — 284 Foreign currency translation (4,596) (827) (5,423)Balance at September 30, 2019 $ 76,905 $ 453,881 $ 530,786
F-18

Sally Beauty Holdings, Inc. and SubsidiariesNotes to Consolidated Financial Statements
Fiscal Years ended September 30, 2019, 2018 and 2017 The following table reflects our other intangible assets, excluding goodwill, on our consolidated balance sheets. Once an intangible becomes fully amortized, the originalcost and accumulated amortization is removed in the subsequent period. In the table below, prior year amounts for definite-lived intangible assets have been conformed tothe current year’s presentation. As of September 30, 2019 and 2018, we had the following (in thousands):
September 30, 2019 September 30, 2018
Gross Carrying
Amount AccumulatedAmortization Net
Gross CarryingAmount
AccumulatedAmortization Net
Definite-lived Intangible assets: Customer relationships $ 43,752 $ (33,192) $ 10,560 $ 58,133 $ (41,055) $ 17,078 Distribution rights 33,364 (27,477) 5,887 40,280 (32,080) 8,200 Other intangible assets 6,457 (3,946) 2,511 8,956 (5,779) 3,177
Total definite-lived intangible assets 83,573 (64,615) 18,958 107,369 (78,914) 28,455 Indefinite-lived Intangible assets: Trade names 43,093 — 43,093 44,243 — 44,243 Total intangible assets, excluding goodwill, net $ 126,666 $ (64,615) $ 62,051 $ 151,612 $ (78,914) $ 72,698
Our definite-lived intangible assets are amortized on a straight-line basis over the period that we expected an economic benefit, typically over periods of three to tenyears. For the fiscal years ended September 30, 2019, 2018 and 2017, amortization expense related to intangible assets totaled $11.3 million, $11.7 million and $13.1million, respectively.
As of September 30, 2019, the expected future amortization expense related to definite-lived intangible assets is as follows (in thousands):
Fiscal Year: 2020 $ 8,669 2021 5,028 2022 2,569 2023 1,472 2024 555 Thereafter 665 $ 18,958
9. Accrued Liabilities
Accrued liabilities consist of the following (in thousands): September 30, 2019 2018
Compensation and benefits $ 63,005 $ 61,182 Deferred revenue 18,165 18,450 Interest payable 17,951 23,008 Rental obligations 11,670 12,129 Insurance reserves 4,567 4,816 Property and other taxes 3,869 4,607 Loss contingency obligation — 14,294 Operating accruals and other 49,827 41,801 Total accrued liabilities $ 169,054 $ 180,287
F-19

Sally Beauty Holdings, Inc. and SubsidiariesNotes to Consolidated Financial Statements
Fiscal Years ended September 30, 2019, 2018 and 2017 10. Commitments and Contingencies
Commitments
Leases
Our leases relate primarily to retail stores and warehousing properties. At September 30, 2019, future minimum payments, excluding amounts related taxes, insurance,maintenance and special assessments, under non-cancelable operating leases are as follows (in thousands):
Fiscal Year: 2020 $ 174,578 2021 136,900 2022 95,918 2023 61,944 2024 33,803 Thereafter 40,545
$ 543,688
Certain of our leases include payments of contingent rent based on a percentage of sales, renewal options and escalation clauses. Contingent rentals were not material forany fiscal years presented. Aggregate rental expense for all operating leases amounted to $250.4 million, $249.8 million and $242.0 million for the fiscal years 2019,2018 and 2017, respectively.
Letters of Credit
We had $18.0 million and $18.7 million of outstanding letters of credit as of September 30, 2019 and 2018, respectively.
Contingencies
Legal Proceedings
The Company is, from time to time, involved in various claims and lawsuits incidental to the conduct of its business in the ordinary course. We do not believe that theultimate resolution of these matters will have a material adverse impact on our consolidated financial position, results of operations or cash flows.
Data Security Incidents
As previously disclosed, we experienced data security incidents during the fiscal years 2014 and 2015 (together, the “data security incidents”). The data security incidentsinvolved the unauthorized installation of malicious software (“malware”) on our information technology systems, including our point-of-sale systems that may haveplaced at risk certain payment card data for some transactions. The costs that we have incurred to date in connection with the data security incidents include assessmentsby payment card networks, professional advisory fees and legal fees relating to investigating and remediating the data security incidents.
During the fiscal year 2017, we entered into agreement pursuant to which all existing claims and assessments by certain payment card networks were settled. We receivedan assessment from another payment card network during fiscal year 2018 in connection with the data security incidents and recognized $7.9 million of expenses. Theassessment was based on the network’s claims against our acquiring banks for costs that it asserts its issuing banks incurred in connection with the data security incidents,including incremental counterfeit fraud losses and non-ordinary course operating expenses, such as card reissuance costs. As of September 30, 2018, we had a $14.3million loss contingency liability related to the data security incidents. During the fiscal year 2019, we paid the full amount of the assessment, and, we believe that, wehave no remaining liability related to the data security incidents.
Liabilities for loss contingencies, arising from claims, assessments, litigation, fines, penalties, the data security incidents and other sources, are recorded when it isprobable that a liability has been incurred and the amount of the assessment can be reasonably estimated. We have no significant liabilities for loss contingencies atSeptember 30, 2019 and 2018, except as disclosed above.
F-20
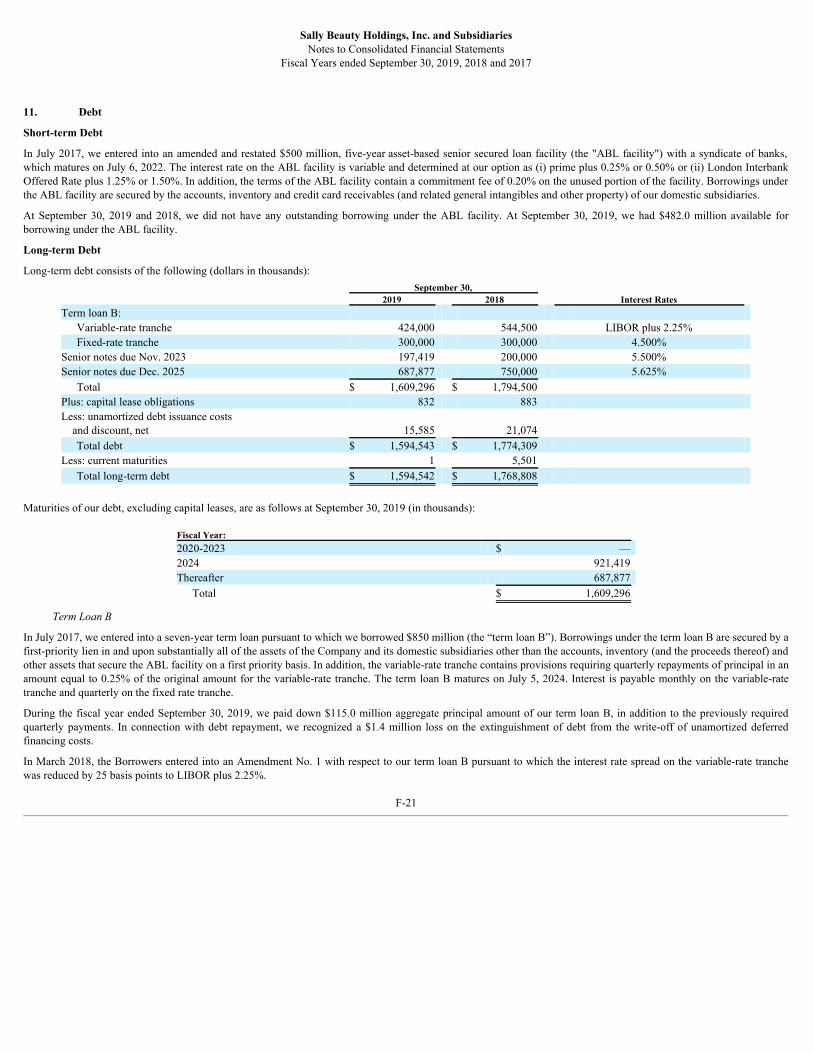
Sally Beauty Holdings, Inc. and SubsidiariesNotes to Consolidated Financial Statements
Fiscal Years ended September 30, 2019, 2018 and 2017
11. Debt
Short-term Debt
In July 2017, we entered into an amended and restated $500 million, five-year asset-based senior secured loan facility (the "ABL facility") with a syndicate of banks,which matures on July 6, 2022. The interest rate on the ABL facility is variable and determined at our option as (i) prime plus 0.25% or 0.50% or (ii) London InterbankOffered Rate plus 1.25% or 1.50%. In addition, the terms of the ABL facility contain a commitment fee of 0.20% on the unused portion of the facility. Borrowings underthe ABL facility are secured by the accounts, inventory and credit card receivables (and related general intangibles and other property) of our domestic subsidiaries.
At September 30, 2019 and 2018, we did not have any outstanding borrowing under the ABL facility. At September 30, 2019, we had $482.0 million available forborrowing under the ABL facility.
Long-term Debt
Long-term debt consists of the following (dollars in thousands): September 30, 2019 2018 Interest Rates
Term loan B: Variable-rate tranche 424,000 544,500 LIBOR plus 2.25% Fixed-rate tranche 300,000 300,000 4.500%
Senior notes due Nov. 2023 197,419 200,000 5.500% Senior notes due Dec. 2025 687,877 750,000 5.625%
Total $ 1,609,296 $ 1,794,500 Plus: capital lease obligations 832 883 Less: unamortized debt issuance costs and discount, net 15,585 21,074
Total debt $ 1,594,543 $ 1,774,309 Less: current maturities 1 5,501
Total long-term debt $ 1,594,542 $ 1,768,808
Maturities of our debt, excluding capital leases, are as follows at September 30, 2019 (in thousands):
Fiscal Year: 2020-2023 $ — 2024 921,419 Thereafter 687,877
Total $ 1,609,296
Term Loan B
In July 2017, we entered into a seven-year term loan pursuant to which we borrowed $850 million (the “term loan B”). Borrowings under the term loan B are secured by afirst-priority lien in and upon substantially all of the assets of the Company and its domestic subsidiaries other than the accounts, inventory (and the proceeds thereof) andother assets that secure the ABL facility on a first priority basis. In addition, the variable-rate tranche contains provisions requiring quarterly repayments of principal in anamount equal to 0.25% of the original amount for the variable-rate tranche. The term loan B matures on July 5, 2024. Interest is payable monthly on the variable-ratetranche and quarterly on the fixed rate tranche.
During the fiscal year ended September 30, 2019, we paid down $115.0 million aggregate principal amount of our term loan B, in addition to the previously requiredquarterly payments. In connection with debt repayment, we recognized a $1.4 million loss on the extinguishment of debt from the write-off of unamortized deferredfinancing costs.
In March 2018, the Borrowers entered into an Amendment No. 1 with respect to our term loan B pursuant to which the interest rate spread on the variable-rate tranchewas reduced by 25 basis points to LIBOR plus 2.25%.
F-21
Sally Beauty Holdings, Inc. and SubsidiariesNotes to Consolidated Financial Statements
Fiscal Years ended September 30, 2019, 2018 and 2017
Senior Notes
The senior notes due 2023 and the senior notes due 2025, which we refer to collectively as “the senior notes due 2023 and 2025,” are unsecured obligations that arejointly and severally guaranteed by Sally Beauty Holdings, Inc. and Sally Investment, and by each material domestic subsidiary. Interest on the senior notes due 2023 and2025 is payable semi-annually, during our first and third fiscal quarters. Please see Note 17 for certain condensed financial statement data pertaining to Sally BeautyHoldings, Inc., the Issuers, the guarantor subsidiaries and the non-guarantor subsidiaries.
During the fiscal year ended September 30, 2019, we repurchased $62.2 million of our senior notes due 2025 at a weighted-average price of 98.1% and $2.6 million ofour senior notes due 2023 at par. As a result, we recognized a $0.5 million gain on the extinguishment of debt, including a gain of approximately $1.2 million from thediscount paid under the face value of the accepted 2025 Notes and the write-off of $0.7 million in unamortized deferred financing costs.
Covenants
The agreements governing our ABL facility, term loan B and the senior notes due 2023 and 2025 contain a customary covenant package that places restrictions on thedisposition of assets, the granting of liens and security interests, the prepayment of certain indebtedness, and other matters and customary events of default, includingcustomary cross-default and/or cross-acceleration provisions. As of September 30, 2019, we are in compliance with all debt covenants and all the net assets of ourconsolidated subsidiaries were unrestricted from transfer.
12. Derivative Instruments
As of September 30, 2019, we did not purchase or hold any derivative instruments for trading or speculative purposes. See note 4 for the classification and fair value ofour derivative instruments.
Designated Cash Flow Hedges
Foreign Currency Forwards
During the fiscal year ended September 30, 2019, we entered into foreign currency forwards to mitigate the exposure to exchange rate changes on inventory purchases inUSD by our foreign subsidiaries over fiscal year 2019. As of September 30, 2019, all of our foreign currency forward derivatives instruments had settled. We record, netof income tax, the changes in fair value related to the foreign currency forwards into AOCL and recognize realized gain or loss into cost of goods sold based on inventoryturns. As of September 30, 2019 exchange rates, we expect to reclassify approximately $0.3 million into cost of goods sold over the next 12 months.
During the fiscal year ended September 30, 2019, we reclassified $0.7 million of net losses into cost of goods sold.
Interest Rate Caps
In July 2017, we purchased two interest rate caps with an initial aggregate notional amount of $550 million (the “interest rate caps”). The interest rate caps are made up ofindividual caplets that expire monthly through June 30, 2023 and are designated as cash flow hedges.
During the fiscal year ended September 30, 2019, we dedesignated one interest rate cap and terminated $115.0 million in notional amount, concurrent with the repaymentof $115.0 million of the term loan B variable tranche. Subsequently, we redesignated the remaining notional amounts of the interest rate cap. Once we determined thehedged transaction related to $115.0 million of the term loan B variable tranche principal was probable not to occur, we reclassified a loss of $1.2 million from AOCLinto interest expense. Furthermore, changes in fair value of the remaining hedged interest rate caps are recorded quarterly, net of income tax, and are included in AOCL.Over the next 12 months, we expect to reclassify approximately $0.6 million into interest expense, which represents the original value of the expiring caplets.
F-22

Sally Beauty Holdings, Inc. and SubsidiariesNotes to Consolidated Financial Statements
Fiscal Years ended September 30, 2019, 2018 and 2017 During the fiscal year ended September 30, 2019, we reclassified $1.6 million, which includes the $1.2 million loss, out of AOCI into interest expense.
Non-Designated Cash Flow Hedges
During the fiscal years ended September 30, 2018 and 2017, we used foreign currency forwards to mitigate the exposure to exchange rate changes on inventory purchasesin USD by our foreign subsidiaries. We did not have any material non-designated foreign currency forwards during fiscal year 2019. During the fiscal years endedSeptember 30, 2018 and 2017, we recognized a gain of $1.6 million and a loss of $2.8 million, respectively, into selling, general and administrative expenses.
13. 401(k) and Profit Sharing Plan
We offer 401(k) Plans to our U.S. and Puerto Rico employees who meet certain eligibility requirements. The U.S. 401(k) Plan allows employees to contributeimmediately upon hire, while the Puerto Rico 401(k) Plan allows employees to contribute after one year of employment. Under the terms of each 401(k) Plan, employeesmay contribute a percentage of their annual compensation up to certain maximums, as defined by each 401(k) Plan and by statutory limitations. We currently match aportion of employee contributions, as defined by each 401(k) Plan. We recognized expense of $6.2 million, $6.5 million and $7.1 million in the fiscal years endedSeptember 30, 2019, 2018 and 2017, respectively, related to such matching contributions and these amounts are included in selling, general and administrative expensesin our consolidated statements of earnings.
In addition, pursuant to the 401(k) Plans, we may elect to make voluntary profit sharing contributions to the accounts of eligible employees as determined by theCompensation Committee of the Board. During the fiscal years ended September 30, 2019, 2018 and 2017, we did not make a profit sharing contribution to the 401(k)Plans.
14. Income Taxes
On December 22, 2017, the U.S. enacted comprehensive amendments to the Internal Revenue Code of 1986 (“U.S. Tax Reform”). Among other things, U.S. Tax Reform(a) reduced the federal statutory tax rate for corporate taxpayers, (b) provided for a deemed repatriation of undistributed foreign earnings by U.S. taxpayers and madeother fundamental changes on how foreign earnings will be taxed by the U.S. and (c) otherwise modified corporate tax rules in significant ways.
Also in December 2017, the SEC issued Staff Accounting Bulletin No. 118 (“SAB 118”) which provided guidance allowing registrants to record provisional amounts,during a specified measurement period, when the necessary information is not available, prepared or analyzed in reasonable detail to account for the impact of U.S. TaxReform. We have completed our analysis on our provisional calculations within the measurement period provided by SAB 118. As a result, we identified certainimmaterial adjustments to our provisional calculations, including a benefit of $3 million related to the transition tax on unremitted earnings of our foreign operations.
The U.S. Treasury Department has issued final regulations covering the one-time transition tax on unrepatriated foreign earnings, which was enacted as part of U.S TaxReform. Certain guidance included in these final regulations is inconsistent with our interpretation of the enacted tax law that led to the recognition of a $2.5 millionbenefit in the first quarter of the current fiscal year. Notwithstanding this inconsistency, we remain confident in our interpretation of the Internal Revenue Code andintend to defend this position through litigation, if necessary. However, if we are ultimately unsuccessful in defending our position, we may be required to reverse thebenefit.
Beginning with our first quarter of fiscal year 2019, we are subject to taxation on global intangible low-taxed income (“GILTI”) earned by certain foreign subsidiaries.We have made the policy election to record this tax as a period cost at the time it is incurred. The impact from GILTI was immaterial for fiscal year 2019.
F-23
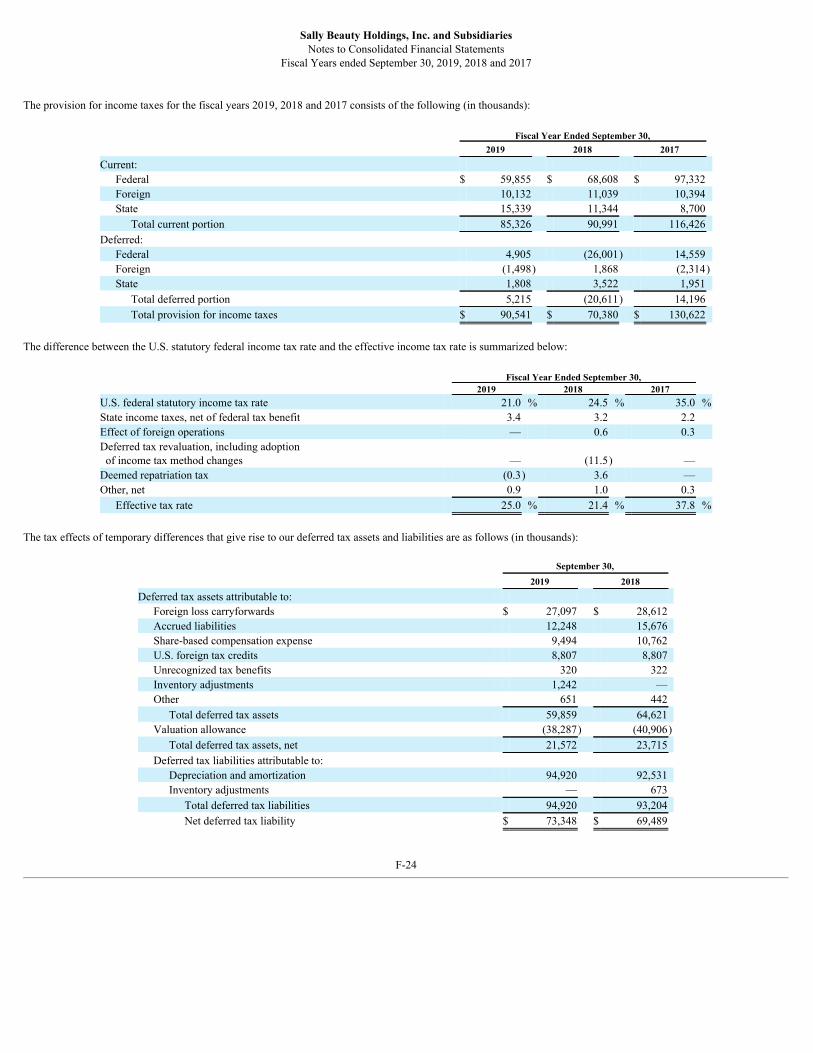
Sally Beauty Holdings, Inc. and SubsidiariesNotes to Consolidated Financial Statements
Fiscal Years ended September 30, 2019, 2018 and 2017
The provision for income taxes for the fiscal years 2019, 2018 and 2017 consists of the following (in thousands):
Fiscal Year Ended September 30, 2019 2018 2017
Current: Federal $ 59,855 $ 68,608 $ 97,332 Foreign 10,132 11,039 10,394 State 15,339 11,344 8,700
Total current portion 85,326 90,991 116,426 Deferred:
Federal 4,905 (26,001) 14,559 Foreign (1,498) 1,868 (2,314)State 1,808 3,522 1,951
Total deferred portion 5,215 (20,611) 14,196 Total provision for income taxes $ 90,541 $ 70,380 $ 130,622
The difference between the U.S. statutory federal income tax rate and the effective income tax rate is summarized below:
Fiscal Year Ended September 30, 2019 2018 2017 U.S. federal statutory income tax rate 21.0 % 24.5 % 35.0 %State income taxes, net of federal tax benefit 3.4 3.2 2.2 Effect of foreign operations — 0.6 0.3 Deferred tax revaluation, including adoption of income tax method changes — (11.5) — Deemed repatriation tax (0.3) 3.6 — Other, net 0.9 1.0 0.3
Effective tax rate 25.0 % 21.4 % 37.8 % The tax effects of temporary differences that give rise to our deferred tax assets and liabilities are as follows (in thousands):
September 30, 2019 2018
Deferred tax assets attributable to: Foreign loss carryforwards $ 27,097 $ 28,612 Accrued liabilities 12,248 15,676 Share-based compensation expense 9,494 10,762 U.S. foreign tax credits 8,807 8,807 Unrecognized tax benefits 320 322 Inventory adjustments 1,242 — Other 651 442
Total deferred tax assets 59,859 64,621 Valuation allowance (38,287) (40,906)
Total deferred tax assets, net 21,572 23,715 Deferred tax liabilities attributable to:
Depreciation and amortization 94,920 92,531 Inventory adjustments — 673
Total deferred tax liabilities 94,920 93,204 Net deferred tax liability $ 73,348 $ 69,489
F-24

Sally Beauty Holdings, Inc. and SubsidiariesNotes to Consolidated Financial Statements
Fiscal Years ended September 30, 2019, 2018 and 2017 We believe that it is more-likely-than-not that the results of future operations will generate sufficient taxable income to realize the deferred tax assets, net of the valuationallowance. We have recorded a valuation allowance to account for uncertainties regarding recoverability of certain deferred tax assets, primarily foreign loss carry-forwards.
Domestic earnings before provision for income taxes were $328.3 million, $300.4 million and $332.5 million in the fiscal years 2019, 2018 and 2017, respectively.Foreign operations had earnings before provision for income taxes of $33.9 million, $28.0 million and $13.2 million in the fiscal years 2019, 2018 and 2017, respectively.
Tax reserves are evaluated and adjusted as appropriate, while taking into account the progress of audits by various taxing jurisdictions and other changes in relevant factsand circumstances evident at each balance sheet date. We do not expect the outcome of current or future tax audits to have a material adverse effect on our consolidatedfinancial condition, results of operations or cash flow.
As of September 30, 2019, no deferred taxes have been provided on the accumulated undistributed earnings of our foreign operations beyond the amounts recorded fordeemed repatriation of such earnings, as required by U.S. Tax Reform. An actual repatriation of earnings from our foreign operations could still be subject to additionalforeign withholding taxes and U.S. state taxes. Based upon evaluation of our foreign operations, undistributed earnings are intended to remain permanently reinvested tofinance anticipated future growth and expansion, and accordingly, deferred taxes have not been provided. If undistributed earnings of our foreign operations were notconsidered permanently reinvested as of September 30, 2019, an immaterial amount of additional deferred taxes would have been provided.
At September 30, 2019 and 2018, we had total operating loss carry-forwards of $97.3 million and $103.0 million, respectively, of which $79.0 million and $88.6 million,respectively, are subject to a valuation allowance. At September 30, 2019, operating loss carry-forwards of $7.7 million expire between 2020 and 2031 and operating losscarry-forwards of $89.5 million have no expiration date. At September 30, 2019 and 2018, we had tax credit carry-forwards of $11.2 million and $11.6 million,respectively, This includes a U.S. foreign tax credit carry-forward of $8.8 million as a result of the deemed repatriation tax under U.S. Tax Reform. This credit expires in2028. We do not believe the realization of the U.S. foreign tax credit is more likely than not, so a valuation allowance has been recorded against its full value. Of theremaining tax credit carry-forwards, at September 30, 2019, $1.1 million expire between 2025 and 2028, and $1.3 million have no expiration date. Total tax credit carry-forwards of $10.1 million and $10.2 million are subject to a valuation allowance at September 30, 2019 and 2018, respectively.
The changes in the amount of unrecognized tax benefits are as follows (in thousands):
Fiscal Year Ended September 30, 2019 2018 Balance at beginning of the fiscal year $ 1,368 $ 1,467 Increases related to prior year tax positions — — Decreases related to prior year tax positions (4) (3)Increases related to current year tax positions 954 309 Lapse of statute (318) (405)
Balance at end of fiscal year $ 2,000 $ 1,368
If recognized, these positions would affect our effective tax rate.
We recognize interest and penalties, accrued in connection with unrecognized tax benefits, in provision for income taxes. Accrued interest and penalties, in the aggregate,were $0.2 million at September 30, 2019 and 2018.
Because existing tax positions will continue to generate increased liabilities for unrecognized tax benefits over the next 12 months, and the fact that from time to time ourtax returns are routinely under audit by various taxing authorities, it is reasonably possible that the amount of unrecognized tax benefits will change during the next12 months. An estimate of the amount of such change, or a range thereof, cannot reasonably be made at this time.
F-25
Sally Beauty Holdings, Inc. and SubsidiariesNotes to Consolidated Financial Statements
Fiscal Years ended September 30, 2019, 2018 and 2017
However, we do not expect the change, if any, to have a material effect on our consolidated financial condition or results of operations within the next 12 months. Our consolidated federal income tax return for the fiscal year ended September 30, 2018 is currently under IRS examination. Our statute remains open for the fiscal yearended September 30, 2015 forward. Our U.S. state and foreign income tax returns are impacted by various statutes of limitations, which are generally open from 2014forward.
15. Acquisitions
In the fiscal year ended September 30, 2018, we acquired certain assets and business operations of H. Chalut, Ltee. (“Chalut”), a distributor of beauty products with 21stores operating in the province of Quebec, Canada, for approximately $8.8 million. This acquisition was accounted for using the acquisition method of accounting forbusiness combinations and funded by cash from operations and borrowing under the ABL facility. The results of operations of Chalut are included in our BSG reportablesegment subsequent to the acquisition date. We recorded intangible assets subject to amortization of $4.7 million and goodwill of $0.7 million, which is expected to bedeductible for tax purposes, in connection with this acquisition. The goodwill in connection with the acquisition was assigned to our BSG reportable segment. Theacquisition of Chalut was not material to the results of operations.
For the fiscal years ended September 30, 2019 and 2017, we did not acquire any substantial businesses.
16. Segments and Disaggregated Revenue
Our segments are defined on how our chief operating decision maker, which we consider the Chief Executive Officer and Chief Financial Officer together, regularlyreviews performance and allocates resources to our operating segments, which relies on internal management reporting. We then aggregate operating segments based onthe nature of the customer base and method used to distribute products into reportable segments.
Our business is organized into two reportable segments: (i) SBS, a domestic and international chain of retail stores and a consumer-facing e-commerce website that offersprofessional beauty supplies to both salon professionals and retail customers primarily in North America, Puerto Rico, and parts of Europe and South America and (ii)BSG, including its franchise-based business Armstrong McCall, a full service distributor of beauty products and supplies that offers professional beauty products directlyto salons and salon professionals through its professional-only stores, e-commerce platforms and its own sales force in partially exclusive geographical territories in theU.S. and Canada.
The accounting policies of both of our reportable segments are the same as described in the summary of significant accounting policies contained in Note 2. Salesbetween segments, which were eliminated in consolidation, were not material for the fiscal years ended September 30, 2019, 2018 and 2017.
F-26

Sally Beauty Holdings, Inc. and SubsidiariesNotes to Consolidated Financial Statements
Fiscal Years ended September 30, 2019, 2018 and 2017
Business Segments Information
Segment data for the fiscal years 2019, 2018 and 2017 are as follows (in thousands):
2019 2018 2017 Net sales (for the fiscal year indicated):
SBS $ 2,293,094 $ 2,333,838 $ 2,345,116 BSG 1,583,317 1,598,727 1,593,201
Total $ 3,876,411 $ 3,932,565 $ 3,938,317 Earnings before provision for income taxes: Segment operating earnings:
SBS $ 366,412 $ 362,853 $ 385,407 BSG 239,572 240,225 254,691
Segment operating earnings 605,984 603,078 640,098 Unallocated expenses (148,193) (142,874) (138,822)Restructuring 682 (33,615) (22,679)
Consolidated operating earnings 458,473 426,589 478,597 Interest expense (96,309) (98,162) (132,899)
Earnings before provision for income taxes $ 362,164 $ 328,427 $ 345,698 Depreciation and amortization:
SBS $ 65,561 $ 64,017 $ 63,427 BSG 28,568 29,733 31,755 Corporate 13,529 15,079 17,141
Total $ 107,658 $ 108,829 $ 112,323 Payments for property and equipment:
SBS $ 69,802 $ 46,289 $ 52,178 BSG 18,997 16,598 19,335 Corporate 18,956 23,620 18,153
Total $ 107,755 $ 86,507 $ 89,666 Total assets (as of September 30):
SBS $ 973,304 $ 995,546 $ 1,025,545 BSG 1,012,336 993,122 964,984
Sub-total 1,985,640 1,988,668 1,990,529 Corporate 112,806 108,746 108,478
Total $ 2,098,446 $ 2,097,414 $ 2,099,007
Unallocated expenses consist of corporate and shared costs and are included in selling, general and administrative expenses in our consolidated statements ofearnings. In the fiscal years 2019, 2018, and 2017, no single customer accounted for 10% or more of revenue.
F-27

Sally Beauty Holdings, Inc. and SubsidiariesNotes to Consolidated Financial Statements
Fiscal Years ended September 30, 2019, 2018 and 2017
Geographic Area Information
Certain geographic data is as follows (in thousands):
2019 2018 2017 Net sales (for the fiscal year indicated):
United States $ 3,169,821 $ 3,188,993 $ 3,248,662 Other countries 706,590 743,572 689,655
Total $ 3,876,411 $ 3,932,565 $ 3,938,317 Long-lived assets (as of September 30):
United States $ 259,815 $ 234,475 $ 230,698 United Kingdom 24,476 29,493 32,771 Other countries 35,337 44,389 50,248
Total $ 319,628 $ 308,357 $ 313,717
Disaggregated Revenues
The following tables disaggregate our segment revenues by merchandise category:
Fiscal Year Ended September 30, SBS 2019 2018 2017 Hair color 29.4% 26.9% 26.0%Hair care 20.4% 20.9% 21.1%Skin and nail care 14.8% 15.7% 15.7%Styling tools 13.5% 13.9% 14.1%Multicultural products 7.1% 7.5% 7.9%Salon supplies and accessories 6.6% 7.1% 7.3%Other beauty items 8.2% 8.0% 7.9%
Total 100.0% 100.0% 100.0%
Fiscal Year Ended September 30, BSG 2019 2018 2017 Hair color 39.5% 38.4% 37.0%Hair care 35.1% 33.7% 34.4%Skin and nail care 8.1% 8.7% 9.0%Styling tools 3.4% 3.9% 4.2%Other beauty items 6.3% 6.7% 6.9%Promotional items 7.6% 8.6% 8.5%
Total 100.0% 100.0% 100.0%
The following table disaggregates our segment revenue by sales channels:
SBS BSG Fiscal Year Ended September 30, Fiscal Year Ended September 30, 2019 2018 2017 2019 2018 2017
Company-operated stores 96.9% 97.5% 98.1% 69.4% 68.7% 68.4%E-commerce 2.8% 2.2% 1.6% 4.8% 3.7% 3.3%Franchise stores 0.3% 0.3% 0.3% 7.6% 7.7% 7.7%Distributor sales consultants — — — 18.2% 19.9% 20.6%Total 100.0% 100.0% 100.0% 100.0% 100.0% 100.0%
F-28

Sally Beauty Holdings, Inc. and SubsidiariesNotes to Consolidated Financial Statements
Fiscal Years ended September 30, 2019, 2018 and 2017
17. Separate Financial Information of Guarantor Subsidiaries
Certain 100% wholly owned domestic subsidiaries (“guarantor subsidiaries”), as defined in our credit agreements, of Sally Beauty serve as guarantors to the ABL facility,term loan B and senior notes due 2023 and 2025. The guarantees related to these debt instruments are full and unconditional, joint and several and have certainrestrictions on the ability to pay restricted payments to Sally Beauty Holdings, Inc. (“parent”). Certain other subsidiaries, including our foreign subsidiaries, do not serveas guarantors (“non-guarantor subsidiaries”).
The following condensed consolidating financial information represents financial information for (i) parent, (ii) Sally Holdings and Sally Capital Inc., (iii) the guarantorsubsidiaries; (iv) the non-guarantor subsidiaries, (v) elimination entries necessary for consolidation purposes, and (vi) Sally Beauty on a consolidated basis.
F-29

Sally Beauty Holdings, Inc. and SubsidiariesNotes to Consolidated Financial Statements
Fiscal Years ended September 30, 2019, 2018 and 2017
Condensed Consolidating Balance SheetSeptember 30, 2019
(In thousands)
Parent
SallyHoldings LLC
and SallyCapital Inc.
GuarantorSubsidiaries
Non-Guarantor
Subsidiaries ConsolidatingEliminations
Sally BeautyHoldings,Inc. and
Subsidiaries Assets Cash and cash equivalents $ — $ 10 $ 41,009 $ 30,476 $ — $ 71,495 Trade and other accounts receivable, net — — 65,746 38,793 — 104,539 Due from affiliates — — 2,878,072 — (2,878,072) — Inventory — — 722,830 230,077 — 952,907 Other current assets 1,436 132 22,480 10,564 — 34,612 Property and equipment, net 6 — 258,132 61,490 — 319,628 Investment in subsidiaries 1,621,843 4,374,334 385,629 — (6,381,806) — Goodwill and other intangible assets, net — — 452,645 140,192 — 592,837 Other assets 1,446 3,499 (581) 18,064 — 22,428
Total assets $ 1,624,731 $ 4,377,975 $ 4,825,962 $ 529,656 $ (9,259,878) $ 2,098,446 Liabilities and Stockholders’ (Deficit) Equity Accounts payable $ 48 $ — $ 235,940 $ 42,700 $ — $ 278,688 Due to affiliates 1,672,322 1,142,324 — 63,426 (2,878,072) — Accrued liabilities 188 17,937 121,375 29,554 — 169,054 Income taxes payable 6,055 2,161 1 119 — 8,336 Long-term debt — 1,593,710 1 832 — 1,594,543 Other liabilities 6,441 — 17,639 3,677 — 27,757 Deferred income tax liabilities, net — — 76,672 3,719 — 80,391
Total liabilities 1,685,054 2,756,132 451,628 144,027 (2,878,072) 2,158,769 Total stockholders’ (deficit) equity (60,323) 1,621,843 4,374,334 385,629 (6,381,806) (60,323)Total liabilities and stockholders’ (deficit) equity $ 1,624,731 $ 4,377,975 $ 4,825,962 $ 529,656 $ (9,259,878) $ 2,098,446
F-30
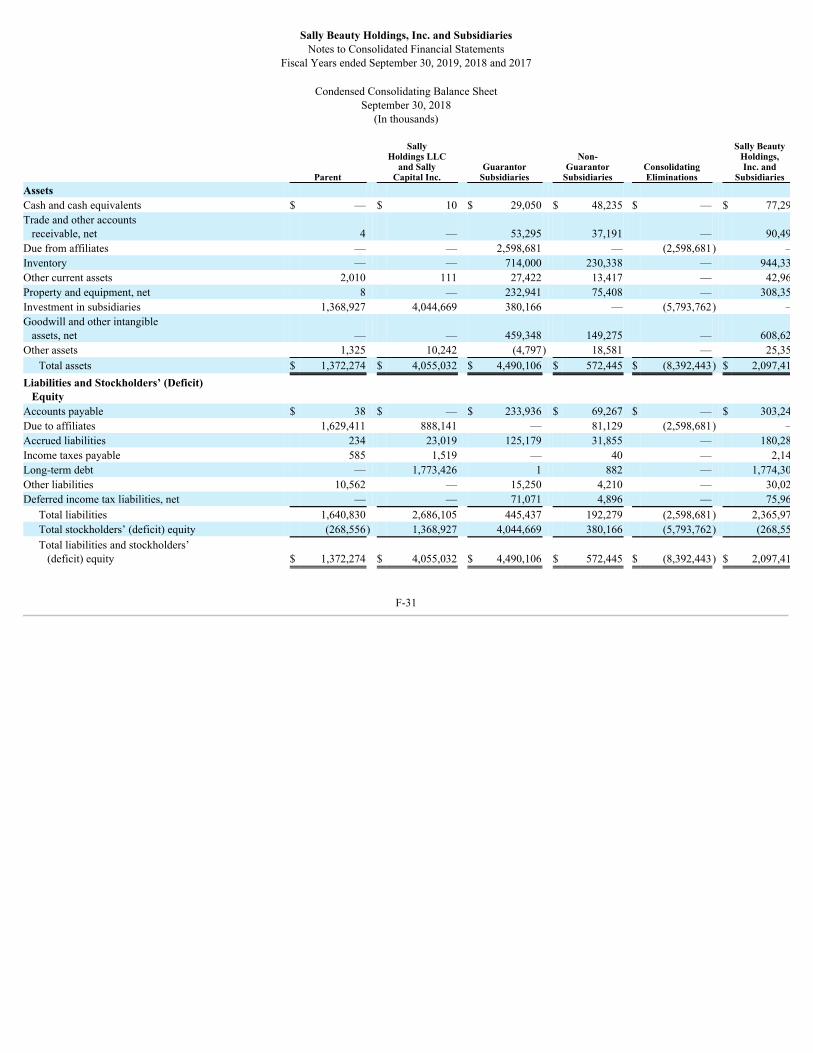
Sally Beauty Holdings, Inc. and SubsidiariesNotes to Consolidated Financial Statements
Fiscal Years ended September 30, 2019, 2018 and 2017
Condensed Consolidating Balance SheetSeptember 30, 2018
(In thousands)
Parent
SallyHoldings LLC
and SallyCapital Inc.
GuarantorSubsidiaries
Non-Guarantor
Subsidiaries ConsolidatingEliminations
Sally BeautyHoldings,Inc. and
Subsidiaries Assets Cash and cash equivalents $ — $ 10 $ 29,050 $ 48,235 $ — $ 77,295 Trade and other accounts receivable, net 4 — 53,295 37,191 — 90,490 Due from affiliates — — 2,598,681 — (2,598,681) — Inventory — — 714,000 230,338 — 944,338 Other current assets 2,010 111 27,422 13,417 — 42,960 Property and equipment, net 8 — 232,941 75,408 — 308,357 Investment in subsidiaries 1,368,927 4,044,669 380,166 — (5,793,762) — Goodwill and other intangible assets, net — — 459,348 149,275 — 608,623 Other assets 1,325 10,242 (4,797) 18,581 — 25,351
Total assets $ 1,372,274 $ 4,055,032 $ 4,490,106 $ 572,445 $ (8,392,443) $ 2,097,414 Liabilities and Stockholders’ (Deficit) Equity Accounts payable $ 38 $ — $ 233,936 $ 69,267 $ — $ 303,241 Due to affiliates 1,629,411 888,141 — 81,129 (2,598,681) — Accrued liabilities 234 23,019 125,179 31,855 — 180,287 Income taxes payable 585 1,519 — 40 — 2,144 Long-term debt — 1,773,426 1 882 — 1,774,309 Other liabilities 10,562 — 15,250 4,210 — 30,022 Deferred income tax liabilities, net — — 71,071 4,896 — 75,967
Total liabilities 1,640,830 2,686,105 445,437 192,279 (2,598,681) 2,365,970 Total stockholders’ (deficit) equity (268,556) 1,368,927 4,044,669 380,166 (5,793,762) (268,556)Total liabilities and stockholders’ (deficit) equity $ 1,372,274 $ 4,055,032 $ 4,490,106 $ 572,445 $ (8,392,443) $ 2,097,414
F-31

Sally Beauty Holdings, Inc. and SubsidiariesNotes to Consolidated Financial Statements
Fiscal Years ended September 30, 2019, 2018 and 2017
Condensed Consolidating Statement of Earnings and Comprehensive IncomeFiscal Year Ended September 30, 2019
(In thousands)
Parent
SallyHoldings LLC
and SallyCapital Inc.
GuarantorSubsidiaries
Non-Guarantor
Subsidiaries ConsolidatingEliminations
Sally BeautyHoldings,Inc. and
Subsidiaries Net sales $ — $ — $ 3,131,360 $ 745,051 $ — $ 3,876,411 Related party sales — — 2,201 — (2,201) — Cost of goods sold — — 1,568,663 399,407 (2,201) 1,965,869
Gross profit — — 1,564,898 345,644 — 1,910,542 Selling, general and administrative expenses 11,331 607 1,135,926 304,887 — 1,452,751 Restructuring — — (682) — — (682)
Operating earnings (loss) (11,331) (607) 429,654 40,757 — 458,473 Interest expense (income) — 96,464 5 (160) — 96,309
Earnings (loss) before provision for income taxes (11,331) (97,071) 429,649 40,917 — 362,164
Provision (benefit) for income taxes (2,742) (24,888) 109,230 8,941 — 90,541 Equity in earnings of subsidiaries, net of tax 280,212 352,395 31,976 — (664,583) —
Net earnings 271,623 280,212 352,395 31,976 (664,583) 271,623 Other comprehensive loss, net of tax — (4,566) — (22,730) — (27,296)
Total comprehensive income (loss) $ 271,623 $ 275,646 $ 352,395 $ 9,246 $ (664,583) $ 244,327
F-32

Sally Beauty Holdings, Inc. and SubsidiariesNotes to Consolidated Financial Statements
Fiscal Years ended September 30, 2019, 2018 and 2017
Condensed Consolidating Statement of Earnings and Comprehensive IncomeFiscal Year Ended September 30, 2018
(In thousands)
Parent
SallyHoldings LLC
and SallyCapital Inc.
GuarantorSubsidiaries
Non-Guarantor
Subsidiaries ConsolidatingEliminations
Sally BeautyHoldings,Inc. and
Subsidiaries Net sales $ — $ — $ 3,152,120 $ 780,445 $ — $ 3,932,565 Related party sales — — 2,294 — (2,294) — Cost of goods sold — — 1,581,385 409,061 (2,294) 1,988,152
Gross profit — — 1,573,029 371,384 — 1,944,413 Selling, general and administrative expenses 10,957 1,538 1,136,312 335,402 — 1,484,209 Restructuring — — 33,615 — — 33,615
Operating earnings (loss) (10,957) (1,538) 403,102 35,982 — 426,589 Interest expense (income) — 98,332 (3) (167) — 98,162
Earnings (loss) before provision for income taxes (10,957) (99,870) 403,105 36,149 — 328,427
Provision (benefit) for income taxes (2,734) (28,787) 73,747 28,154 — 70,380 Equity in earnings of subsidiaries, net of tax 266,270 337,353 7,995 — (611,618) —
Net earnings 258,047 266,270 337,353 7,995 (611,618) 258,047 Other comprehensive income (loss), net of tax — 2,449 — (10,604) — (8,155)
Total comprehensive income (loss) $ 258,047 $ 268,719 $ 337,353 $ (2,609) $ (611,618) $ 249,892
F-33

Sally Beauty Holdings, Inc. and SubsidiariesNotes to Consolidated Financial Statements
Fiscal Years ended September 30, 2019, 2018 and 2017
Condensed Consolidating Statement of Earnings and Comprehensive IncomeFiscal Year Ended September 30, 2017
(In thousands)
Parent
SallyHoldings LLC
and SallyCapital Inc.
GuarantorSubsidiaries
Non-Guarantor
Subsidiaries ConsolidatingEliminations
Sally BeautyHoldings,Inc. and
Subsidiaries Net sales $ — $ — $ 3,209,039 $ 729,278 $ — $ 3,938,317 Related party sales — — 2,501 — (2,501) — Cost of goods sold — — 1,590,184 385,739 (2,501) 1,973,422
Gross profit — — 1,621,356 343,539 — 1,964,895 Selling, general and administrative expenses 10,939 526 1,130,615 321,539 — 1,463,619 Restructuring — — 22,679 — — 22,679
Operating earnings (loss) (10,939) (526) 468,062 22,000 — 478,597 Interest expense — 132,696 6 197 — 132,899
Earnings (loss) before provision for income taxes (10,939) (133,222) 468,056 21,803 — 345,698
Provision (benefit) for income taxes (4,246) (51,726) 177,383 9,211 — 130,622 Equity in earnings of subsidiaries, net of tax 221,769 303,265 12,592 — (537,626) —
Net earnings 215,076 221,769 303,265 12,592 (537,626) 215,076 Other comprehensive income (loss), net of tax — (1,084) — 19,299 — 18,215
Total comprehensive income $ 215,076 $ 220,685 $ 303,265 $ 31,891 $ (537,626) $ 233,291
F-34
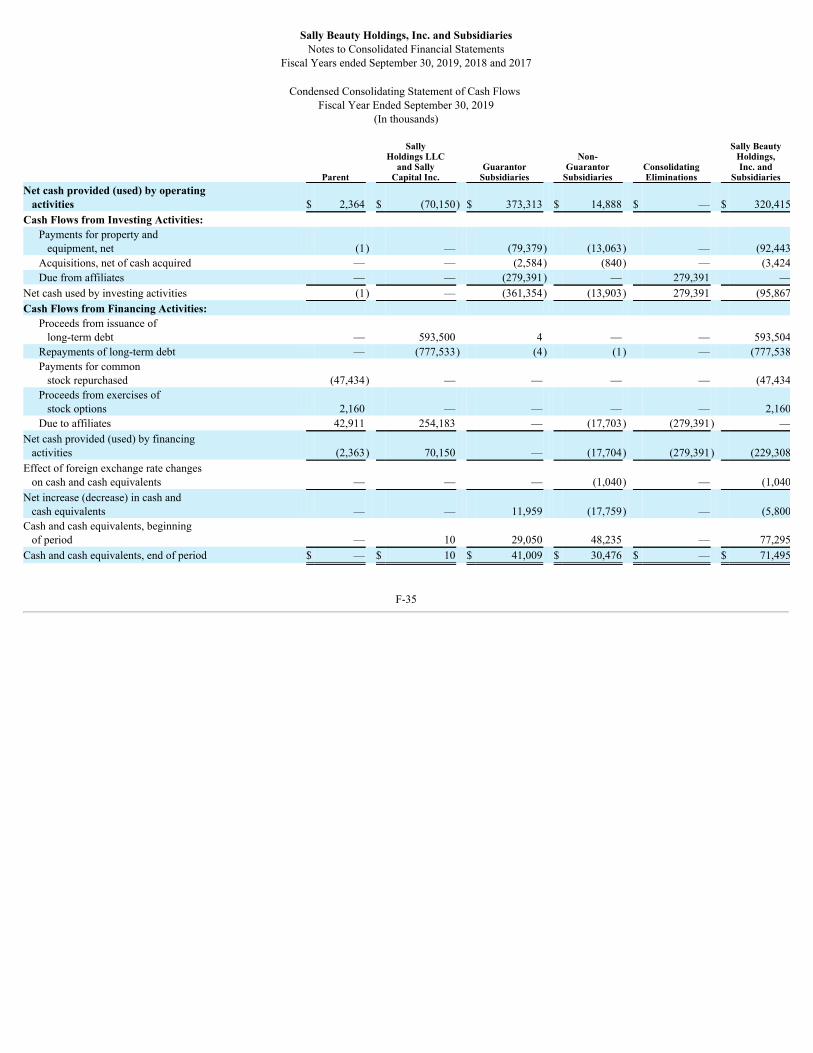
Sally Beauty Holdings, Inc. and SubsidiariesNotes to Consolidated Financial Statements
Fiscal Years ended September 30, 2019, 2018 and 2017
Condensed Consolidating Statement of Cash Flows Fiscal Year Ended September 30, 2019
(In thousands)
Parent
SallyHoldings LLC
and SallyCapital Inc.
GuarantorSubsidiaries
Non-Guarantor
Subsidiaries ConsolidatingEliminations
Sally BeautyHoldings,Inc. and
Subsidiaries Net cash provided (used) by operating activities $ 2,364 $ (70,150) $ 373,313 $ 14,888 $ — $ 320,415 Cash Flows from Investing Activities:
Payments for property and equipment, net (1) — (79,379) (13,063) — (92,443)Acquisitions, net of cash acquired — — (2,584) (840) — (3,424)Due from affiliates — — (279,391) — 279,391 —
Net cash used by investing activities (1) — (361,354) (13,903) 279,391 (95,867)Cash Flows from Financing Activities:
Proceeds from issuance of long-term debt — 593,500 4 — — 593,504 Repayments of long-term debt — (777,533) (4) (1) — (777,538)Payments for common stock repurchased (47,434) — — — — (47,434)Proceeds from exercises of stock options 2,160 — — — — 2,160 Due to affiliates 42,911 254,183 — (17,703) (279,391) —
Net cash provided (used) by financing activities (2,363) 70,150 — (17,704) (279,391) (229,308)Effect of foreign exchange rate changes on cash and cash equivalents — — — (1,040) — (1,040)Net increase (decrease) in cash and cash equivalents — — 11,959 (17,759) — (5,800)Cash and cash equivalents, beginning of period — 10 29,050 48,235 — 77,295 Cash and cash equivalents, end of period $ — $ 10 $ 41,009 $ 30,476 $ — $ 71,495
F-35

Sally Beauty Holdings, Inc. and SubsidiariesNotes to Consolidated Financial Statements
Fiscal Years ended September 30, 2019, 2018 and 2017
Condensed Consolidating Statement of Cash Flows Fiscal Year Ended September 30, 2018
(In thousands)
Parent
SallyHoldings LLC
and SallyCapital Inc.
GuarantorSubsidiaries
Non-Guarantor
Subsidiaries ConsolidatingEliminations
Sally BeautyHoldings,Inc. and
Subsidiaries Net cash provided (used) by operating activities $ 23,424 $ (62,948) $ 384,958 $ 27,227 $ — $ 372,661 Cash Flows from Investing Activities:
Payments for property and equipment, net — — (68,689) (17,449) — (86,138)Acquisitions, net of cash acquired — — — (9,175) — (9,175)Due from affiliates — — (309,310) — 309,310 —
Net cash used by investing activities — — (377,999) (26,624) 309,310 (95,313)Cash Flows from Financing Activities:
Proceeds from issuance of long-term debt — 461,814 5 — — 461,819 Repayments of long-term debt — (558,000) (4) (595) — (558,599)Debt issuance cost — (1,151) — — — (1,151)Payments for common stock repurchased (166,701) — — — — (166,701)Proceeds from exercises of stock options 1,350 — — — — 1,350 Due to affiliates 141,927 160,285 — 7,098 (309,310) —
Net cash provided (used) by financing activities (23,424) 62,948 1 6,503 (309,310) (263,282)Effect of foreign exchange rate changes on cash and cash equivalents — — — (530) — (530)Net increase in cash and cash equivalents — — 6,960 6,576 — 13,536 Cash and cash equivalents, beginning of period — 10 22,090 41,659 — 63,759 Cash and cash equivalents, end of period $ — $ 10 $ 29,050 $ 48,235 $ — $ 77,295
F-36
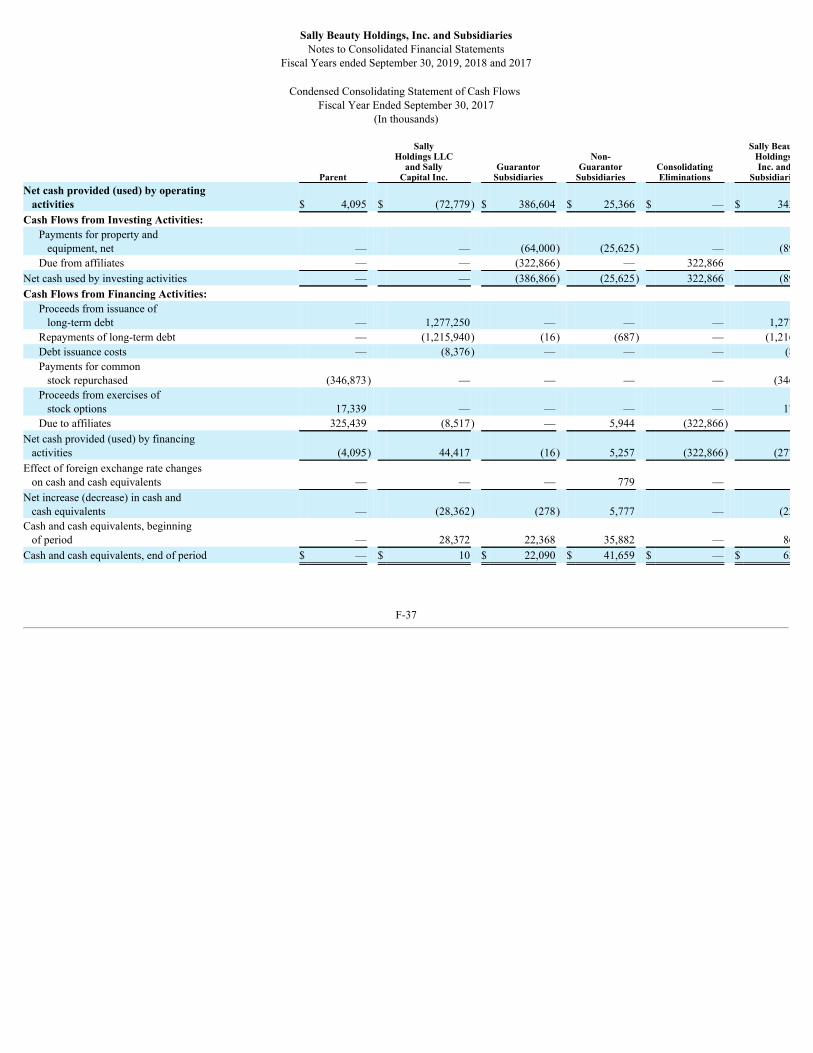
Sally Beauty Holdings, Inc. and SubsidiariesNotes to Consolidated Financial Statements
Fiscal Years ended September 30, 2019, 2018 and 2017
Condensed Consolidating Statement of Cash Flows Fiscal Year Ended September 30, 2017
(In thousands)
Parent
SallyHoldings LLC
and SallyCapital Inc.
GuarantorSubsidiaries
Non-Guarantor
Subsidiaries ConsolidatingEliminations
Sally BeautyHoldings,Inc. and
Subsidiaries Net cash provided (used) by operating activities $ 4,095 $ (72,779) $ 386,604 $ 25,366 $ — $ 343,286 Cash Flows from Investing Activities:
Payments for property and equipment, net — — (64,000) (25,625) — (89,625)Due from affiliates — — (322,866) — 322,866 —
Net cash used by investing activities — — (386,866) (25,625) 322,866 (89,625)Cash Flows from Financing Activities:
Proceeds from issuance of long-term debt — 1,277,250 — — — 1,277,250 Repayments of long-term debt — (1,215,940) (16) (687) — (1,216,643)Debt issuance costs — (8,376) — — — (8,376)Payments for common stock repurchased (346,873) — — — — (346,873)Proceeds from exercises of stock options 17,339 — — — — 17,339 Due to affiliates 325,439 (8,517) — 5,944 (322,866) —
Net cash provided (used) by financing activities (4,095) 44,417 (16) 5,257 (322,866) (277,303)Effect of foreign exchange rate changes on cash and cash equivalents — — — 779 — 779 Net increase (decrease) in cash and cash equivalents — (28,362) (278) 5,777 — (22,863)Cash and cash equivalents, beginning of period — 28,372 22,368 35,882 — 86,622 Cash and cash equivalents, end of period $ — $ 10 $ 22,090 $ 41,659 $ — $ 63,759
F-37

Sally Beauty Holdings, Inc. and SubsidiariesNotes to Consolidated Financial Statements
Fiscal Years ended September 30, 2019, 2018 and 2017
18. Restructuring
Restructuring expense and gains for the fiscal years ended September 30, 2019, 2018 and 2017, are as follows (in thousands): 2019 2018 2017 Supply Chain Modernization $ (4,662) $ — $ — 2018 Restructuring Plan 3,980 33,615 — 2017 Restructuring Plan — — 22,679
Total expense (gain) $ (682) $ 33,615 $ 22,679
Supply Chain Modernization
In February 2019, we announced that we were assessing our supply chain in an effort to minimize out-of-stocks, optimize inventory levels, reduce costs and explore newreplenishment and fulfillment options. As part of our supply chain modernization plans, we sold our secondary headquarters and fulfillment center in Denton, Texas, andour Marinette, Wisconsin, fulfillment facility, anticipate closing other select distribution centers and upgrading our e-commerce capabilities. Additionally, we will beopening a new automated and concentrated distribution center which will service SBS stores and e-commerce sales, as well as BSG stores, full service sales and e-commerce sales in fiscal year 2020.
The liability related to the supply chain modernization, which is included in accrued liabilities on our consolidated balance sheets, is as follows (in thousands):
Supply Chain Modernization
Liability atSeptember 30,
2018 Expenses Cash Payments Adjustments
Liability atSeptember 30,
2019 Workforce reductions $ — $ 2,502 $ 1,848 $ — $ 654 Facility closures — 1,021 817 — 204 Other — 224 224 — —
Total $ — $ 3,747 $ 2,889 $ — $ 858
Expenses incurred during the fiscal year ended September 30, 2019, represent costs incurred by SBS of $1.5 million, BSG of $1.5 million and corporate of $0.7 million.The above table does not include an $8.4 million gain from selling our secondary headquarters and fulfillment center in Denton, Texas, and our fulfillment center inMarinette, Wisconsin.
2018 Restructuring Plan
In November 2017, our Board of Directors approved a restructuring plan (the “2018 Restructuring Plan”) focused primarily on significantly improving the profitability ofour international businesses, with particular focus on our European operations. In April 2018, we announced an expansion of the 2018 Restructuring Plan that containedcost reduction initiatives designed to help fund important long-term growth initiatives. The expansion to the 2018 Restructuring Plan included headcount reductionsprimarily at our corporate headquarters in Denton, Texas. As of December 31, 2018, the 2018 Restructuring Plan was substantially complete and we do not anticipate anyadditional material costs for the 2018 Restructuring Plan.
The liability related to the 2018 Restructuring Plan, which is included in accrued liabilities on our consolidated balance sheets, is as follows (in thousands):
2018 Restructuring Plan
Liability atSeptember 30,
2018 Expenses Cash Payments Adjustments
Liability atSeptember 30,
2019 Workforce reductions $ 3,444 $ 643 $ 4,087 $ — $ — Consulting 3,087 2,502 5,589 — — Other 2,266 835 3,031 — 70
Total $ 8,797 $ 3,980 $ 12,707 $ — $ 70
F-38

Sally Beauty Holdings, Inc. and SubsidiariesNotes to Consolidated Financial Statements
Fiscal Years ended September 30, 2019, 2018 and 2017 Expenses incurred during the fiscal year ended September 30, 2019, represent costs incurred by SBS of $1.1 million and corporate of $2.8 million.
2017 Restructuring Plan
In January 2017, the Board approved a restructuring plan (the “2017 Restructuring Plan”) for our businesses that included the closure of four administrative offices in theU.S. and Canada, reductions in both salaried and hourly workforce and certain other cost reduction activities. In addition, we expanded the 2017 Restructuring Plan toencompass some other underperforming international operations. There was no material liability for the 2017 Restructuring Plan as of September 30, 2019.
19. Quarterly Financial Data (Unaudited)
Certain unaudited quarterly consolidated statement of earnings information for the fiscal years ended September 30, 2019 and 2018 is summarized below (in thousands,except per share data):
1st 2nd 3rd 4th Fiscal Year Quarter Quarter Quarter Quarter 2019:
Net sales $ 989,453 $ 945,852 $ 975,169 $ 965,937 Gross profit $ 480,705 $ 468,324 $ 482,222 $ 479,291 Net earnings $ 65,727 $ 65,725 $ 71,164 $ 69,007 Earnings per share(a)
Basic $ 0.55 $ 0.55 $ 0.59 $ 0.58 Diluted $ 0.54 $ 0.54 $ 0.59 $ 0.58
2018:
Net sales $ 994,964 $ 975,321 $ 996,283 $ 965,997 Gross profit $ 486,629 $ 486,322 $ 493,370 $ 478,092 Net earnings $ 83,264 $ 61,371 $ 58,226 $ 55,186 Earnings per share(a)
Basic $ 0.65 $ 0.49 $ 0.48 $ 0.46 Diluted $ 0.65 $ 0.49 $ 0.48 $ 0.46
(a) The sum of the quarterly earnings per share may not equal the full year amount due to rounding of the calculated amounts.
F-39

Exhibit 10.20NON-STATUTORY STOCK OPTION AWARD CERTIFICATE
Non-transferableG R A N T TO
«Full_Name»(“Optionee”)
the right to purchase from Sally Beauty Holdings, Inc. (the “Company”)
«Options» shares of its common stock, par value $0.01, at the price of $ per share (the “Option”)
pursuant to and subject to the provisions of the Sally Beauty Holdings, Inc. 2019 Omnibus Incentive Plan (the “Plan”) and to the terms andconditions set forth on the following page (the “Terms and Conditions”). By accepting the Option, Optionee shall be deemed to have agreed to theTerms and Conditions set forth in this Award Certificate and the Plan. Capitalized terms used herein and not otherwise defined shall have themeanings assigned to such terms in the Plan.
Unless vesting is accelerated as provided herein or otherwise in the discretion of the Committee, the Option shall vest (becomeexercisable) in accordance with the following schedule, provided that Optionee is providing services to the Company on each of the followingdates:
Vesting Date Percent of Option VestedNovember 15, 2020 33.33%November 15, 2021 33.33%November 15, 2022 33.34%
IN WITNESS WHEREOF, Sally Beauty Holdings, Inc., acting by and through its duly authorized officers, has caused this Award
Certificate to be duly executed.
SALLY BEAUTY HOLDINGS, INC. By:
Christian A. Brickman
Its: President, Chief Executive Officer & Director
Grant Date: November 5, 2019
Acknowledged and Accepted by Optionee: __________________________________

TERMS AND CONDITIONS
1. Vesting of Option. The Option shall vest (become exercisable) in accordance with the schedule shown on the cover page of this
Award Certificate. Notwithstanding the vesting schedule, (i) upon the occurrence of a Change in Control, unless the Committee otherwisedetermines as provided in Section 13.8(b) of the Plan, the Option shall become fully vested and exercisable, and (ii) upon Optionee’s termination ofservice as a result of Optionee’s death or Disability, that portion of the Option that would have become vested and exercisable on the next vestingdate following the effective date of Optionee’s termination of service shall become vested and exercisable.
2. Term of Option and Limitations on Right to Exercise. The term of the Option will be for a period of ten years, expiring at 5:00 p.m.,
Central Time, on the tenth anniversary of the Grant Date (the “Expiration Date”). To the extent not previously exercised, the Option will lapse priorto the Expiration Date upon the earliest to occur of the following circumstances:
(a) two (2) months after the termination of Optionee’s service with the Company for any reason other than (i) by the
Company for Cause or, if Optionee’s employment is subject to the terms of a then-effective written employment agreement betweenOptionee and the Company or an Affiliate, by Optionee without compliance with, or without “good reason” or words of similar importunder, the terms of his or her employment agreement, if any, or (ii) by reason of Optionee’s death, Disability or Retirement;
(b) twelve (12) months after the date of the termination of Optionee’s service with the Company by reason of his or her
Retirement, if Optionee does not agree to be bound by Restrictive Covenants (as defined in Section 3 herein); (c) thirty-six (36) months after the date of the termination of Optionee’s service with the Company by reason of his or her
Retirement, if Optionee agrees to be bound by Restrictive Covenants; (d) twelve (12) months after the date of the termination of Optionee’s service with the Company by reason of his or her
Disability; (e) twelve (12) months after Optionee’s death, if Optionee dies while providing services to the Company, or during the two-
month period described in subsection (a) above or during the 12-month period described in subsections (b) or (d) above or during the36-month period described in subsection (c) above, and before the Option otherwise expires (upon Optionee’s death, the Option may beexercised by Optionee’s estate or other beneficiary designated pursuant to the Plan); or
(f) immediately upon the termination of Optionee’s service with the Company if such termination is (i) by the Company for
Cause, or (ii) if Optionee’s employment is subject to the terms of a then-effective written employment agreement between Optionee andthe Company or an Affiliate, by Optionee without compliance with, or without “good reason” or words of similar import under, theterms of such employment agreement. The Committee may, prior to the lapse of the Option under the circumstances described in subsections (a), (b), (c), (d) or (f) above,
extend the time to exercise the Option as determined by the Committee in writing, but in no event may the Option be extended beyond theExpiration Date. If Optionee returns to service with the Company during the designated post-termination exercise period, then Optionee shall berestored to the status Optionee held prior to such termination. If Optionee or his or her beneficiary exercises an Option after termination of service,the Option may be exercised only with respect to the

portion of the Option that was otherwise vested on Optionee’s termination of service, including any portion of the Option vested by accelerationunder Section 1.
3. Retirement. If Optionee’s service with the Company is terminated as a result of his or her Retirement and Optionee agrees to be
bound by certain restrictive covenants (including non-competition, non-solicitation, non-disclosure and non-disparagement covenants asdetermined in the sole discretion of the Company) (“Restrictive Covenants”), for the three-year period following his or her Retirement, thenOptionee will continue to vest in the portion of the Option that was not vested and exercisable as of the date of Optionee’s Retirement for the three-year period following Optionee’s Retirement as if Optionee’s service had not terminated, unless Optionee violates the any of the RestrictiveCovenants. If, in the sole discretion of the Committee, Optionee violates one of the Restrictive Covenants during the three-year period followingOptionee’s Retirement, then all Options, whether or not vested, shall be immediately forfeited and cancelled as of the date of such violation. IfOptionee’s service with the Company is terminated as a result of his or her Retirement and Optionee does not agree to be bound by RestrictiveCovenants, then the Option shall be exercisable only with respect to the portion of the Option that was otherwise vested on Optionee’s terminationof service.
4. Exercise of Option. Unless and until changed by the Company, the Option shall be exercised by (a) entering and executing an
exercise order with UBS Financial Services Inc. and obtaining an exercise confirmation. UBS Financial Services Inc. may be reached by telephoneat 1-877-763-6447 (within the U.S.) or 1-617-261-2617 (outside the U.S.) or on the UBS Financial Services Inc. website athttp://www.ubs.com/onesource/sbh, and (b) payment to the Company in full for the shares of Common Stock subject to such exercise. If the personexercising an Option is not Optionee, such person shall also deliver with the notice of exercise appropriate proof of his or her right to exercise theOption. Payment for such shares of Common Stock shall be (a) in cash, (b) by delivery (actual or by attestation) of shares of Common Stockpreviously-acquired by the purchaser, (c) by withholding of shares of Common Stock from the Option, or (d) any combination thereof, for thenumber of shares of Common Stock specified in the exercise notice. Shares of Common Stock surrendered or withheld for this purpose shall bevalued at the Fair Market Value on the date of exercise. To the extent permitted under Regulation T of the Federal Reserve Board, and subject toapplicable securities laws and any limitations as may be applied from time to time by the Committee (which need not be uniform), the Options maybe exercised through a broker in a so-called “cashless exercise” whereby the broker sells the shares of Common Stock on behalf of Optionee anddelivers cash sales proceeds to the Company in payment of the exercise price. To the extent that the Option is outstanding and exercisable on theExpiration Date, and if the exercise price is less than the Fair Market Value of the Common Stock on the Expiration Date, the Option will beautomatically exercised on the Expiration Date by withholding of shares of Common Stock from the Option sufficient to cover the exercise priceand the minimum require tax withholding. Evidence of the issuance of the shares of Common Stock purchased pursuant to the exercise of theOption may be accomplished in such manner as the Company or its authorized representatives shall deem appropriate including, without limitation,electronic registration, book‑entry registration or issuance of a certificate or certificates in the name of the Optionee or in the name of such otherparty or parties as the Company and its authorized representatives shall deem appropriate. No adjustment will be made for a dividend or other rightfor which the record date is prior to the date the Optionee receives evidence of the issuance of the Shares. In the event the shares of Common Stockissued upon exercise of this Option remain subject to any additional restrictions, the Company and its authorized representatives shall ensure thatOptionee is prohibited from entering into any transaction that would violate any such restrictions, until such restrictions lapse.
5. Post-Employment Non-Solicitation. Optionee agrees that for a period of one year following Optionee’s termination of service with
the Company for any reason, Optionee will not either directly or indirectly solicit for employment or otherwise interfere with the relationship of theCompany or any Affiliate of the Company with any natural person who is then-currently employed by or otherwise engaged
to perform services for the Company or any Affiliate of the Company. Optionee further agrees that Optionee will not interfere with the businessrelationship between the Company and any Affiliate of the Company and one of its customers, suppliers or vendors by soliciting, inducing, orotherwise encouraging the customer, supplier or vendor to reduce or stop doing business with the Company and any Affiliate of the Company. Inthe event Optionee’s service with the Company is terminated as a result of his or her Retirement, the provisions of this Section 5 shall applyregardless of whether Optionee agrees to be bound to Restrictive Covenants set forth in Section 3.
6. Tax Matters. (a) Optionee acknowledges that the tax consequences associated with the Option are complex and that the Company has urged
Optionee to review with Optionee’s own tax advisors the federal, state, and local tax consequences of this Option. Optionee is relying solely onsuch advisors and not on any statements or representations of the Company or any of its agents. Optionee understands that Optionee (and not theCompany) shall be responsible for Optionee’s own tax liability that may arise as a result of this Award Certificate.
(b) The Company or any employer Affiliate has the authority and the right to deduct or withhold, or require Optionee to remit to
the employer, an amount sufficient to satisfy federal, state, and local taxes (including Optionee’s FICA obligation) required by law to be withheldwith respect to any taxable event arising as a result of the exercise of the Option. The obligations of the Company under this Award Certificate willbe conditional on such payment or arrangements, and the Company and, where applicable, an employer Affiliate, will, to the extent permitted bylaw, have the right to deduct any such taxes from any payment of any kind otherwise due to Optionee. The withholding requirement shall besatisfied by withholding from the Option shares of Common Stock having a Fair Market Value on the date of withholding equal to the amountrequired to be withheld for tax purposes, all in accordance with such procedures as the Company establishes.
7. Restrictions on Transfer and Pledge. The Option shall be exercisable only by the Optionee during Optionee’s lifetime, or, if
permissible under applicable law, by Optionee’s guardian or legal representative or by a transferee receiving such Optionee pursuant to a domesticrelations order (a “QDRO”) as defined in Section 414(p)(1)(B) of the Code or Title I of ERISA, or the rules thereunder. The Option, and any rightsunder the Option, may not be assigned, alienated, pledged, attached, sold or otherwise transferred or encumbered by Optionee otherwise than bywill or by the laws of descent and distribution or pursuant to a QDRO, and any such purported assignment, alienation, pledge, attachment, sale,transfer or encumbrance shall be void and unenforceable against the Company or any Affiliate; provided that the designation of a beneficiary toreceive benefits in the event of Optionee’s death shall not constitute an assignment, alienation, pledge, attachment, sale, transfer orencumbrance. Notwithstanding the foregoing, the Option may be transferred, without consideration, to a Permitted Transferee. The Option may beexercised by such Permitted Transferee in accordance with the terms of this Award Certificate. Nothing herein shall be construed as requiring theCompany or any Affiliate to honor a QDRO except to the extent required under applicable law.
8. Restrictions on Issuance of Shares of Common Stock. If at any time the Committee shall determine in its discretion, that registration,
listing or qualification of the shares of Common Stock covered by the Option upon any securities exchange or under any foreign, federal, or locallaw or practice, or the consent or approval of any governmental regulatory body, is necessary or desirable as a condition to the exercise of theOption, the Option may not be exercised in whole or in part unless and until such registration, listing, qualification, consent or approval shall havebeen effected or obtained free of any conditions not acceptable to the Committee.

9. Plan Controls. The terms contained in the Plan are incorporated into and made a part of this Award Certificate and this Award
Certificate shall be governed by and construed in accordance with the Plan. In the event of any actual or alleged conflict between the provisions ofthe Plan and the provisions of this Award Certificate, the provisions of the Plan shall be controlling and determinative.
10. Limitation of Rights. The Option does not confer to Optionee or Optionee’s beneficiary any rights of a stockholder of the Company
unless and until shares of Common Stock are in fact issued to such person in connection with the exercise of the Option. Nothing in this AwardCertificate shall interfere with or limit in any way the right of the Company or any Affiliate to terminate Optionee’s service at any time, nor conferupon Optionee any right to continue providing services to the Company or any Affiliate.
11. Successors. This Award Certificate shall be binding upon any successor of the Company, in accordance with the terms of this
Award Certificate and the Plan. 12. Notice. Notices hereunder must be in writing, delivered personally or sent by registered or certified U.S. mail, return receipt
requested, postage prepaid. Notices to the Company must be addressed to Sally Beauty Holdings, Inc., 3001 Colorado Boulevard, Denton, TX76210, Attn: Secretary, or any other address designated by the Company in a written notice to Optionee. Notices to Optionee will be directed to theaddress of Optionee then currently on file with the Company, or at any other address given by Optionee in a written notice to the Company.
13. Amendments and Modifications. The Committee or its designee may, in the Committee’s or the designee’s sole and absolute
discretion, as applicable, amend or modify this Award Certificate in any manner that is either (i) not adverse to Optionee, or (ii) consented to byOptionee.
14. Compensation Recoupment Policy. This Award Certificate shall be subject to the terms and conditions of any compensation
recoupment policy adopted from time to time by the Board or any committee of the Board, to the extent such policy is applicable.

Exhibit 10.21RESTRICTED STOCK AWARD CERTIFICATE
Non-transferableGRANT TO
«Full_Name»(“Grantee”)
by Sally Beauty Holdings, Inc. (the “Company”) of
«RSAs» shares of its common stock, $0.01 par value (the “Shares”)
pursuant to and subject to the provisions of the Sally Beauty Holdings, Inc. 2019 Omnibus Incentive Plan (the “Plan”) and to the terms andconditions set forth on the following page (the “Terms and Conditions”). By accepting the Shares, Grantee shall be deemed to have agreed to theTerms and Conditions set forth in this Award Certificate and the Plan. Capitalized terms used herein and not otherwise defined shall have themeanings assigned to such terms in the Plan.
Unless the expiration of restrictions on the Shares is accelerated as provided herein or otherwise in the discretion of the Committee, therestrictions on these Shares shall expire in accordance with the following schedule, provided that Grantee is providing services to the Company oneach of the following dates:
Vesting Date Percent of Shares VestedNovember 15, 2020 33.33%November 15, 2021 33.33%November 15, 2022 33.34%
IN WITNESS WHEREOF, Sally Beauty Holdings, Inc., acting by and through its duly authorized officers, has caused this AwardCertificate to be duly executed.
SALLY BEAUTY HOLDINGS, INC. By:
Christian A. Brickman
Its: President, Chief Executive Officer & Director
Grant Date: November 5, 2019
Acknowledged and Accepted by Grantee: __________________________________
TERMS AND CONDITIONS
1. Restrictions. The Shares are subject to each of the following restrictions. “Restricted Shares” mean those Shares that are subject to the
restrictions imposed hereunder which restrictions have not then expired or terminated. Restricted Shares may not be sold, transferred, exchanged,assigned, pledged, hypothecated or otherwise encumbered. Subject to Section 3 hereof, if Grantee’s service terminates for any reason other than asdescribed in Section 2(c) below, then Grantee shall forfeit all of Grantee’s right, title and interest in and to the Restricted Shares as of the date oftermination, and such Restricted Shares shall be reconveyed to the Company without further consideration or any act or action by the Grantee. Ifany Restricted Shares do not vest pursuant to Section 2(c), then Grantee shall forfeit all of Grantee’s right, title and interest in and to suchRestricted Shares as of the date of termination, and such Restricted Shares shall be reconveyed to the Company without further consideration orany act or action by the Grantee. The restrictions imposed under this Section shall apply to all shares of Common Stock or other securities issuedwith respect to Restricted Shares hereunder in connection with any merger, reorganization, consolidation, recapitalization, stock dividend or otherchange in corporate structure affecting the Common Stock.
2. Expiration and Termination of Restrictions. The restrictions imposed under Section 1 will expire on the earliest to occur of the following(the period prior to such expiration being referred to herein as the “Restricted Period”):
(a) as to the percentages of the Shares specified on the cover page hereof, on the respective vesting dates specified on such page, provided
Grantee is providing services to the Company on each such vesting date; (b) as to 100% of the Shares, upon the occurrence of a Change in Control, unless the Committee otherwise determines as provided in
Section 13.8(b) of the Plan, provided Grantee is providing services to the Company on the date of such Change in Control; or (c) as to that portion of the Shares that would have become vested on the next vesting date following the effective date of Grantee’s
termination of service, upon Grantee’s termination of service as a result of Grantee’s death or Disability.
3. Retirement. If Grantee’s service with the Company is terminated as a result of his or her Retirement and Grantee agrees to be boundby certain restrictive covenants (including non-competition, non-solicitation, non-disclosure and non-disparagement covenants as determined in thesole discretion of the Company) (“Restrictive Covenants”), for the three-year period following his or her Retirement, then the Restricted Shareswill continue to vest for the three-year period following Grantee’s Retirement as if Grantee’s service had not terminated, unless Grantee violatesthe any of the Restrictive Covenants. If, in the sole discretion of the Committee, Grantee violates one of the Restrictive Covenants during thethree-year period following Grantee’s Retirement, then Grantee shall forfeit all of his or her right, title and interest in and to such Restricted Sharesas of the date of such violation, and such Restricted Shares shall be reconveyed to the Company without further consideration or any act or actionby the Grantee. If Grantee’s service with the Company is terminated as a result of his or her Retirement and Grantee does not agree to be bound byRestrictive Covenants, then Grantee shall forfeit all of his or her right, title and interest in and to such Restricted Shares as of the date oftermination, and such Restricted Shares shall be reconveyed to the Company without further consideration or any act or action by the Grantee.
4. Delivery of Shares. The Shares will be registered in the name of Grantee as of the Grant Date and may be held by the Company during
the Restricted Period in certificated or uncertificated form. If a certificate for Restricted Shares is issued during the Restricted Period, suchcertificate shall be registered in the name of Grantee and shall bear a legend in substantially the following form (in addition to any legend
required under applicable state securities laws): “This certificate and the shares of stock represented hereby are subject to the terms and conditionscontained in a Restricted Stock Award Certificate between the registered owner and Sally Beauty Holdings, Inc. Release from such terms andconditions shall be made only in accordance with the provisions of such Award Certificate, copies of which are on file in the offices of SallyBeauty Holdings, Inc.” Stock certificates for the Shares, without the above legend, shall be delivered to Grantee or Grantee’s designee uponrequest of Grantee after the expiration of the Restricted Period, but delivery may be postponed for such period as may be required for the Companywith reasonable diligence to comply, if deemed advisable by the Company, with registration requirements under the 1933 Act, listing requirementsof any national securities exchange, and requirements under any other law or regulation applicable to the issuance or transfer of the Shares.
5. Voting and Dividend Rights. (a) Grantee shall have full voting rights with respect to the Shares during and after the Restricted Period. (b) During the Restricted Period, any dividends accrued on the Restricted Shares shall be credited by the Company to an account for
Grantee and accumulated without interest until the date upon which the Restricted Shares become vested, and any dividends accrued with respect toforfeited Restricted Shares will be reconveyed to the Company without further consideration or any act or action by Grantee. In no event shalldividends be paid or distributed until the vesting restrictions of the Restricted Shares lapse.
6. Post-Employment Non-Solicitation. Grantee agrees that for a period of one year following Grantee’s termination of service with theCompany for any reason, Grantee will not either directly or indirectly solicit for employment or otherwise interfere with the relationship of theCompany or any Affiliate of the Company with any natural person who is then-currently employed by or otherwise engaged to perform services forthe Company or any Affiliate of the Company. Grantee further agrees that Grantee will not interfere with the business relationship between theCompany and any Affiliate of the Company and one of its customers, suppliers or vendors by soliciting, inducing, or otherwise encouraging thecustomer, supplier or vendor to reduce or stop doing business with the Company and any Affiliate of the Company. In the event Grantee’s servicewith the Company is terminated as a result of his or her Retirement, the provisions of this Section 6 shall apply regardless of whether Granteeagrees to be bound to Restrictive Covenants set forth in Section 3.
7. Payment of Taxes.
(a) Grantee acknowledges that the tax consequences associated with this Award are complex and that the Company has urgedGrantee to review with Grantee’s own tax advisors the federal, state, and local tax consequences of this Award. Grantee is relying solely on suchadvisors and not on any statements or representations of the Company or any of its agents. Grantee understands that Grantee (and not theCompany) shall be responsible for Grantee’s own tax liability that may arise as a result of this Award Certificate.
(b) Upon issuance of the Shares hereunder, Grantee may make an election to be taxed upon such award under Section 83(b) of the
Code. To effect such election, Grantee may file an appropriate election with the Internal Revenue Service within thirty (30) days after award of theShares and otherwise in accordance with applicable Treasury Regulations. Grantee will, no later than the date as of which any amount related tothe Shares first becomes includable in Grantee’s gross income for federal income tax purposes, pay to the Company or any employer Affiliate, ormake other arrangements satisfactory to the Board regarding payment of, any federal, state and local taxes (including Grantee’s FICA obligation)

required by law to be withheld with respect to such amount. The obligations of the Company under this Award Certificate will be conditional onsuch payment or arrangements, and the Company and, where applicable, an employer Affiliate, will, to the extent permitted by law, have the rightto deduct any such taxes from any payment of any kind otherwise due to Grantee. The withholding requirement shall be satisfied by withholdingfrom the Award shares of Common Stock having a Fair Market Value on the date of withholding equal to the amount required to be withheld fortax purposes, all in accordance with such procedures as the Company establishes.
8. Plan Controls. The terms contained in the Plan are incorporated into and made a part of this Award Certificate and this Award
Certificate shall be governed by and construed in accordance with the Plan. In the event of any actual or alleged conflict between the provisions ofthe Plan and the provisions of this Award Certificate, the provisions of the Plan shall be controlling and determinative.
9. No Right to Continued Service. Nothing in this Award Certificate shall interfere with or limit in any way the right of the Company or
any Affiliate to terminate Grantee’s service at any time, nor confer upon Grantee any right to continue providing services to the Company or anyAffiliate.
10. Successors. This Award Certificate shall be binding upon any successor of the Company, in accordance with the terms of this
Award Certificate and the Plan. 11. Notice. Notices hereunder must be in writing, delivered personally or sent by registered or certified U.S. mail, return receipt
requested, postage prepaid. Notices to the Company must be addressed to Sally Beauty Holdings, Inc., 3001 Colorado Boulevard, Denton, TX76210, Attn: Secretary, or any other address designated by the Company in a written notice to Grantee. Notices to Grantee will be directed to theaddress of Grantee then currently on file with the Company, or at any other address given by Grantee in a written notice to the Company.
12. Amendments and Modifications. The Committee or its designee may, in the Committee’s or the designee’s sole and absolute
discretion, as applicable, amend or modify this Award Certificate in any manner that is either (i) not adverse to Grantee, or (ii) consented to byGrantee.
13. Compensation Recoupment Policy. This Award Certificate shall be subject to the terms and conditions of any compensation
recoupment policy adopted from time to time by the Board or any committee of the Board, to the extent such policy is applicable.

Exhibit 10.25
SALLY BEAUTY HOLDINGS ANNUALINCENTIVE PLAN
SECTION 1Purpose
The purpose of the Sally Beauty Holdings Annual Incentive Plan is to permit Sally Beauty Holdings, Inc., and its
consolidated subsidiaries (the “Company”), through awards of annual cash incentive compensation, to attract and retain executiveofficers and other key employees and to motivate these employees to promote the profitability and growth of the Company.
SECTION 2Definitions
“Award” shall mean the amount earned and paid to a Participant under the Plan for a Performance Period.
“Board” shall mean the Board of Directors of the Company, or the successor thereto.
“Committee” shall mean the Compensation Committee of the Board.
“Eligible Employee” shall mean (i) any employee of the Company or any of its subsidiaries; or (ii) any single-member limitedliability company or single-shareholder corporation providing executive management services to the Company or its Subsidiaries through itssole member or shareholder.
“Participant” shall mean, for each Performance Period, an Eligible Employee who has been selected to participate in the Plan
for that Performance Period.
“Performance Objectives” shall mean the financial, operational and/or individual performance objectives established by or underthe direction of the Committee with respect to a given Performance Period.
“Performance Period” shall mean the Company’s fiscal year or any other period designated by the Committee with
respect to which an Award may be granted.
“Plan” shall mean this Sally Beauty Holdings Annual Incentive Plan, as amended from time to time.
“Scheduled Payment Date” for any Performance Period has the meaning assigned such term in Section 6(a) hereof.
“Stock Plans” shall mean the Sally Beauty Holdings Amended and Restated 2010 Omnibus Incentive Plan and any future equitycompensation plans approved by the shareholders of the Company.
“Target Award” shall mean the amount of an Award, expressed as a percentage of base salary, that will be earned by a
Participant for a Performance Period if designated Performance Objectives are achieved at the target level.
- 1 -

SECTION 3Administration
The Committee shall administer the Plan and shall have full authority to interpret the Plan, to establish rules and regulations relating
to the operation of the Plan, to select Participants, to determine the amounts of any Awards and to make all determinations and take all otheractions necessary or appropriate for the proper administration of the Plan. The Committee’s interpretation of the Plan, and all actions takenwithin the scope of its authority, shall be final and binding on the Company, its stockholders and Participants, former Participants, and theirrespective successors and assigns. No member of the Committee shall be eligible to participate in the Plan.
The Committee may delegate to the Chief Executive Officer some or all of its authority with respect to Eligible Employees who are
not executive officers of the Company, including the authority to select Participants, establish or approve Performance Objectives, establish orapprove Target Awards, or determine the amounts of Awards to Participants under the Plan.
SECTION 4
Eligibility and Participation
The Committee shall determine the Participants in the Plan for each Performance Period.With respect to non-executive officers, the Chief Executive Officer shall recommend to the Committee a list of Eligible Employees (and/or jobclassifications or categories of Eligible Employees) proposed to be Participants in the Plan for each Performance Period. Within 90 days afterthe beginning of each Performance Period, the Committee shall review and approve the Eligible Employees and/or job classifications orcategories of Eligible Employees who will be Participants in the Plan for that Performance Period. The Chief Executive Officer may add ordelete non-executive officer Participants and/or job classifications or categories of Participants during a Performance Period, subject toCommittee approval.
SECTION 5
Operation of the Plan (a) Establishment of Target Awards. Within 90 days after the beginning of each Performance Period, the Committee (or the
Chief Executive Officer if so authorized by the Committee with respect to Participants who are not executive officers) shall approvethe percentage of each Participant’s base salary that will be awarded to the Participant if designated Performance Objectives areachieved at the target performance level (the “Target Award”). Each Participant’s Target Award percentage will be communicatedin writing to the Participant. The actual Award to a Participant may be greater or less than his or her Target Award, depending onthe level of achievement of Performance Objectives and depending on whether the Committee (or the Chief Executive Officer if soauthorized by the Committee with respect to Participants who are not executive officers) exercises discretion to increase or reduce aresulting Award as provided herein. If a Participant’s Target Award is based on his or her managerial level, and if his or hermanagerial level changes during the Performance Period, the Target Award percentages for such managerial levels will be proratedbased on the number of days the Participant was employed in the applicable managerial levels during the Performance Period.
- 2 -
(b) Performance Objectives. Within 90 days after the beginning of each Performance Period, the Committee (or the ChiefExecutive Officer if so authorized by the Committee with respect to Participants who are not executive officers) shall establish orapprove financial, operational and/or individual performance objectives relative to each Participant for a Performance Period,which may vary depending on the business unit, managerial level or role of the Participant. Such Performance Objectives may beexpressed in terms of threshold, target and maximum performance levels, the achievement of which will affect the amount of theAwards earned, with or without interpolation between points. The applicable Performance Objectives for each Participant shall becommunicated in writing to the Participant as soon as practicable after they are established.
(c) Determination of Awards. As soon as practicable after the end of each Performance Period, the Committee (or the Chief
Executive Officer if so authorized by the Committee with respect to Participants who are not executive officers) will review thelevel of achievement of Performance Objectives for the Performance Period. While the achievement of Performance Objectivesshall in all cases be taken under consideration by the Committee (or the Chief Executive Officer if so authorized by the Committeeto determine Awards with respect to Participants who are not executive officers), the final Award for each Participant is within thesole discretion of the Committee (or the Chief Executive Officer if so authorized by the Committee with respect to Participants whoare not executive officers), based on such factors as it or he shall deem relevant. The Committee (or the Chief Executive Officer, asthe case may be) shall review and approve all Awards, based upon the assumption that the Participant will be an employee on theScheduled Payment Date (defined below).
SECTION 6
Payment of Awards (a) Awards will be paid to Participants within 30 days after the amount of such Awards for a Performance Period
have been determined, but no later than March 15 of the calendar year following the end of the Performance Period forwhich the Awards, if any, were earned (the “Scheduled Payment Date”).
(b) Unless otherwise provided in Section 7 or determined by the Committee, a Participant must beemployed by the Company or one of its subsidiaries on the Scheduled Payment Date for a Performance Period tobe eligible for an Award.
(c) Awards made to Participants who are participating in the Plan for less than the entire Performance Period shall be
prorated based on the number of days of participation.
(d) Any Participant may be removed from consideration for an Award (or have the Award amount reduced) at the
discretion of the Committee or its designee. Performance-related and ethics-related personnel actions are particularly likely tolead to removal from consideration.
(e) Payment of Awards may be made in cash, stock, restricted stock, options, other stock-based or stock-denominated
units or any combination thereof determined by the Committee. Equity or equity-based awards shall be granted under theterms and conditions of one or more of the Company’s Stock Plans. If so authorized by the Committee, payment of Awardsmay be deferred in accordance with a written election by the Participant pursuant to procedures established by the Committee.
- 3 -

SECTION 7Effect of Employment Status
(a) Unless otherwise provided in this Section 7 or determined by the Committee, a Participant must be employed by
the Company or one of its subsidiaries on the Scheduled Payment Date for a Performance Period to be eligible for an Award.
(b) A Participant whose death or retirement occurs after the end of the Performance Period but before the Scheduled
Payment Date shall be eligible for a payment on the Scheduled Payment Date on same terms as if he/she had been employed asof the Scheduled Payment Date.
(c) A Participant who has been an active employee for at least three months of the Performance Period and is
terminated as a result of disability before the end of the Performance Period shall be eligible for a prorated payment basedupon the number of completed months of active employment during the Performance Period. A Participant whoseemployment is terminated by reason of disability after the end of the Performance Period but before the Scheduled PaymentDate shall be eligible for a payment on the Scheduled Payment Date on the same terms as if he/she had been employed as ofthe Scheduled Payment Date.
(d) In the event a Participant is transferred between the Company and one or more of its subsidiaries or to an unaffiliated
company, the effect of the transfer on the Award shall be determined by the Committee (or the Chief Executive Officer if soauthorized by the Committee with respect to Participants who are not executive officers of the Company).
(e) If a Participant begins employment or is promoted to an eligible position after the beginning of a Performance Period, the
Committee (or the Chief Executive Officer if so authorized by the Committee with respect to Participants who are not executiveofficers), in its or his discretion, may determine whether such employee may participate in the Plan and if so, the terms of suchparticipation. Any Award earned by such Participant will be prorated based on the number of days such person participated in thePlan during the Performance Period, unless the Committee or the Chief Executive Officer, as the case may be, determines otherwise.
(f) If a Participant is demoted during a Performance Period, the Committee (or the Chief Executive Officer if so
authorized by the Committee with respect to Participants who are not executive officers) will determine whether Planparticipation ends at that time, or is continued, perhaps at a reduced level. If participation ends, any Award earned during the timeof participation will be prorated based on the number of days such person participated in the Plan during the Performance Periodand the level of participation.
(g) If a Participant takes a leave of absence during the Performance Period for any reason, any Award earned by such
Participant will be prorated based on the number of days such person participated in the Plan during the Performance Period,unless the Committee or the Chief Executive Officer, as the case may be, determines otherwise.
(h) Except as may be required by law, a Participant must be an active employee for three months of a Performance
Period to be eligible for an Award for that Performance Period, unless the Committee (or the Chief Executive Officer if soauthorized by the Committee with respect to Participants who are not executive officers of the Company) determinesotherwise.
(i) (Applies to Canadian and United Kingdom/European Union Eligible Employees Only) - The date of termination of
employment under the Plan shall be determined to be:
- 4 -

1. In the case of a Participant’s resignation or retirement, the day on which the Participant ceases to be anemployee of the Company.
2. In the case of the dismissal of the Participant or any other termination of employment not otherwise addressed, whether
for cause or otherwise, the earlier of the date on which the Participant receives notice of termination of employment orthe day on which the Participant ceases to be an employee of the Company.
3. In the case of any single-member limited liability company or single-shareholder corporation providing executive
management services to the Company or its Subsidiaries through its sole member or shareholder, the day thatprovision of executive management services ceases.
SECTION 8
Amendment and Termination
The Committee may amend the Plan at any time and from time to time. The Committee may terminate the Plan at any time.
SECTION 9Other Provisions
(a) No Eligible Employee or other person shall have any claim or right to be granted an Award under the Plan. Neither the
establishment of this Plan, nor any action taken hereunder, shall be construed as giving any Eligible Employee any right to beretained in the employ of the Company or any of its subsidiaries. Nothing contained in the Plan shall limit the ability of theCompany to make payments or awards to Eligible Employees under any other plan, agreement or arrangement.
(b) The rights and benefits of a Participant hereunder are personal to the Participant and, except for payments made
following a Participant’s death, shall not be subject to any voluntary or involuntary alienation, assignment, pledge, transfer,encumbrance, attachment, garnishment or other disposition.
(c) Awards under the Plan shall not constitute compensation for the purpose of determining participation or
benefits under any other plan of the Company unless specifically included as compensation in such plan.
(d) The Company (or the Participant’s employing company) shall have the right to deduct from Awards any taxes or
other amounts required to be withheld by law.
(e) Nothing contained in the Plan shall be construed to prevent the Company or any of its subsidiaries from taking any
corporate action which is deemed by it to be appropriate or in its best interest, whether or not such action would have anadverse effect on any Awards made under the Plan and nothing in the Plan shall be deemed to limit or restrict the ability of theCompany or any of its subsidiaries from establishing any compensation plan or arrangement, or making any payment, orgranting any Award to any Eligible Employee or other person. No employee, beneficiary or other person shall have any claimagainst the Company or any of its subsidiaries as a result of any such action.
- 5 -

(f) All questions pertaining to the construction, regulation, validity and effect of the provisions of the Plan shall bedetermined in accordance with the laws of the State of Texas without regard to principles of conflict of laws.
(g) No member of the Committee or the Board, and no officer, employee or agent of the Company shall be liable for any
act or action hereunder, whether of commission or omission, taken by any other member, or by any officer, agent, or employee,or, except in circumstances involving bad faith, for anything done or omitted to be done in the administration of the Plan.
(h) (Applies to United States Eligible Employees Only) - Nothing in the Plan is intended to or shall change the
nature of any Participant’s employment from being “at will,” terminable by the employer or employee at any time,with or without notice.
(i) (Applies to Canadian and United Kingdom/European Union Eligible Employees Only) - Nothing in the Plan is intended
to or shall change the nature of any Participant’s contract of employment with the Company or affect the Company’s right toterminate the employment of the Participant.
(j) Nothing in this Plan is intended to change the nature of the contract to provide executive management services or affect
any right to terminate such contract, in the case of any single-member limited liability company or single-shareholder corporationproviding executive management services to the Company or its Subsidiaries through its sole member or shareholder.
(k) Awards granted under this Plan shall be subject to any compensation recoupment policy that the Company may adopt
from time to time that is applicable by its terms to the recipient of such award.”
SECTION 10Effective Date
The Plan shall be effective as of October 1, 2018.
- 6 -

Exhibit 21.1
SALLY BEAUTY HOLDINGS, INC. LIST OF SUBSIDIARIES Sally Investment Holdings LLC (Delaware) Sally Holdings LLC (Delaware) Beauty Systems Group LLC (Virginia) (1) Armstrong McCall Holdings, Inc. (Texas) Armstrong McCall Holdings, L.L.C. (Delaware) Armstrong McCall Management, L.C. (Texas) Armstrong McCall, L.P. (Texas) Innovations-Successful Salon Services (California) Procare Laboratories, Inc. (Delaware) Neka Salon Supply, Inc. (New Hampshire) Salon Success International, LLC (Florida) Loxa Beauty LLC (Indiana) Sally Beauty Supply LLC (Virginia) Diorama Services Company, LLC (Delaware) Sally Capital Inc. (Delaware) Sally Beauty Military Supply LLC (Delaware) Arcadia Beauty Labs LLC (Delaware) Sally Beauty International Finance LLC (Delaware) Beauty Holding LLC (Delaware) Sally Beauty International, Inc. (Delaware) Sally Beauty Supply BV (Netherlands) Pro-Duo Deutschland GmbH (Germany) Sally Beauty Canada Holdings LLC (Delaware) SBCBSG Company de Mexico, S. de R.L. de C.V. (Mexico) (2) SBIFCO Company de Mexico, S.A. de C.V. (Mexico) (2) SBCEDIS Company de Mexico, S. de R.L. de C.V. (Mexico) Sally Beauty International Holdings C.V. (Netherlands) Sally International Holdings LLC (Delaware) Sally Beauty Holdings LP (Bermuda) Sally EURO Holdings LLC (Delaware) Sally CAD Holdings LLC (Delaware) Sally GBP Holdings LLC (Delaware) Gen X Beauty LLC (Delaware) SBIFCO (Barbados) SRL (Barbados) Sally Beauty Netherlands BV (Netherlands) SBH Finance B.V. (Netherlands) Sally Beauty de Puerto Rico, Inc. (Puerto Rico) (3) Sally Salon Services (Ireland) Ltd (Ireland) Sally Beauty Colombia S.A.S. (Colombia) (5) Sally Chile Global Holdings SpA (Chile) Sally Chile Worldwide Holdings SpA (Chile) Pro-Duo Spain SL (Spain) Sally UK Holdings Limited (England) BSG Canada Holdings Company (Nova Scotia) Beauty Systems Group (Canada), Inc. (New Brunswick) (3) Sally Salon Services Ltd (England) MHR Limited (England) Sally Chile Holding SpA (Chile) (4) Sally Peru Holdings S.A.C. (Peru) (5) Sinelco Group BVBA (Belgium) Sinelco International BVBA (Belgium)

Sinelco Italiana SRL (Italy) Sinelco France SAS (France) Salon Services (Hair and Beauty Supplies) Ltd (Scotland) Salon Services Franchising Ltd (Scotland) Salon Success Limited (England) (6) Ogee Limited (England) Pro-Duo NV (Belgium) Pro-Duo France SAS (France) Vigox BVBA (Belgium) Kapperscentrale Bauwens N.V. (Belgium) 1. Doing business as CosmoProf 2. Doing business as Sally Beauty Supply 3. Doing business as CosmoProf and Sally Beauty Supply 4. Doing business as Sally Beauty and Intersalon 5. Doing business as Sally Beauty 6. Education division doing business as 3∙6∙5

Exhibit 23.1
Consent of Independent Registered Public Accounting Firm
The Board of DirectorsSally Beauty Holdings, Inc.:
We consent to the incorporation by reference in the registration statements on Form S-3 (Registration No. 333-224753) and on Form S-8 (Registration Nos. 333-142583,333-138830, 333-164545, and 333-229444) of Sally Beauty Holdings, Inc. of our report dated November 22, 2019, with respect to the consolidated balance sheets ofSally Beauty Holdings, Inc. and subsidiaries as of September 30, 2019 and 2018, and the related consolidated statements of earnings, comprehensive income, cash flows,and stockholders’ deficit for each of the years in the three-year period ended September 30, 2019, and the related notes (collectively, the consolidated financialstatements), and the effectiveness of internal control over financial reporting as of September 30, 2019, which report appears in the September 30, 2019 annual report onForm 10-K of Sally Beauty Holdings, Inc.
/s/ KPMG LLP
KPMG LLPDallas, TexasNovember 22, 2019
Exhibit 31.1
CERTIFICATIONPURSUANT TO EXCHANGE ACT RULES 13a-14(a) AND 15d-14(a),
AS ADOPTED PURSUANT TO SECTION 302 OF THE SARBANES-OXLEY ACT OF 2002
I, Christian A. Brickman, certify that:
(1) I have reviewed this Annual Report on Form 10-K of Sally Beauty Holdings, Inc.;
(2) Based on my knowledge, this report does not contain any untrue statement of a material fact or omit to state a material fact necessary to make the statements made,in light of the circumstances under which such statements were made, not misleading with respect to the period covered by this report;
(3) Based on my knowledge, the financial statements, and other financial information included in this report, fairly present in all material respects the financialcondition, results of operations and cash flows of the registrant as of, and for, the periods presented in this report;
(4) The registrant’s other certifying officer and I are responsible for establishing and maintaining disclosure controls and procedures (as defined in Exchange Act Rules13a-15(e) and 15d-15(e)) and internal control over financial reporting (as defined in Exchange Act Rules 13a-15(f) and 15d-15(f)) for the registrant and have:
a. Designed such disclosure controls and procedures, or caused such disclosure controls and procedures to be designed under our supervision, to ensure thatmaterial information relating to the registrant, including its consolidated subsidiaries, is made known to us by others within those entities, particularly duringthe period in which this report is being prepared;
b. Designed such internal control over financial reporting, or caused such internal control over financial reporting to be designed under our supervision, toprovide reasonable assurance regarding the reliability of financial reporting and the preparation of financial statements for external purposes in accordancewith generally accepted accounting principles;
c. Evaluated the effectiveness of the registrant’s disclosure controls and procedures and presented in this report our conclusions about the effectiveness of thedisclosure controls and procedures, as of the end of the period covered by this report based on such evaluation; and
d. Disclosed in this report any change in the registrant’s internal control over financial reporting that occurred during the registrant’s most recent fiscal quarter(the registrant’s fourth fiscal quarter in the case of an annual report) that has materially affected, or is reasonably likely to materially affect, the registrant’sinternal control over financial reporting; and
(5) The registrant’s other certifying officer and I have disclosed, based on our most recent evaluation of internal control over financial reporting, to the registrant’sauditors and the audit committee of the registrant’s board of directors (or persons performing the equivalent functions):
a. All significant deficiencies and material weaknesses in the design or operation of internal control over financial reporting which are reasonably likely toadversely affect the registrant’s ability to record, process, summarize and report financial information; and
b. Any fraud, whether or not material, that involves management or other employees who have a significant role in the registrant’s internal control overfinancial reporting.
Date: November 22, 2019
By: /s/ Christian A. BrickmanChristian A. BrickmanChief Executive Office

Exhibit 31.2
CERTIFICATIONPURSUANT TO EXCHANGE ACT RULES 13a-14(a) AND 15d-14(a),
AS ADOPTED PURSUANT TO SECTION 302 OF THE SARBANES-OXLEY ACT OF 2002
I, Aaron E. Alt, certify that:
(1) I have reviewed this Annual Report on Form 10-K of Sally Beauty Holdings, Inc.;
(2) Based on my knowledge, this report does not contain any untrue statement of a material fact or omit to state a material fact necessary to make the statements made,in light of the circumstances under which such statements were made, not misleading with respect to the period covered by this report;
(3) Based on my knowledge, the financial statements, and other financial information included in this report, fairly present in all material respects the financialcondition, results of operations and cash flows of the registrant as of, and for, the periods presented in this report;
(4) The registrant’s other certifying officer and I are responsible for establishing and maintaining disclosure controls and procedures (as defined in Exchange Act Rules13a-15(e) and 15d-15(e)) and internal control over financial reporting (as defined in Exchange Act Rules 13a-15(f) and 15d-15(f)) for the registrant and have:
a. Designed such disclosure controls and procedures, or caused such disclosure controls and procedures to be designed under our supervision, to ensure thatmaterial information relating to the registrant, including its consolidated subsidiaries, is made known to us by others within those entities, particularly duringthe period in which this report is being prepared;
b. Designed such internal control over financial reporting, or caused such internal control over financial reporting to be designed under our supervision, toprovide reasonable assurance regarding the reliability of financial reporting and the preparation of financial statements for external purposes in accordancewith generally accepted accounting principles;
c. Evaluated the effectiveness of the registrant’s disclosure controls and procedures and presented in this report our conclusions about the effectiveness of thedisclosure controls and procedures, as of the end of the period covered by this report based on such evaluation; and
d. Disclosed in this report any change in the registrant’s internal control over financial reporting that occurred during the registrant’s most recent fiscal quarter(the registrant’s fourth fiscal quarter in the case of an annual report) that has materially affected, or is reasonably likely to materially affect, the registrant’sinternal control over financial reporting; and
(5) The registrant’s other certifying officer and I have disclosed, based on our most recent evaluation of internal control over financial reporting, to the registrant’sauditors and the audit committee of the registrant’s board of directors (or persons performing the equivalent functions):
a. All significant deficiencies and material weaknesses in the design or operation of internal control over financial reporting which are reasonably likely toadversely affect the registrant’s ability to record, process, summarize and report financial information; and
b. Any fraud, whether or not material, that involves management or other employees who have a significant role in the registrant’s internal control overfinancial reporting.
Date: November 22, 2019By: /s/ Aaron E. AltAaron E. AltSenior Vice President, Chief Financial Officer and President – Sally Beauty Supply

Exhibit 32.1
CERTIFICATION PURSUANT TO18 U.S.C. SECTION 1350,
AS ADOPTED PURSUANT TOSECTION 906 OF THE SARBANES-OXLEY ACT OF 2002
In connection with the Annual Report of Sally Beauty Holdings, Inc. (the “Company”) on Form 10-K for the fiscal year ended September 30, 2019 as filed with theSecurities and Exchange Commission on the date hereof (the “Report”), I, Christian A. Brickman, Chief Executive Officer of the Company, certify, pursuant to 18 U.S.C.§1350, as adopted pursuant to §906 of the Sarbanes-Oxley Act of 2002, that:
(1) The Report fully complies with the requirements of Section 13(a) or 15(d) of the Securities Exchange Act of 1934; and
(2) The information contained in the Report fairly presents, in all material respects, the financial condition and result of operations of the Company.
By: /s/ Christian A. BrickmanChristian A. BrickmanChief Executive Officer
Date: November 22, 2019

Exhibit 32.2
CERTIFICATION PURSUANT TO18 U.S.C. SECTION 1350,
AS ADOPTED PURSUANT TOSECTION 906 OF THE SARBANES-OXLEY ACT OF 2002
In connection with the Annual Report of Sally Beauty Holdings, Inc. (the “Company”) on Form 10-K for the fiscal year ended September 30, 2019 as filed with theSecurities and Exchange Commission on the date hereof (the “Report”), I, Aaron E. Alt, President of Sally Beauty Supply and Chief Financial Officer of the Company,certify, pursuant to 18 U.S.C. §1350, as adopted pursuant to §906 of the Sarbanes-Oxley Act of 2002, that:
(1) The Report fully complies with the requirements of Section 13(a) or 15(d) of the Securities Exchange Act of 1934; and
(2) The information contained in the Report fairly presents, in all material respects, the financial condition and result of operations of the Company.
By: /s/ Aaron E. AltAaron E. AltSenior Vice President, Chief Financial Officer and President – Sally Beauty Supply
Date: November 22, 2019