Common Sense Mathematics Instructor’s Manualcommonsensemathematics.net/csminstructor.pdf · ·...
34
Common Sense Mathematics Instructor’s Manual Ethan D. Bolker Maura B. Mast April 6, 2018
Transcript of Common Sense Mathematics Instructor’s Manualcommonsensemathematics.net/csminstructor.pdf · ·...
Common Sense MathematicsInstructor’s Manual
Ethan D. BolkerMaura B. Mast
April 6, 2018

Contents
About Common Sense Mathematics 2
A class on GPAs 10
A class on runs 12
Section by section comments on the text 14
1 Calculating on the Back of an Envelope 15
2 Units and Unit Conversions 17
3 Percentages, Sales Tax and Discounts 18
4 Inflation 19
5 Average Values 20
6 Income Distribution — Excel, Charts, and Statistics 21
7 Electricity Bills and Income Taxes — Linear Functions 23
8 Climate Change — Linear Models 25
9 Compound Interest — Exponential Growth 27
10 Borrowing and Saving 28
11 Probability — Counting, Betting, Insurance 29
1

CONTENTS 2
12 Break the Bank — Independent Events 30
13 How Good Is That Test? 31
References 32
About Common Sense Mathematics
The art of teaching requires the instructor to guide his student to work independently to discoverprinciples for himself, and in time to acquire the power of principles to the manifold situations which mayconfront him. [R1]
James Brander Matthews (1852-1929)
Introduction
We understand that if you’re one of those people who skips the instructions when assembling the new porch furniture,the manual when you get a new cell phone or the on line help for a software application, you may never read this.1
That said, we’ll try to make it worth your while.
Both you and your students should understand from the start that this is not a traditional math text for a traditionalmath course. We try to make that clear in the Preface, and in the first few classes at the beginning of each semester.Students rarely believe us. Many complain half way through that this math course isn’t like any other they’ve taken.Where are the formulas? As instructors we often find that hard to remember. Since we’re mathematicians, we’retempted to think (semi)formal mathematics is both more useful and more important than it really is. That comforts us,since it’s something we know how to teach2 so we fall back on it when the real quantitative reasoning issues seem toomessy and frustrating to tackle.
There is real mathematical content here — lots of overlap with what you find in most quantitative reasoning and someliberal arts texts, perhaps with an occasional favorite topic missing, often something more advanced that you mightnot expect. But the mathematics is embedded in discussions of issues most of which most students find genuinelyinteresting.3
There’s much to gain from the fact that this isn’t a regular mathematics course like calculus or linear algebra, oreven college algebra, where some set of topics must be covered to prepare students for the next course. At UMassBoston there is no next course — students are here just to satisfy the quantitative reasoning requirement. So we are(rather ambitiously) trying to prepare students for life. Learning to think a few ideas through is more important thanexposure-for-the-record to lots of ideas.
The text presents each topic in the context of quotations from the media to be understood. Only occasionally wethought it better to make up a problem in order to present a particular idea. In principle, you should replace manyof the stories in the text with current ones as you teach. That’s difficult; we do it ourselves less often than we’d like.There are, after all, advantages to teaching from the text: the material there is class tested. You avoid the risk of havingto muddle through an example you thought would work — until you tried it the first time. Moreover, the students have
1 Please pardon the self-referential paradox.2 Or at least think we know how to teach.3 So we hope, but you can’t please all of the people all of the time.
3
ABOUT Common Sense Mathematics 4
something to read to go along with the class discussion. Save your ingenuity for new homework exercises based oncurrent local news stories.
Unfortunately, many quantitative reasoning instructors are underpaid adjuncts stitching together multiple jobs to ekeout a living. Perhaps it’s unfair to ask them to spend the extra time it can take to teach from our text. We hope that theincreased satisfaction can be its own reward. Fortunately, it does become easier with time.
Constructing a syllabus
The semester at UMass Boston is fourteen weeks long, which suggests that a chapter a week is about the right pace.At that pace we find it impossible to cover all of each chapter. Instead we choose a few sections or topics that we thinkwill particularly interest the particular group of students that semester, and think about them thoroughly. Sometimeswe build a class around one of the exercises.
The chapters fall naturally into three groups.
• Chapters 1-4 deal with numbers a few at a time. The central concepts are estimation, working with units,absolute and relative change and percentages. The first chapter, on Fermi problems, sets the tone for the entiretext.
• In Chapters 5-10 we work with sets of numbers. Chapter 5 on averages introduces weighted averages as a moreuseful concept than the simple mean. It also provides a bridge to Chapter 6, where we use Excel to study themean, median and mode for real data sets, to ask “what-if” questions and to draw histograms. The followingchapters introduce linear and exponential functions in useful real world contexts, focusing on implementing andgraphing them in Excel rather than on more traditional algebraic treatments. The algebra does enter surrepti-tiously in the form of cell references in Excel. We think a spreadsheet program for more advanced calculationsis a much better long term time investment for the students than a graphing calculator
• Chapters 11-13 cover probability. The first starts with dice and coins where counting outcomes solves problemsand ends with insurance and extended warranties where probabilities are essentially statistical. The next twochapters address the frequency of rare events like runs and the ease with which you can construct misleadingarguments based on the misuse of conditional probability — of course all done without formal definitions.
Where’s the math?
Answer: embedded in the real applications. You will find (among other things, and not necessarily in order of presen-tation or importance)
• Estimation and mental arithmetic• Scientific notation• Unit conversions and the metric system• Weighted averages• Descriptive statistics (mean, median, mode)• The normal distribution• Linear equations and linear models• Exponential equations and exponential models• Regression• Elementary probability• Independent events

ABOUT Common Sense Mathematics 5
• Bayes’ theorem• Logical thinking• The geometry of areas and volumes
Some mathematics you might expect is missing — primarily because it fails the “should your students remember thisten years from now?” test:
• Formal logic and set theory (and most other formal mathematics)• Laws of exponents (“laws” of just about any kind)• Quadratic equations• The algebra of polynomials• Traditional “word problems”
Homework exercises
We tell students that answers to exercises call for complete sentences, even complete paragraphs. Just circling the(presumably correct) numerical answer isn’t sufficient. Each answer should effectively restate the question. Wesuggest that students write enough prose so that they can use their homeworks to study for the exams without havingto return to the text to reread the questions. We return corrected homeworks promptly, and post solutions (availablein the solutions manual!) that model what we expect from them. We encourage students to turn in word-processeddocuments. Since writing mathematics in those documents is tedious, we suggest that they leave blank space for thecalculations and equations and fill them in legibly by hand.
There are many more exercises in the text than you can use in any one semester. There are more ideas for exercises inthe suplement you can find at commonsensemathematics.net .
We find that weekly homework tends to work best. We’ve taken to spending some of the time flipping the classroom:having students start homework exercises in groups in class, asking for help when they need it. We always encouragestudents to start each assignment when it’s posted, so that they can ask questions before the due date.
Most homework exercises relate to material already taught. We also find it helpful to assign some on topics we haven’tyet reached in class. Students are then much better able to participate in discussions.
Grading homework
One early experimenter wrote us with this question:
From: Wesley Rich <[email protected]>
To: [email protected], [email protected]
Subject: Another question about QR
Date: Tue, 5 May 2015 16:54:42 -0400
Drs. Bolker and Mast,
As I have piloted my institution’s QR course this semester,
I have found it difficult to keep up with the grading. It

ABOUT Common Sense Mathematics 6
seems to take much longer than in any other class I have taught.
Do you have any suggestions, tips, special secrets, etc. for
speeding up the grading process? Anything would be appreciated.
*Wesley J. Rich*
Mathematics Instructor
Saginaw Chippewa Tribal College
That prompted this reply.Grading solutions to exercises from Common Sense Mathematics can take a long time. Since the
students can’t just circle an answer and hope it’s right, you can’t just match the answers to an answer key.They have to write, so you have to read, and comment. Here are some ways to make that somewhat easier— and enhance learning. After all, the point of the exercises is to help students learn even more than tofind out what they have learned.
• Assign fewer exercises than you might from another text.
• Think about flipping the classroom: have students start the homework in class, with your help. Thenthey complete the work at home to turn in.
• Assign exercises in class N that are due at class N +2, and answer questions about the questions inclass N +1. (This and the previous suggestion lead to better answers, which are therefore easier toread.)
• Insist from the beginning on complete sentences and legible work, with plenty of white space left onthe page for your comments. Encourage students to use Word, filling in equations by hand afterward.
• Provide answers (from the solutions manual) so you can write “see posted solution” instead ofrepeating a comment about a common error.
• Ask students to read the posted solutions and write explicitly about what they will do differently onthe next assignment.
• Go over some exercises in class on the day they are due, asking students to write on their own papers(with pen if they wrote in pencil, or with a different color), correcting as they go. Encourage themto say things like “I got this wrong but now I understand” or “I am still confused right here”, asappropriate.
• Allow/encourage students to work in pairs. That leads to half as many papers, which will usually bebetter.
• Don’t fuss with numerical grades. Usually a check mark (OK), a minus sign (needs work — pleasecome talk to me) or a plus sign (excellent — may I share this with the class?) suffices.
GoalsTeaching from Common Sense Mathematics is more work than teaching from a standard text with prob-lems at the end of each section that test the mastery of basic techniques rather than the understanding ofimportant ideas.
We’ve tried to provide some help making those ideas explicit. At the start of each chapter you’ll findthat chapter’s goals — the essential ideas we hope the students will begin to master, and the particularmathematics needed for that task.
To help you construct assignments, we’ve tagged the exercises to suggest which goals they tend toaddress and which sections they relate to — often across chapters.
Instructors using Common Sense Mathematics have found that their students often need practice withroutine arithmetic and algebra in order to come to grips with the ideas that are the focus of the text. Toaddress that need, we have included a few review exercises at the ends of some of the chapters. This kindof review is often best addressed with problems with online software support. We recommend that youuse them sparingly, and only as necessary — that is, after the need is clear. We sometimes ask students to

ABOUT Common Sense Mathematics 7
read the review problems and decide for themselves whether they need to work some and turn them in forfeedback.
If you assign review problems first, before the applications in the text, your students may think this isa math course like any other — formal skills to master with no thought as to their usefulness or meaning.
Exams
We usually schedule two hour-long examinations and a final exam. It’s hard to make much use of ten minute in-classquizzes to test the kinds of analysis we are trying to teach.
Our exams take place in a computer lab. We allow “open everything” — textbook, class notes, internet, but, of courseno texting or email asking friends for help. When students react with pleasant surprise to this announcement we pointout that this is exactly what they will have available when they tackle real problems in life — which is what we wantto teach and test. We remind them that allowing access to all these resources means we can ask harder problems thanthey may be used to in an exam. In fact it is difficult to construct exams that truly test the use of common sensemathematics.
Here is the preamble to our first exam:
General guidelines
• When you’ve solved a problem (perhaps on scrap paper), write the answer out neatly on the paperwith the problem (you can use the other side too). Don’t just circle a number. Show all units, andwrite complete sentences. If you’ve used any technology, say so.
• The purpose of this course is to help you learn how to use quantitative reasoning principles to solvereal problems that matter to you. An exam can’t test that well because you must answer the questionsquickly. Here’s a compromise. For homework for Thursday, rethink your answers. If you can writebetter ones, submit them. (Don’t redo problems you got right the first time.) I will correct both theexam and the resubmissions. Getting a problem right the second time isn’t worth as much as gettingit right the first time, but it can make a difference in your grade. The exam is posted on the courseweb page.Work independently. You can email me with questions, but don’t consult with friends or classmatesor tutors.
• Google (and the internet), calculators, class notes and the text are all OK. Make sure you acknowl-edge any help of this kind. But take care. Time spent searching the web or shuffling through notesis time you’re not using to answer the questions. Of course you can’t use the computer to exchangeemail with your classmates during the exam. No text messages either, please.
• Remember to show only the number of significant digits (precision) in your answer justified by thenumbers you start with and the estimates you make. Remember to use the equal sign only betweennumbers that are equal, not as a substitute for words that explain what the numbers mean and whatyou are doing.
The first question on the exam is
1. (5 points) Read the general guidelines — particularly the first two about the form your answersshould take, and the chance to improve your answers between now and Thursday. Write “I under-stand the instructions” here for a free 5 points.
Sad note: All students write a correct answer to this first question but many have not read or understood the instruc-tions!
ABOUT Common Sense Mathematics 8
Vocabulary
From G. K. Chesterton’s The Scandal of Father Brown:
Father Brown laid down his cigar and said carefully: “It isn’t that they can’t see the solution. It is thatthey can’t see the problem.” [R2]
Teaching from early drafts of Common Sense Mathematics we found that students often had so much trouble withvocabulary that they couldn’t even get to the quantitative reasoning.
Here’s a blog entry that addresses that issue, from the sixth class of the semester.
I spent almost all of the rest of the class working the Exercise on Goldman Sachs bonuses (I promisedthat on Tuesday). I knew that the difficulty was in reading the words around the numbers more than inthe manipulations themselves. I was surprised at how important just plain vocabulary problems were.In particular, some students thought “consistent” meant “the same from year to year” (which GoldmanSachs’s data aren’t) and not (when applied to numbers) something like “fit together the way they should.”Later some people didn’t quite grasp that “salaries plus bonuses”, “compensation” and “what GS paidemployees” were all referring to the same quantity.
The same kind of problem came up in a previous class about the meaning of “wholesale.” Since Ican’t anticipate all the words students might not know (both in the course and after they leave) I hope I’veconvinced them that they can’t make sense of paragraphs with numbers in them unless they check out themeanings of words they’re unsure of. That said, I will try not to use fancy ones too often.
One student called the need to think about both the words and the numbers a perfect storm. I hopenot.
. . .Notes later. When I described today’s class to my highly educated wife she said she’d have had the
same trouble as some of the students with the meaning I attached to “consistent.” She did agree after welooked it up in our (hard copy) dictionary that I’d used it correctly — but that it was unreasonable of me toassume my students would have been able to. She suggested I bring a dictionary to class, and a thesaurustoo. I pointed out that we already have a dictionary in class — on line — and that we should have used itright then and there. At dictionary.com the first meaning is
1. agreeing or accordant; compatible; not self-contradictory:
His views and actions are consistent.
The “not self-contradictory” would have cleared things up right away.
Uncertainty
Rob Root, a mathematician at Lafayette teaching from a draft of Common Sense Mathematics, wrote with this com-ment.
In Section 1.1, you don’t consider the (real) possibility that many international calls, in which neitherparty in the call is in the US, still might pass through the US phone network. I believe this helps explainthe “blllions.” At the end of section 1.1, when you mention the 2013 disclosure of metadata on domesticphone calls, you don’t make any guess how much that might increase the volume of calls being followedby the NSA. I would think at least a factor of two, wouldn’t you? Probably more.

ABOUT Common Sense Mathematics 9
We think the questions we ask are particularly useful when they spark this kind of followup question. We hope thathappens a lot in class. For us, every interesting question has the same answer: “it depends” — if you can look up theanswer or find it with easy arithmetic the question isn’t interesting.
Megan McArdle reminds us that
. . . a big part of learning is the null results, the “maybe but maybe not” and the “Yeah, I’m not sureeither, but this doesn’t look quite right.” [R3]
The term paper
We assign one each semester; students choose a topic that they care about, with some guidance from us about whatkinds of topics are suitable. We allow students to work together in pairs if they wish. Some instructors allow, encourageor require students to study some appropriate topic in a group and present to the class.
We pace the students through this significant project by asking them to submit several topic ideas about halfwaythrough the semester. Then we give individual feedback on each student’s choice. A few weeks later we require anoutline or sketch that poses the questions to be answered (with guesses as to the answers) and identifies data sources.Near the end of the semester students turn in a draft. (You may want to arrange some peer review.) The final versionis due at the final exam.
Here are some excerpts from term paper instructions we offer our students.
One of the important parts of this course is the term paper. Yes, you didn’t expect a term paper in amath course. But this one is about quantitative reasoning about things that matter in the real world. Yourpaper will give you a chance to practice that.
You will choose a topic, find some data and quantitative information about it, perhaps form a hypothe-sis, explore “what-if” questions, make estimates, analyze data and draw conclusions. In other words, youwill use many of the techniques and ideas of this course to make a quantitative analysis of a topic thatinterests you.
If you are going to use lots of data from the web to do your analyses (sports statistics, poverty rates)you should not be typing it into Excel one number at a time. Many websites let you download tables in.csv format. “csv” stands for “comma separated values” — and Excel can load those files. Even if csv isnot available there are tricks that let you cut data and then paste it into Excel. If you show me your datasource I can help with that.
You may work with a classmate and submit a joint paper.What should I write about?The best way to do well in this assignment is to write about something that really matters to you. Here
are some ideas suggested by classmates from previous semesters. (This is not a list for you to choosefrom, it’s a guide as to the kinds of topics that might — or might not — work.)
• Business plans.What would it take to open a beauty salon? A bike store? A photography business? Can mygarage band make enough money to support me? Can my rugby club or softball league break evensponsoring a tournament?Each of these questions led to a good paper. The authors had to collect information (often frompersonal or job experience or a friend in the business), build a spreadsheet, ask what-if questionsand analyze the outcomes. They were successful because they had access to the data and enoughknowledge of the activity to make sense of it.Your business plan probably has two parts. The first is the estimate for the startup costs. The secondis the estimate of the cash flow in and out once the business is up and running. I strongly suggest

ABOUT Common Sense Mathematics 10
you focus on the second part. For startup costs, just imagine you will have to borrow the money, andput the monthly loan payment down as an expense in your monthly cash flow spreadsheet. You canvary that amount to see how much you could afford to borrow.Whatever your business (dog training, personal fitness, growing marijuana, ...) you should searchon line for business plans in your kind of business. They will give you some idea of the kinds ofthings you need to consider. Of course real plans will call for a lot more detail than you can providein your paper.
• Can I afford to buy a house?This is a common question and a common topic. Sometimes it works, but most of the time it doesn’t.Much more than the cost of a mortgage is involved. The best papers start by imagining lifestylesand family structure and particular communities to live in and trying to quantify those in some sensebefore plugging in numbers. There are templates on line that help with the ongoing costs of homeownership.
• Sports.There are lots of numbers on the sports pages. Students (mostly guys) really care about them. That’sa good place to begin. But it’s only a beginning. I’ve never seen a successful paper that tries toanswer questions like “do the teams with the highest salaries win the most?” or “are superstarsworth the big bucks?” I have seen a few good sports papers. If you want to try one you have to startwith smaller questions. And you must be careful to find real data to think about. You can’t use thepaper just to sound off about your own firm opinions.
• Personal budgets.This sometimes works and sometimes doesn’t. To do it well you have to collect data on your actualincome and expenses over a reasonable period of time, estimate things you can’t pin down exactly,take into account large expenses that don’t happen every week or month, build a spreadsheet andthen ask and answer reasonable “what-if” questions. There are many web sites that offer Excelspreadsheets you can personalize and fill in to create your budget. Look at several and find one thatmatches your needs. Don’t try to build your own from scratch.
• Transportation.Can I afford to buy a car? Is it better to drive to school or take the T? Often asked, usually notanswered well. I’ve suggested to students tackling it that they try to quantify the parts of the deci-sion that aren’t monetary: time, convenience, . . . but no one has taken the suggestion. You shouldalso consider several alternatives — occasional taxis, zipcar — not just a simple comparison ofcommuting costs.
• Current events topics.You can do a good paper on a current controversy only if you phrase the questions narrowly enough.One common error is to write a paper that’s just a platform for expressing your own opinions,perhaps quoting experts with whom you agree. I’ve seen that done on the legalization of marijuana,on the incidence of rape or domestic violence and on the cost of incarceration (from a criminaljustice major). You can’t do justice to global warming in a paper for this course. You probably can’tdo justice to energy independence. You might be able to manage income inequality. On any of thesetopics you’d do well to argue both sides of an issue, using data to support contradictory opinionsbefore you come to a conclusion.
• Sharing a paper with another professor.If there’s a topic that would work well in another course you are taking you can consider writingabout it if you clear that in advance with me and the other instructor.
A class on GPAs
This posting from our teaching blog shows how we build a class around a couple of homework problems. The studentsfind these particular problems relevant – they care about their GPAs but most don’t really understand how GPA iscalculated or what they can do to improve theirs. We use group work and encourage discussion; as this blog postingshows, this sometimes leads to new or different approaches we hadn’t expected.
Class 10 – Thursday, October 3, 2013
From Maura:
I filled in for Ethan today, who couldn’t make it. He gave me two problems from the book to have the class work on,so that’s what we did. Both problems were about weighted averages. I passed them out and asked them to work ingroups to solve them. The problems:
• What to do to improve a GPA.
• How can Bob have a lower GPA than Alice in fall and spring and a better one for the year?
The first problem built on what the class had done with GPA calculations before the exam. The essential problem isthat a student has 55 credits and a GPA of 1.8 (this is a cumulative GPA — should have emphasized that). The studentwill take 12 credits and needs to raise the GPA above 2.0 to avoid academic suspension. What semester GPA does thestudent need to earn?
While they had done an example last week on calculating semester GPA, the students for the most part weren’t able tomake the leap to using cumulative and semester GPA information together. Some got stuck on the number of coursesthat could make up 12 credits and what individual grades the student should earn. I suggested they keep it simple andjust think of a 12-credit course. The other issue was that quite a few groups proposed a semester GPA of 2.2 and arguedthat since (1.8+2.2)/2 = 2.0, that GPA should work. The tutor and I talked them through the importance of weightingthe 1.8 GPA by the 55 credits and how they would do that. Once the groups heard that, they got the right idea. Most ofthe groups used algebra to solve the problem, but a few did the guess-and-check approach. Both are valid approaches.The algebra approach has the advantage of giving the answer as the lowest possible GPA the student needs to earn.As for guess-and-check, many students took a 4.0 semester GPA and established that this would raise the overall GPAabove 2.0. Well, yes, but that’s not too realistic for a student who is on academic probation. I encouraged them torefine their guess to get a bit closer to the minimum GPA – most settled on 3.0 as close enough. I asked the groups toput their answers on the board and then we talked them through. While all three groups used the algebra approach, onegroup used percentages to represent the weights. This was for part (c), where the student takes 6 credits. The groupargued that 55 out of 61 credits represents just over 90% of the credits, while 6 out of 61 represents just under 10%.Then they finished the calculation. I liked this approach as it illustrated very clearly how much weight is placed on the1.8 GPA and should help students see how the 1.8 GPA is pulling the overall GPA down.
This exercise took a lot longer than I expected — almost 45 minutes. Part of the time was spent talking about whatthey think they would do in that situation. Would they try 12 credits or focus on only 6? The answers varied, with
11

A CLASS ON GPAS 12
good reasoning for both sides. I told them that I’m the one who sends out the probation and suspension letters and myexperience is that it’s better for students to focus on a small number of classes and do well. I then told them that ifthey repeat a course, the grade for the repeat is what’s included in their GPA and the first grade is taken out of theirGPA. They seemed surprised to hear this. The point is that if you are selective and careful about courses you repeat,you can raise your GPA fairly quickly.
Some of them had already moved on to the second question so I gave them some more time on that. This is aparadoxical one. We have two students, Alice and Bob. Alice’s semester GPA is better than Bob’s in both the falland spring semesters, but overall Bob has the higher cumulative GPA. The students were asked to invent courses andgrades that illustrated this paradox. It’s hard to imagine how this could be, until you start to take it apart. The initialapproach of many of the students was to keep everything the same in the two semesters — for example, Alice takes15 credits each semester and earns a 3.7 GPA each semester, while Bob takes 12 credits each semester and earns a 3.5each semester. With this approach, Alice’s cumulative GPA will always be higher than Bob’s. To give Bob the edge,he needs to have a lot of credits (that is, a large weight) with a GPA that is higher than one of Alice’s GPAs. And Aliceneeds to have a lot of credits associated with that GPA. The trick is that Bob’s fall semester GPA could be higher thanAlice’s spring semester GPA. When we talked it through in class, people protested that this wasn’t allowed. But infact it’s legal and the only way to give Bob a higher cumulative GPA. One student put an example on the board for usand we could see how the weights made it work. As an extreme example, I encouraged them to think of Bob taking15 credits with a high GPA in one semester and only 1 credit with a low GPA in the other semester. Balance Alice’scredits and GPA accordingly, and Bob will end up the winner.
It was fun to revisit this group, several weeks after the beginning of the semester. It’s a good group and I was impressedagain at how well they were engaged with the material.
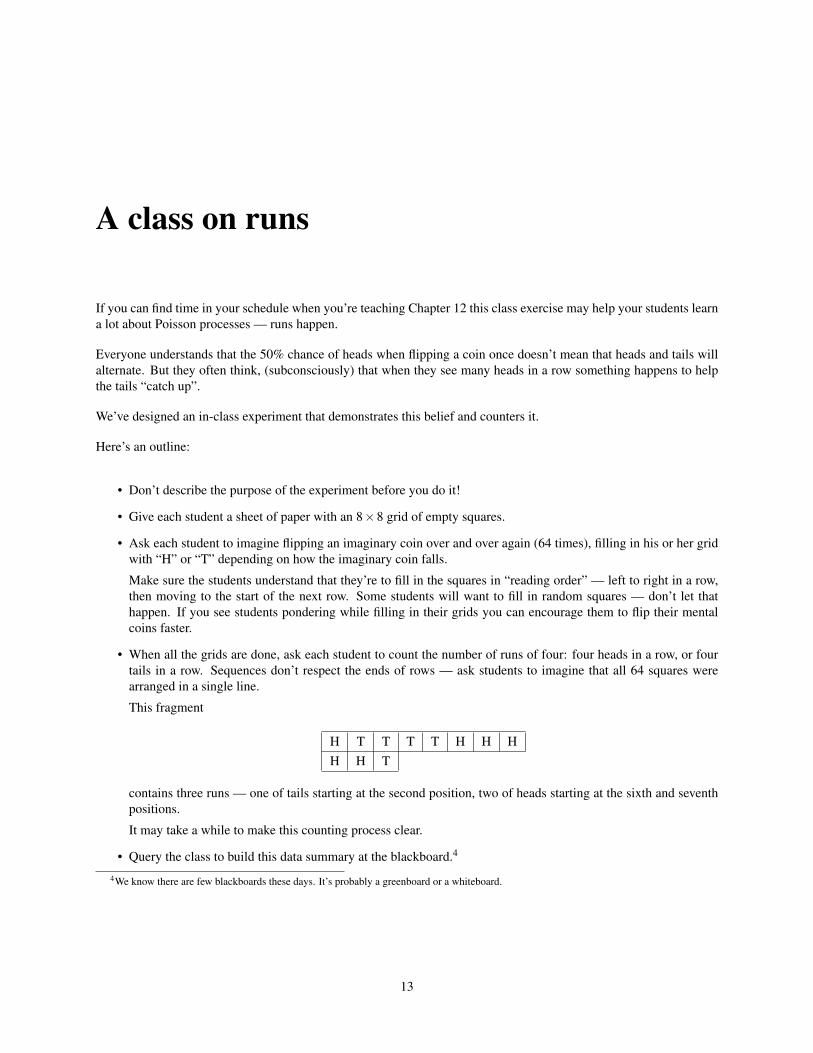
A class on runs
If you can find time in your schedule when you’re teaching Chapter 12 this class exercise may help your students learna lot about Poisson processes — runs happen.
Everyone understands that the 50% chance of heads when flipping a coin once doesn’t mean that heads and tails willalternate. But they often think, (subconsciously) that when they see many heads in a row something happens to helpthe tails “catch up”.
We’ve designed an in-class experiment that demonstrates this belief and counters it.
Here’s an outline:
• Don’t describe the purpose of the experiment before you do it!
• Give each student a sheet of paper with an 8×8 grid of empty squares.
• Ask each student to imagine flipping an imaginary coin over and over again (64 times), filling in his or her gridwith “H” or “T” depending on how the imaginary coin falls.
Make sure the students understand that they’re to fill in the squares in “reading order” — left to right in a row,then moving to the start of the next row. Some students will want to fill in random squares — don’t let thathappen. If you see students pondering while filling in their grids you can encourage them to flip their mentalcoins faster.
• When all the grids are done, ask each student to count the number of runs of four: four heads in a row, or fourtails in a row. Sequences don’t respect the ends of rows — ask students to imagine that all 64 squares werearranged in a single line.
This fragment
H T T T T H H HH H T
contains three runs — one of tails starting at the second position, two of heads starting at the sixth and seventhpositions.
It may take a while to make this counting process clear.
• Query the class to build this data summary at the blackboard.4
4We know there are few blackboards these days. It’s probably a greenboard or a whiteboard.
13

A CLASS ON RUNS 14
number of runs number of students
012· · ·9
• Calculate the average number of runs — a good opportunity to review weighted averages.
• Calculate the expected number of runs per student. It’s not hard to convince the class that the probability for nrandom flips to be all heads or all tails is just 1/2n−1 (you can count all the cases for n = 1,2,3,4). There are 61places on each grid where runs of four might start, so the expected number of runs is 61/8 ≈ 7.6.
You will (almost surely) find your experimental value significantly smaller.
• Now count the runs by column rather than by row, and retabulate. You will find many more, although in ourexperience not usually enough to reach the expected average.
• Discuss.
The first time most students find very few runs of four. Why? You expect about the same number of heads and tails.Your intuition says don’t put too many of each in a row. Your vision of a fair coin is that it should alternate between Hand T fairly often.
When you fill in by rows you switch more often than a real coin would. When you look by columns you’re comparingwhat’s there to what you wrote eight or so flips before. You didn’t remember that far back when you were writing, soyou get a more random distribution of Hs and Ts and, as happens in nature, we will get runs of Hs and Ts.
The key point here is that runs do happen. We think of the probability of getting heads on a coin toss as being 12 , and so
we expect that we will not have a long run of heads, but the rules of probability say that this will happen occasionally.You need to be aware that it is a real possibility.
The Ideas section in The Boston Globe on Sunday, June 17, 2012 carried a story on creating a computer by harnessinghuman social behavior.One quote caught our eye: it suggests that we may not have been the first to imagine thisexperiment.
We asked a couple hundred people to complete a string of 1’s and 0’s, and asked them to make it “asrandom as possible.” As it happens, people are fairly bad at generating random numbers — there is abroad human tendency to suppose that strings must alternate more than they do. And what we found inour Mechanical Turk survey was exactly this: Predictably, people would generate a nonrandom number.For example, faced with 0, 0, there was about a 70 percent chance the next number would be 1. [R4]

Section by section comments on the text
The pages that follow offer comments on the text, pedagogical tips and suggestions for the class and sketches oroutlines of possible extra exercises. When those exercises have solutions, they appear here.
For class-by-class stories about teaching from Common Sense Mathematics, visit our teaching blog at commonsensemathematics.net .
15

Chapter 1
Calculating on the Back of an Envelope
Section 1: This chapter and the next are closely related. You might want to combine them when planning classes andhomework assignments. It was often hard to decide which exercises belonged here, which there.
Real Fermi problems ask for estimates from scratch. We concentrate instead on developing Fermi problem techniquesto verify claims in the media. That’s both easier for students, and follows directly from our focus on working withnumbers in the news — educating our students to be consumers rather than producers of quantitative information. Thetext stresses ideas that help with that: quick mental arithmetic, counting zeroes, some scientific notation and the metricprefixes.
Note that many Fermi problems that used to require estimation skills now succumb to a web query. For example, it’seasy to find a reliable count of the number of kindergarten teachers in the United States.
There are many more exercises in this chapter than you can assign in any single semester. There are more still in thesupplemenary exercises. Some of them can form the basis for a discussion that will fill a whole class period. Considerusing some of them instead of the examples in the text.
Section 2: Counting seconds makes an excellent class early in the semester. Recording the students’ guesses is a goodplace to start.
In class we call approximation with drastic rounding “curly arithmetic”, since ≈ replaces =. The students thencheerfully use the phrase in their homework.
Section 3: Consider asking the students to take their pulses and report the results. Collect the data so you can makethem available in a spreadsheet for the class to play with later when you introduce Excel. You might want to introducemedian and mode quickly — but don’t spend arithmetic time now on the mean.
Section 3: When we first asked if two estimates of the same quantity were “consistent” we discovered that manyof the students didn’t know the word meant. Students’ limited vocabularies turn out to be a source of confusion inmany quantitative reasoning problems. It’s important to be aware of that, and to encourage dictionary use. See theVocabulary section above.
Section 4: When introducing the Google calculator, stress the advantage of a command line (search box) over mouseclicks on buttons — faster, easier to fix mistakes, cut and paste to and from other documents.
Section 4: When converting heartbeats per day to heartbeats per minute the class will probably want to go directly to“divide by 24, then divide by 60.” It may be worth a little blackboard time to write it out with units to prepare for unitconversions later on.
16

CHAPTER 1. CALCULATING ON THE BACK OF AN ENVELOPE 17
Section 5: For an update on this discussion, see www.brinkmanreforestation.ca/millionaires-club
Section 6: When we teach this carbon footprints section in a course (often as the first class) we divide the studentsinto teams of three (since each table in the computer lab happens to have seats for three). Each team starts on one ofthe seven estimates with instructions to move on to the next one when done, circling back to Google search if theyreach the end of the list. The teams start in different places, so after about half an hour the class has found two or threeestimates for each of the seven tasks. The different answers for each task should have the same order of magnitude. Ifthey don’t, we try to figure out why not.
Comments on the exercises
Exercise 1.8.2: There’s a better version of this question in the extra exercises at commonsensemathematics.net .
Exercise 1.8.34: This is a particularly provocative example since almost everyone’s first guess — including ours — isthat it’s an exaggeration.
Exercise 1.8.50: The material in this exercise on the energy released by nuclear bombs makes a good class, combininghistory, physics and quantitative reasoning about an important subject many current college students know nothingabout.

Chapter 2
Units and Unit Conversions
Section 1: The formal introduction to units might be a place to discuss the distinction between number and amount —discrete vs. continuous measurement, and the accompanying grammatical questions. It makes sense to say “I boughtfive pounds of potatoes” or “I bought five potatoes” — note the different units. You can’t say just “I bought five”. Butbe careful. Students may find this both pedantic and distracting.
Section 8: The bad news is that this carpeting problem is another artificial one with easy numbers. The good news isthat it’s accompanied by some practical advice for painting.
Comments on the exercises
Exercise 2.9.37: The problem on the Arizona border fence is interesting because it’s political, the computations areeasy and the answers don’t make sense.
18

Chapter 3
Percentages, Sales Tax and Discounts
Section 1: In principle, the content of this chapter is a review of material on percentages students learned in highschool. In fact the review is necessary. Moreover, the presentation is a little more sophisticated, and, we hope, bothmore useful and more interesting, than what they’ve seen already. So even for those who remember it, there’s valueadded here.
Section 4: Speaking mathematically, we’d rather have the relative change be the fraction new/old, paralleling thedefinition of absolute change as new−old. But speaking practically, for the target student audience it’s better to thinkof the relative change as the difference new/old− 1. But note that when computing exponential growth later in thebook we’ll want to go back to new/old.
Section 4: It’s hard to persuade students to learn the “multiply by 1+change” trick. But it’s well worth the effort,which will pay big dividends later when looking at inflation, interest rates and exponential growth. And it helps wakeup students who might otherwise see this material as just boring review of things they once knew and think they stillknow.
Comments on the exercises
Exercise 3.10.6: The Gulf oil spill in the summer of 2010 generated lots of data along with the oil. If it had happenedduring the semester we might have used it daily.
Exercise 3.10.26: This exercise is worth spending class time on.
Exercise 3.10.30: Much to our surprise, we found that about a third of the class didn’t know what “wholesale price”meant when we first assigned this problem on markups. Now there’s a hint in the back of the book.
Exercise 3.10.40: This problem comparing private label to branded goods turned out to be more interesting than wethought. There are several decreases (negative values) to deal with. The answer in the solutions manual shows howthe 1+ trick lets you find the relative increase without first finding the absolute increase.
Exercise 3.10.45: This exercise is an advance look at the mathematics of compound interest.
Exercise 3.10.51: Each semester we try to find a current news story that students might respond to with a letter to theeditor or an online comment at the appropriate website. We assign a draft letter or comment as an exercise, discuss theresults in class and offer extra credit for submitted or published comments.
19
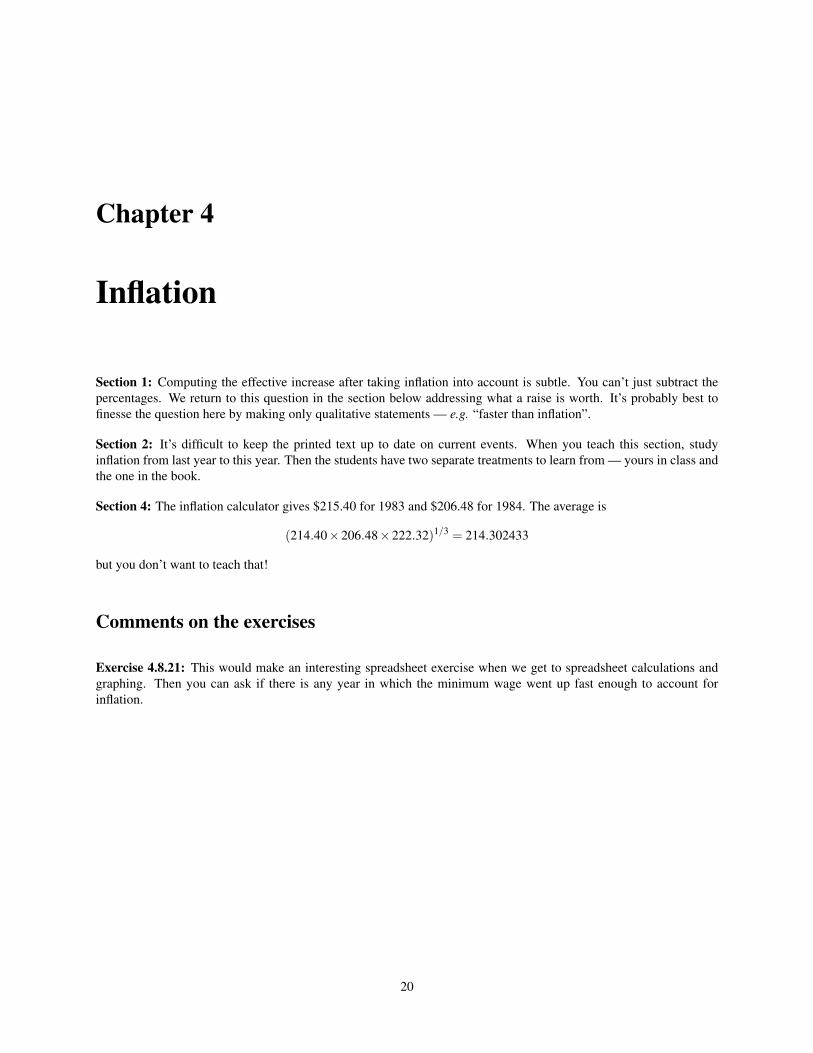
Chapter 4
Inflation
Section 1: Computing the effective increase after taking inflation into account is subtle. You can’t just subtract thepercentages. We return to this question in the section below addressing what a raise is worth. It’s probably best tofinesse the question here by making only qualitative statements — e.g. “faster than inflation”.
Section 2: It’s difficult to keep the printed text up to date on current events. When you teach this section, studyinflation from last year to this year. Then the students have two separate treatments to learn from — yours in class andthe one in the book.
Section 4: The inflation calculator gives $215.40 for 1983 and $206.48 for 1984. The average is
(214.40×206.48×222.32)1/3 = 214.302433
but you don’t want to teach that!
Comments on the exercises
Exercise 4.8.21: This would make an interesting spreadsheet exercise when we get to spreadsheet calculations andgraphing. Then you can ask if there is any year in which the minimum wage went up fast enough to account forinflation.
20
Chapter 5
Average Values
Section 1: Decide whether you want to point out that the units of the average are the same as the units of the thingsyou are averaging, since the weights are dimensionless. Sometimes we do, sometimes we don’t. The observation mayconfuse students while they are working to master the new concept.
Section 2: Students find this section on grade point average computation compelling — many often say they had noidea how it was done and are delighted to have found out. It makes the weighted average concept clear in a contextthat really matters.
Section 3: We find that many students solve this equation by writing some version of
90×2.8+30 G120
= 3.0 = 360 = 108 = 3.6.
You can of course see what they’re thinking, and the answer is the right value of G. Their prose (if that’s what you cancall it) conflates “=” meaning “is the same number as” with “=” meaning “is the same equation as”. We constantly askfor “more words” and can’t seem to get them. If you know how, please let us know.
Section 3: It’s worth taking a little time to practice the guess-and-adjust-your-guess strategy. It may not be as efficientas algebra in situations like this, but it’s much more generic and much less arcane. Students can understand andappreciate it and might even remember it.
One of the readers of an early version of Common Sense Mathematics suggested that we start the solution with guess-and-check and finish with algebra, to reinforce the value of a viable understood strategy compared to one that may bemurky and must be remembered. Consider that when you lecture on the material.
Section 6: This paradox is a well known phenomenon. See Chapter 6, A Small Paradox, in Is Mathematics Neces-sary?, Underwood Dudley (ed.), Mathematical Association of America, 2008, and further references there.
Comments on the exercises
21

Chapter 6
Income Distribution — Excel, Charts, andStatistics
Section 1: We find students come to our course with a wide range of technology experience. They can all manageword processing, web searching and email. Some have used Excel. Those for whom it is new find this chapter hardgoing. Often pairing experienced and inexperienced students in the lab classroom works well.
Section 3: Don’t let your students even think about doing spreadsheet work on their smart phones.
Section 5: When teaching Excel in a classroom we strongly recommend drawing bar charts first by hand on the board,and asking students to do the same on paper on homework and exams. That strategy helps in the next chapter, wherescatter plots are called for and students often accidentally draw a line chart instead.
Section 5: Excel can use separate vertical scales to plot two data series. We think it’s more useful and more interestingto teach this ad hoc solution.
Section 8: The hand drawn figure showing when ( mode < median < mean ) may seem unprofessional, but in fact wethink it’s useful. It’s more like what a student could produce than a fancy graphic would be. We should probably havemore pictures like this.
Section 9: We find this a particularly valuable section — it forces students to come to grips with the real meaning ofeach kind of average. Just memorizing definitions suffices for short lists of numbers, but for grouped data the medianis a little subtle and the mean is a weighted average. Real understanding is required.
We recommend thinking about mode, median and mean in that order.
In the fall of 2015 just as Common Sense Mathematics was going to press one of us was teaching from the text in aclassroom with no computers. The cart with the machines we needed wasn’t ready yet just as we were about to startthis chapter on Excel. Necessity mothering invention led us to introduce the calculation of mode, median and meanfrom a histogram at the blackboard rather than with a spreadsheet. We worked the exercises on teen texting and themen’s Boston Marathon finishing times. Then when we treated the same material using Excel the students didn’t haveto learn the ideas along with the software, and knew what the answers should look like. It was too late to rewrite thischapter. Do think about rearranging your syllabus.
Section 9: You will need to take time here to explain both the miracle — Excel guessed that updating references waswhat was wanted — and its value in saving time and typing. It takes getting used to.
Section 12: This is one of those places where it’s hard to find the right compromise between appropriate simplifications
22

CHAPTER 6. INCOME DISTRIBUTION — EXCEL, CHARTS, AND STATISTICS 23
and actual untruths about what the concepts mean and the numbers say. It might well take a whole class period toexpand on the discussion here. You have to decide whether that’s how you want to spend class time.
Comments on the exercises
Exercise 6.14.14: This exercise may be worth assigning for the Excel practice, and for reinforcing the computationsof various averages from summarized data. But the conclusions aren’t very striking.
Exercise 6.14.23: Your students will probably not think this topic is useful or interesting but it might be fun ifintroduced in class.

Chapter 7
Electricity Bills and Income Taxes — LinearFunctions
Section 1: In a course devoted more to real life applications than to modeling, you can move directly to the section ontaxes. There’s no explicit need there for the slope-intercept description of a linear model.
Section 3: We usually treat the slope and intercept as given data, since that’s how they appear in the world. Computingthe slope as ∆y/∆x belongs in an algebra class that’s leading to calculus, but not here.
Section 4: Since the entries in the Tamworth Electricity Bill table are out of order, Excel has drawn some of thesegments in the graph twice. You can see that if you look carefully. You might want to point this out, or not.
Section 6: We’re undecided about how much time to spend on power and energy. It takes a lot of teaching time (andenergy) to convey the distinction convincingly in class. Perhaps those resources are better spent on other parts ofthe curriculum. But the topic is important and ultimately interesting, because students care about climate change andalternative power sources. We have included problems that explore the issue further.
If you do choose to spend more time on the difference between power and energy, and the confusion because the name“watt-hour” contains a unit of time, consider discussing the light-year, which is a measure of distance, not time. So“light-years ago” is never right. The knot — one nautical mile per hour — is also a rate, like power, that doesn’tmention time.
Section 7: In the tax rate brouhaha in the 2008 election we recall reading a story about a dentist who complained thathe would need to be careful not to let his income exceed $250,000 — where candidate Obama drew a no-new-taxesline — lest his overall tax rate increase. If you find the story let us know and we’ll turn it into an exercise.
Comments on the exercises
Exercise 7.8.7: Exponential decay might be a better model than linear for this exercise on the Newton trees. Considerreturning to it when you reach that topic later in the text.
Exercise 7.8.20: The article on the quarry water cooling system also asserts that
The system ... cost only about $700,000 more than a traditional cooling system, meaning Biogen Idecshould get a return on its investment in eight to ten years.
24

CHAPTER 7. ELECTRICITY BILLS AND INCOME TAXES — LINEAR FUNCTIONS 25
Discussing payback time might be interesting — or too difficult.

Chapter 8
Climate Change — Linear Models
Section 1: The students may all be interested in this topic, so they will want to think about it. The consensus amongclimate scientists is that it’s real and anthropogenic, but the real science is complex.
We do teach how to find regression lines (using Excel). But you can’t draw reliable conclusions from simple re-gressions like the ones here. So treat this material respectfully and cautiously. Our approach stresses skepticismthroughout. Rather than teaching regression as a tool students can use, we treat it as a tool often misused.
This part of this chapter, like the start of the last one, is written as an Excel tutorial. If possible, students should followalong, checking the steps using Excel as they read or as you lecture.
Section 1: If you are working on this section in a classroom that allows you to project a spreadsheet onto a screen youcan reach you can eyeball the regression line with a yardstick.
Section 1: This nonsense slope surprised us when it occurred during a class we hadn’t prepared carefully. That turnedout to be useful — the students saw their teacher seeing that a number made no sense, then looking for an explanation.
The answer raised an important point — one worth emphasizing whenever it comes up. Encourage your students touse more digits in any intermediate calculation — in particular, when working with the trendline equation. Even better,encourage them to think about the numbers and the graph. That’s the best approach.
Section 1: When we reviewed this chapter, we ended up arguing about the validity of a prediction 10 years into thefuture. Students who know a bit about extrapolation may raise that issue; others may ask why we bothered to predictto 2010 if we already had the data. Here’s part of our dialogue:
Maura: Philosophically, I’m more comfortable with a prediction into the next year as opposed to a prediction 10 yearsin the future. That’s the other reason why I’d like to include the data through 2010 in the graph.
Ethan: The temperature data is so erratic that any prediction is likely to be wrong. I picked 10 years because we haveactual data that far out so I could use a part of the data as an experiment. One year wouldn’t be good visually.
Section 3: We have deliberately omitted any discussion of the correlation coefficient R. We found when we taughtthat material from an early draft of Common Sense Mathematics we used up a lot of class time on material that didnot meet our “what should students remember ten years from now?” criterion for inclusion. We think that thinkingqualitatively about R2 is sufficient.
Section 4: Do spend some time teaching the students to scrape data using cut and paste. That and the fact that Excelcan read .csv files will save them grief in this course and whenever they use Excel. Tell them “csv” stands for “comma
26

CHAPTER 8. CLIMATE CHANGE — LINEAR MODELS 27
separated values”. Point them to en.wikipedia.org/wiki/Comma-separated_values .
Comments on the exercises
Exercise 8.5.1: This is an interesting exercise to work in class.

Chapter 9
Compound Interest — Exponential Growth
Section 4: Of course you don’t need to rely on experiments to know that the doubling time is independent of theinitial value. It’s very easy to prove with a little bit of algebra. But this is a book about quantitative reasoning, notabout algebra. For its intended audience the experiments are more convincing than the more formal mathematics manypeople find mysterious.
Section 4: If we were teaching algebra and not quantitative reasoning we might use a negative exponent to write(1/2)10 as 2−10. But we’re not, so we don’t, so we avoid the time it would take to remind students about working withnegative exponents.
Section 5: The material in this section on bacterial growth is at the edge of what we think students in a quantitativereasoning course need. It deals with real data, not the artificial doubling time problems in most books. Carryingthrough the discussion in sufficient detail so that students could solve similar problems would take time better spent onother topics. But if there’s time in the syllabus there are ideas here worth exploring. They tie together all the themesof the chapter.
Comments on the exercises
28

Chapter 10
Borrowing and Saving
Section 5: If you want to take this just a little bit further you can tell the class that the doubling time for continuouscompounding is ln2/r ≈ 0.6931/r, hence the rule of 70.
Comments on the exercises
29

Chapter 11
Probability — Counting, Betting, Insurance
Exercise 11.0.13: Probability is hard, often counterintuitive. We deal with it in three chapters. This one is about thebasic quantitative notion, focusing first on the easy cases coming from games of chance, but not spending significanttime on the combinatorics. In the next chapter we take on repeated independent events, the bell curve, and rare events.In the last chapter we take on conditional probability, but without formulas. Throughout the discussion we oftenfind that there are ideas about probability that should be thought about but that don’t fit nicely into simple numericalexamples, either real or imagined.
Our choice of “invented” instead of “discovered” mathematics in the chapter introduction is deliberate. You mightwant to discuss that philosophical question in class.
Section 2: Consider not even mentioning the formulas for converting from odds to probabilities and back lest thestudents latch on to them as more important than they are.
Comments on the exercises
Exercise 11.9.9: This Exercise is worth class time. You could ask your students to update it with current data aboutyour state.
Exercise 11.9.16: Ben Bolker suggests analyzing this hiring dilemma using a payoff matrix, with utilities associatedwith each state (awful, ok, great). Then we could compute an expected value for each action (hire known, hireunknown) in terms of the various probability and payoff assumptions. This would be cool in Excel.
30

Chapter 12
Break the Bank — Independent Events
Section 1: We’ve deliberately avoided the technical term “sample space”. We do present the idea, but don’t thinkcombinatorial computations that require formal reasoning belong in a course at this level.
Section 5: Of course0.99100 = 0.366032341 ≈ 1
e= 0.367879441
but you don’t want to go there with this class.
Comments on the exercises
31

Chapter 13
How Good Is That Test?
Exercise 13.0.18: This chapter focuses on two way contingency tables in order to discuss several important commonlogical pitfalls dealing with everyday probabilities. We think that approach makes more sense, and is easier to remem-ber and apply, than an explicit treatment of dependent events and Bayes’ theorem. That’s too technical for our goalsin this quantitative reasoning text, and so better left for a full course in probability and statistics. In fact, many of theexamples in this chapter employ qualitative rather than quantitative reasoning.
You can even skip the first two sections and the vocabulary of dependent events and start with the section on screeningfor rare diseases.
If you want to go further into the analysis of dependence (perhaps leading to Bayes’ theorem) consider two way tablesas the entry point. Independence corresponds to tables whose rows (and hence columns) are proportional. Those arethe only ones that can be modeled using areas of parts of a square, as in the last chapter.
Causation corresponds to tables with a 0 in one quadrant.
Section 1: The data in this example are rather parochial. You might want to find some that mean more to yourparticular class.
Section 1: What we do with tables can of course also be done with formulas — the most important one is Bayes’ rule.We don’t work with the formulas since we think the tables are easier to understand and the methods using them easierto remember.
Section 4: This example started out as an exercise. We discovered (and should not have been surprised) that it’stoo complex for most students to read on their own, even this late in the semester when they are used to seeing hardquestions.
Comments on the exercises
32

References
The references here identify the sources for data and quotations in the text and exercises. Citing sources is a necessarypart of good academic work. That does not mean you need to follow these links: you should be able to read the textand work the exercises without having to consult the original sources.
R1 c250.columbia.edu/c250_celebrates/remarkable_columbians/brander_matthews.html (last visited March 10,2016)
R2 G. K. Chesterton, The Scandal of Father Brown, gutenberg.net.au/ebooks02/0201031.txt (last visited July 20, 2015).
R3 M. McArdle, Why We Fall for Bogus Research, BloombergView (August 31, 2015),www.bloombergview.com/articles/2015-08-31/why-we-fall-for-bogus-research (last visited September 14,2015). reported in Andrew Gelman’s blog, andrewgelman.com/2015/09/12/yes/
R4 S. Arbesman and N. Christakis, Introducing the human computer, The Boston Globe (June 17, 2012)www.bostonglobe.com/ideas/2012/06/16/introducing-human-computer/K7j1YK6MZYsB6qAhaqixrJ/story.html
33