Common and unique components of response...
18
Common and unique components of response inhibition revealed by fMRI Tor D. Wager( a, T Ching-Yune C. Sylvester( b Steven C. Lacey( b Derek Evan Nee( b Michael Franklin( and John Jonides b a Department of Psychology, Columbia University, 1190 Amsterdam Avenue, New York, NY 10027, USA b Department of Psychology, University of Michigan, USA Received 16 September 2004; revised 30 December 2004; accepted 11 January 2005 Available online 12 July 2005 The ability to inhibit inappropriate responses is central to cognitive control, but whether the same brain mechanisms mediate inhibition across different tasks is not known. We present evidence for a common set of frontal and parietal regions engaged in response inhibition across three tasks: a go/no-go task, a flanker task, and a stimulus – response compatibility task. Regions included bilateral anterior insula/frontal operculum and anterior prefrontal, right dorsolateral and premotor, and parietal cortices. Insula activity was positively correlated with interference costs in behavioral performance in each task. Principal components analysis showed a coherent pattern of individual diffe- rences in these regions that was also positively correlated with performance in all three tasks. However, correlations among tasks were low, for both brain activity and performance. We suggest that common interference detection and/or resolution mechanisms are engaged across tasks, and that inter-task correlations in behavioral performance are low because they conflate measurements of common mechanisms with measurements of individual biases unique to each task. D 2005 Published by Elsevier Inc. Keywords: Response inhibition; fMRI; Executive; Frontal Introduction Withholding inappropriate responses is a hallmark of human behavior. This can be observed in many individual tasks in which the tendency to make an automatic or natural response must be suppressed in order to make an appropriate but unnatural response. Much research has been concerned with cases in which conflicting motor responses of this sort are engaged (e.g., Dagenbach and Carr, 1994; Dejong et al., 1995; Anderson and Spellman, 1995; Kornblum et al., 1990). It is often argued that resolving cases of motor conflict requires the engagement of inhibitory processes that dampen the tendency to make the inappropriate response in favor of the appropriate one (e.g., Kornblum and Requin, 1995; Logan, 1985; Logan and Cowan, 1984; Lowe, 1979). The issue we address is, are these inhibitory processes all of a sort? That is, when one has to inhibit an inappropriate motor response in one situation, are the same mechanisms recruited as when one has to inhibit a response in another situation? We engaged this issue by conducting a simple experiment, collecting behavioral and fMRI data: All participants were presented with three tasks in which avoiding an inappropriate response was required. The three tasks varied in their specific demands and perceptual components, but they shared a common need to inhibit inappropriate responses. One was a stimulus – response compatibility task (SRC), which, on some trials, required overcoming a compatible stimulus – response mapping in order to respond appropriately to each stimulus. For example, upon viewing an arrow pointing to the left, one might be required to either press a key with the left hand (compatible mapping) or the right hand (incompatible mapping). We compared responses in the incompatible mapping condition to those in the compatible one to isolate interference-resolution processes (including response inhibition) involved in this task. A second task involved the go/no-go paradigm (GNG), in which two types of stimuli were presented, one requiring a response and the other requiring the withholding of a response. Participants were instructed to respond as quickly as possible to each target stimulus – for example, the letter X – and withhold a response to a non-target stimulus (e.g., the letter Y). We compared ‘‘no-go’’ trials, which required response inhibition, with ‘‘go’’ trials in which the response was executed. The third situation was a flanker task in which a response had to be made to a central stimulus while ignoring flanking stimuli (Eriksen and Eriksen, 1974). For example, a centrally presented color patch (blue or yellow) was mapped to a right-hand response. The two flanking color patches were mapped to the same response (congruent) or a different 1053-8119/$ - see front matter D 2005 Published by Elsevier Inc. doi:10.1016/j.neuroimage.2005.01.054 T Corresponding author. E-mail address: [email protected] (T.D. Wager). Available online on ScienceDirect (www.sciencedirect.com). www.elsevier.com/locate/ynimg NeuroImage 27 (2005) 323 – 340
Transcript of Common and unique components of response...
www.elsevier.com/locate/ynimg
NeuroImage 27 (2005) 323 – 340
Common and unique components of response inhibition
revealed by fMRI
Tor D. Wager(a,T Ching-Yune C. Sylvester(b Steven C. Lacey(b Derek Evan Nee(b
Michael Franklin( and John Jonidesb
aDepartment of Psychology, Columbia University, 1190 Amsterdam Avenue, New York, NY 10027, USAbDepartment of Psychology, University of Michigan, USA
Received 16 September 2004; revised 30 December 2004; accepted 11 January 2005
Available online 12 July 2005
The ability to inhibit inappropriate responses is central to cognitive
control, but whether the same brain mechanisms mediate inhibition
across different tasks is not known. We present evidence for a common
set of frontal and parietal regions engaged in response inhibition across
three tasks: a go/no-go task, a flanker task, and a stimulus–response
compatibility task. Regions included bilateral anterior insula/frontal
operculum and anterior prefrontal, right dorsolateral and premotor,
and parietal cortices. Insula activity was positively correlated with
interference costs in behavioral performance in each task. Principal
components analysis showed a coherent pattern of individual diffe-
rences in these regions that was also positively correlated with
performance in all three tasks. However, correlations among tasks
were low, for both brain activity and performance. We suggest that
common interference detection and/or resolution mechanisms are
engaged across tasks, and that inter-task correlations in behavioral
performance are low because they conflate measurements of common
mechanisms with measurements of individual biases unique to each
task.
D 2005 Published by Elsevier Inc.
Keywords: Response inhibition; fMRI; Executive; Frontal
Introduction
Withholding inappropriate responses is a hallmark of human
behavior. This can be observed in many individual tasks in which
the tendency to make an automatic or natural response must be
suppressed in order to make an appropriate but unnatural response.
Much research has been concerned with cases in which conflicting
motor responses of this sort are engaged (e.g., Dagenbach and
Carr, 1994; Dejong et al., 1995; Anderson and Spellman, 1995;
1053-8119/$ - see front matter D 2005 Published by Elsevier Inc.
doi:10.1016/j.neuroimage.2005.01.054
T Corresponding author.
E-mail address: [email protected] (T.D. Wager).
Available online on ScienceDirect (www.sciencedirect.com).
Kornblum et al., 1990). It is often argued that resolving cases of
motor conflict requires the engagement of inhibitory processes that
dampen the tendency to make the inappropriate response in favor
of the appropriate one (e.g., Kornblum and Requin, 1995; Logan,
1985; Logan and Cowan, 1984; Lowe, 1979). The issue we address
is, are these inhibitory processes all of a sort? That is, when one has
to inhibit an inappropriate motor response in one situation, are the
same mechanisms recruited as when one has to inhibit a response
in another situation?
We engaged this issue by conducting a simple experiment,
collecting behavioral and fMRI data: All participants were
presented with three tasks in which avoiding an inappropriate
response was required. The three tasks varied in their specific
demands and perceptual components, but they shared a common
need to inhibit inappropriate responses. One was a stimulus–
response compatibility task (SRC), which, on some trials,
required overcoming a compatible stimulus–response mapping
in order to respond appropriately to each stimulus. For example,
upon viewing an arrow pointing to the left, one might be required
to either press a key with the left hand (compatible mapping) or
the right hand (incompatible mapping). We compared responses
in the incompatible mapping condition to those in the compatible
one to isolate interference-resolution processes (including
response inhibition) involved in this task. A second task involved
the go/no-go paradigm (GNG), in which two types of stimuli
were presented, one requiring a response and the other requiring
the withholding of a response. Participants were instructed to
respond as quickly as possible to each target stimulus – for
example, the letter X– and withhold a response to a non-target
stimulus (e.g., the letter Y). We compared ‘‘no-go’’ trials, which
required response inhibition, with ‘‘go’’ trials in which the
response was executed. The third situation was a flanker task
in which a response had to be made to a central stimulus while
ignoring flanking stimuli (Eriksen and Eriksen, 1974). For
example, a centrally presented color patch (blue or yellow) was
mapped to a right-hand response. The two flanking color patches
were mapped to the same response (congruent) or a different

T.D. Wager et al. / NeuroImage 27 (2005) 323–340324
response (incongruent) as the target. In this task, we compared
trials in which the flanking stimuli were mapped onto incon-
gruent vs. congruent responses.
The type of response competition in this flanker task may be
similar to that in the SRC task, but the differences may be
important as well: incongruent flankers interfere with incorrect
responses through a newly learned color–response association
rather than an inherent compatibility effect, as in SRC tasks
(Kornblum et al., 1990; Zhang et al., 1999). Also, spatial selective
attention may be profitably used in the flanker task, as flankers are
spatially distinct from the target, but they are not in the SRC task.
Similarly, the inhibition required in the GNG task may be different
from that of the flanker and SRC tasks as it involves the
withholding of a prepotent response, rather the production of an
alternate response.
The question we asked of these three cases was this: Is the same
signature of brain activation obtained across tasks? Alternatively,
are there distinct patterns of brain activation that are tied to
individual situations in which inhibition is required? In either case,
we were also interested in whether the pattern or patterns of brain
activation would correlate with the corresponding behavioral
measures of inhibition.
The question at hand is a pressing one because there is a good
deal of controversy in the literature about whether there are
common mechanisms of inhibition at work in these and other
similar tasks. On the one hand, some previous research with
response interference paradigms has shown a relatively cohesive
set of areas that are involved in these inhibitory tasks. The
anterior cingulate, dorsolateral prefrontal, inferior prefrontal,
premotor, and parietal cortices have all been implicated in SRC
tasks (Dassonville et al., 2001; Iacoboni et al., 1996; Merriam et
al., 2001; Peterson et al., 2002; Schumacher and D’Esposito,
2002), GNG tasks (Casey et al., 1997; Klingberg and Roland,
1997; Konishi et al., 1999; Liddle et al., 2001; Menon et al.,
2001; Rubia et al., 2001), and flanker tasks (Bunge et al.,
2002a,b; Casey et al., 2000; Hazeltine et al., 2000). On the other
hand, when examined behaviorally, the correlations in perform-
ance between one inhibitory task and another, while sometimes
significant, generally explain little of the individual variability in
these tasks (Burgess et al., 1998; Duncan et al., 1997; Fan et al.,
2003; Miyake et al., 2000).
One issue unresolved in previous research is that studies that
putatively target ‘‘inhibitory processes’’ generally use a single task
and rely on subtraction methods or parametric variation to isolate
the ‘‘inhibitory’’ (i.e., interference-resolution) processes of interest.
For example, the Stroop task, in which participants must name the
ink color of a color word (e.g., ‘‘RED’’ printed in blue ink) while
ignoring the word form, is perhaps the classic example of an
‘‘inhibitory’’ task. However, behavioral research has shown that
the Stroop task is likely to involve multiple types of interference,
with multiple ways of resolving them (Kornblum et al., 1990).
Irrelevant information may be inhibited at perceptual, semantic, or
response-selection stages of processing. Thus, activations in these
tasks could arise from several factors that differ between
‘‘inhibition’’ and control conditions, including enhanced attention
to the task in general, increased demand for divided attention,
enhanced long-term memory demands when maintaining the less
automatic task-set in the inhibition task, and other factors.
Through our selection of tasks, we attempt to reduce the
ambiguity in interpretation resulting from these multiple types
of interference.
Common and unique types of interference resolution
Two features of our design help circumvent the abovementioned
problems. First, by studying three tasks that share the common
requirement for response inhibition, we can make stronger
conclusions about areas that are activated in all three tasks. Second,
we chose tasks such that response inhibition/selection is ostensibly
the only type of inhibition common to all three tasks.
In the GNG task, one has to inhibit the prepotent tendency to
execute a response. This sort of inhibition may occur only at the
response-selection or execution stages (Rubia et al., 2001), as there
is only a single imperative stimulus that must be attended at any
given time, and no prior learning builds an association between the
‘‘no-go’’ stimulus and either the ‘‘go’’ stimulus or a ‘‘go’’ response.
Thus, there is little stimulus or response overlap that could lead to
other forms of interference (Kornblum et al., 1990; Zhang et al.,
1999).
In the flanker task, flanking stimuli are spatially distinct from
the target, and incompatible flankers overlap with the target
response but not with the target stimulus (Kornblum et al., 1990).
Thus, inhibition may occur at two levels. First, one may inhibit the
perceptual processing of the competing stimuli. However, should
this type of inhibition fail, the competing stimuli may activate a
competing response, which must be inhibited during response
selection (van Veen et al., 2001). As this is the only task with
spatially distinct stimuli that could be perceptually filtered
(Broadbent, 1977; Mangun, 1995), regions uniquely activated by
the flanker task may map most directly to perceptual selection.
In the incompatible trials of the SRC task, a prepotent tendency
is developed through overlap between the automatic response
elicited by the stimulus (e.g., left arrow) and the incorrect response
(left button), competing with the correct response (right button)
(Kornblum et al., 1990). Since interference resolution cannot occur
during perceptual selection, it is likely to occur at the stage of
response selection. However, it is also possible that rules directly
compete, and priming of the incorrect rule or task set produces
interference (Allport et al., 1994; Monsell et al., 2000; Rubenstein
et al., 2001).
Therefore, although each task may recruit unique processes
(response execution inhibition in GNG, perceptual inhibition in
flanker, and stimulus– response mapping inhibition or rule
selection in SRC), what these tasks share in common is inhibition
at the level of response selection (e.g., Nee et al., 2004). In
addition, by studying the three tasks in the same participants, we
circumvented problems that arise when comparing across studies
that use different individual brains, different standard brain spaces,
and different analysis methods.
There are a few previous reports in the literature that compare
different inhibitory tasks within the same individuals, and they do
report common regions of activation due to inhibitory processes
(Fan et al., 2003; Peterson et al., 2002). These studies report low
behavioral correlations among inhibition tasks, and they concluded
that overlapping regions alone do not provide strong support for the
existence of common mechanisms underlying inhibitory tasks.
However, these studies did not correlate behavioral interference
measures with regions of activation (but see Bunge et al., 2002a,b).
Additional evidence about relationships between brain activity and
behavioral performance could strengthen the case for common brain
regions for interference resolution and provide leverage in
interpreting the functional significance of overlapping activations.
Beyond replicating and extending previous work, another critical

T.D. Wager et al. / NeuroImage 27 (2005) 323–340 325
issue is an examination of the correlations between activation in
these carefully isolated ‘‘common’’ regions with behavioral
measures of inhibitory control. Our experiment was designed to
address these issues, and in our analysis we specifically searched for
regions that showed both activation and correlations with perform-
ance in each inhibitory task. In addition, we used connectivity
analyses on the pattern of individual differences (e.g., Lin et al.,
2003) to ask (a) whether activated regions are organized into
coherent, distributed networks of brain regions showing similar
patterns of task-related individual differences, and (b) whether these
networks are the same across inhibitory tasks.
Methods
Participants
Fourteen undergraduate students (ages 18–25) from the
University of Michigan were recruited through advertisements
placed in the campus paper and flyers posted in campus buildings.
All participants completed a self-report health screen for neuro-
logical and psychiatric diagnoses, as well as drug or alcohol abuse.
They signed informed consent forms approved by the University
Institutional Review Board and were compensated up to US$40 for
their participation.
Behavioral tasks
There were 6 runs in the scanning session, two for each task.
Each run was preceded and followed by a 20-s baseline block in
which participants fixated on a cross that appeared in the center
of the screen. A run consisted of 6 alternating experimental (A)
and control (B) blocks of 18 s each, in BABA order, for a total of
12 blocks per run. One issue with using a fixed BABA order is that
the predicted task effect is somewhat collinear with the effect of
practice. In principle, a smooth decrease of activation with practice,
without a true B–A effect, could produce a significant B–A result.
However, high-pass filtering at 0.013 Hz removes any such linear
trends, avoiding this potential confound.
We chose a block design because it maximizes power to detect
stable effect magnitudes (Liu et al., 2001; Wager and Nichols,
2003), sacrificing knowledge provided by event-related designs
about whether activations reflect general task-set-related or specific
trial-related processes in favor of maximizing stability of effects for
individual differences analyses. However, the GNG task was
analyzed as an event-related task because we expected activation in
interference-processing regions to be elicited by ‘‘no-go’’ trials.
These trials were distributed across blocks containing different
relative ‘‘no-go’’ trial densities.
Prior to the beginning of each task, participants were given oral
instructions and a short practice session of 2 blocks. Participants
were further instructed to respond as quickly and as accurately as
possible and were informed that they could earn bonuses for speed
and accuracy. Before each run the instructions were displayed as
long as the participant needed.
To rule out the possibility that experimental tasks might involve
more overt or intended eye movements than their controls, and that
mechanisms controlling these eye movements might produce
activations that would complicate the interpretation of the task-
related activations, one run of a saccade task was also included. We
describe these tasks below.
Go/no-go task
In this task, participants saw a random sequence of letters one at
a time in the center of the screen. In each block, 12 letters and 12
fixation crosses were presented. Whenever the participants saw any
letter other than X, they made a keypress with their right index
finger; each time they saw an X, they were not to make any
response. Each of the letters subtended approximately 2- of visualangle and appeared for 440 ms; letters were separated by a 1000-
ms central fixation cross. There were a total of 288 trials.
Although the GNG task included blocks with high (50%) and
low (20%) no-go trials, activation in interference-resolution
regions is expected to occur for ‘‘no-go’’ trials in both blocks.
This design, which was fundamentally different from the other
tasks, required an event-related analysis, with separate regressors
for ‘‘go’’ and ‘‘no-go’’ trials. The critical contrast, and the measure
of response-selection difficulty in brain activity, was the sub-
traction of ‘‘no-go’’–‘‘go’’ trials. The interference measure used to
assess behavioral performance was the false alarm rate (FAR) for
no-go trials.
The beginnings and ends of each block were not marked in any
way, and no participant reported noticing the blocked design
during a debriefing session. Although using an event-related
design prevents us from directly comparing the magnitude of
activation in the GNG task with magnitudes for the other tasks
(Wager et al., 2005), this design does not preclude looking for
correlations between brain activity and performance within each
task. In addition, we may test for differences in reliability of
activation across tasks (see Image Analysis section). Notably, the
GNG task employed a rapid event-related design with clustered
events, which is expected to maximize power (Liu, 2004), so
experimental power is expected to be relatively consistent across
all tasks.
Flanker task
We used a task similar to that of Hazeltine et al. (2000). On
each trial, participants were shown three colored circles in the
middle of the screen. The center circle was the target stimulus, and
the two circles to the left and right of it were the flankers.
Participants responded to the target, while ignoring the flankers.
The circles could appear in one of four different colors: red, green,
yellow, or blue. If the target circle was red or green, participants
responded with their left index finger. If the target circle was
yellow or blue, participants responded with their right index finger.
The two flankers were always of the same color, and that color was
always different from the target circle.
There were two types of trials: congruent and incongruent. A
trial was congruent if the responses indicated by the target and the
flankers were the same. A trial was incongruent if the responses
indicated by the target and the flankers were different. The stimuli
were presented in alternating blocks of incongruent (A) and
congruent (B) trials. For each trial, the three circles were displayed
simultaneously for 1000 ms followed by a 440-ms central fixation
cross. There were 12 trials per block for a total of 288 trials. As the
GNG task, the blocked design was not directly revealed to the
participants. No participant stated that he/she noticed the blocked
nature of the task in a debriefing session.
Stimulus–response compatibility task
Participants were presented with a series of left or right pointing
arrows in the center of the screen. Each arrow consisted of an
arrowhead and a rectangular stem, subtending approximately 3- of

T.D. Wager et al. / NeuroImage 27 (2005) 323–340326
visual angle. Each block of trials was preceded by an instruction
screen informing the participants of the response required to each
arrow: ‘‘same’’ or ‘‘opposite.’’ In the ‘‘same’’ or compatible blocks
(B), participants responded with the index finger indicated by the
direction of the arrow. Conversely, in the ‘‘opposite’’ or incompa-
tible blocks (A), participants responded with the index finger that
opposed the direction indicated by the arrow.
In this task, each block consisted of a 2000-ms instruction screen
followed by 11 arrows each presented for 1000 ms separated by 440
ms fixation crosses. A total of 242 trials were presented. Note that
the instructions given at the beginning of each block made
participants explicitly aware of the compatibility or incompatibility
of the upcoming trials.
Saccade task
One issue is whether activation in the inhibition tasks is
reducible to differences between actual and intended eye move-
ments. While previous studies of inhibition tasks have not raised
this issue, the brain regions involved in spatial attention appear to
be very similar to those involved in generating saccades (e.g.,
Corbetta et al., 1998). Thus, in inhibition tasks, spatial attention
might be more heavily recruited during incompatible/incongruent
conditions, as participants may covertly focus on different parts of
the stimulus (e.g., the tails of the arrows) to avoid interference. In
this study, we chose to avoid some problems in interpretation by
mapping saccade activity at a low threshold and excluding it from
analysis. Thus, common regions we report are likely to be activated
by processes unique to interference resolution rather than being
basic mechanisms of directed attention. To achieve this goal, a
saccade task was included in which participants directed their gaze
to the location of a series of fixation crosses on the screen. Each
block consisted of 11 fixation crosses, each presented for 440 ms
and separated by a 1000-ms central fixation cross. The crosses
could appear in one of 8 random locations on the screen. Six
blocks of saccade-trials alternated with 18 s baseline control
blocks, in which participants fixated on a single centrally located
cross.
Image acquisition and pre-processing
MRI images were acquired using a 3T GE Signa scanner
equipped with the standard quadrature headcoil (General Electric,
Milwaukee, WI). Head movement was minimized using foam
padding and a cloth restraint strapped across participants’ fore-
heads. Experimental tasks were presented using E-Prime (Beta 5.0)
software (Psychology Software Tools, Inc.) and the IFIS 9.0
system with a 10-button response unit (MRI Devices Corp.).
Functional T2*-weighted BOLD images were acquired using a
spiral sequence of 15 contiguous axial 5 mm slices (TR = 1000 ms,
TE = 30 ms, flip angle = 90-, field of view (FOV) = 24 cm). Two
structural images were also acquired: a T1-weighted gradient echo
(GRE) image was acquired using the same FOV and slices as the
functional scans (TR = 300, TE = 6.8, flip angle = 65-); a high-
resolution spoiled GRASS (Gradient Recalled Acquisition in
Steady State; SPGR) image was also acquired (TR = 6.4, TE =
1.5, TI = 600, flip angle = 15-, FOV = 24 cm, 2.5 mm slice
thickness). The T1 GRE images were acquired before the
functional runs, and SPGR images were acquired after.
Functional images were corrected for slice acquisition timing
differences using a local, 17-point sinc interpolation program
(Oppenheim et al., 1999) and corrected for head movement
using the realignment routines in the Automated Image
Registration (AIR) package (Woods et al., 1998). Subsequent
preprocessing and analysis was done using SPM99 (Wellcome
Department of Cognitive Neurology, London). Individual SPGR
images were corrected for signal inhomogeneity (G. Glover and K.
Kristoff, http://www-psych.stanford.edu/~kalina/SPM99/Tools/
vol_homocor.html) and then co-registered to the corresponding T1
GRE images. SPGR images were then normalized to the SPM99 T1
template, which is in Montreal Neurological Institute (MNI) space,
and those normalization parameters were applied to the T2*
(functional) images. After spatial normalization, T2* images were
smoothed using a 10-mm FWHM Gaussian filter. All of the
analyses included a temporal high-pass filter (100 s) and each image
was scaled to have a global mean intensity of 100.
Image analysis
All analyses were performed using the General Linear Model
implemented in SPM99, with separate regressors and intercepts
for each run. For the flanker and stimulus–response compatibility
tasks, epochs the length of each task block were convolved with
a canonical hemodynamic response function (HRF). For the go/
no-go task, event onset times for the no-go trials and go trials were
convolved with the HRF. Contrast images for each participant were
subjected to a random-effects analysis, and all statistical results
were thresholded using a false discovery rate (FDR) correction for
multiple comparisons (Genovese et al., 2002) of P < 0.05 and 4
contiguous voxels. The FDR correction ensures that no more than
an average of 5% of activated voxels for each contrast will be false
positives (the extent threshold is in addition to this requirement).
Peak coordinates in MNI space were converted into Talairach
coordinates using a transformation by Matthew Brett (http://
www.mrccbu.cam.ac.uk/Umaging/mnispace.html). Brodmann
areas were identified using the Talairach atlas (Talairach and
Tournoux, 1988) as implemented by the Talairach Daemon
(Lancaster et al., 2000; http://www.ric.uthscsa.edu/projects/
talairachdaemon.html); both MNI and Talairach coordinates are
reported.
Classifying voxels into common and unique areas
We were interested in whether a set of brain regions showed
consistent responses across all types of inhibition, and/or whether
some brain regions were unique to particular inhibitory tasks.
Finding the former would be evidence for general mechanisms
shared across response inhibition tasks, whereas finding the latter
would identify mechanisms associated with unique inhibitory
processes.
To achieve this goal, we had to determine which brain regions
were activated in each task, and whether these brain regions were
or were not activated in the other tasks. We first identified regions
that were activated in at least one task (FDR-corrected, P < 0.05).
We then classified voxels in this set of regions into the following
categories of interest.
Common regions were determined to be areas that showed
activation in all three tasks at P < 0.05 (uncorrected). This
threshold has been used in previous studies (e.g., Fan et al.,
2003) and requires a minimum t value of 2.16 in each of the
three tasks. Even using a threshold of uncorrected P < 0.05, the
threshold is higher than a required minimum t value of 0.56 for
an SPM99 conjunction analysis, which does not require each
test to be significant individually. The conjunction threshold is

T.D. Wager et al. / NeuroImage 27 (2005) 323–340 327
low because the conjunction analysis tests the global null
hypothesis that all tasks do not activate the voxel against the
alternative that one or more tasks activate the voxel (Brett et al.,
2004; Nichols et al., in press). For this reason, we prefer the
intersection test we employed here to the SPM99 conjunction
test. In addition to reporting common regions at P < 0.05
uncorrected in each task, for completeness, we separately report
the smaller set of common regions significant at P < 0.05 FDR-
corrected in each task.
Unique regions were determined to be areas that met three
qualifications: (a) activation (FDR-corrected, P < 0.05) in only one
task, (b) significantly more reliable activation in that task than the
next most reliable task, and (c) no activation in the other two (or
the saccade task) even at the lower threshold of P < 0.05
uncorrected. Importantly, although identifying such regions is
important for making inferences about differences among execu-
tive functions, the limited power in this study makes identification
of unique regions exploratory only at this point, and further studies
must confirm the results we present here. Identifying activated
regions in this manner provides stronger evidence for qualitative
differences in activation among tasks (e.g., active in flanker but not
the other tasks). Such qualitative differences can more readily be
interpreted as identifying unique processes (Sternberg, 2001).
Since we cannot directly compare activation magnitudes
between the GNG task (event related) and the other tasks (blocked)
as the regressors for events and blocks may have different scales
(Wager et al., 2005), one solution is to compare reliability scores (Z
scores) across the different tasks. The difference between two Z
scores is distributed with zero mean and a standard deviation offfiffiffi
2p
. Thus, the test statistic is the minimum difference between Z
scores for the ‘‘uniquely activating’’ task and all other tasks,
multiplied byffiffiffi
2p
, and this statistic is compared with a normal
distribution to obtain two-tailed P values. We refer to this quantity
as the minimum Z difference, and a significant value indicates
more reliable activation, in the sense of lower between-subjects
error, in one task than the others.
For both common and unique regions, we calculated correla-
tions between brain activation in each task and corresponding
behavioral performance measures. This allowed us to identify
regions that are likely to be functionally related to task perform-
ance in each task (for common regions) or in only one task (for
unique regions). Because individual outliers may heavily influence
results with small sample sizes, particularly in correlational
analyses, we also calculated robust correlation values by
identifying and removing outliers using the minimum covariance
determinant algorithm (Rousseeuw and Van Driessen, 1999). With
small sample sizes, two random variables may also be coplanar by
chance, potentially inflating false-positive rates for robust corre-
lations (Hubert, 2001). To avoid this problem, we examined
correlations that showed significant values for both ordinary
correlations and robust correlations to provide converging
evidence that correlations were not induced by outliers. In our
study, where the ordinary and robust correlation values produced
similar results, we proceeded to interpretation. However, we
refrained from interpreting correlations where the two r estimates
differed by more than 0.4. Although other combinations of
activation and correlation patterns exist – for example, a region
may be activated in two tasks, and correlated with performance in
two tasks – we focus on regions with consistent common (across
all three tasks) or unique (only in one task) patterns as they are of
the greatest theoretical interest.
Results
Behavioral results
Behavioral analyses revealed significant interference caused by
the active inhibition component of each task. In all three tasks
(GNG, flanker, and SRC), the behavioral data were analyzed on a
block level, comparing accuracy and response times for the low-
conflict blocks with those in the high-conflict blocks (i.e., high
‘‘no-go’’, congruent, and compatible blocks compared to low ‘‘no-
go’’, incongruent, and incompatible blocks).
In the GNG task, the false alarm rate (FAR) on no-go trials
was used as the measure of interference. (Reaction times were
not available because, of course, responses were not made on
no-go trials.) The FAR is the proportion of no-go trials on
which participants failed to inhibit the prepotent response and
pressed the button. FARs were significantly greater during low
no-go (�x = 0.19) than high no-go blocks (�x = 0.03; �x difference =
0.17, r = 0.094, t(13) = 6.57, P < 0.0001), although the
differences between high-percentage and low-percentage blocks
were not used in individual differences analyses. The individual
differences measure in performance was the overall no-go FAR,
and the measure in brain activity was the overall no-go-go event-
related contrast. Overall reaction times were equivalent for low
no-go (�x = 394 ms) and high no-go (�x = 392 ms) blocks.
In the flanker task, reaction times were greater for incon-
gruent than congruent blocks (609 and 551 ms, respectively; �xdifference = 58 ms, r = 20 ms, t(13) = 10.6, P < 0.0001) and
this difference was used as the interference score. Accuracy
showed effects in the same direction as in the go-no-go task,
with higher accuracy in the low conflict blocks (92.4% and 96.8%
for incongruent and congruent blocks, respectively, t(13) = 3.28,
P < 0.05).
In the stimulus–response compatibility (SRC) task, reaction
times were greater for incompatible than compatible blocks (408
and 371 ms, respectively; �x difference = 37 ms, r = 20 ms,
t(13) = 7.03, P < 0.0001). In this task, there were no differences
in accuracy across high and low conflict blocks—accuracy was
virtually the same for incompatible and compatible trials (97.4%
and 97.8%).
Correlations among behavioral inhibition measures (experi-
mental-control RTs for SRC and flanker, and FAR in low-high for
GNG) revealed negligible relationships among performance on
the three tasks: for GNG and flanker, r =�0.17; for GNGand SRC,
r = �0.25; and for flanker and SRC, r = 0.12, all nonsignificant.
Robust correlations produced similar results.
These inhibition measures were used as the behavioral
measures for brain–behavior correlations for the flanker and
SRC tasks. Higher scores on each measure indicate greater task
interference, and thus less efficient inhibition. Notably, every
participant showed an interference effect in the expected direction
on each task, providing further evidence of the behavioral
robustness of these effects.
Imaging results
Individual inhibition task activations
Task comparisons designed to isolate inhibition-related activity
produced reliable activations in all three tasks, as shown in Fig. 1.
Activated areas, corrected for multiple comparisons (P < 0.05)
using FDR (Genovese et al., 2002) in random effects analyses,

Fig. 1. Slices showing activations in each task: go/no-go (top row), flanker (middle row), and stimulus– response compatibility (bottom row). All regions
shown were significant at P < 0.05 corrected using False Discovery Rate control in at least one task. Regions significant at P < 0.05 (uncorrected) in all three
tasks were considered common inhibitory regions. The display threshold is P < 0.05 uncorrected.
T.D. Wager et al. / NeuroImage 27 (2005) 323–340328
included regions in (1) superior and inferior parietal cortex, (2)
anterior prefrontal, (3) premotor, (4) insula, (5) caudate/putamen,
(6) anterior cingulate, (7) posterior cingulate, and (8) premotor
cortex bilaterally, as well as (9) right dorsolateral prefrontal and
(10) thalamus (please see Table 1 for specific areas activated in
each task). FDR corrected significance thresholds were t > 3.47 for
flanker, t > 3.60 for GNG, and t > 3.50 for the SRC task.
Saccade task activations
We wanted to rule out the possibility that inhibitory activations
were related to differences in utilization of basic spatial attention or
eye movements. To aid in localizing tasks relative to the frontal and
parietal eye fields, and other regions known to be involved in
producing eye movements, we identified voxels activated in the
saccade task at a lenient threshold (P < 0.05 uncorrected, shown in
cyan in Fig. 2). As expected, activated regions included bilateral
frontal and parietal eye fields, supplementary eye field, and a large
contiguous region in the medial and lateral occipital cortex.
Saccade regions were not considered as candidates for common
or unique inhibition regions, described below.
Common regions
We classified voxels as belonging to common regions if they
met the specified threshold in all three tasks. These regions, listed
in Table 2, included bilateral anterior insula and anterior PFC,
right DLPFC, left caudate, posterior intraparietal sulcus (IPS), and
right anterior IPS. Three regions (Table 2) were also significant at
P < 0.05 FDR-corrected in each task: anterior cingulate
(extending into the right superior frontal sulcus) and bilateral
caudate/putamen.
Correlations between activations in these common regions and
reaction time performance (or false alarms for GNG) indicated
that among all of these regions, only the anterior insula
(bilaterally) showed significant correlations between activation
and behavioral performance in all three tasks. However, the lack
of significant correlations in other regions is inconclusive, as the
small sample size used in this study necessarily affords low
sensitivity to true correlations; it could be that the true correlation
value is consistently positive across all regions. We proceed to
describe and interpret regions that did show significant correla-
tions. The minimum brain activity–performance correlation for
any task in left or right insula was r = 0.46, with a critical r of
0.53 (P < 0.05, two-tailed) or 0.46 (P < 0.10, two-tailed) for a
marginal trend. Robust correlation values ranged from r = 0.61 to
0.76 for each task, all P < 0.05. At most one outlier was removed
from each correlation. Fig. 3A shows the common region in
right insula. Fig. 3B shows the magnitude of activation in the
critical comparison for each task and reveals that the right
anterior insula showed no evidence for saccade-related activity.
Fig. 3C shows robust correlations between behavioral perform-
ance measures (x-axis, higher scores reflect more task interfer-
ence) and activation in the right insula ( y-axis), both expressed in
units of standard deviations (SDs, e.g., performance scores divided
by the SD of performance scores across subjects) for easy
comparison across tasks. SD scores are equivalent to z scores,
but without subtracting the mean response, so that the mean
activity and performance levels are shown. These correlations
were significant for each of the three tasks in both right and left
anterior insula. (Note: details for the left insula are not shown in
Fig. 3 for space reasons but revealed the same pattern of results as

Table 1
Regions activated at whole-brain FDR corrected thresholds ( P < 0.05) in each task
Region Brodmann
area
Flanker Talairach
coordinates
Z score SRC Talairach
coordinates
Z score Go/no-go Talairach
coordinates
Z score
x y z x y z x y z
Parietal 7 R 22 �48 58 4.10 8 �60 44 3.38
L �15 �64 49 3.09 �22 �45 58 3.66 �11 �48 53 3.12
40 R 26 �41 48 4.21 45 �38 39 4.20
L �38 �35 48 4.03 �64 �35 29 3.84
Anterior prefrontal 10 R 34 41 16 3.78 22 48 7 3.21 30 49 25 4.20
L �34 51 16 3.54 �26 48 11 3.55 �34 45 25 3.08
Superior frontal
sulcus (premotor)
6 R 19 �5 56 4.87
L �19 2 46 4.17
Dorsolateral Prefrontal 9/46 R 41 44 7 3.92
Insula 13 R 41 15 �1 4.31
L �45 11 �1 3.78
Anterior cingulate 32 R 8 20 36 4.49 8 21 45 3.39
L �8 13 45 4.03
Posterior cingulate 23 R 4 �13 28 3.79
L �4 �17 33 3.71
Caudate R 19 1 18 3.40 11 �3 23 3.02
L �15 1 18 3.55 �11 �3 23 3.93
Putamen R 22 11 9 4.84 15 4 4 3.00
L �22 15 8 4.38
Thalamus L �11 �17 19 3.35 8 �21 6 4.87
T.D. Wager et al. / NeuroImage 27 (2005) 323–340 329
the right insula; peak activation coordinates and correlation values
for both are in Table 2.) Figs. 3D and E are described in the
Network analysis section below.
Unique regions
We next classified voxels as belonging to unique regions if they
(a) were significant at corrected P < 0.05 in one task, (b) showed
no evidence for significance in the other tasks at a lower threshold
(uncorrected P < 0.05), and (c) showed more reliable activation in
that task than any of the others.
Regions were found that met or approached significance on
these criteria for each of the three tasks. Candidate regions that met
the first two criteria are shown in Fig. 2, in red (GNG), green
(flanker), and blue (SRC), and described in Table 3. Few of these
regions met the third criterion of greater reliability of activation in
one task than the others in a direct comparison (see the Min Z diff
column in Table 3). Also of note, these candidate regions were
almost always adjacent to common regions (yellow in Fig. 2) or
other regions active in multiple tasks (black in Fig. 2); and finally,
uniquely activated regions frequently showed evidence for
correlations between activity and performance for multiple tasks,
as listed in Table 3. Collectively, these considerations weaken the
argument for task-specific processing in these areas.
However, some of these regions were consistently task
specific in our meta-analysis and are partially confirmed here,
and we discuss the most likely candidates for task-unique regions
below.
In the GNG task, unique regions that met all criteria were found
in thalamus, right inferior parietal cortex, and right anterior
prefrontal cortex (Table 3). Of these, only the thalamus showed
activity-performance correlations only with the GNG task; other
regions showed correlations in other tasks, weakening the argu-
ment for task-unique activation in these regions. The left panel of
Fig. 4A shows the location of the thalamic region uniquely
activated in the GNG task. The center panel shows reliability of
activation for each task averaged across voxels in the region and
indicates that none of the flanker, SRC, or saccade tasks showed
activation in this region. The right panel shows a robust positive
correlation between false alarm rate (x-axis) and brain activation in
the go-no-go task ( y-axis), indicating that participants with higher
interference scores showed more activation in the right parietal
cortex. The right posterior parietal cortex also showed significant
activity–performance correlations only in the GNG task, although
it did not meet all criteria for a task-unique region; we mention it
because a nearby region derived from meta-analysis (see below)
did meet all criteria.
In the flanker task, no regions met all criteria for unique
regions, although the anterior cingulate approached significance
on the comparison of activation reliability (Table 3; min Z
difference = 1.81, P > 0.10). Of the candidate regions, the left
caudate/putamen (Fig. 4B) showed a significant activity–perform-
ance correlation for the flanker task alone (r = 0.53, P < 0.05),
although the correlation for SRC showed a trend towards
significance (r = 0.47, P < 0.10).
In the SRC task, only the right premotor cortex met the
criteria for a unique region, although it was not significantly
correlated with performance in any task, and correlations
approached significance for the flanker task (r = 0.49, P <
0.10; see Table 3). The only region that was correlated with
performance only in the SRC task was in white matter near left
inferior parietal cortex; the functional significance of this
activation is unclear. A portion of the anterior cingulate cortex
was also correlated with SRC performance, but it was also
negatively correlated with performance in the GNG task.
Network analysis
Correlations among individual activation scores in common
regions (Table 2) were positive in each task, indicating that
participants with high activation in one region tended to show high
activation in the other regions on the same task. Principal
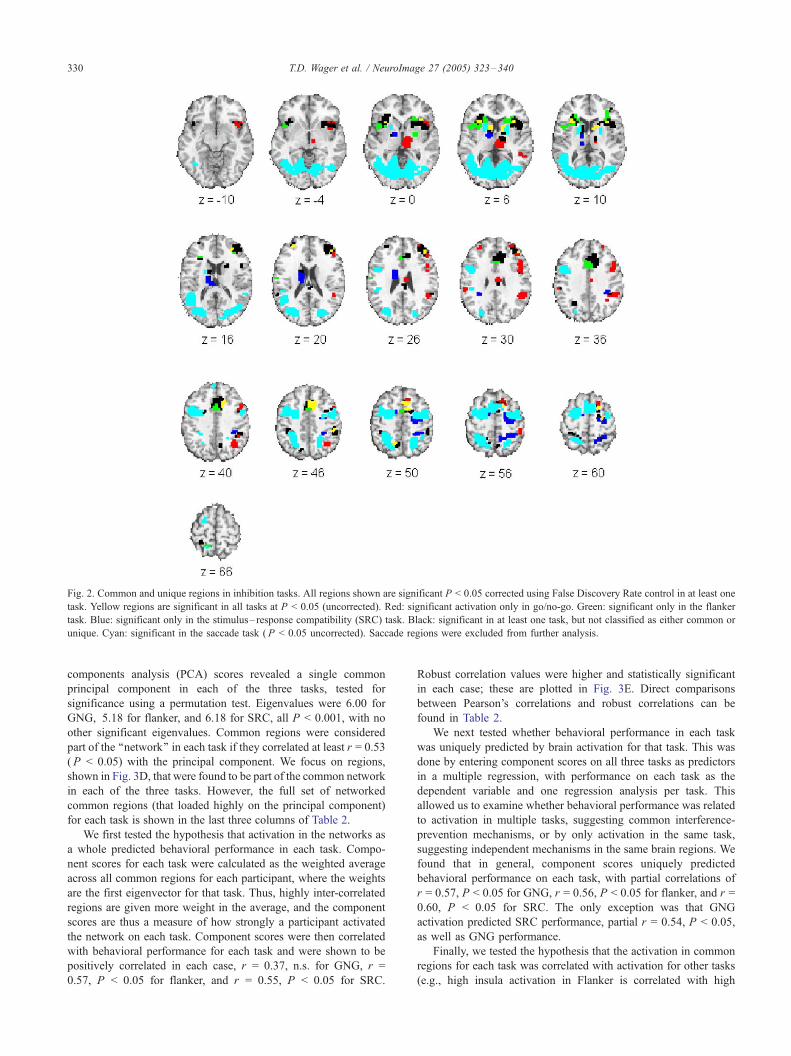
Fig. 2. Common and unique regions in inhibition tasks. All regions shown are significant P < 0.05 corrected using False Discovery Rate control in at least one
task. Yellow regions are significant in all tasks at P < 0.05 (uncorrected). Red: significant activation only in go/no-go. Green: significant only in the flanker
task. Blue: significant only in the stimulus– response compatibility (SRC) task. Black: significant in at least one task, but not classified as either common or
unique. Cyan: significant in the saccade task ( P < 0.05 uncorrected). Saccade regions were excluded from further analysis.
T.D. Wager et al. / NeuroImage 27 (2005) 323–340330
components analysis (PCA) scores revealed a single common
principal component in each of the three tasks, tested for
significance using a permutation test. Eigenvalues were 6.00 for
GNG, 5.18 for flanker, and 6.18 for SRC, all P < 0.001, with no
other significant eigenvalues. Common regions were considered
part of the ‘‘network’’ in each task if they correlated at least r = 0.53
(P < 0.05) with the principal component. We focus on regions,
shown in Fig. 3D, that were found to be part of the common network
in each of the three tasks. However, the full set of networked
common regions (that loaded highly on the principal component)
for each task is shown in the last three columns of Table 2.
We first tested the hypothesis that activation in the networks as
a whole predicted behavioral performance in each task. Compo-
nent scores for each task were calculated as the weighted average
across all common regions for each participant, where the weights
are the first eigenvector for that task. Thus, highly inter-correlated
regions are given more weight in the average, and the component
scores are thus a measure of how strongly a participant activated
the network on each task. Component scores were then correlated
with behavioral performance for each task and were shown to be
positively correlated in each case, r = 0.37, n.s. for GNG, r =
0.57, P < 0.05 for flanker, and r = 0.55, P < 0.05 for SRC.
Robust correlation values were higher and statistically significant
in each case; these are plotted in Fig. 3E. Direct comparisons
between Pearson’s correlations and robust correlations can be
found in Table 2.
We next tested whether behavioral performance in each task
was uniquely predicted by brain activation for that task. This was
done by entering component scores on all three tasks as predictors
in a multiple regression, with performance on each task as the
dependent variable and one regression analysis per task. This
allowed us to examine whether behavioral performance was related
to activation in multiple tasks, suggesting common interference-
prevention mechanisms, or by only activation in the same task,
suggesting independent mechanisms in the same brain regions. We
found that in general, component scores uniquely predicted
behavioral performance on each task, with partial correlations of
r = 0.57, P < 0.05 for GNG, r = 0.56, P < 0.05 for flanker, and r =
0.60, P < 0.05 for SRC. The only exception was that GNG
activation predicted SRC performance, partial r = 0.54, P < 0.05,
as well as GNG performance.
Finally, we tested the hypothesis that the activation in common
regions for each task was correlated with activation for other tasks
(e.g., high insula activation in Flanker is correlated with high
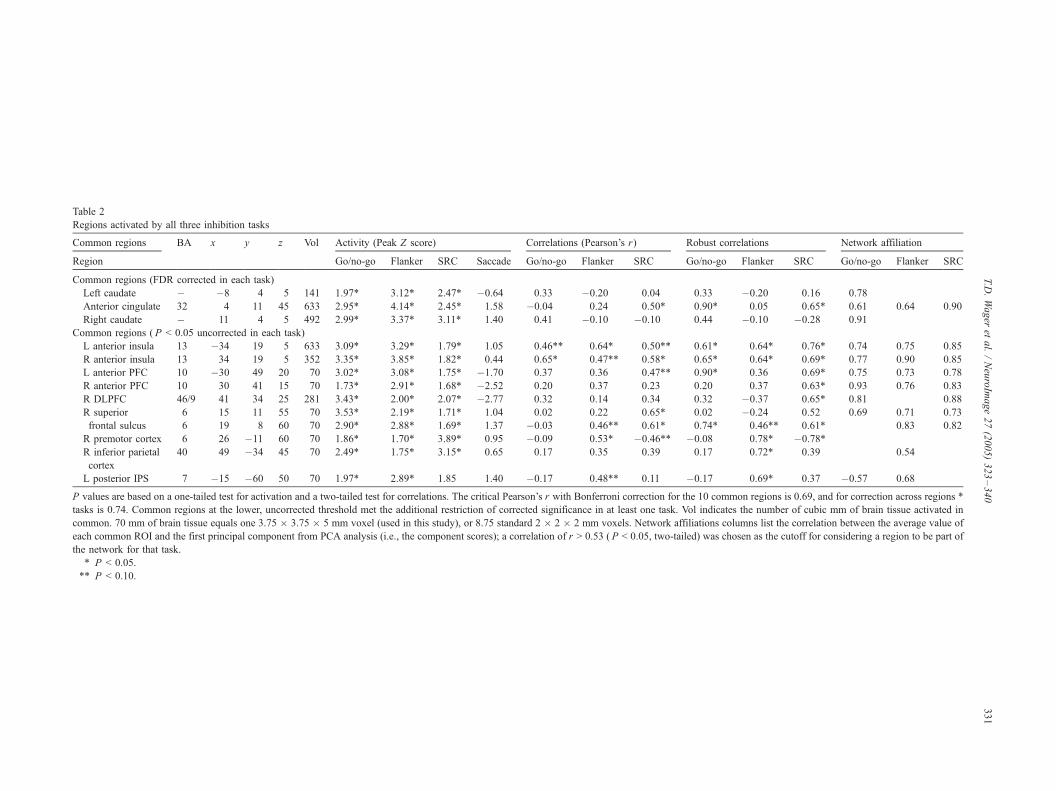
Table 2
Regions activated by all three inhibition tasks
Common regions BA x y z Vol Activity (Peak Z score) Correlations (Pearson’s r) Robust rrelations Network affiliation
Region Go/no-go Flanker SRC Saccade Go/no-go Flanker SRC Go/no-g Flanker SRC Go/no-go Flanker SRC
Common regions (FDR corrected in each task)
Left caudate � �8 4 5 141 1.97T 3.12T 2.47T �0.64 0.33 �0.20 0.04 0.33 �0.20 0.16 0.78
Anterior cingulate 32 4 11 45 633 2.95T 4.14T 2.45T 1.58 �0.04 0.24 0.50T 0.90T 0.05 0.65T 0.61 0.64 0.90
Right caudate � 11 4 5 492 2.99T 3.37T 3.11T 1.40 0.41 �0.10 �0.10 0.44 �0.10 �0.28 0.91
Common regions ( P < 0.05 uncorrected in each task)
L anterior insula 13 �34 19 5 633 3.09T 3.29T 1.79T 1.05 0.46TT 0.64T 0.50TT 0.61T 0.64T 0.76T 0.74 0.75 0.85
R anterior insula 13 34 19 5 352 3.35T 3.85T 1.82T 0.44 0.65T 0.47TT 0.58T 0.65T 0.64T 0.69T 0.77 0.90 0.85
L anterior PFC 10 �30 49 20 70 3.02T 3.08T 1.75T �1.70 0.37 0.36 0.47TT 0.90T 0.36 0.69T 0.75 0.73 0.78
R anterior PFC 10 30 41 15 70 1.73T 2.91T 1.68T �2.52 0.20 0.37 0.23 0.20 0.37 0.63T 0.93 0.76 0.83
R DLPFC 46/9 41 34 25 281 3.43T 2.00T 2.07T �2.77 0.32 0.14 0.34 0.32 �0.37 0.65T 0.81 0.88
R superior
frontal sulcus
6 15 11 55 70 3.53T 2.19T 1.71T 1.04 0.02 0.22 0.65T 0.02 �0.24 0.52 0.69 0.71 0.73
6 19 8 60 70 2.90T 2.88T 1.69T 1.37 �0.03 0.46TT 0.61T 0.74T 0.46TT 0.61T 0.83 0.82
R premotor cortex 6 26 �11 60 70 1.86T 1.70T 3.89T 0.95 �0.09 0.53T �0.46TT �0.08 0.78T �0.78TR inferior parietal
cortex
40 49 �34 45 70 2.49T 1.75T 3.15T 0.65 0.17 0.35 0.39 0.17 0.72T 0.39 0.54
L posterior IPS 7 �15 �60 50 70 1.97T 2.89T 1.85 1.40 �0.17 0.48TT 0.11 �0.17 0.69T 0.37 �0.57 0.68
P values are based on a one-tailed test for activation and a two-tailed test for correlations. The critical Pearson’s r with Bonferroni correction for the 10 co mon regions is 0.69, and for correction across regions *
tasks is 0.74. Common regions at the lower, uncorrected threshold met the additional restriction of corrected significance in at least one task. Vol indic es the number of cubic mm of brain tissue activated in
common. 70 mm of brain tissue equals one 3.75 � 3.75 � 5 mm voxel (used in this study), or 8.75 standard 2 � 2 � 2 mm voxels. Network affiliations lumns list the correlation between the average value of
each common ROI and the first principal component from PCA analysis (i.e., the component scores); a correlation of r > 0.53 ( P < 0.05, two-tailed) was osen as the cutoff for considering a region to be part of
the network for that task.
T P < 0.05.
TT P < 0.10.
T.D.Wager
etal./NeuroIm
age27(2005)323–340
331
co
o
m
at
co
ch

Fig. 3. Right anterior insula and correlations with task performance. Left anterior insula (not shown) also showed consistent positive correlations between task
performance and brain activity across the three inhibition tasks. (A) Slice showing the location of the common anterior insula region. (B) Bar plot showing the
max Z values (random effects analysis, y-axis) for each task (x-axis). Horizontal lines indicate statistical thresholds. (C) Correlation scatterplot showing robust
brain–behavior correlations between activation and performance for each task. Red circles: go/no-go task; green squares: flanker task; blue triangles: SRC task.
(D) Network regions in which activation among regions was significantly intercorrelated for each of the three tasks (principal components analysis of contrast
values across participants in common regions). (E) Partial correlation scatterplots for the first principal component (network scores) for each task and behavior in
that task. The plots show that performance in each task uniquely predicted network activation in that task, controlling for other performance variables.
T.D. Wager et al. / NeuroImage 27 (2005) 323–340332
insula activation in SRC and GNG). Positive correlations among
tasks and with behavioral scores would indicate that individuals’
activation is consistent across the tasks and predicts a common
component underlying behavioral performance. The absence of
correlations between task activations (in the presence of correla-
tions between activation and performance in each task) would
suggest that the networks are tracking the amount of behavioral
interference experienced in a particular task. In this way, we have
the beginnings of a conceptual model for determining whether
activation is due to common mechanisms of interference
prevention or resolution after it occurs. Importantly, the compo-
nent scores for the three tasks were not inter-correlated, with all
correlation values between 0.006 and 0.10, suggesting that the
networks track interference experienced in each task (evidenced
by the activation-performance correlations) but are less likely to
reflect common mechanisms that prevent interference across tasks.
Thus, if these brain regions perform the same underlying function
in each task, it is likely a function that becomes active in response
to interference, such as conflict monitoring, response selection or
decision making, or suppression of late, inappropriate motor
tendencies (Kornblum and Requin, 1995). We return to this point
in the Discussion section.
Meta-analysis regions
A previous meta-analysis of reported peak brain activations
from these same inhibitory tasks has isolated a set of regions that
the tasks may share in common (Nee et al., 2004). This was
accomplished using a density analysis method that is described in
detail elsewhere (Wager et al., 2003, 2004). This meta-analysis
revealed regions consistently activated by interference tasks in
previous studies, summarized in Table 4. Using sets of contiguous
voxels in these regions, we created regions of interest (ROIs).
Analysis of the average activity in these ROIs corresponded
closely with results from the analyses presented above. Two of the
meta-analysis regions – right inferior frontal gyrus and anterior
cingulate – were active in all three tasks, paralleling findings from
the common-region analyses.
We also performed separate meta-analyses of reported peak
activations from previously published studies of each task. We did
this because it is possible that reported activations are highly
consistent in one task, but not in others, diluting the statistical
significance in the overall across-task meta-analysis. Table 4 shows
regions activated in each separate-taskmeta-analysis. Althoughmost
of these were also identified in the overall analysis, regions in the
intraparietal sulcus were identified in the SRC meta-analysis only.
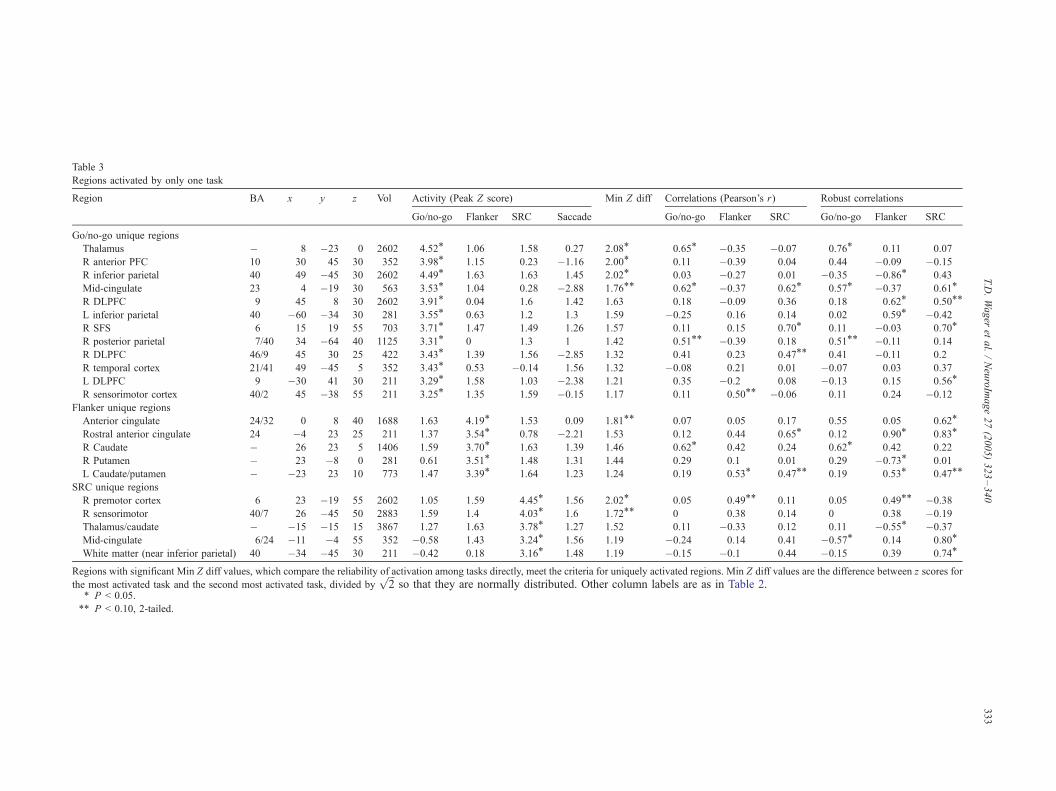
Table 3
Regions activated by only one task
Region BA x y z Vol Activity (Peak Z score) Min Z diff Correlations earson’s r) Robust correlations
Go/no-go Flanker SRC Saccade Go/no-go anker SRC Go/no-go Flanker SRC
Go/no-go unique regions
Thalamus � 8 �23 0 2602 4.52T 1.06 1.58 0.27 2.08T 0.65T .35 �0.07 0.76T 0.11 0.07
R anterior PFC 10 30 45 30 352 3.98T 1.15 0.23 �1.16 2.00T 0.11 .39 0.04 0.44 �0.09 �0.15
R inferior parietal 40 49 �45 30 2602 4.49T 1.63 1.63 1.45 2.02T 0.03 .27 0.01 �0.35 �0.86T 0.43
Mid-cingulate 23 4 �19 30 563 3.53T 1.04 0.28 �2.88 1.76TT 0.62T .37 0.62T 0.57T �0.37 0.61TR DLPFC 9 45 8 30 2602 3.91T 0.04 1.6 1.42 1.63 0.18 .09 0.36 0.18 0.62T 0.50TTL inferior parietal 40 �60 �34 30 281 3.55T 0.63 1.2 1.3 1.59 �0.25 .16 0.14 0.02 0.59T �0.42
R SFS 6 15 19 55 703 3.71T 1.47 1.49 1.26 1.57 0.11 .15 0.70T 0.11 �0.03 0.70TR posterior parietal 7/40 34 �64 40 1125 3.31T 0 1.3 1 1.42 0.51TT .39 0.18 0.51TT �0.11 0.14
R DLPFC 46/9 45 30 25 422 3.43T 1.39 1.56 �2.85 1.32 0.41 .23 0.47TT 0.41 �0.11 0.2
R temporal cortex 21/41 49 �45 5 352 3.43T 0.53 �0.14 1.56 1.32 �0.08 .21 0.01 �0.07 0.03 0.37
L DLPFC 9 �30 41 30 211 3.29T 1.58 1.03 �2.38 1.21 0.35 .2 0.08 �0.13 0.15 0.56TR sensorimotor cortex 40/2 45 �38 55 211 3.25T 1.35 1.59 �0.15 1.17 0.11 .50TT �0.06 0.11 0.24 �0.12
Flanker unique regions
Anterior cingulate 24/32 0 8 40 1688 1.63 4.19T 1.53 0.09 1.81TT 0.07 .05 0.17 0.55 0.05 0.62TRostral anterior cingulate 24 �4 23 25 211 1.37 3.54T 0.78 �2.21 1.53 0.12 .44 0.65T 0.12 0.90T 0.83TR Caudate � 26 23 5 1406 1.59 3.70T 1.63 1.39 1.46 0.62T .42 0.24 0.62T 0.42 0.22
R Putamen � 23 �8 0 281 0.61 3.51T 1.48 1.31 1.44 0.29 .1 0.01 0.29 �0.73T 0.01
L Caudate/putamen � �23 23 10 773 1.47 3.39T 1.64 1.23 1.24 0.19 .53T 0.47TT 0.19 0.53T 0.47TTSRC unique regions
R premotor cortex 6 23 �19 55 2602 1.05 1.59 4.45T 1.56 2.02T 0.05 .49TT 0.11 0.05 0.49TT �0.38
R sensorimotor 40/7 26 �45 50 2883 1.59 1.4 4.03T 1.6 1.72TT 0 .38 0.14 0 0.38 �0.19
Thalamus/caudate � �15 �15 15 3867 1.27 1.63 3.78T 1.27 1.52 0.11 .33 0.12 0.11 �0.55T �0.37
Mid-cingulate 6/24 �11 �4 55 352 �0.58 1.43 3.24T 1.56 1.19 �0.24 .14 0.41 �0.57T 0.14 0.80TWhite matter (near inferior parietal) 40 �34 �45 30 211 �0.42 0.18 3.16T 1.48 1.19 �0.15 .1 0.44 �0.15 0.39 0.74T
Regions with significant Min Z diff values, which compare the reliability of activation among tasks directly, meet the criteria for uniquely activated region in Z diff values are the difference between z scores for
the most activated task and the second most activated task, divided byffiffiffi
2p
so that they are normally distributed. Other column labels are as i Table 2.T P < 0.05.
TT P < 0.10, 2-tailed.
T.D.Wager
etal./NeuroIm
age27(2005)323–340
333
(P
Fl
�0
�0
�0
�0
�0
0
0
�0
0
0
�0
0
0
0
0
0
0
0
0
�0
0
�0
s. M
n

Fig. 4. Selected unique regions showing correlations between activation and task performance. (A) Shows thalamus (left panel) with corresponding activations
for the four tasks (center panel) and the correlation scatterplot for z scores of false alarm rate against activation in the go/no-go task (right panel). (B) Left
caudate (left panel), activations in each task within this region (center panel), and the scatterplot showing z scores of flanker interference cost against activation
in the flanker task (right panel).
T.D. Wager et al. / NeuroImage 27 (2005) 323–340334
The left IFG/insular meta-analysis region was 7 mm rostral and
10 mm superior to the common left insular region reported above,
and was uniquely activated and correlated with performance in the
flanker task, as shown in Figs. 5F–H. This result parallels the
anterior spread of activation only in the flanker task (Fig. 2).
The right angular gyrus meta-analysis region shared an identical
center of mass with the right posterior parietal region found to be
unique to the GNG task in the present study, and thus paralleled
results from the previous unique region analysis, as shown in Figs.
5C–E. The results of the meta-analysis thereby support the
conclusions that (1) most common regions in the meta-analysis
are commonly activated in each task in the present study; (2) GNG
may activate a separable region of the right angular gyrus; and (3)
The flanker task may produce greater activation (in magnitude or
extent) in left IFG.
Discussion
This study demonstrates that diverse inhibitory tasks – one that
required withholding of a response (GNG), one that required
inhibiting encoding and/or responses (flanker), and one that
required re-mapping stimulus–response associations (SRC) –
shared substantial overlap in neural activations in the same
participants. A core set of commonly activated regions, including
bilateral insula, anterior PFC, right DLPFC, and right SFS, were
also correlated with one another across participants in each task,
suggesting that the network is a functional unit of analysis for
individual differences. Activation in an inter-correlated network of
regions for each task (which always included, but were not always
limited to, the regions listed above), and in the bilateral insula
individually, tracked behavioral performance in each task. These
findings suggest that the common network is sensitive to the
amount of interference encountered by each individual subject on
each task. However, the degree to which an individual activated
this network varied from task to task, according to that individual’s
performance on the task: More activation was associated with
increasing behavioral interference on all three tasks.
The common regions found in this study corresponded well
with those reported as common activations in previous studies (Fan
et al., 2003) and in a meta-analysis of previous neuroimaging
studies of inhibition (Nee et al., 2004). These regions were
anatomically distinct from areas related to the basic orienting of
attention and control of eye movements, as they showed no
evidence for activation in the saccade task.
Previous studies investigating relationships among perform-
ance on multiple inhibitory tasks have found that correlations are
generally low but (usually) significant, suggesting that there is
some common underlying ability of response inhibition (Boone
et al., 1998; Fan et al., 2003; Miyake et al., 2000). The current
study has identified a candidate neural mechanism implementing
this ability: an insular –prefrontal – cingulate network that
resolves interference between competing responses in each of
the three tasks studied here and perhaps others as well.
In a previous study, Fan et al. (2003) investigated the relation-
ships between inhibition tasks and reported common activations in a

Table 4
Summary of results from the inhibition meta-analysis regions
Meta-analysis regions BA x y z Vol Activity (peak Z score) Min Z
diff
Correlations (Pearson’s r) Robust correlations
Region Go/no-go Flanker SRC Saccade Go/no-go Flanker SRC Go/no-go Flanker SRC
Meta-analysis collapsing across tasks
R DLPFC 9/46 41 19 25 8930 3.55T 3.41T 1.88T 0.31 0.10 0.08 0.13 0.30 0.33 0.13 �0.02
Anterior cingulate 32/8 0 23 45 141 1.90T 3.79T 2.09T �1.05 1.20 0.22 0.23 0.57T 0.89T 0.23 0.65TMedial PFC 8 4 15 55 70 3.32T 2.10T 1.43 1.01 0.86 0.26 0.19 0.59T 0.28 0.19 0.59TL anterior insula/IFG 13/45 �38 26 15 211 0.18 2.94T 1.28 �0.66 1.17 0.07 0.59T 0.41 0.07 0.41 0.41
R angular gyrus 39 34 �64 40 70 3.31T �0.67 �0.58 �3.25 2.69 0.51TT �0.34 0.25 0.51 �0.02 0.25
GNG-only meta-analysis
R DLPFC 9/46 41 23 25 15258 6.69T 4.86T 2.37T 0.31 1.29 0.23 0.15 0.26 0.23 0.45 0.00
R angular gyrus 39 41 �64 35 1688 3.18T �0.85 0.13 �1.14 2.16 �0.11 �0.46TT �0.18 �0.11 �0.19 �0.34
Flanker-only meta-analysis
R DLPFC 9/46 41 15 30 4781 3.48T 2.30T 1.88T �0.09 0.83 0.14 �0.07 0.34 0.44 �0.07 0.34
SRC-only meta-analysis
L posterior IPS 7 �11 �71 40 563 1.54 1.73T �0.37 �0.52 1.44 0.19 �0.42 �0.06 �0.29 �0.42 �0.06
R posterior IPS 7 19 �60 45 281 1.96T 0.64 2.60T 2.93T 1.39 �0.01 �0.19 0.15 0.07 0.00 0.15
Meta-analysis identified regions, listed at the left of the table, in which previous study peaks were sufficiently dense to be considered non-randomly distributed throughout the brain. The top rows show significant
regions collapsing across tasks, which may miss clusters of peaks that appear only for one task. The rows below show regions significant in a meta-analysis of only peaks from a single task-type. R DLPFC—Right
Dorsolateral Prefrontal Cortex; MPFC—Medial Prefrontal Cortex; IFG—Inferior Frontal Gyrus. Min Z diff: see Table 3 legend.
T P < 0.05.
TT P < 0.10, 2-tailed.
T.D.Wager
etal./NeuroIm
age27(2005)323–340
335
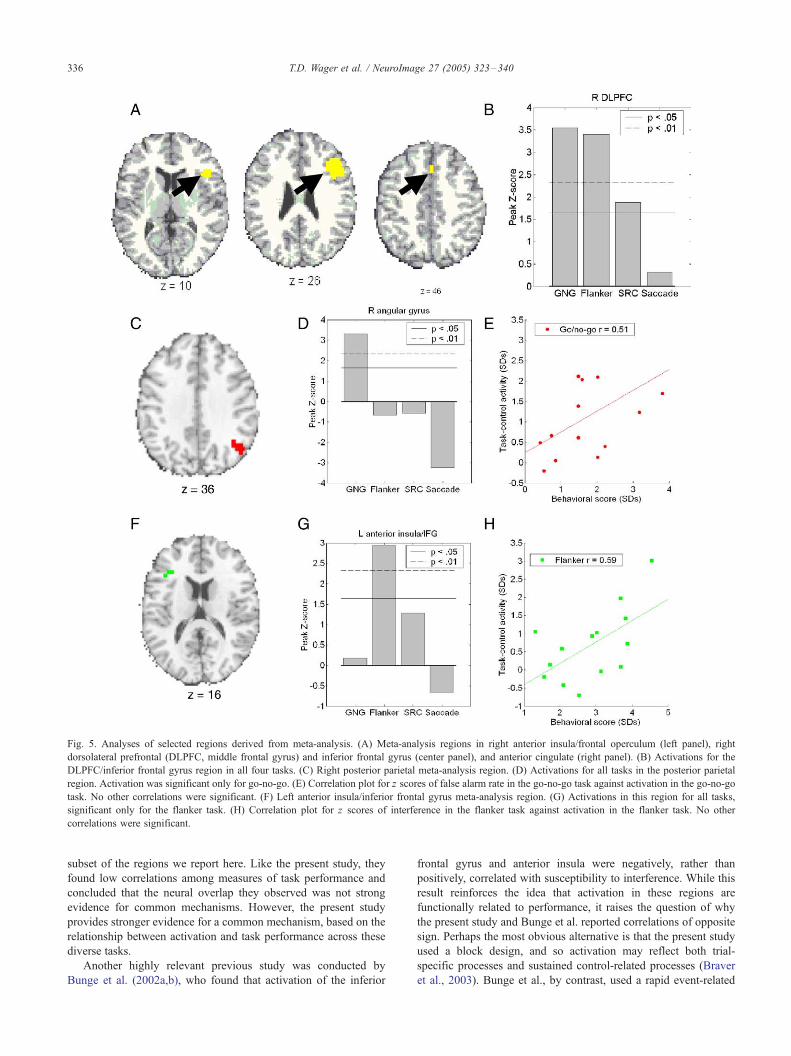
Fig. 5. Analyses of selected regions derived from meta-analysis. (A) Meta-analysis regions in right anterior insula/frontal operculum (left panel), right
dorsolateral prefrontal (DLPFC, middle frontal gyrus) and inferior frontal gyrus (center panel), and anterior cingulate (right panel). (B) Activations for the
DLPFC/inferior frontal gyrus region in all four tasks. (C) Right posterior parietal meta-analysis region. (D) Activations for all tasks in the posterior parietal
region. Activation was significant only for go-no-go. (E) Correlation plot for z scores of false alarm rate in the go-no-go task against activation in the go-no-go
task. No other correlations were significant. (F) Left anterior insula/inferior frontal gyrus meta-analysis region. (G) Activations in this region for all tasks,
significant only for the flanker task. (H) Correlation plot for z scores of interference in the flanker task against activation in the flanker task. No other
correlations were significant.
T.D. Wager et al. / NeuroImage 27 (2005) 323–340336
subset of the regions we report here. Like the present study, they
found low correlations among measures of task performance and
concluded that the neural overlap they observed was not strong
evidence for common mechanisms. However, the present study
provides stronger evidence for a common mechanism, based on the
relationship between activation and task performance across these
diverse tasks.
Another highly relevant previous study was conducted by
Bunge et al. (2002a,b), who found that activation of the inferior
frontal gyrus and anterior insula were negatively, rather than
positively, correlated with susceptibility to interference. While this
result reinforces the idea that activation in these regions are
functionally related to performance, it raises the question of why
the present study and Bunge et al. reported correlations of opposite
sign. Perhaps the most obvious alternative is that the present study
used a block design, and so activation may reflect both trial-
specific processes and sustained control-related processes (Braver
et al., 2003). Bunge et al., by contrast, used a rapid event-related
T.D. Wager et al. / NeuroImage 27 (2005) 323–340 337
design, which preferentially detects trial-related processing but also
requires more assumptions about the shape of the hemodynamic
response. An alternative explanation is that Bunge et al. scaled
individuals’ brain activation scores to have the same global
value—thus, the correlations reflect residuals from the global
activity, which may itself partially reflect activation of a broad
network of brain regions. The present study used raw scores.
Future studies must disentangle both transient/sustained activation
and global (widespread) vs. local contributions to measures of
regional activity.
Interpreting positive correlations
A subset of regions activated in common across the three
inhibition tasks used in our study – the bilateral anterior prefrontal
cortex, anterior cingulate, and bilateral anterior insula – shows a
consistent pattern of activation that is positively correlated with
behavioral interference in all three inhibition tasks. This finding
suggests that these brain regions play some common functional
roles in cognitive control.
How, though, should we interpret the fact that these correlations
are positive? After all, it seems most natural to suppose that a
region that is involved in the resolution of conflict should show
increases in activation when the behavioral manifestations of
conflict are reduced. Take the flanker task as an example. If we
believe that the activated regions in this task are involved in the
resolution of interference, then greater activation might be
expected to be associated with reduced interference. For instance,
suppose that as these regions are engaged, they reduce the effect of
the surrounding flankers so that the subject’s response can be
governed by the central target item. Therefore, increased recruit-
ment of these areas would lead to reduced interference. The
positive correlations we have found belie this simple account.
One explanation for positive brain–behavior correlations is that
positively correlated regions implement a monitoring process that
increases with greater input conflict. It has been suggested that the
anterior cingulate serves a monitoring function, integrating activity
from relevant and irrelevant processing streams and, by virtue of
the high level of crosstalk created by conflicting inputs, triggering
engagement of lateral prefrontal control mechanisms (Cohen et al.,
1990; MacDonald et al., 2000; Miller and Cohen, 2001). The
frontal network activated in our study that correlated positively
with behavioral interference includes the anterior cingulate.
Perhaps, then, the cingulate is only part of a larger circuit that is
involved in the detection of conflict, augmented by the additional
structures that we have found to be positively correlated with
behavioral interference effects. By this account, what this circuit
does is to detect the presence of conflicting input, signaling
downstream mechanisms that further processing will be needed
before a response can be programmed.
However, a positive correlation need not imply monitoring
rather than implementation of control. Because interference-
resolution mechanisms are activated by putative conflict detec-
tion mechanisms, both are expected to be more active in
participants who have more interference to contend with in the
first place. It is only when the amount of conflict experienced is
equated across participants, equating input into interference-
resolution mechanisms, that negative correlations between
activation of these mechanisms and behavioral performance
costs are expected to emerge. As we describe below, there is
ample evidence that conflict may not be equated across tasks. In
fact, the finding of positive correlations in putative ‘‘interference-
resolution’’ regions suggests that the major determinant of a
person’s behavioral cost is not how efficient their interference-
resolution mechanisms are, but how difficult a particular task is
for them in the first place.
How is the level of conflicting input to detection/resolution
mechanisms determined? In current computational accounts of
interference tasks, conflict results from strong activity in irrelevant
processing pathways as compared to relevant processing pathways
(Cohen et al., 1990; Jones et al., 2002; Kornblum et al., 1990;
MacLeod and Dunbar, 1988; Zhang et al., 1999). Thus, the level of
conflict experienced by a subject may vary from trial to trial, based
on attentional set and recent task experience, and from task to task,
based on efficiency of processing pathways specific to each task. In
the flanker task, the variation in conflict is caused by stochastic
differences in the relative intrusiveness of the flankers and/or the
efficiency of spatial attention. In the GNG task, it is caused by
variations in confusability of the ‘‘go’’ and ‘‘no-go’’ cues and/or
variations in tradeoffs between being fast and withholding
appropriately. In the SRC task, it is caused by variation in the
strength of the prepotent compatible response tendency.
Behavioral correlations and implications for behavioral individual
differences studies
If there are common mechanisms involved in resolving inter-
ference, why is behavioral performance uncorrelated across the
various tasks that measure this interference resolution? This is a
critical question. We suppose that there are several reasons why
common inhibitory mechanisms may not be detectable in analysis
of behavioral scores alone.
The typical model underlying behavioral individual-differences
studies is that the behavioral scores (e.g., RT cost for the
interference minus the control condition) reflect a single cognitive
measure: the underlying inhibitory ability for each participant.
When no correlations are found between behavioral measures, the
typical inference is that measurement noise and unique factors
precluded finding correlations, or there are no detectable common
mechanisms across tasks. This is plausible if, for example, different
control mechanisms mediate perceptual filtering, rule selection, and
response selection, and these are used differentially in various
interference tasks. However, there are two basic ways in which
common mechanisms may exist but be obscured in behavioral
analyses. First, additional task-specific mechanisms may be
recruited in addition to common mechanisms. Second, individual
differences in the automaticity of task-unique relevant and
irrelevant processes may cause differential recruitment of common
mechanisms in different tasks. We provide examples of each below.
First, consider the flanker and GNG tasks. Imagine a participant
with poor response selection efficiency compared with the rest of
the group, but a subject who has a strong focus of spatial attention.
In the flanker task, interference can be resolved during stimulus
encoding or during response selection. In the GNG task, conflict
can only be resolved during response selection. Our example
subject may show a reduced flanker interference effect (compared
to the group) due to his ability to selectively attend to the target
stimulus. The subject experiences less conflict than the rest of the
group because she has recruited an additional task-specific
mechanism. However, spatial attention will not help this subject
during the GNG task, which relies on resolution during response
processing. The subject may therefore show a large degree of
interference in the GNG task (compared to the group). When

T.D. Wager et al. / NeuroImage 27 (2005) 323–340338
behavioral scores for the two tasks are correlated across parti-
cipants, the correlation will be low. Although both tasks require
conflict-detection and response selection (common mechanisms),
they are uncorrelated because different subjects may engage the
common response-selection mechanism to different degrees across
the two tasks. Thus, though there may be common mechanisms,
the existence of additional task-specific processes makes it difficult
to uncover them.
Now we turn to the second reason common mechanisms may
be obscured in behavioral correlations: individual differences in
automaticity of relevant and irrelevant tasks. Suppose that another
individual participant has particularly strong automatic response to
arrows in the SRC task—that is, the left-arrow/left-button response
is particularly automatic. In contrast, the strength of the opposite
rule, left-arrow/right button, is relatively weak. That participant
will experience more interference and engage interference-reso-
lution mechanisms more than other participants—but only on the
SRC task. Those associations between arrows and buttons do not
apply to the other tasks. Thus, as in the previous example, the
individual’s behavioral score will not reflect a constant inhibitory
‘‘ability’’ across all tasks but will instead vary across tasks, and
correlations across participants will be low.
The key to both accounts is that different participants experience
different amounts of conflict on different tasks (task � participant
interactions), independent of their inhibitory ability. Experimental
evidence suggests that individual differences in experienced conflict
are real, and that they are independent of inhibitory ability.
Behavioral evidence from similar tasks suggests that the degree of
interference depends on the relative degree of expertise (Ehri and
Wilce, 1979), speed (Dyer, 1973), or automaticity (MacLeod and
Dunbar, 1988) of each component task. Interference in task shifting
may be determined by task automaticity (Allport et al., 1994) and
relative speed (Yeung and Monsell, 2003) as well. As various
interference tasks involve different relevant and irrelevant process-
ing pathways, differences across individuals in relative speed or
automaticity will cause task � participant interactions in experi-
enced conflict. Indeed, individual differences in basic processing
speed on particular component tasks do predict behavioral interfer-
ence (Dyer, 1973) and switch costs (Wager, 2003). In addition, the
uniquely activated regions in each task studied here, and those in
previous papers (Fan et al., 2003; Rubia et al., 2001), provide some
evidence for task-specific mechanisms that may obscure behavioral
correlations.
Interpreting unique regions
Paralleling the low correlations in performance among the
tasks, we found brain areas uniquely involved in performance of
each task we studied. However, it must be stressed that the findings
of uniquely activated and correlated regions are preliminary, as this
study lacks the experimental power necessary to ensure that false
negatives do not occur. Therefore, we interpret these findings
cautiously and await further evidence to clarify their roles in
cognitive control.
One important role of the meta-analysis is to provide more
precise a priori expectations for regions that may be uniquely
activated in one task. In the meta-analysis, previous studies
showed more consistent activation of the right posterior parietal
cortex (angular gyrus) in the GNG task than other tasks. The
consistently activated region across previous studies provides a
well-defined region in which to test for unique effects. Our
analyses of the current study confirm that GNG activity in this
region meets our qualifications for a GNG-specific region, in that
(a) activations for GNG are more reliable than for other tasks, (b)
we found no evidence for activation in other tasks, and (c)
activation is correlated with lower performance in the GNG task,
but not other tasks.
Thalamic and right parietal activations unique to the GNG task
may reflect motor inhibition, through thalamocortical (Guillery and
Sherman, 2002) and thalamostriatal loops (Alexander et al., 1986),
and control of response execution timing and readiness, though
these speculations await support from converging evidence. The
GNG task involves only one stimulus and a single, simple
response, and so places high demand on control at the response
execution stage.
Though we also found limited evidence for flanker-task
specificity in left inferior frontal gyrus and underlying insula
and striatum, and for SRC-task specificity in the posterior IPS,
these results were much weaker. For instance, greater peak density
in the meta-analysis in these regions was not paralleled by greater
activation in our study. In addition, these regions adjoined
commonly activated regions. Thus, at the level of spatial
resolution afforded by the fMRI techniques we employed, the
commonalities in activation among the tasks seem to outweigh the
differences.
Conclusions
We found evidence for common activation of a number of
brain structures in three interference tasks that share a requirement
for response selection. The regions include bilateral insula/frontal
operculum, caudate, lateral prefrontal cortices, anterior cingulate,
and right premotor and parietal cortices. A subset of these (most
consistently the insula) were positively correlated with poorer
behavioral performance in each task. The common locations of
performance-correlated activations suggests common mechanisms
of interference detection and/or resolution across tasks. However,
neither activation nor behavioral scores were correlated across
tasks. Together, these findings suggest that these commonly
activated brain structures are markers of conflict experienced on
a task, and that low behavioral correlations among performance
scores reflect systematic effects of task-specific mechanisms and
biases rather than a lack of common mechanisms. That is, the
brain mechanisms for interference resolution may be common, but
a participant may recruit them to different degrees in different
tasks, depending on individual differences in ability on different
tasks.
References
Alexander, G.E., DeLong, M.R., Strick, P.L., 1986. Parallel organization of
functionally segregated circuits linking basal ganglia and cortex. Annu.
Rev. Neurosci. 9, 357–381.
Allport, A., Styles, E.A., Hsieh, S.L., 1994. Shifting intentional set-exploring
the dynamic control of tasks. Atten. Perform. Xv 15, 421–452.
Anderson, M.C., Spellman, B.A., 1995. On the status of inhibitory
mechanisms in cognition: memory retrieval as a model case. Psychol.
Rev. 102 (1), 68–100.
Boone, K.B., Ponton, M.O., Gorsuch, R.L., Gonzalez, J.J., Miller, B.L.,
1998. Factor analysis of four measures of prefrontal lobe functioning.
Arch. Clin. Neuropsychol. 13 (7), 585–595.
T.D. Wager et al. / NeuroImage 27 (2005) 323–340 339
Braver, T.S., Reynolds, J.R., Donaldson, D.I., 2003. Neural mechanisms of
transient and sustained cognitive control during task switching. Neuron
39 (4), 713–726.
Brett, M., Wager, T., Poline, J.-B., Nichols, T., 2004. When is a Conjunction
not a Conjunction. Paper presented at the annual meeting of the
organization for Hum. Brain Mapp.
Broadbent, D.E., 1977. The hidden preattentive processes. Am. Psychol. 32
(2), 109–118.
Bunge, S.A., Dudukovic, N.M., Thomason, M.E., Vaidya, C.J., Gabrieli,
J.D., 2002a. Immature frontal lobe contributions to cognitive control in
children: evidence from fMRI. Neuron 33 (2), 301–311.
Bunge, S.A., Hazeltine, E., Scanlon, M.D., Rosen, A.C., Gabrieli, J.D.E.,
2002b. Dissociable contributions of prefrontal and parietal cortices to
response selection. NeuroImage 17 (3), 1562–1571.
Burgess, P.W., Alderman, N., Evans, J., Emslie, H., Wilson, B.A., 1998.
The ecological validity of tests of executive function. J. Int. Neuro-
psychol. Soc. 4 (6), 547–558.
Casey, B.J., Trainor, R.J., Orendi, J.L., Schubert, A.B., Nystrom, L.E.,
Giedd, J.N., et al., 1997. A developmental functional MRI study of
prefrontal activation during performance of a go-no-go task. J. Cogn.
Neurosci. 9, 835–847.
Casey, B.J., Thomas, K.M., Welsh, T.F., Badgaiyan, R.D., Eccard, C.H.,
Jennings, J.R., et al., 2000. Dissociation of response conflict, attentional
selection, and expectancy with functional magnetic resonance imaging.
Proc. Natl. Acad. Sci. 97, 8728–8733.
Cohen, J.D., Dunbar, K., McClelland, J.L., 1990. On the control of
automatic processes: a parallel distributed processing account of the
Stroop effect. Psychol. Rev. 97 (3), 332–361.
Corbetta, M., Akbudak, E., Conturo, T.E., Snyder, A.Z., Ollinger, J.M.,
Drury, H.A., et al., 1998. A common network of functional areas for
attention and eye movements. Neuron 21 (4), 761–773.
Dagenbach, D., Carr, T.H., 1994. Inhibitory processes in attention, memory,
and language. Academic Press, Inc., San Diego, CA.
Dassonville, P., Lewis, S.M., Zhu, X.H., Ugurbil, K., Kim, S.G., Ashe, J.,
2001. The effect of stimulus– response compatibility on cortical motor
activation. NeuroImage 13 (1), 1–14.
DeJong, R., Coles, M.G.H., Logan, G.D., 1995. Startegies and mechanisms
in nonselective and selective inhibitory motor control. J. Exp. Psychol.:
Human Percept. Perform. 21, 498–511.
Duncan, J., Johnson, R., Swales, M., Freer, C., 1997. Frontal lobe deficits
after head injury: unity and diversity of function. Cogn. Neuropsychol.
14 (5), 713–741.
Dyer, F., 1973. The Stroop phenomenon and its use in the study of
perceptual, cognitive, and response. Mem. Cogn. 1 (2), 106–120.
Ehri, L., Wilce, L., 1979. Does word training increase or decrease
interference in a Stroop task? J. Exp. Child Psychol. 27 (2), 352–364.
Eriksen, B.A., Eriksen, C.W., 1974. Effects of noise letters upon the
identification of a target letter in a nonsearch task. Percept. Psychophys.
16 (1), 143–149.
Fan, J., Flombaum, J.I., McCandliss, B.D., Thomas, K.M., Posner, M.I.,
2003. Cognitive and brain consequences of conflict. NeuroImage 18
(1), 42–57.
Genovese, C.R., Lazar, N., Nichols, T.E., 2002. Thresholding of statistical
maps in functional neuroimaging using the false discovery rate.
NeuroImage 15 (4), 870–878.
Guillery, R.W., Sherman, S.M., 2002. Thalamic relay functions and their
role in corticocortical communication: generalizations from the visual
system. Neuron 33 (2), 163–175.
Hazeltine, E., Poldrack, R., Gabrieli, J.D.E., 2000. Neural activation during
response competition. J. Cogn. Neurosci. 12, 118–129.
Hubert, M., 2001. Multivariate outlier detection and robust covariance
matrix estimation—Discussion. Technometrics 43 (3), 303–306.
Iacoboni, M., Woods, R.P., Mazziotta, J.C., 1996. Brain–behavior relation-
ships: evidence from practice effects in spatial stimulus– response
compatibility. J. Neurophysiol. 76 (1), 321–331.
Jones, A.D., Cho, R.Y., Nystrom, L.E., Cohen, J.D., Braver, T.S., 2002. A
computational model of anterior cingulate function in speeded response
tasks: effects of frequency, sequence, and conflict. Cogn. Affect. Behav.
Neurosci. 2 (4), 300–317.
Klingberg, T., Roland, P.E., 1997. Interference between two concurrent
tasks is associated with activation of overlapping fields in the cortex.
Brain Res., Cogn. Brain Res. 6 (1), 1–8.
Konishi, S., Nakajima, K., Uchida, I., Kikyo, H., Kameyama, M.,
Miyashita, Y., 1999. Common inhibitory mechanism in human inferior
prefrontal cortex revealed by event-related functional MRI. Brain 122,
981–991.
Kornblum, S., Requin, J., 1995. LRP evidence of automatic response
activation by irrelevant stimuli. Paper presented at the second annual
meeting of the Cognitive Neuroscience Society, San Francisco, CA.
Kornblum, S., Hasbroucq, T., Osman, A., 1990. Dimensional overlap:
cognitive basis for stimulus– response compatibility: a model and
taxonomy. Psychol. Rev. 97 (2), 253–270.
Lancaster, J.L., Woldorff, M.G., Parsons, L.M., Liotti, M., Freitas, C.S.,
Rainey, L., et al., 2000. Automated Talairach atlas labels for functional
brain mapping. Hum. Brain Mapp. 10 (3), 120–131.
Liddle, P.F., Kiehl, K.A., Smith, A.M., 2001. Event-related fMRI study of
response inhibition. Hum. Brain Mapp. 12 (2), 100–109.
Lin, F.H., McIntosh, A.R., Agnew, J.A., Eden, G.F., Zeffiro, T.A.,
Belliveau, J.W., 2003. Multivariate analysis of neuronal interactions
in the generalized partial least squares framework: simulations and
empirical studies. NeuroImage 20 (2), 625–642.
Liu, T.T., 2004. Efficiency, power, and entropy in event-related fMRI with
multiple trial types: Part II. Design of experiments. NeuroImage 21 (1),
401–413.
Liu, T.T., Frank, L.R., Wong, E.C., Buxton, R.B., 2001. Detection power,
estimation efficiency, and predictability in event-related fMRI. Neuro-
Image 13 (4), 759–773.
Logan, G.D., 1985. Executive control of thought and action. Acta Psychol.
60, 193–210.
Logan, G.D., Cowan, W.B., 1984. On the ability to inhibit thought and
action: a theory of an act of control. Psychol. Rev. 91, 295–327.
Lowe, D.G., 1979. Strategies, context, and the mechanism of response
inhibition. Mem. Cogn. 7, 382–389.
MacDonald, A.W., Cohen, J.D., Stenger, V.A., Carter, C.S., 2000.
Dissociating the role of the dorsolateral prefrontal and anterior cingulate
cortex in cognitive control. Science 288, 1835–1838.
MacLeod, C.M., Dunbar, K., 1988. Training and Stroop-like interference:
evidence for a continuum of automaticity. J. Exper. Psychol., Learn.,
Mem., Cogn. 14, 126–135.
Mangun, G.R., 1995. Neural mechanisms of visual selective attention.
Psychophysiology 32 (1), 4–18.
Menon, V., Adleman, N.E., White, C.D., Glover, G.H., Reiss, A.L., 2001.
Error-related brain activation during a Go/NoGo response inhibition
task. Hum. Brain Mapp. 12 (3), 131–143.
Merriam, E.P., Colby, C.L., Thulborn, K.R., Luna, B., Olson, C.R., Sweeny,
J.A., 2001. Stimulus– response incompatibility activates cortex pro-
ximate to three eye fields. NeuroImage 13, 794–800.
Miller, E.K., Cohen, J.D., 2001. An integrative theory of prefrontal cortex
function. Annu. Rev. Neurosci. 24, 167–202.
Miyake, A., Friedman, N.P., Emerson, M.J., Witzki, A.H., Howerter, A.,
2000. The unity and diversity of executive functions and their
contributions to complex ‘‘frontal lobe’’ tasks: a latent variable analysis.
Cogn. Psychol. 41, 49–100.
Monsell, S., Yeung, N., Azuma, R., 2000. Reconfiguration of task-set: is it
easier to switch to the weaker task? Psychol. Res./Psychol. Forsch.:
Spec. Issue: Executive Control 63 (3–4), 250–264.
Nee, D., Jonides, J., Wager, T.D., 2004. A meta-analysis of inhibitory tasks
in neuroimaging. Manuscript in preparation (unpublished manuscript).
Nichols, T.E., Brett, M., Anderson, J., Wager, T.D., Poline, J.B., in press.
Valid conjunction inference with the minimum statistic. Neuroimage.
Oppenheim, A.V., Schafer, R.W., Buck, J.R., 1999. Discrete-time signal
processing, 2nd edR Prentice Hall, Upper Saddle River, NJ.
Peterson, B.S., Kane, M.J., Alexander, G.M., Lacadie, C., Skudlarski, P.,
Leung, H.C., 2002. An event-related functional MRI study comparing
T.D. Wager et al. / NeuroImage 27 (2005) 323–340340
interference effects in the Simon and Stroop tasks. Cogn. Brain Res.
13 (3), 427–440.
Rousseeuw, P.J., Van Driessen, K., 1999. A fast algorithm for the minimum
covariance determinant estimator. Technometrics 41, 212–223.
Rubenstein, J.S., Meyer, D.E., Evans, J.E., 2001. Executive control of
cognitive processes in task switching. J. Exp. Psychol. Hum. Percept.
Perform. 27, 763–797.
Rubia, K., Russell, T., Overmeyer, S., Brammer, M.J., Bullmore, E.T.,
Sharma, T., 2001. Mapping motor inhibition: conjunctive brain
activations across different versions of go/no-go and stop tasks.
NeuroImage 13, 250–261.
Schumacher, E.H., D’Esposito, M., 2002. Neural implementation of
response selection in humans as revealed by localized effects of
stimulus– response compatibility on brain activation. Hum. Brain
Mapp. 17 (3), 193–201.
Sternberg, S., 2001. Separate modifiability, mental modules, and the use of
pure and composite measures to reveal them. Acta Psychol. (Amst.)
106 (1–2), 147–246.
Talairach, J., Tournoux, P., 1988. A Coplanar Stereotactic Atlas of the
Human Brain. Theime, Stuttgart.
van Veen, V., Cohen, J.D., Botnich, M.M., Stenger, V.A., Carter, C.C.,
2001. Anterior cingulate cortex conflict monitoring and levels of
processing. NeuroImage 14, 1302–1308.
Wager, T.D., 2003. Brain and Behavioral Mechanisms of Switching
Attention. UnpublishedDissertation,University ofMichigan, AnnArbor.
Wager, T.D., Nichols, T.E., 2003. Optimization of experimental design in
fMRI: a general framework using a genetic algorithm. NeuroImage
18 (2), 293–309.
Wager, T.D., Phan, K.L., Liberzon, I., Taylor, S.F., 2003. Valence, gender,
and lateralization of functional brain anatomy in emotion: a meta-
analysis of findings from neuroimaging. NeuroImage 19 (3), 513–531.
Wager, T.D., Reading, S., Jonides, J., 2004. Neuroimaging studies of
shifting attention: a meta-analysis. NeuroImage 22 (4), 1679–1693.
Wager, T.D., Vasquez, A., Hernandez, L., Noll, D.C., 2005. Accounting for
nonlinear BOLD effects in fMRI: parameter estimates and a model for
prediction in rapid event-related studies. NeuroImage 25 (1), 206–218.
Woods, R.P., Grafton, S.T., Holmes, C.J., Cherry, S.R., Mazziotta, J.C.,
1998. Automated image registration: I. General methods and intra-
subject, intramodality validation. J. Comput. Assist. Tomogr. 22,
141–154.
Yeung, N., Monsell, S., 2003. Switching between tasks of unequal
familiarity: the role of stimulus-attribute and response-set selection.
J. Exp. Psychol. Hum. Percept. Perform. 29 (2), 455–469.
Zhang, H.H., Zhang, J., Kornblum, S., 1999. A parallel distributed
processing model of stimulus–stimulus and stimulus– response com-
patibility. Cogn. Psychol. 38 (3), 386–432.