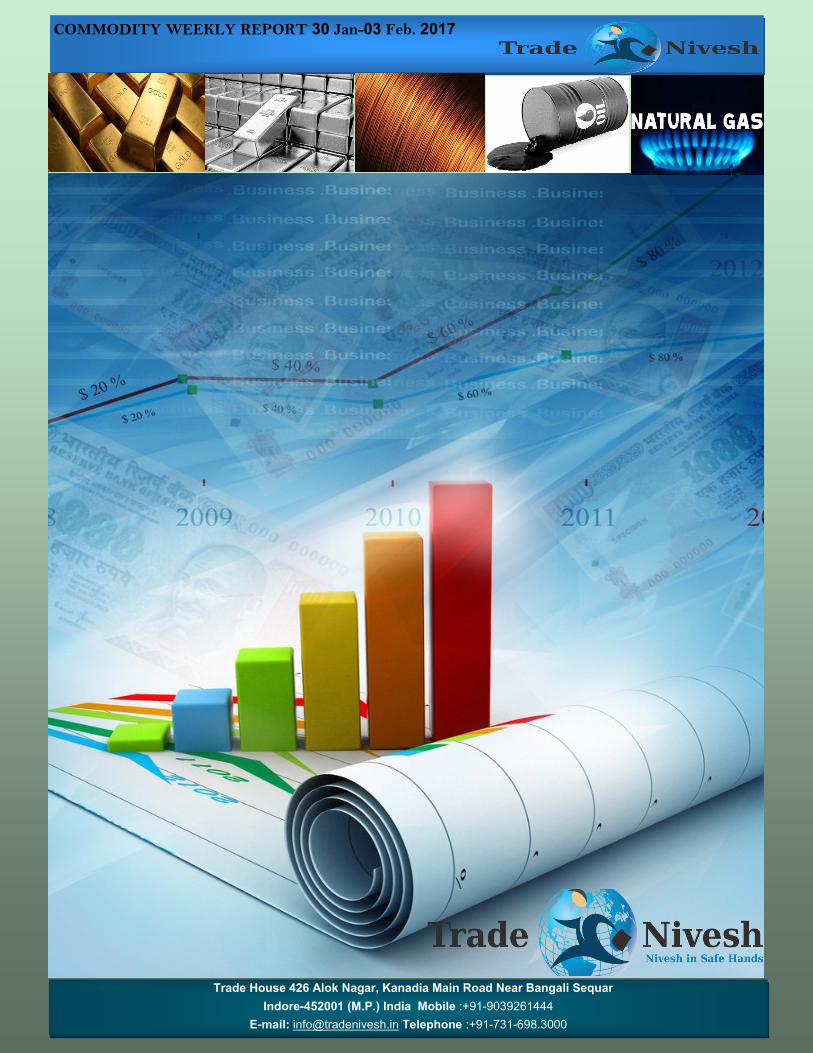
Commodity weekly report 30 jan to 3-feb 2017
9
Trade House 426 Alok Nagar, Kanadia Main Road Near Bangali Sequar Indore-452001 (M.P.) India Mobile :+91-9039261444 E-mail: [email protected] Telephone :+91-731-698.3000 COMMODITY WEEKLY REPORT 30 Jan-03 Feb. 2017
-
Upload
tradenivesh-investment -
Category
Business
-
view
36 -
download
4
Transcript of Commodity weekly report 30 jan to 3-feb 2017
Visit web: www.tradenivesh.com
Call Us On : + 91-9039261444
Trade House 426 Alok Nagar, Kanadia Main Road Near Bangali Sequar
Indore-452001 (M.P.) India Mobile :+91-9039261444
E-mail: [email protected] Telephone :+91-731-698.3000
COMMODITY WEEKLY REPORT 9 TO 13 JAN. 2017 COMMODITY WEEKLY REPORT 30 Jan-03 Feb. 2017
Visit web: www.tradenivesh.com
Call Us On : + 91-9039261444
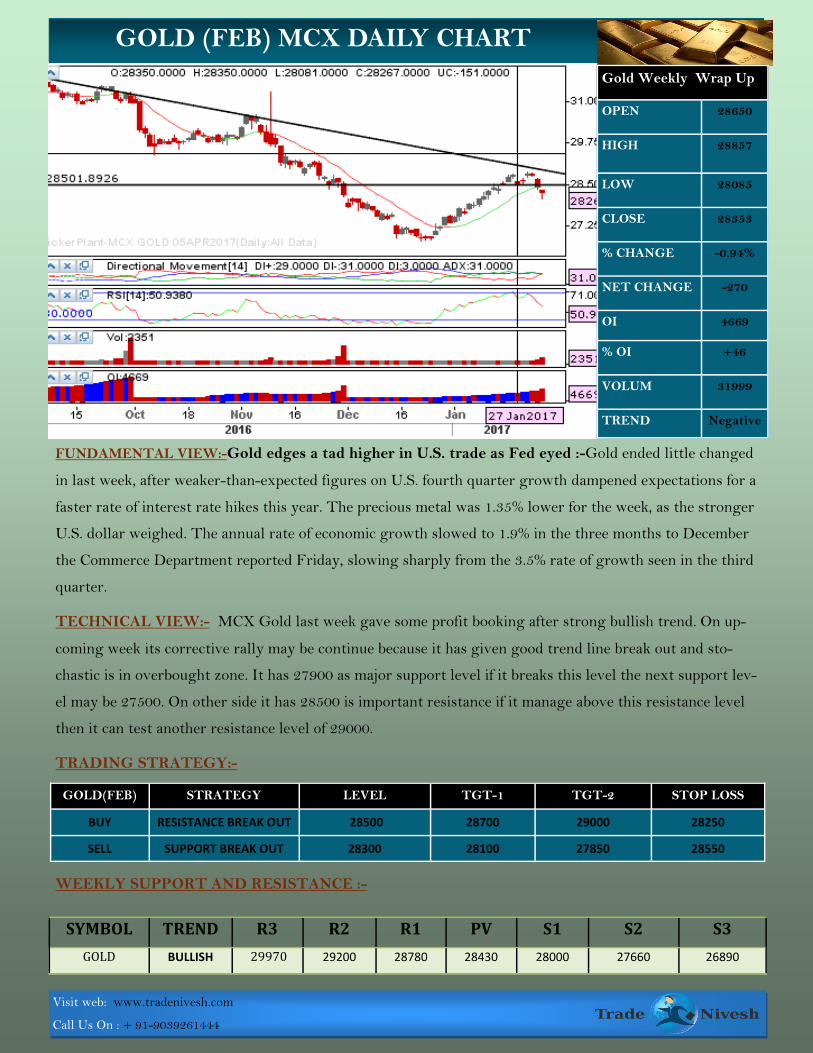
FUNDAMENTAL VIEW:-Gold edges a tad higher in U.S. trade as Fed eyed :-Gold ended little changed
in last week, after weaker-than-expected figures on U.S. fourth quarter growth dampened expectations for a
faster rate of interest rate hikes this year. The precious metal was 1.35% lower for the week, as the stronger
U.S. dollar weighed. The annual rate of economic growth slowed to 1.9% in the three months to December
the Commerce Department reported Friday, slowing sharply from the 3.5% rate of growth seen in the third
quarter.
TECHNICAL VIEW:- MCX Gold last week gave some profit booking after strong bullish trend. On up-
coming week its corrective rally may be continue because it has given good trend line break out and sto-
chastic is in overbought zone. It has 27900 as major support level if it breaks this level the next support lev-
el may be 27500. On other side it has 28500 is important resistance if it manage above this resistance level
then it can test another resistance level of 29000.
TRADING STRATEGY:-
WEEKLY SUPPORT AND RESISTANCE :-
SYMBOL TREND R3 R2 R1 PV S1 S2 S3
GOLD BULLISH 29970 29200 28780 28430 28000 27660 26890
GOLD (FEB) MCX DAILY CHART
Gold Weekly Wrap Up
OPEN 28650
HIGH 28857
LOW 28085
CLOSE 28353
% CHANGE -0.94%
NET CHANGE -270
OI 4669
% OI +46
VOLUM 31999
TREND Negative
GOLD(FEB) STRATEGY LEVEL TGT-1 TGT-2 STOP LOSS
BUY RESISTANCE BREAK OUT 28500 28700 29000 28250
SELL SUPPORT BREAK OUT 28300 28100 27850 28550
Visit web: www.tradenivesh.com
Call Us On : + 91-9039261444
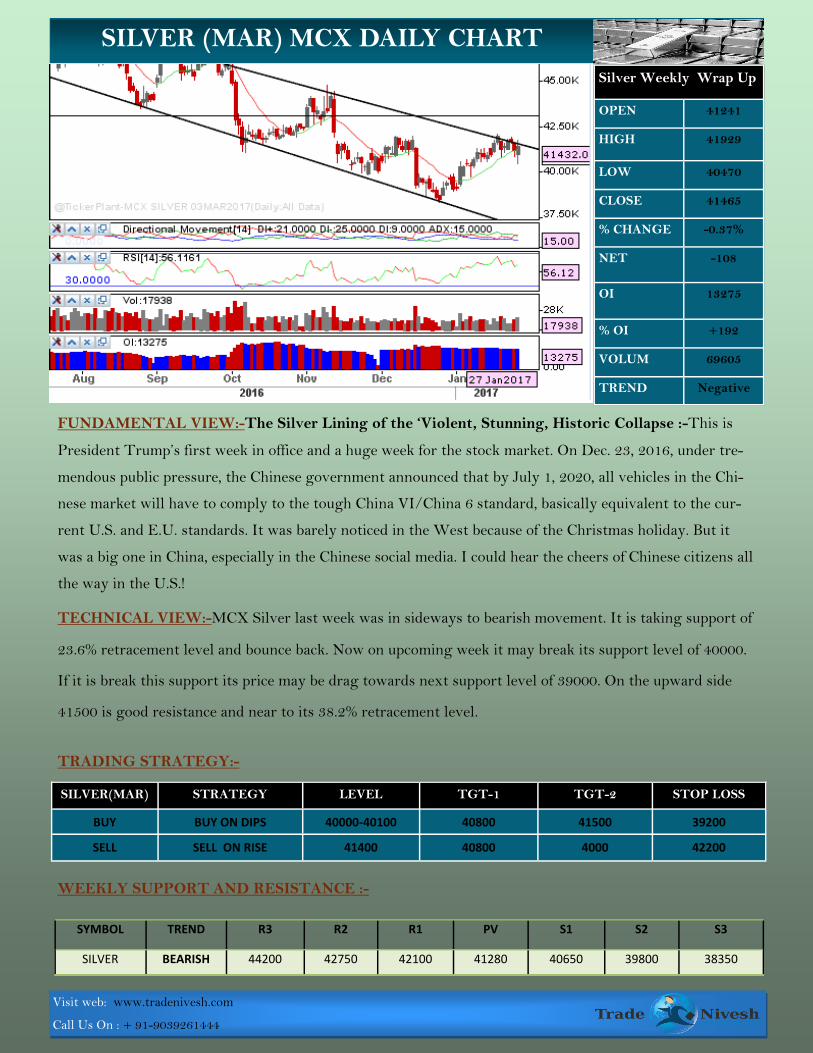
FUNDAMENTAL VIEW:-The Silver Lining of the ‘Violent, Stunning, Historic Collapse :-This is
President Trump’s first week in office and a huge week for the stock market. On Dec. 23, 2016, under tre-
mendous public pressure, the Chinese government announced that by July 1, 2020, all vehicles in the Chi-
nese market will have to comply to the tough China VI/China 6 standard, basically equivalent to the cur-
rent U.S. and E.U. standards. It was barely noticed in the West because of the Christmas holiday. But it
was a big one in China, especially in the Chinese social media. I could hear the cheers of Chinese citizens all
the way in the U.S.!
TECHNICAL VIEW:-MCX Silver last week was in sideways to bearish movement. It is taking support of
23.6% retracement level and bounce back. Now on upcoming week it may break its support level of 40000.
If it is break this support its price may be drag towards next support level of 39000. On the upward side
41500 is good resistance and near to its 38.2% retracement level.
TRADING STRATEGY:-
WEEKLY SUPPORT AND RESISTANCE :-
SYMBOL TREND R3 R2 R1 PV S1 S2 S3
SILVER BEARISH 44200 42750 42100 41280 40650 39800 38350
SILVER (MAR) MCX DAILY CHART
Silver Weekly Wrap Up
OPEN 41241
HIGH 41929
LOW 40470
CLOSE 41465
% CHANGE -0.37%
NET -108
OI 13275
% OI +192
VOLUM 69605
TREND Negative
SILVER(MAR) STRATEGY LEVEL TGT-1 TGT-2 STOP LOSS
BUY BUY ON DIPS 40000-40100 40800 41500 39200
SELL SELL ON RISE 41400 40800 4000 42200
Visit web: www.tradenivesh.com
Call Us On : + 91-9039261444
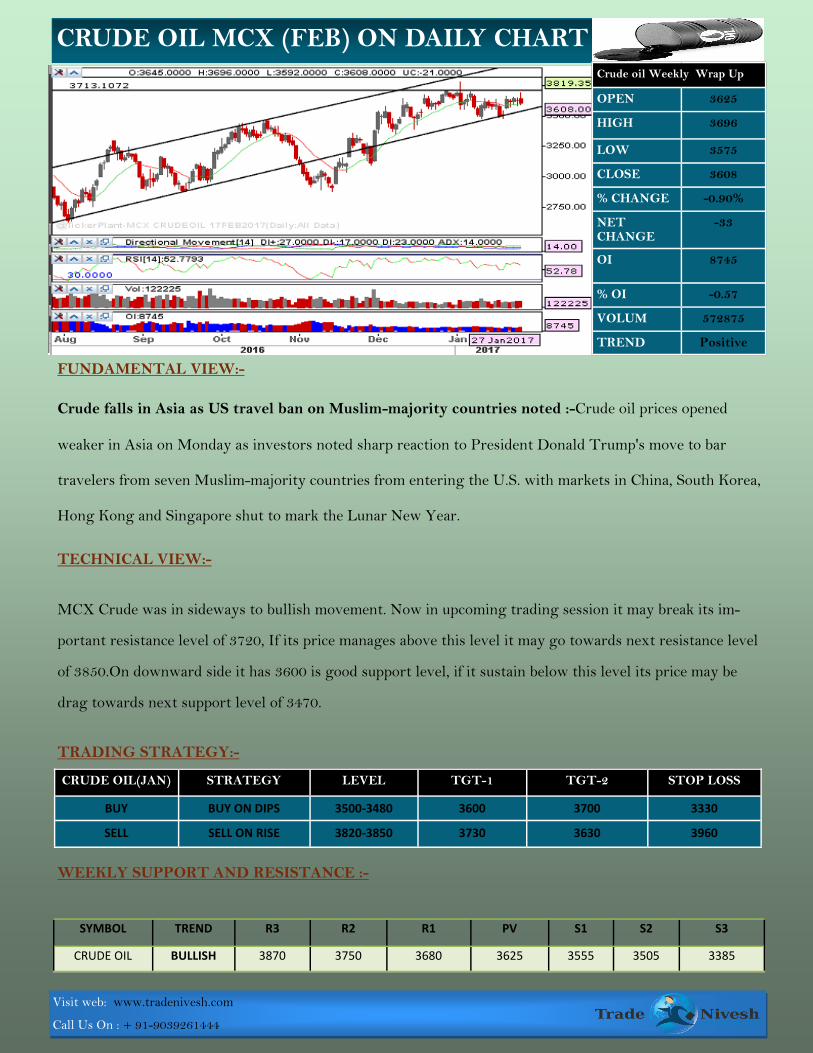
FUNDAMENTAL VIEW:-
Crude falls in Asia as US travel ban on Muslim-majority countries noted :-Crude oil prices opened
weaker in Asia on Monday as investors noted sharp reaction to President Donald Trump's move to bar
travelers from seven Muslim-majority countries from entering the U.S. with markets in China, South Korea,
Hong Kong and Singapore shut to mark the Lunar New Year.
TECHNICAL VIEW:-
MCX Crude was in sideways to bullish movement. Now in upcoming trading session it may break its im-
portant resistance level of 3720, If its price manages above this level it may go towards next resistance level
of 3850.On downward side it has 3600 is good support level, if it sustain below this level its price may be
drag towards next support level of 3470.
TRADING STRATEGY:-
WEEKLY SUPPORT AND RESISTANCE :-
SYMBOL TREND R3 R2 R1 PV S1 S2 S3
CRUDE OIL BULLISH 3870 3750 3680 3625 3555 3505 3385
CRUDE OIL MCX (FEB) ON DAILY CHART
Crude oil Weekly Wrap Up
OPEN 3625
HIGH 3696
LOW 3575
CLOSE 3608
% CHANGE -0.90%
NET CHANGE
-33
OI 8745
% OI -0.57
VOLUM 572875
TREND Positive
CRUDE OIL(JAN) STRATEGY LEVEL TGT-1 TGT-2 STOP LOSS
BUY BUY ON DIPS 3500-3480 3600 3700 3330
SELL SELL ON RISE 3820-3850 3730 3630 3960
Visit web: www.tradenivesh.com
Call Us On : + 91-9039261444
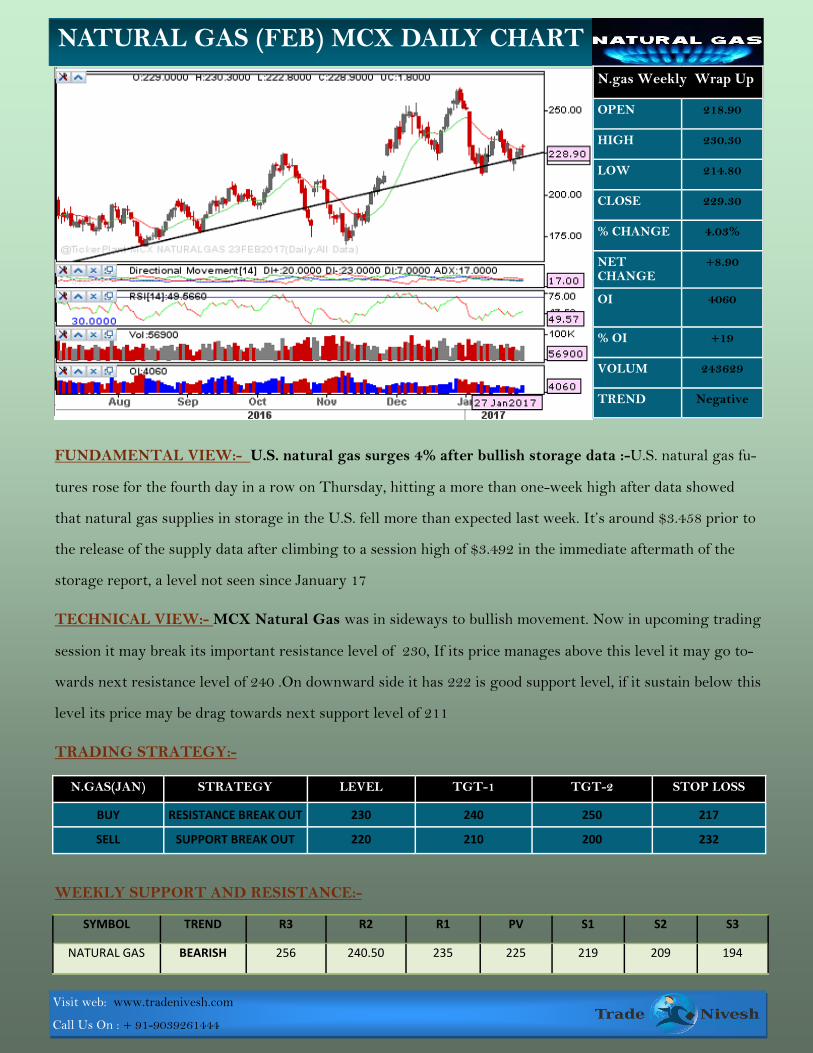
FUNDAMENTAL VIEW:- U.S. natural gas surges 4% after bullish storage data :-U.S. natural gas fu-
tures rose for the fourth day in a row on Thursday, hitting a more than one-week high after data showed
that natural gas supplies in storage in the U.S. fell more than expected last week. It’s around $3.458 prior to
the release of the supply data after climbing to a session high of $3.492 in the immediate aftermath of the
storage report, a level not seen since January 17
TECHNICAL VIEW:- MCX Natural Gas was in sideways to bullish movement. Now in upcoming trading
session it may break its important resistance level of 230, If its price manages above this level it may go to-
wards next resistance level of 240 .On downward side it has 222 is good support level, if it sustain below this
level its price may be drag towards next support level of 211
TRADING STRATEGY:-
WEEKLY SUPPORT AND RESISTANCE:-
NATURAL GAS (FEB) MCX DAILY CHART
SYMBOL TREND R3 R2 R1 PV S1 S2 S3
NATURAL GAS BEARISH 256 240.50 235 225 219 209 194
N.gas Weekly Wrap Up
OPEN 218.90
HIGH 230.30
LOW 214.80
CLOSE 229.30
% CHANGE 4.03%
NET CHANGE
+8.90
OI 4060
% OI +19
VOLUM 243629
TREND Negative
N.GAS(JAN) STRATEGY LEVEL TGT-1 TGT-2 STOP LOSS
BUY RESISTANCE BREAK OUT 230 240 250 217
SELL SUPPORT BREAK OUT 220 210 200 232
Visit web: www.tradenivesh.com
Call Us On : + 91-9039261444
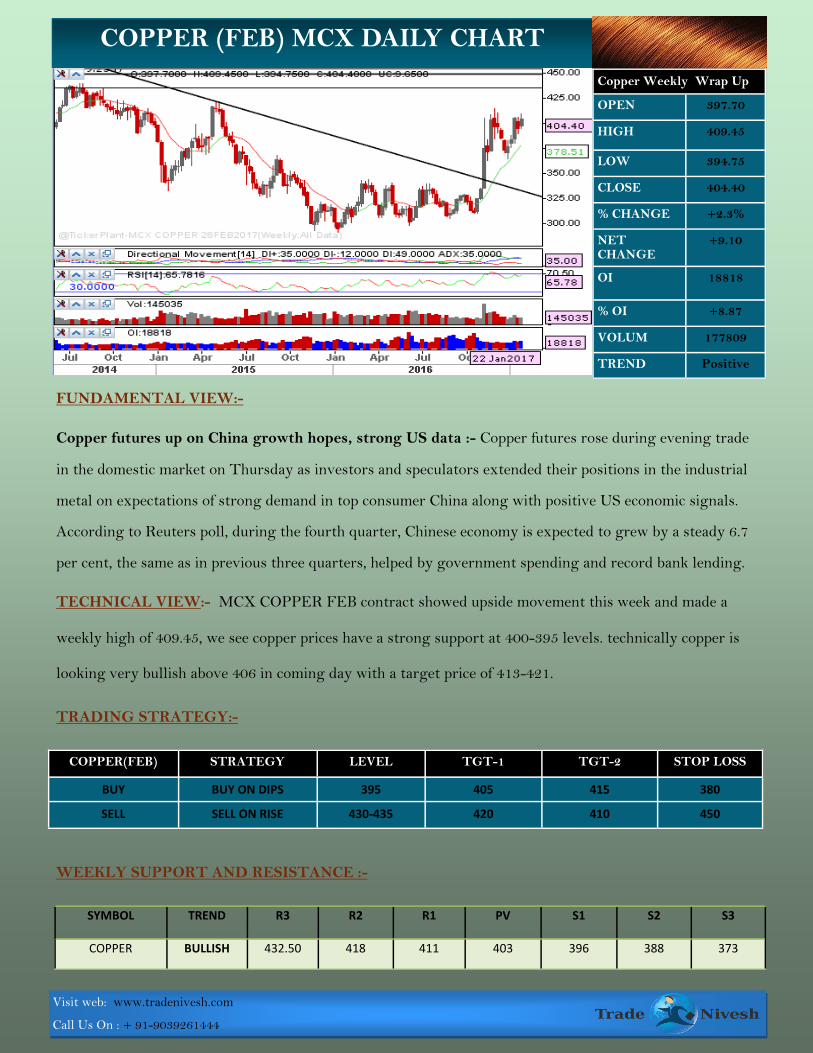
FUNDAMENTAL VIEW:-
Copper futures up on China growth hopes, strong US data :- Copper futures rose during evening trade
in the domestic market on Thursday as investors and speculators extended their positions in the industrial
metal on expectations of strong demand in top consumer China along with positive US economic signals.
According to Reuters poll, during the fourth quarter, Chinese economy is expected to grew by a steady 6.7
per cent, the same as in previous three quarters, helped by government spending and record bank lending.
TECHNICAL VIEW:- MCX COPPER FEB contract showed upside movement this week and made a
weekly high of 409.45, we see copper prices have a strong support at 400-395 levels. technically copper is
looking very bullish above 406 in coming day with a target price of 413-421.
TRADING STRATEGY:-
WEEKLY SUPPORT AND RESISTANCE :-
SYMBOL TREND R3 R2 R1 PV S1 S2 S3
COPPER BULLISH 432.50 418 411 403 396 388 373
COPPER (FEB) MCX DAILY CHART
Copper Weekly Wrap Up
OPEN 397.70
HIGH 409.45
LOW 394.75
CLOSE 404.40
% CHANGE +2.3%
NET CHANGE
+9.10
OI 18818
% OI +8.87
VOLUM 177809
TREND Positive
COPPER(FEB) STRATEGY LEVEL TGT-1 TGT-2 STOP LOSS
BUY BUY ON DIPS 395 405 415 380
SELL SELL ON RISE 430-435 420 410 450
Visit web: www.tradenivesh.com
Call Us On : + 91-9039261444
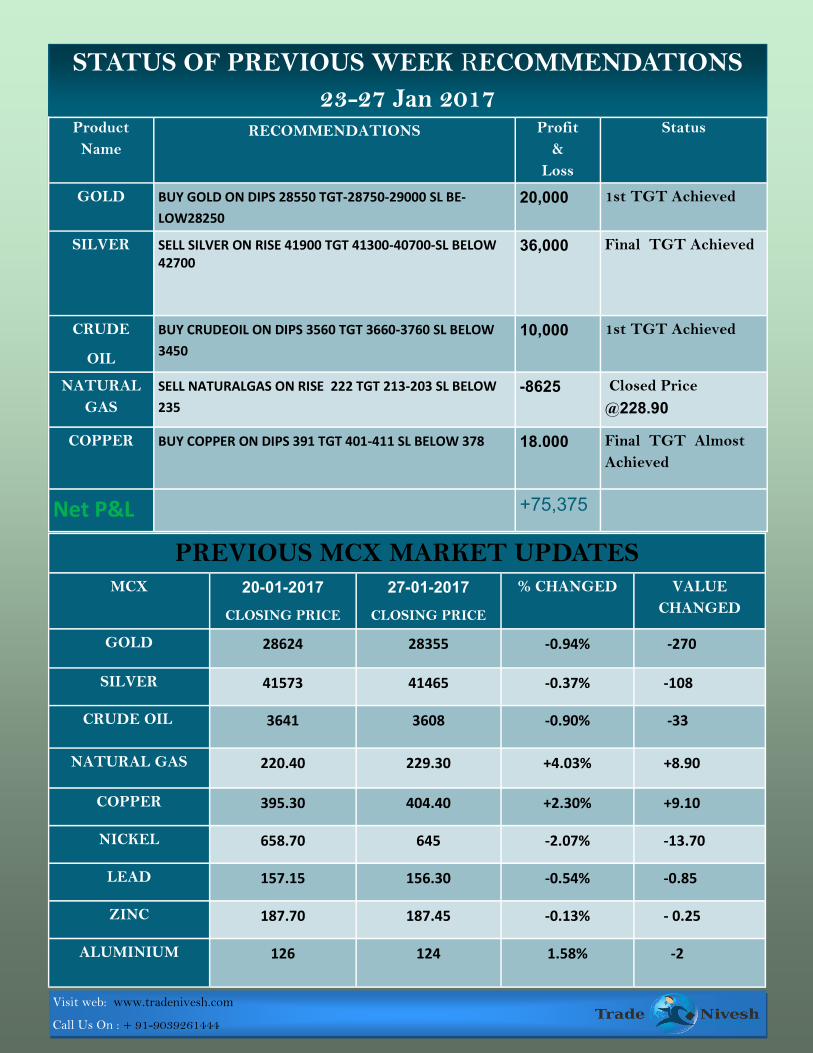
STATUS OF PREVIOUS WEEK RECOMMENDATIONS
23-27 Jan 2017 Product
Name RECOMMENDATIONS Profit
&
Loss
Status
GOLD BUY GOLD ON DIPS 28550 TGT-28750-29000 SL BE-
LOW28250
20,000 1st TGT Achieved
SILVER SELL SILVER ON RISE 41900 TGT 41300-40700-SL BELOW 42700
36,000 Final TGT Achieved
CRUDE
OIL
BUY CRUDEOIL ON DIPS 3560 TGT 3660-3760 SL BELOW
3450
10,000 1st TGT Achieved
NATURAL
GAS
SELL NATURALGAS ON RISE 222 TGT 213-203 SL BELOW
235
-8625 Closed Price
@228.90
COPPER BUY COPPER ON DIPS 391 TGT 401-411 SL BELOW 378
18.000 Final TGT Almost
Achieved
Net P&L +75,375
PREVIOUS MCX MARKET UPDATES MCX 20-01-2017
CLOSING PRICE
27-01-2017
CLOSING PRICE
% CHANGED VALUE
CHANGED
GOLD 28624 28355 -0.94% -270
SILVER 41573 41465 -0.37% -108
CRUDE OIL 3641 3608 -0.90% -33
NATURAL GAS 220.40 229.30 +4.03% +8.90
COPPER 395.30 404.40 +2.30% +9.10
NICKEL 658.70 645 -2.07% -13.70
LEAD 157.15 156.30 -0.54% -0.85
ZINC 187.70 187.45 -0.13% - 0.25
ALUMINIUM 126 124 1.58% -2
Visit web: www.tradenivesh.com
Call Us On : + 91-9039261444
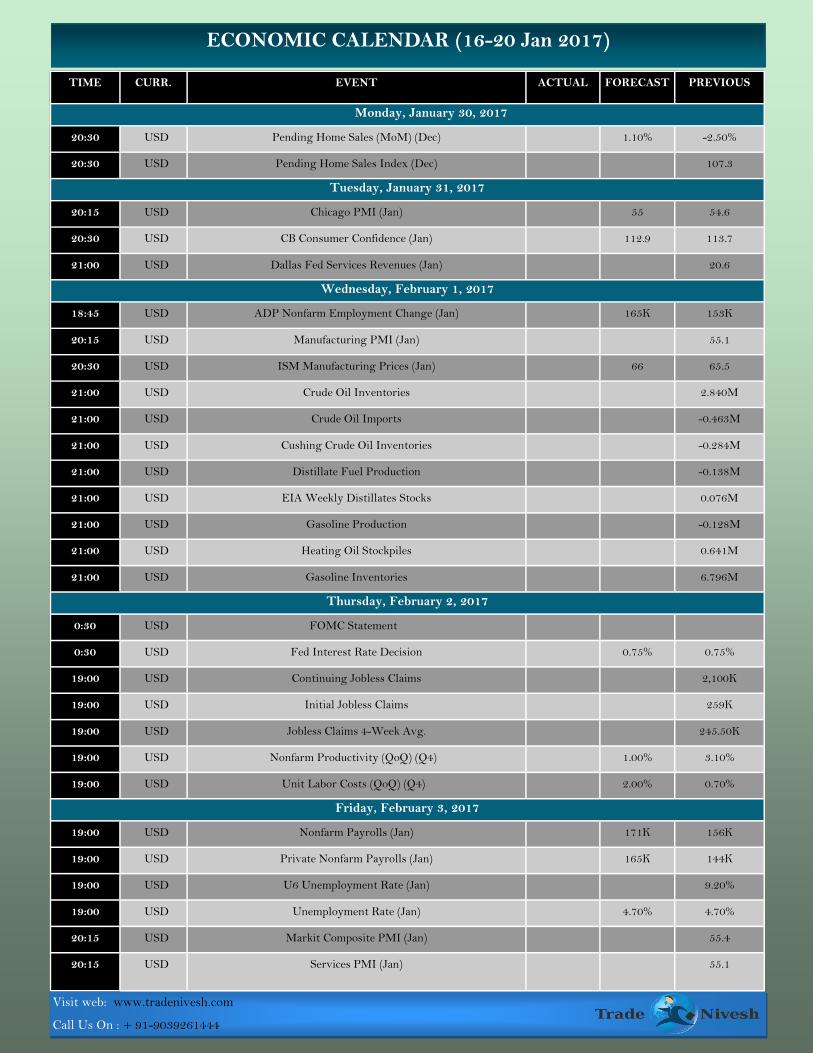
ECONOMIC CALENDAR (16-20 Jan 2017)
TIME CURR. EVENT ACTUAL FORECAST PREVIOUS
Monday, January 30, 2017
20:30 USD Pending Home Sales (MoM) (Dec) 1.10% -2.50%
20:30 USD Pending Home Sales Index (Dec) 107.3
Tuesday, January 31, 2017
20:15 USD Chicago PMI (Jan) 55 54.6
20:30 USD CB Consumer Confidence (Jan) 112.9 113.7
21:00 USD Dallas Fed Services Revenues (Jan) 20.6
Wednesday, February 1, 2017
18:45 USD ADP Nonfarm Employment Change (Jan) 165K 153K
20:15 USD Manufacturing PMI (Jan) 55.1
20:30 USD ISM Manufacturing Prices (Jan) 66 65.5
21:00 USD Crude Oil Inventories 2.840M
21:00 USD Crude Oil Imports -0.463M
21:00 USD Cushing Crude Oil Inventories -0.284M
21:00 USD Distillate Fuel Production -0.138M
21:00 USD EIA Weekly Distillates Stocks 0.076M
21:00 USD Gasoline Production -0.128M
21:00 USD Heating Oil Stockpiles 0.641M
21:00 USD Gasoline Inventories 6.796M
Thursday, February 2, 2017
0:30 USD FOMC Statement
0:30 USD Fed Interest Rate Decision 0.75% 0.75%
19:00 USD Continuing Jobless Claims 2,100K
19:00 USD Initial Jobless Claims 259K
19:00 USD Jobless Claims 4-Week Avg. 245.50K
19:00 USD Nonfarm Productivity (QoQ) (Q4) 1.00% 3.10%
19:00 USD Unit Labor Costs (QoQ) (Q4) 2.00% 0.70%
Friday, February 3, 2017
19:00 USD Nonfarm Payrolls (Jan) 171K 156K
19:00 USD Private Nonfarm Payrolls (Jan) 165K 144K
19:00 USD U6 Unemployment Rate (Jan) 9.20%
19:00 USD Unemployment Rate (Jan) 4.70% 4.70%
20:15 USD Markit Composite PMI (Jan) 55.4
20:15 USD Services PMI (Jan) 55.1
Visit web: www.tradenivesh.com
Call Us On : + 91-9039261444
This document is solely for the personal information of the recipient, and must not be singularly used as the
basis of any investment decision. Nothing in this document should be construed as investment or financial
advice. Each recipient of this document should make such investigations as they deem necessary to arrive at
an independent evaluation of an investment in the securities of the companies referred to in this document
including the merits and risks involved, and should consult their own advisors to determine the merits and
risks of such an investment.
Reports based on technical and derivative analysis center on studying charts of a stock's price movement,
outstanding positions and trading volume. The information in this document has been printed on the basis
of publicly available information, internal data and other reliable sources believed to be true, but we do not
represent that it is accurate or complete and it should not be relied on as such, as this document is for gen-
eral guidance only. Trade Nivesh shall not be in any way responsible for any loss or damage that may arise
DISCLAIMER