Commodity Flow Analysis
45
Commodity Flow Analysis Prepared for Association of American Railroads October 14, 2016 Towson, Maryland 21252 | 410‐704‐3326 | www.towson.edu/resi
Transcript of Commodity Flow Analysis

Commodity Flow Analysis
Prepared for Association of American Railroads
October 14, 2016
Towson, Maryland 21252 | 410‐704‐3326 | www.towson.edu/resi

Commodity Flow Analysis RESI of Towson University
2
Table of Contents Table of Figures ............................................................................................................................... 3 1.0 Executive Summary .............................................................................................................. 5 2.0 Project Objective .................................................................................................................. 6 3.0 Methodology ........................................................................................................................ 6 4.0 Findings ................................................................................................................................ 8 4.1 Steel and Steel‐Related Commodities .............................................................................. 9 4.2 Power Generation and Distribution Commodities ........................................................ 13 4.3 Drilling‐Related and Crude Oil Commodities ................................................................. 16 4.4 Agricultural Products ...................................................................................................... 20 4.5 Building Construction Commodities .............................................................................. 23
5.0 References ......................................................................................................................... 28 Appendix A—Detailed Economic Impacts .................................................................................... 31

Commodity Flow Analysis RESI of Towson University
3
Table of Figures Figure 1: Economic and Fiscal Impacts of the Transportation of Select Commodities, 2014 (Monetary Figures in Billions) ......................................................................................................... 5 Figure 2: Commodity Transportation Costs, 2014 (Figures in Billions) .......................................... 7 Figure 3: IMPLAN Industry Sectors ................................................................................................. 8 Figure 4: Steel and Steel‐Related Commodity Flow Process ........................................................ 11 Figure 5: Economic Impacts of the Transportation of Steel and Steel‐Related Commodities, 2014 (Wages and Output Figures in Millions) ....................................................................................... 12 Figure 6: Fiscal Impacts of the Transportation of Steel and Steel‐Related Commodities, 2014 (Figures in Millions) ....................................................................................................................... 12 Figure 7: Coal Commodity Flow Process ....................................................................................... 14 Figure 8: Wind Turbine Commodity Flow Process ........................................................................ 15 Figure 9: Economic Impacts of the Transportation of Power Generation and Distribution Commodities, 2014 (Wages and Output Figures in Millions) ....................................................... 16 Figure 10: Fiscal Impacts of Power Generation and Distribution Commodities, 2014 (Figures in Millions) ........................................................................................................................................ 16 Figure 11: Drilling‐Related and Crude Oil Commodity Flow Process............................................ 19 Figure 12: Economic Impacts of the Transportation of Drilling‐Related and Crude Oil Commodities, 2014 (Wages and Output Figures in Millions) ....................................................... 19 Figure 13: Fiscal Impacts of the Transportation of Drilling‐Related and Crude Oil Commodities, 2014 (Figures in Millions) .............................................................................................................. 20 Figure 14: Agricultural Products Commodity Flow Process .......................................................... 22 Figure 15: Economic Impacts of the Transportation of Agricultural Products, 2014 (Wages and Output Figures in Millions) ........................................................................................................... 23 Figure 16: Fiscal Impacts of the Transportation of Agricultural Products, 2014 (Figures in Millions) ........................................................................................................................................ 23 Figure 17: Building Construction Commodity Flow Process ......................................................... 26 Figure 18: Economic Impacts of the Transportation of Building Construction Commodities, 2014 (Wages and Output Figures in Millions) ....................................................................................... 27 Figure 19: Fiscal Impacts of the Transportation of Building Construction Commodities, 2014 (Figures in Millions) ....................................................................................................................... 27 Figure 20: Detailed Jobs Impacts—Steel and Steel‐Related Commodities .................................. 31 Figure 21: Detailed Wage Impacts—Steel and Steel‐Related Commodities (Figures in Millions) ... ....................................................................................................................................................... 32 Figure 22: Detailed Output Impacts—Steel and Steel‐Related Commodities (Figures in Millions)....................................................................................................................................................... 33 Figure 23: Detailed Jobs Impacts—Power Generation and Distribution Commodities ............... 34 Figure 24: Detailed Wage Impacts—Power Generation and Distribution Commodities (Figures in Millions) ........................................................................................................................................ 35
Commodity Flow Analysis RESI of Towson University
4
Figure 25: Detailed Output Impacts—Power Generation and Distribution Commodities (Figures in Millions)..................................................................................................................................... 36 Figure 26: Detailed Jobs Impacts—Drilling‐Related and Crude Oil Commodities ........................ 37 Figure 27: Detailed Wage Impacts—Drilling‐Related and Crude Oil Commodities (Figures in Millions) ........................................................................................................................................ 38 Figure 28: Detailed Output Impacts—Drilling‐Related and Crude Oil Commodities (Figures in Millions) ........................................................................................................................................ 39 Figure 29: Detailed Jobs Impacts—Agricultural Products ............................................................ 40 Figure 30: Detailed Wage Impacts—Agricultural Products (Figures in Millions) ......................... 41 Figure 31: Detailed Output Impacts—Agricultural Products (Figures in Millions) ....................... 42 Figure 32: Detailed Jobs Impacts—Building Construction Commodities ..................................... 43 Figure 33: Detailed Wage Impacts—Building Construction Commodities (Figures in Millions) .. 44 Figure 34: Detailed Output Impacts—Building Construction Commodities (Figures in Millions) 45

Commodity Flow Analysis RESI of Towson University
5
1.0 Executive Summary This report, commissioned by the Association of American Railroads (AAR), quantifies the economic and fiscal effects resulting from the shipment of commodities via Class I railroads. In order to quantify these impacts, the Regional Economic Studies Institute (RESI) of Towson University used commodity transportation costs. The analysis is focused on rail transportation expenditures by firms that produce, process, and use a variety of products in the U.S. Figure 1 enumerates the impact findings from this analysis. Figure 1: Economic and Fiscal Impacts of the Transportation of Select Commodities, 2014 (Monetary Figures in Billions)
Commodity Commodity
Transportation Costs
Jobs Wages Output Fiscal
Steel and steel‐related commodities
$9.6 97,408 $7.1 $23.4 $2.5
Power generation and distribution commodities
$14.2 143,866 $10.5 $34.6 $3.7
Drilling‐related and crude oil commodities
$5.8 58,816 $4.3 $14.1 $1.5
Agricultural products $11.2 114,005 $8.3 $27.4 $2.9 Building construction commodities
$10.1 102,446 $7.5 $24.6 $2.6
Sources: IMPLAN, RESI The commodities reported in Figure 1 comprise a large portion of total carloads (about 53 percent) moved via Class I Railroads, but are not inclusive of all the commodities that are transported. As the commodity flows represented in this analysis contain some overlap (for example, steel pipe, structural steel and steel rod falls under both steel and steel‐related commodities and building construction commodities), the individual impacts cannot be added together. To quantify the economic and fiscal impacts of commodity transportation costs via Class I railroads in the U.S., RESI used the IMPLAN input/output model. This model has the ability to enumerate the economic and fiscal impacts of each dollar earned and spent by the following:
Individuals directly employed by the rail industry;
Supporting vendors (business services, retail, etc.) and their spending on other firms; and
The households of the industry’s employees, vendors' employees, and other businesses' that result from households increasing their purchases at local businesses.

Commodity Flow Analysis RESI of Towson University
6
2.0 Project Objective This report, commissioned by the Association of American Railroads (AAR), quantifies the economic and fiscal effects resulting from the shipment of commodities via Class I railroads. The analysis is focused on rail transportation expenditures by firms that produce, process, and use a variety of products in the U.S. The findings in this report estimate the number of jobs as well as the corresponding wages and output that are supported when industries ship their commodities via Class I railroads. Specifically, this reports looks at the economic and fiscal impacts of moving, via Class I railroads, the following business categories:
Steel and steel‐related commodities,
Power generation and distribution commodities,
Drilling‐related and crude oil commodities,
Agricultural products, and
Building construction commodities. Though not inclusive of all commodities transported by Class I railroads, when combined, these commodities represent a substantial portion of the business for Class I railroads. These commodities illustrate how essential the railroads are in the movement of goods enjoyed by Americans. Section 3.0 provides a detail of the methodology used in this report.
3.0 Methodology In order to quantify the economic and fiscal impacts of the transportation of selected commodities via Class I railroads, the Regional Economic Studies Institute (RESI) of Towson University used commodity transportation costs provided by AAR. AAR drew Class I railroad freight revenue per commodity from the Surface Transportation Board’s 2014 Freight Commodity Statistics report and from the Surface Transportation Board’s 2014 Annual Report Form R‐1. The freight revenue received by the railroads equates to the money spent by industries for the rail portion of their transportation expenses. See Figure 2 for the dollars spent to ship these commodities via Class I railroads in 2014.

Commodity Flow Analysis RESI of Towson University
7
Figure 2: Commodity Transportation Costs, 2014 (Figures in Billions)
Commodity Commodity
TransportationCosts
Steel and steel‐related commodities $9.6 Power generation and distribution commodities $14.2 Drilling‐related and crude oil commodities $5.8 Agricultural products $11.2 Building construction commodities $10.1
Sources: AAR, RESI The economic and fiscal impacts generated by the movement of the selected commodities via Class I railroads can be classified as:
Direct: the employment at Class I railroads that supports the movement of these commodities and the associated wages for those rail employees, both of which are supported by the billions of dollars spent to ship those commodities via Class I railroads;
Indirect: the resulting employment and economic activity at firms that supply goods and services to the railroads; and
Induced: the resulting increase in household purchases at local businesses generated by an increase in household income as new job opportunities are created and income levels rise.
To quantify the economic and fiscal impacts of commodity transportation spending via Class I railroads in the U.S., RESI used the IMPLAN input/output model. This model has the ability to enumerate the economic and fiscal impacts of each dollar earned and spent by the following:
Individuals directly employed by the rail industry;
Supporting vendors (business services, retail, etc.) and their spending on other firms; and
The households of the industry’s employees, vendors' employees, and other businesses' that result from households increasing their purchases at local businesses.
Consider the following example. A new firm opens in a region and directly employs 100 workers. This is a direct economic impact. The firm purchases supplies and services, leading to increased business activity and hypothetically creating jobs for another 100 workers at supply companies. This is called the indirect effect. The workers at the new firm and at the supply companies spend their personal income mostly in the local area, hypothetically creating jobs for another 50 workers. This is the induced effect. The direct, indirect, and induced effects add up

Commodity Flow Analysis RESI of Towson University
8
to 250 jobs created from the original 100 jobs. Thus, in terms of employment, the total economic impact of the firm in our example is 250 additional jobs.1 RESI’s analysis includes the following modeling assumptions.
Economic impact multipliers are developed from IMPLAN input/output software.
IMPLAN data are based on the North American Industry Classification System (NAICS).
IMPLAN employment multipliers are adjusted for inflation using the Bureau of Labor Statistic’s CPI‐U.
Impacts are based on 2014 IMPLAN data for the U.S., the most recent data available.
Impacts are represented in 2014 dollars.
Impacts are based on data from the Surface Transportation Board’s 2014 Freight Commodity Statistics report and from the Surface Transportation Board’s 2014 Annual Report Form R‐1.
IMPLAN does not differentiate between full‐ and part‐time employment. Therefore, employment impacts include both full‐ and part‐time employees.
For the IMPLAN analysis, RESI categorized industry sectors based on expenditure category—in this case commodity transportation costs (i.e. the cost to ship commodities via rail). The specific industry sector that RESI analyzed can be found in Figure 3. Figure 3: IMPLAN Industry Sectors
Industry Code Description
409 Rail transportation2
Source: IMPLAN The direct, indirect, induced, and total economic and fiscal impacts are summarized in Section 4.0. For detailed economic impacts, please refer to Appendix A.
4.0 Findings As outlined in Section 3.0, RESI used commodity transportation cost data, derived from the Surface Transportation Board’s 2014 Freight Commodity Statistics report and from the 2014 Annual Report Form R‐1, and provided by AAR to quantify the economic and fiscal impacts of the transportation of select commodities. As the commodity flows represented in this analysis contain some overlap (for example, household appliances fall under both steel and steel‐related commodities and building construction), the impacts of each cannot be added together.
1 Total economic impact is defined as the sum of direct, indirect, and induced effects. 2 Industry Code 409, Rail transportation, includes both passenger and cargo transportation.

Commodity Flow Analysis RESI of Towson University
9
For each commodity, output directly correlates to the billions of dollars spent to ship these products via Class I railroads. Individuals directly employed by the rail industry and the wages associated with those employees would be considered direct impacts. Direct impacts make up the largest component of the total output and wages impacts. Total jobs impacts, however, are largely compiled of induced jobs, which result from an increase in household income stemming from the increased industry generated activity—i.e. new job opportunities are created and income levels rise. Induced industry activity occurs in fields such as health care, retail, education, recreation, government, and construction. 4.1 Steel and Steel‐Related CommoditiesSteel is the most widely used metal on earth—and the U.S. is the world’s third largest steel producer.3,4 From raw materials to final consumer goods, the production and use of steel requires transportation at every stage, making Class I railroads a vital component of the steel commodity flow process.5 The steel commodity flow process is as follows:
Transportation of raw inputs including iron ore, fluxing stone or lime, bentonite, coke produced from coal, and iron and steel scrap to steel mills for initial sorting and processing.
Steel mills produce intermediate steel and steel‐related commodities such as pig iron, steel wire, steel ingots, billets and slabs, construction shapes, and steel sheets and plates.
Steel mill products are transported to foundries and rolling mills for further refinement, forming and shaping, producing steel castings, or manufacturing materials.
The refined steel and steel‐related commodities are moved to metal forming or stamping plants where final consumer and industrial goods such as motor vehicles, machinery, and household appliances are manufactured.
Final goods, such as motor vehicles, machinery, and household appliances are then transported to end users.6
Transportation is an essential component of the process, allowing for movement between various intermediate inputs to final products. At each phase of processing, Class I railroads keep the flow of steel and steel‐related commodities moving.
3 “Getting to Know the World’s Most Important Industrial Metals,” Six Sigma Online, accessed August 20, 2016, http://www.sixsigmaonline.org/six‐sigma‐training‐certification‐information/getting‐to‐know‐the‐most‐important‐industrial‐metals/. 4 John W. Miller, “The Future of Made‐In‐America Steel,” The Wall Street Journal (June 20, 2013): accessed July 5, 2016, http://blogs.wsj.com/corporate‐intelligence/2013/06/20/american‐steel‐looks‐ahead/. 5 Ibid. 6 Association of American Railroads, “Commodity Flow ‐ Steel,” email correspondence, August 19, 2016.

Commodity Flow Analysis RESI of Towson University
10
Figure 4 depicts a simplified example of the steel commodity flow process described above (i.e. the transition between stages of production leading up to final products for consumers). Though certainly not inclusive of all inputs necessary in the steel production process, this simplified model illustrates the major components needed to produce consumer goods containing steel.

Commodity Flow Analysis RESI of Towson University
11
Figure 4: Steel and Steel‐Related Commodity Flow Process
Sources: AAR, Piktochart, RESI

Commodity Flow Analysis RESI of Towson University
12
In 2014, nearly $9.6 billion was spent to ship steel and steel‐related commodities via Class I railroads. The direct, indirect, induced, and total economic impacts can be found in Figure 5.
Figure 5: Economic Impacts of the Transportation of Steel and Steel‐Related Commodities, 2014 (Wages and Output Figures in Millions)
Impact Type Direct Indirect Induced Total
Jobs 24,535 28,403 44,469 97,408Wages7 $2,892.3 $2,006.7 $2,216.2 $7,115.1Output $9,590.0 $6,690.1 $7,139.8 $23,419.9
Sources: IMPLAN, RESI The analysis found that Class I railroad transportation of steel and steel‐related commodities has a significant effect on the nation’s economy, impacting many industries and occupations. According to RESI’s analysis, in 2014, the transportation of these commodities by Class I railroads supported more than 97,000 jobs, $7.1 billion in wages, and approximately $23.4 billion in output. In addition to the economic impacts, RESI calculated the fiscal impacts of Class I railroad transportation of steel and steel‐related commodities. The tax revenue impacts can be found in Figure 6. Figure 6: Fiscal Impacts of the Transportation of Steel and Steel‐Related Commodities, 2014 (Figures in Millions)
Tax Type Direct Indirect Induced Total
Federal $752.3 $465.2 $551.3 $1,768.8State and local $112.2 $261.7 $364.1 $734.0
Total $864.5 $726.9 $915.4 $2,506.8
Sources: IMPLAN, RESI As detailed in Figure 6, in 2014, the transportation of steel and steel‐related commodities by Class I railroads generated approximately $2.5 billion in tax revenues—with tax revenues primarily generated at the federal level. Federal taxes include excise taxes and custom duties. State and local taxes in the analysis mainly include sales and property taxes, as well as dividends and other taxes (such as motor vehicle taxes). Personal income taxes, social insurance taxes, and corporate profits are included at the state and local level, as well as at the federal level.
7 IMPLAN Online reports wage impacts as labor income (employee compensation and proprietor income).

Commodity Flow Analysis RESI of Towson University
13
4.2 Power Generation and Distribution CommoditiesPower generation and distribution commodities, such as coal, are some of the most essential products transported by Class I railroads. Coal is an important component of electricity generation, with coal responsible for approximately 39 percent of net U.S. electricity generation in 2014.8 The coal commodity flow process is as follows:
Coal is extracted from the ground using either surface mining or underground mining techniques.
Coal is processed near the mining site to prepare it for use after shipment.
Coal is transported, predominately via railroads, to sites where it can be used.
Upon arrival at power plants, coal is burned to heat water which creates steam to power turbines that generate electricity.
This electricity is then distributed to residential, commercial, and industrial customers.9 Transportation is an essential component of the process, as the sites that process and utilize coal for energy production are often significant distances away from mining sites. While all major surface transportation modes carry large amounts of coal, rail transports the bulk of domestic coal. According to the Energy Information Administration, approximately 69 percent of U.S. coal shipments were delivered to their final destinations by rail in 2014, followed by water (12.7 percent, mainly barges on inland waterways); truck (11.1 percent); and conveyor belts, tramways, and slurry pipeline (7.5 percent).10 Railroads not only transport the necessary coal for electricity generation, but also the components used during the power generation and distribution process, such as electrical transformers and distribution equipment. Figure 7 depicts a simplified example of the coal commodity flow process described above (i.e. the transition between stages of production leading up to electricity for end users). Though certainly not inclusive of all inputs necessary in the coal commodity flow process, this simplified model illustrates the major steps from the coal mine to final end users.
8 “Electric Power Monthly with Data for December 2014,” U.S. Energy Information Administration, 12, accessed September 8, 2016, http://www.eia.gov/electricity/monthly/current_year/february2015.pdf. 9 “End‐Users of Electricity,” U.S. Environmental Protection Agency, accessed September 6, 2016, https://www.epa.gov/energy/end‐users‐electricity. 10 “Annual Coal Distribution Report,” U.S. Energy Information Administration, April 8, 2016, accessed September 8, 2016, http://www.eia.gov/coal/distribution/annual/.

Commodity Flow Analysis RESI of Towson University
14
Figure 7: Coal Commodity Flow Process
Sources: AAR, Piktochart, RESI In addition to coal, other major components of energy generation, such as wind turbines, are also transported by rail. In 2014, wind power was the third‐largest source of newly installed generating capacity in the U.S.11 Freight railroads are uniquely suited to meet the growing demands of the wind energy industry. Freight trains can easily carry long, heavy parts over vast distances, making rail the optimal mode for transporting wind turbines—which can weigh 335 tons and have blades the length of a commercial airplane.12 The wind power commodity flow process is as follows:
Manufacturers produce wind turbine components.13
Wind turbine equipment is transported, usually via rail, to and from ports and between U.S. manufacturing and installation locations such as wind farms.14
Wind farms function like a wind power plant. Wind turbines are connected to the power grid, allowing the electricity to travel directly to the grid, which transports power to end users.15
11 “2014 Wind Technologies Market Report Highlights,” U.S. Department of Energy: Energy Efficiency & Renewable Energy, accessed September 8, 2016, http://energy.gov/sites/prod/files/2015/08/f25/2014WindTechnologiesMarketReportHighlights8‐11.pdf. 12 ”Delivering Wind Energy to America,” Freight Rail Works, 4‐7, accessed September 12, 2016, http://archive.freightrailworks.org/wp‐content/uploads/wind.pdf. 13 Ibid, 2. 14 Ibid. 15 “Wind 101: The Basics of Wind Energy,” American Wind Energy Association, accessed September 8, 2016, http://www.awea.org/Resources/Content.aspx?ItemNumber=900.

Commodity Flow Analysis RESI of Towson University
15
Wind power end users can include residential, commercial and industrial customers.16 Figure 8 depicts a simplified example of the wind power commodity flow process described above (i.e. the transition between stages of production leading up to electricity for consumer use). Though certainly not inclusive of all inputs necessary in the wind power commodity flow process, this simplified model illustrates the major steps from manufacturing wind turbines to end users. Figure 8: Wind Turbine Commodity Flow Process
Sources: AAR, Piktochart, RESI In 2014, nearly $14.2 billion was spent to ship coal, wind turbines, and power distribution equipment via Class I railroads. The direct, indirect, induced, and total economic impacts resulting from rail transportation of power generation and distribution commodities (including energy commodities such as coal and wind turbines) can be found in Figure 9.
16 “Distributed Wind,” U.S. Department of Energy: Office of Energy Efficiency & Renewable Energy, accessed September 8, 2016, http://energy.gov/eere/wind/distributed‐wind.

Commodity Flow Analysis RESI of Towson University
16
Figure 9: Economic Impacts of the Transportation of Power Generation and Distribution Commodities, 2014 (Wages and Output Figures in Millions)
Impact Type Direct Indirect Induced Total
Jobs 36,237 41,950 65,679 143,866 Wages17 $4,271.7 $2,963.8 $3,273.2 $10,508.7 Output $14,163.9 $9,880.9 $10,545.0 $34,589.8
Sources: IMPLAN, RESI The analysis found that Class I railroad transportation of coal, wind turbines, and power distribution equipment has a significant effect on the nation’s economy, impacting many industries and occupations. According to RESI’s analysis, in 2014, the transportation of coal, wind turbines, and power distribution equipment by Class I railroads supported nearly 144,000 jobs, over $10.5 billion in wages, and approximately $34.6 billion in output. In addition to the economic impacts, RESI calculated the fiscal impacts of the Class I railroad transportation of coal, wind turbines, and power distribution equipment. The tax revenue impacts can be found in Figure 10. Figure 10: Fiscal Impacts of Power Generation and Distribution Commodities, 2014 (Figures in Millions)
Tax Type Direct Indirect Induced Total
Federal $1,111.8 $687.1 $814.3 $2,613.2 State and local $165.6 $386.5 $537.8 $1,090.0
Total $1,277.5 $1,073.6 $1,352.1 $3,703.1
Sources: IMPLAN, RESI As detailed in Figure 10, in 2014, the transportation of coal, wind turbines, and power distribution equipment via Class I railroads generated approximately $3.7 billion in tax revenues—with tax revenues primarily generated at the federal level. Federal taxes include excise taxes and custom duties. State and local taxes in the analysis mainly include sales and property taxes, as well as dividends and other taxes (such as motor vehicle taxes). Personal income taxes, social insurance taxes, and corporate profits are included at the state and local level, as well as at the federal level. 4.3 Drilling‐Related and Crude Oil CommoditiesThe U.S. is the third‐largest producer of crude oil in the world and the number one consumer of petroleum products (derived from crude oil).18 During 2014, the U.S. consumed approximately 17 IMPLAN Online reports wage impacts as labor income (employee compensation and proprietor income). 18 “Oil: Crude and Petroleum Products Explained, Oil Imports and Exports,” U.S. Energy Information Administration, accessed September 7, 2016, http://www.eia.gov/energyexplained/index.cfm?page=oil_imports.

Commodity Flow Analysis RESI of Towson University
17
19 million barrels of petroleum products per day, with petroleum comprising 35 percent of total energy consumption in the country.19 From raw inputs to final consumer goods, the production and use of these commodities requires transportation at every stage, making Class I railroads a vital component of this commodity flow process. The drilling‐related commodities and crude oil commodity flow process can be summarized as follows:
Steel pipes, as well as raw inputs such as industrial sand and crude barite (collectively known in this report as “drilling‐related commodities”), are transported from mines or other suppliers to oil exploration and production companies.20
These materials are then utilized by oil exploration and production companies to aid in the extraction of crude oil—most recently, this involves a process known as hydraulic fracturing/horizontal drilling.21,22
Industrial sand is used as a component of the fracturing fluid used in pressurized drilling, accounting for approximately 9.5 percent of the fluid mixture.23
Barite is commonly used as a weighting agent and is also referred to as drilling mud (which acts as a lubricant during the process of drilling an oil well).24,25
Steel pipes are used at drilling sites to act as a barrier between the oil extraction process and surrounding environmental resources (including rock or earth formations), and to guide oil to the surface.26
Crude oil is extracted from the well and transferred to a collection tank or well reservoir by a gathering pipeline or by truck. At this point, crude oil is transferred to a specially designed crude oil rail tank car for transportation to a refinery.27
At the refinery, crude oil is processed into commercial petroleum products.28 These products can be used to power an electric generator, to heat buildings, and to produce
19 “Oil: Crude and Petroleum Products Explained, Use of Oil,” U.S. Energy Information Administration, accessed September 7, 2016, http://www.eia.gov/energyexplained/index.cfm?page=oil_use. 20 The World Bank, “The Petroleum Sector Value Chain,” 7, accessed September 21, 2016, http://siteresources.worldbank.org/INTOGMC/Resources/noc_chapter_1.pdf. 21 American Petroleum Institute, “Hydraulic Fracturing‐Unlocking America’s Natural Gas Resources,” 7, accessed September 14, 2016, http://www.api.org/~/media/files/policy/exploration/hydraulic_fracturing_primer.ashx. 22 U.S. Department of Energy, “How is Shale Gas Produced?” 2, accessed September 14, 2016, http://energy.gov/sites/prod/files/2013/04/f0/how_is_shale_gas_produced.pdf. 23 Ibid. 24 “Barite,” Geology.com‐Geoscience News and Information, accessed September 14, 2016, http://geology.com/minerals/barite.shtml. 25 According to Geology.com, 99 percent of barite that is consumed in the U.S. is used for drilling mud. 26 American Petroleum Institute, “Hydraulic Fracturing‐Unlocking America’s Natural Gas Resources,” 7. 27 The World Bank, “The Petroleum Sector Value Chain,” 16. 28 “Oil: Crude and Petroleum Products Explained, Basics,” U.S. Energy Information Administration, accessed September 7, 2016, http://www.eia.gov/energyexplained/index.cfm?page=oil_home.

Commodity Flow Analysis RESI of Towson University
18
liquefied petroleum gases, coke, diesel fuel, jet fuel, gasoline, and lubricating oil.29 Petroleum products or their derivatives are found in everyday items such as detergents, fertilizers, synthetic fibers (e.g., nylon and polyester), adhesive bandages, pens, and plastic bottles.30 They are also used for manufacturing industrial products such as aluminum.31
Petroleum products are used by residential (i.e. individuals), industrial, and commercial customers.
Given the limited capacity of existing pipeline networks in many new oil production locations, rail transportation can be an essential component of this commodity flow process. Railroads have the ability to transfer raw and intermediate inputs to final production sites. At each phase of processing, Class I railroads keep the flow of these materials moving safely and efficiently. Figure 11 depicts a simplified example of the drilling‐related commodities and crude oil commodity flow process described above (i.e. the transition between stages of production leading up to final products for consumers). Though certainly not inclusive of all inputs necessary, this simplified model illustrates the major components needed to produce petroleum products derived from crude oil.
29 “Oil: Crude and Petroleum Products Explained, Use of Oil,” U.S. Energy Information Administration. 30 “Petroleum Products,” American Association of Petroleum Geologists, accessed September 15, 2016, http://www.aapg.org/about/petroleum‐geology/petroleum‐technology/petroleum‐products#4129437‐about. 31 “Energy Needed to Produce Aluminum,” U.S. Energy Information Administration, accessed September 21, 2016, http://www.eia.gov/todayinenergy/detail.cfm?id=7570.

Commodity Flow Analysis RESI of Towson University
19
Figure 11: Drilling‐Related and Crude Oil Commodity Flow Process32
Sources: AAR, Piktochart, RESI In 2014, nearly $5.8 billion was spent to ship these commodities via Class I railroads. The direct, indirect, induced, and total economic impacts are summarized in Figure 12.
Figure 12: Economic Impacts of the Transportation of Drilling‐Related and Crude Oil Commodities, 2014 (Wages and Output Figures in Millions)
Impact Type Direct Indirect Induced Total
Jobs 14,815 17,150 26,851 58,816Wages33 $1,746.4 $1,211.7 $1,338.2 $4,296.2 Output $5,790.6 $4,039.6 $4,311.1 $14,141.3
Sources: IMPLAN, RESI The analysis found that Class I railroad transportation of drilling‐related commodities and crude oil has a significant effect on the nation’s economy, impacting many industries and occupations. According to RESI’s analysis, in 2014, the transportation of these commodities by Class I
32 Petroleum products include items such as fuel, detergents, fertilizers, synthetic fibers (e.g., nylon and polyester), adhesive bandages, pens, and plastic bottle, among other things. 33 IMPLAN Online reports wage impacts as labor income (employee compensation and proprietor income).

Commodity Flow Analysis RESI of Towson University
20
railroads supported nearly 59,000 jobs, almost $4.3 billion in wages, and approximately $14.1 billion in output. In addition to the economic impacts, RESI calculated the fiscal impacts of Class I railroad transportation of these materials. The tax revenue impacts can be found in Figure 13. Figure 13: Fiscal Impacts of the Transportation of Drilling‐Related and Crude Oil Commodities, 2014 (Figures in Millions)
Tax Type Direct Indirect Induced Total
Federal $454.5 $280.9 $332.9 $1,068.3 State and local $67.7 $158.0 $219.9 $445.6
Total $522.3 $438.9 $552.8 $1,513.9
Sources: IMPLAN, RESI As detailed in Figure 13, in 2014, the transportation of drilling‐related commodities and crude oil by Class I railroads generated over $1.5 billion in tax revenues—with tax revenues primarily generated at the federal level. Federal taxes include excise taxes and custom duties. State and local taxes in the analysis mainly include sales and property taxes, as well as dividends and other taxes (such as motor vehicle taxes). Personal income taxes, social insurance taxes, and corporate profits are included at the state and local level, as well as at the federal level. 4.4 Agricultural ProductsApproximately 25 percent of chemical products shipped in the U.S. are shipped via rail (a substantial portion of which are fertilizers).34 Meanwhile, nearly a quarter of grain shipments are transported via rail.35 Combined, these products comprise a significant amount of total railroad transportation tonnage. In 2015, rail accounted for 20 percent of total chemical tonnage shipped in the U.S.—encompassing 10.3 percent of total originated tonnage.36 Approximately half of all chemical rail tonnage consisted of various industrial and agricultural related chemicals including ethanol, urea, potassium/crude potash, and ammonium compounds.37 Of total rail chemical tonnage, about 9 percent can be attributed to fertilizers.38,39
34 “Safety,” American Chemistry Council, accessed September 21, 2016, https://www.americanchemistry.com/Safety/TransportationSafety/. 35 U.S. Department of Agriculture, “Grain Transportation Report,” 5, September 15, 2016, accessed September 21, 2016, https://www.ams.usda.gov/sites/default/files/media/GTR%2009‐15‐16.pdf. 36 Association of American Railroads, “Railroads and Chemicals,” 2, accessed September 19, 2016, https://www.aar.org/BackgroundPapers/Railroads%20and%20Chemicals.pdf. 37 Ibid, 3. 38 Ibid. 39 According to the Fertilizer Institute, fertilizers provide nutrients to increase the fertility of soil, and therefore its capability to produce abundant crops.
Commodity Flow Analysis RESI of Towson University
21
Grain encompasses a large portion of carloads, tonnage, and revenue for Class I railroads. In 2015, grain shipments accounted for 4.9 percent of total carloads (1.44 million carloads), 8.1 percent of total tonnage (139.4 million tons), and generated 7.5 percent of total revenue ($5.3 billion).40 Grain‐related food products accounted for an additional 4 percent of total rail tonnage and revenue; grain‐related food products consist of items such as animal feed, corn syrup, flour, and soybean oil.41 From raw materials to final consumer goods, the production of agricultural products requires transportation at every stage, making Class I railroads a vital component of the commodity flow process. The commodity flow process for agricultural products is as follows:
Raw materials such as crude potash, phosphate rock, and crude sulfur are transported from mines to fertilizer manufacturers and processors.
Fertilizer manufacturers process these raw materials to produce fertilizer and fertilizer compounds, which are then transported, often via railroads, to fertilizer distributors and to ports for export. Fertilizer compounds include urea, potassium, anhydrous ammonia, ammonium nitrate and phosphorus.
Fertilizer distributors supply fertilizers to farmers who use it in the production of crops such as grains, vegetables, and fruits.
Grains such as corn, wheat, barley, oats, rice, rye, sorghum, and soybeans are transported, via railroads, from grain elevators to grain and flour mills, oilseed crushing plants, ethanol production plants, cereal manufacturers, breweries, and livestock feed lots for further processing.
After processing, intermediate products including flour and corn meal, beer, malt, corn syrup, and meat are transported to a diverse group of commodity users including bakeries and frozen food manufacturers, food processing companies, beverage manufacturers, and gasoline and diesel fuel suppliers to provide final consumer goods.42
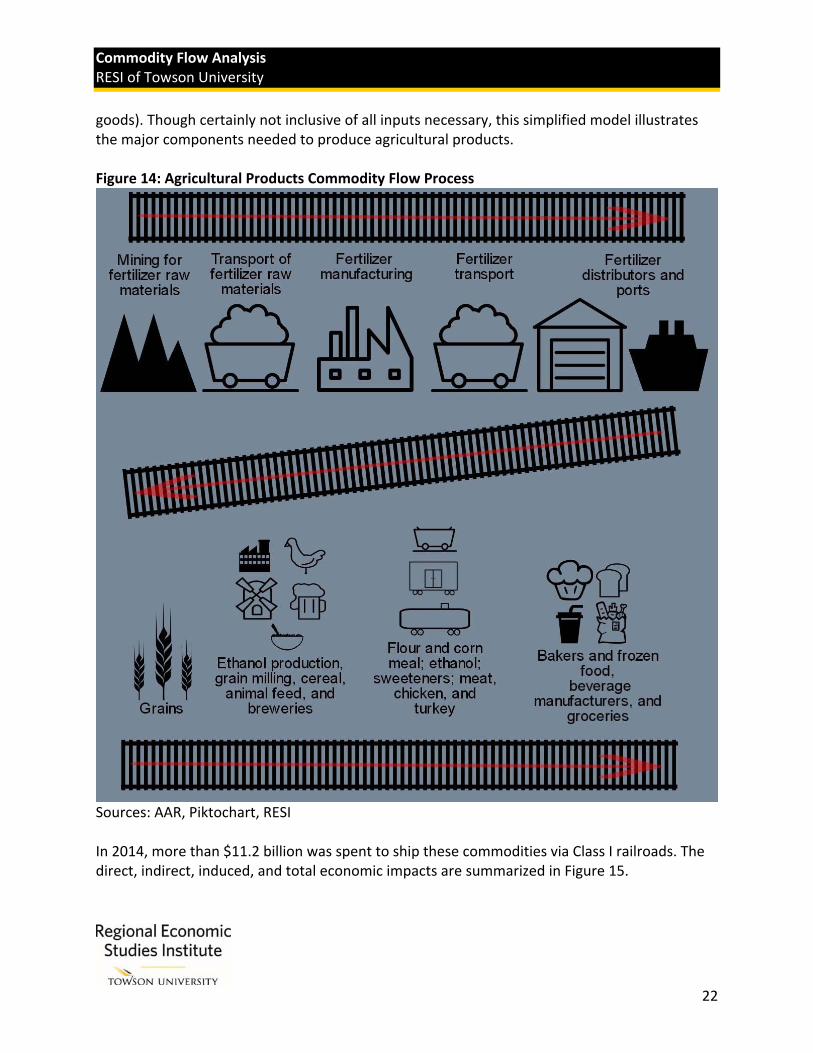
Transportation is an essential component of the process, moving raw materials, intermediate products, and final goods to the marketplace. At each phase of processing, Class I railroads keep the flow of agricultural products moving. Figure 14 depicts a simplified example of the agricultural products commodity flow process described above (i.e. the transition between stages of production leading up to final consumer
40 Association of American Railroads, “Railroads and Grain,” 4, accessed September 19, 2016, https://www.aar.org/BackgroundPapers/Railroads%20and%20Grain.pdf. 41 Ibid, 4. 42 Association of American Railroads, “Commodity Flow Housing Chems Agr Energy,” email correspondence, August 30, 2016.
Commodity Flow Analysis RESI of Towson University
22
goods). Though certainly not inclusive of all inputs necessary, this simplified model illustrates the major components needed to produce agricultural products. Figure 14: Agricultural Products Commodity Flow Process
Sources: AAR, Piktochart, RESI In 2014, more than $11.2 billion was spent to ship these commodities via Class I railroads. The direct, indirect, induced, and total economic impacts are summarized in Figure 15.

Commodity Flow Analysis RESI of Towson University
23
Figure 15: Economic Impacts of the Transportation of Agricultural Products, 2014 (Wages and Output Figures in Millions)
Impact Type Direct Indirect Induced Total
Jobs 28,716 33,243 52,047 114,005Wages43 $3,385.1 $2,348.6 $2,593.8 $8,327.5Output $11,224.1 $7,830.0 $8,356.3 $27,410.4
Sources: IMPLAN, RESI The analysis found that Class I railroad transportation of agricultural products has a significant effect on the nation’s economy, impacting many industries and occupations. According to RESI’s analysis, in 2014, the transportation of these commodities by Class I railroads supported more than 114,000 jobs, more than $8.3 billion in wages, and approximately $27.4 billion in output. In addition to the economic impacts, RESI calculated the fiscal impacts of Class I railroad transportation of these commodities. The tax revenue impacts can be found in Figure 16. Figure 16: Fiscal Impacts of the Transportation of Agricultural Products, 2014 (Figures in Millions)
Tax Type Direct Indirect Induced Total
Federal $881.1 $544.5 $645.3 $2,070.8State and local $131.3 $306.3 $426.2 $863.7
Total $1,012.3 $850.8 $1,071.4 $2,934.5
Sources: IMPLAN, RESI As detailed in Figure 16, in 2014, the transportation of agricultural products by Class I railroads generated approximately $2.9 billion in tax revenues—with tax revenues primarily generated at the federal level. Federal taxes include excise taxes and custom duties. State and local taxes in the analysis mainly include sales and property taxes, as well as dividends and other taxes such as motor vehicle taxes. Personal income taxes, social insurance taxes, and corporate profits are included at the state and local level, as well as at the federal level. 4.5 Building Construction CommoditiesThe construction industry plays a critical role in the national economy, employing more than 6.6 million people as of August 2016, and adding approximately 4 percent to the national GDP.44,45
43 IMPLAN Online reports wage impacts as labor income (employee compensation and proprietor income). 44 Bureau of Labor Statistics, “Current Employment Statistics Survey,” accessed October 3, 2016, http://data.bls.gov/cgi‐bin/dsrv. 45 Bureau of Economic Analysis, “Gross Domestic Product by Industry Data,” accessed October 3, 2016, http://www.bea.gov/industry/gdpbyind_data.htm.

Commodity Flow Analysis RESI of Towson University
24
In a typical year, U.S. freight rail transports about 1.5 million carloads of building materials including wood products, construction steel, cement, and stone.46 In 2014 alone, approximately 340,000 carloads of lumber and wood products, 195,000 carloads of cement, and 775,000 carloads of stone were transported by rail.47 Additionally, railroads transported 51.7 million tons of steel from mills to manufacturers and distributors.48 Approximately 20 percent of transported steel was utilized in residential and commercial or industrial construction.49 Residential and commercial construction require a variety of building materials including steel, stone, non‐metallic minerals, wood products, and plastics. At the end of the residential construction process, a newly built dwelling is filled with durable consumer goods such as household appliances. From raw inputs to finished materials and durable consumer goods, building construction requires transportation at every stage, making Class I railroads a vital component of this commodity flow process. This commodity flow process can be summarized as follows:
Steel: Structural steel is transported from rolling mills to a distributor. This steel is used to construct frames to support buildings and as reinforcement rods for the concrete in building foundations.
Stone: Raw materials—crushed stone, limestone, sand, gravel, and gypsum—are transported from quarries or suppliers to cement and ready mix concrete plants where cement and clay products materials (such as brick and tile, concrete, wallboard, and plaster) are produced. These materials are then transported to construction distribution centers and construction sites. Each of these raw materials serve an essential function in the construction process. Construction sand, aggregates, and cement are used in building foundations. Gypsum is used for wallboard production, plaster, and sealants. Clay‐base ceramic tile is used in floors and walls.
Roofing Materials: Raw materials, such as roofing granules and asphalt, are transported from mines and refineries to asphalt roofing and shingle manufacturers for processing. Once processed, these products are used in the construction of roofs.
Wood Products: Materials such as lumber, millwork, veneer, and plywood are transported to manufacturers of paneling, furniture, trim, molding, flooring, and to distributors of building materials. These materials are used to create walls, doors, floors, roofs, exterior fencing, landscaping, and porches.
46 “What We Haul – Construction Materials,” Association of American Railroads, accessed September 26, 2016, https://www.aar.org/todays‐railroads/what‐we‐haul. 47 “Four Rail Cars. Loads of Possibilities,” Freight Rail Works, accessed September 26, 2016, http://freightrailworks.org/four‐rail‐cars‐loads‐of‐possibilities/. 48 Ibid. 49 Ibid.
Commodity Flow Analysis RESI of Towson University
25
Chemicals: Chemicals used to produce plastics are transported to chemical plants where polyvinyl chloride (PVC) is manufactured. These chemicals are then transported to PVC pipe and siding manufacturers. PVC and other plastics are used in the production of household appliances and hundreds of building construction‐related everyday items. Plumbing is one of the most common uses of PVC pipe. Chemical plants also produce glycol, which is then transported to carpet manufacturing facilities.
Durable Consumer Goods: Finished household products such as appliances and furniture are transported from manufacturers to appliance distributors.50
In each commodity group, products are transported from manufacturers and distributors for use in residential and commercial building construction. Railroads have the ability to efficiently transfer these sizable, and often heavy, raw and intermediate materials from different locations to manufacturers, distributors, and construction job sites. At each phase of processing, Class I railroads keep the flow of these materials moving safely and efficiently. Figure 17 depicts a simplified example of the building construction commodity flow process described above (i.e. the transition between raw or intermediate products leading to a final consumer product). Though certainly not inclusive of all inputs necessary, this simplified model illustrates the major components needed in building construction.
50 Association of American Railroads, “Commodity Flow Housing Chems Agr Energy.”

Commodity Flow Analysis RESI of Towson University
26
Figure 17: Building Construction Commodity Flow Process
Sources: AAR, Piktochart, RESI

Commodity Flow Analysis RESI of Towson University
27
In 2014, nearly $10.1 billion was spent to ship building construction commodities via Class I railroads. The direct, indirect, induced, and total economic impacts are summarized in Figure 18. Figure 18: Economic Impacts of the Transportation of Building Construction Commodities, 2014 (Wages and Output Figures in Millions)
Impact Type Direct Indirect Induced Total
Jobs 25,804 29,872 46,769 102,446Wages51 $3,041.9 $2,110.5 $2,330.8 $7,483.1 Output $10,086.0 $7,036.1 $7,509.0 $24,631.1
Sources: IMPLAN, RESI The analysis found that Class I railroad transportation of building construction commodities has a significant effect on the nation’s economy, impacting many industries and occupations. According to RESI’s analysis, in 2014, the transportation of these commodities by Class I railroads supported more than 102,000 jobs, nearly $7.5 billion in wages, and approximately $24.6 billion in output. In addition to the economic impacts, RESI calculated the fiscal impacts of Class I railroad transportation of these commodities. The tax revenue impacts can be found in Figure 19. Figure 19: Fiscal Impacts of the Transportation of Building Construction Commodities, 2014 (Figures in Millions)
Tax Type Direct Indirect Induced Total
Federal $791.7 $489.3 $579.8 $1,860.8 State and local $118.0 $275.2 $382.9 $776.1
Total $909.7 $764.5 $962.8 $2,637.0
Sources: IMPLAN, RESI As detailed in Figure 19, in 2014, the transportation of building construction commodities via Class I railroads generated approximately $2.6 billion in tax revenues—with tax revenues primarily generated at the federal level. Federal taxes include excise taxes and custom duties. State and local taxes in the analysis mainly include sales and property taxes, as well as dividends and other taxes (such as motor vehicle taxes). Personal income taxes, social insurance taxes, and corporate profits are included at the state and local level, as well as at the federal level.
51IMPLAN Online reports wage impacts as labor income (employee compensation and proprietor income).

Commodity Flow Analysis RESI of Towson University
28
5.0 References American Association of Petroleum Geologists. “Petroleum Products.” Accessed September 15,
2016. http://www.aapg.org/about/petroleum‐geology/petroleum‐technology/petroleum‐products#4129437‐about.
American Chemistry Council. “Safety.” Accessed September 21, 2016.
https://www.americanchemistry.com/Safety/TransportationSafety/. American Petroleum Institute. “Hydraulic Fracturing‐Unlocking America’s Natural Gas
Resources.” July 2014. Accessed September 14, 2016. http://www.api.org/~/media/files/policy/exploration/hydraulic_fracturing_primer.ashx.
American Wind Energy Association. “Wind 101: The Basics of Wind Energy.” Accessed
September 8, 2016. http://www.awea.org/Resources/Content.aspx?ItemNumber=900. Association of American Railroads. “Commodity Flow ‐ Steel.” Email correspondence to RESI.
August 19, 2016. Association of American Railroads. “Commodity Flow Housing Chems Agr Energy.” Email
correspondence to RESI. August 30, 2016. Association of American Railroads. “Railroads and Chemicals.” July 2016. Accessed September
19, 2016. https://www.aar.org/BackgroundPapers/Railroads%20and%20Chemicals.pdf. Association of American Railroads. “Railroads and Grain.” July 2016. Accessed September 19,
2016. https://www.aar.org/BackgroundPapers/Railroads%20and%20Grain.pdf.
Association of American Railroads. “What We Haul – Construction Materials.” Accessed September 26, 2016. https://www.aar.org/todays‐railroads/what‐we‐haul.
Bureau of Economic Analysis. “Gross Domestic Product by Industry Data.” April 21, 2016.
Accessed October 3, 2016. http://www.bea.gov/industry/gdpbyind_data.htm. Bureau of Labor Statistics. “Current Employment Statistics Survey.” Accessed October 3, 2016.
http://data.bls.gov/cgi‐bin/dsrv. Freight Rail Works. ”Delivering Wind Energy to America.” February 2014. Accessed September
12, 2016. http://archive.freightrailworks.org/wp‐content/uploads/wind.pdf.

Commodity Flow Analysis RESI of Towson University
29
Freight Rail Works. “Four Rail Cars. Loads of Possibilities.” Accessed September 26, 2016. http://freightrailworks.org/four‐rail‐cars‐loads‐of‐possibilities/.
Geology.com‐Geoscience News and Information. “Barite.” Accessed September 14, 2016.
http://geology.com/minerals/barite.shtml. Miller, John W. “The Future of Made‐In‐America Steel.” The Wall Street Journal (June 20, 2013).
Accessed July 5, 2016. http://blogs.wsj.com/corporate‐intelligence/2013/06/20/american‐steel‐looks‐ahead/.
Six Sigma Online. “Getting to Know the World’s Most Important Industrial Metals,” Aveta
Business Institute. Accessed August 20, 2016. http://www.sixsigmaonline.org/six‐sigma‐training‐certification‐information/getting‐to‐know‐the‐most‐important‐industrial‐metals/.
U.S. Department of Agriculture. “Grain Transportation Report.” September 15, 2016. Accessed
September 21, 2016. https://www.ams.usda.gov/sites/default/files/media/GTR%2009‐15‐16.pdf.
U.S. Department of Energy. “How is Shale Gas Produced?” Accessed September 14, 2016.
http://energy.gov/sites/prod/files/2013/04/f0/how_is_shale_gas_produced.pdf. U.S. Department of Energy: Energy Efficiency & Renewable Energy. “2014 Wind Technologies
Market Report Highlights.” August 2015. Accessed September 8, 2016. http://energy.gov/sites/prod/files/2015/08/f25/2014WindTechnologiesMarketReportHighlights8‐11.pdf.
U.S. Department of Energy: Office of Energy Efficiency & Renewable Energy. “Distributed
Wind.” Accessed September 8, 2016. http://energy.gov/eere/wind/distributed‐wind. U.S. Energy Information Administration. “Annual Coal Distribution Report.” April 8, 2016.
Accessed September 8, 2016. http://www.eia.gov/coal/distribution/annual/. U.S. Energy Information Administration. “Electric Power Monthly with Data for December
2014.” February 2015. Accessed September 8, 2016. http://www.eia.gov/electricity/monthly/current_year/february2015.pdf.
U.S. Energy Information Administration. “Energy Needed to Produce Aluminum.” August 16,
2012. Accessed September 21, 2016. http://www.eia.gov/todayinenergy/detail.cfm?id=7570.

Commodity Flow Analysis RESI of Towson University
30
U.S. Energy Information Administration, “Oil: Crude and Petroleum Products Explained, Basics.” Accessed September 7, 2016. http://www.eia.gov/energyexplained/index.cfm?page=oil_home.
U.S. Energy Information Administration. “Oil: Crude and Petroleum Products Explained, Oil
Imports and Exports.” Accessed September 7, 2016. http://www.eia.gov/energyexplained/index.cfm?page=oil_imports.
U.S. Energy Information Administration. “Oil: Crude and Petroleum Products Explained, Use of
Oil.” Accessed September 7, 2016. http://www.eia.gov/energyexplained/index.cfm?page=oil_use.
U.S. Environmental Protection Agency. “End‐Users of Electricity.” Accessed September 6, 2016.
https://www.epa.gov/energy/end‐users‐electricity. World Bank, The. “The Petroleum Sector Value Chain.” June 2009. Accessed September 21,
2016. http://siteresources.worldbank.org/INTOGMC/Resources/noc_chapter_1.pdf.

Commodity Flow Analysis RESI of Towson University
31
Appendix A—Detailed Economic Impacts Figure 20: Detailed Jobs Impacts—Steel and Steel‐Related Commodities
Industry Direct Indirect Induced Total
Transportation and Warehousing
24,535 1,849 1,393 27,777
Other Services & Industries52 0 7,998 11,415 19,413Finance and Insurance 0 5,712 3,250 8,962Health Care and Social Services
0 0 8,156 8,157
Professional, Scientific and Technical Services
0 4,068 2,254 6,323
Retail Trade 0 652 5,642 6,295Accommodation and Food Services
0 658 5,267 5,925
Administrative and Support and Waste Management and Remediation Services
0 3,121 2,796 5,916
Manufacturing 0 2,593 2,157 4,751Real Estate and Rental and Leasing
0 1,752 2,140 3,891
Total 24,535 28,403 44,469 97,408
Sources: IMPLAN, RESI
52 Throughout Appendix A, Other Services & Industries includes Wholesale Trade; Arts, Entertainment and Recreation; Construction; Mining; Educational Services; Agriculture; Information; Government; Management of Companies and Enterprises; and Utilities. Many of these industries experienced indirect and/or induced impacts as a results of shipping commodities via Class I railroads.

Commodity Flow Analysis RESI of Towson University
32
Figure 21: Detailed Wage Impacts—Steel and Steel‐Related Commodities (Figures in Millions)
Industry Direct53 Indirect Induced Total
Transportation and Warehousing
$2,892.3 $116.7 $79.7 $3,088.6
Other Services & Industries $0.0 $638.3 $642.0 $1,280.3Finance and Insurance $0.0 $465.5 $247.6 $713.0Health Care and Social Services
$0.0 $0.0 $450.7 $450.7
Professional, Scientific and Technical Services
$0.0 $327.4 $169.1 $496.5
Retail Trade $0.0 $19.8 $190.5 $210.3Accommodation and Food Services
$0.0 $16.1 $124.5 $140.6
Administrative and Support and Waste Management and Remediation Services
$0.0 $112.8 $100.1 $212.9
Manufacturing $0.0 $202.6 $153.9 $356.5Real Estate and Rental and Leasing
$0.0 $107.4 $58.2 $165.6
Total $2,892.3 $2,006.7 $2,216.2 $7,115.1
Sources: IMPLAN, RESI
53 IMPLAN Online reports wage impacts as labor income (employee compensation and proprietor income).

Commodity Flow Analysis RESI of Towson University
33
Figure 22: Detailed Output Impacts—Steel and Steel‐Related Commodities (Figures in Millions)
Industry Direct Indirect Induced Total
Transportation and Warehousing
$9,590.0 $291.4 $226.2 $10,107.6
Other Services & Industries $0.0 $1,948.6 $1,922.6 $3,871.1Finance and Insurance $0.0 $1,036.3 $740.3 $1,776.6Health Care and Social Services
$0.0 $0.0 $784.2 $784.2
Professional, Scientific and Technical Services
$0.0 $550.6 $305.0 $855.5
Retail Trade $0.0 $54.0 $445.5 $499.5Accommodation and Food Services
$0.0 $41.8 $325.5 $367.3
Administrative and Support and Waste Management and Remediation Services
$0.0 $213.3 $182.1 $395.3
Manufacturing $0.0 $2,123.7 $1,219.1 $3,342.8Real Estate and Rental and Leasing
$0.0 $430.4 $989.4 $1,419.9
Total $9,590.0 $6,690.1 $7,139.8 $23,419.9
Sources: IMPLAN, RESI

Commodity Flow Analysis RESI of Towson University
34
Figure 23: Detailed Jobs Impacts—Power Generation and Distribution Commodities
Industry Direct Indirect Induced Total
Transportation and Warehousing
36,237 2,731 2,057 41,025
Other Services & Industries 0 11,813 16,859 28,672Finance and Insurance 0 8,436 4,799 13,236Health Care and Social Services
0 0 12,046 12,047
Professional, Scientific and Technical Services
0 6,008 3,330 9,338
Retail Trade 0 964 8,333 9,297Accommodation and Food Services
0 972 7,779 8,750
Administrative and Support and Waste Management and Remediation Services
0 4,609 4,129 8,738
Manufacturing 0 3,830 3,186 7,016Real Estate and Rental and Leasing
0 2,587 3,160 5,747
Total 36,237 41,950 65,679 143,866
Sources: IMPLAN, RESI

Commodity Flow Analysis RESI of Towson University
35
Figure 24: Detailed Wage Impacts—Power Generation and Distribution Commodities (Figures in Millions)
Industry Direct54 Indirect Induced Total
Transportation and Warehousing
$4,271.7 $172.4 $117.7 $4,561.7
Other Services & Industries $0.0 $942.7 $948.2 $1,891.0Finance and Insurance $0.0 $687.5 $365.7 $1,053.1Health Care and Social Services
$0.0 $0.0 $665.6 $665.7
Professional, Scientific and Technical Services
$0.0 $483.6 $249.7 $733.4
Retail Trade $0.0 $29.3 $281.3 $310.6Accommodation and Food Services
$0.0 $23.8 $183.8 $207.6
Administrative and Support and Waste Management and Remediation Services
$0.0 $166.6 $147.8 $314.5
Manufacturing $0.0 $299.2 $227.3 $526.5Real Estate and Rental and Leasing
$0.0 $158.6 $86.0 $244.6
Total $4,271.7 $2,963.8 $3,273.2 $10,508.7
Sources: IMPLAN, RESI
54 IMPLAN Online reports wage impacts as labor income (employee compensation and proprietor income).
Commodity Flow Analysis RESI of Towson University
36
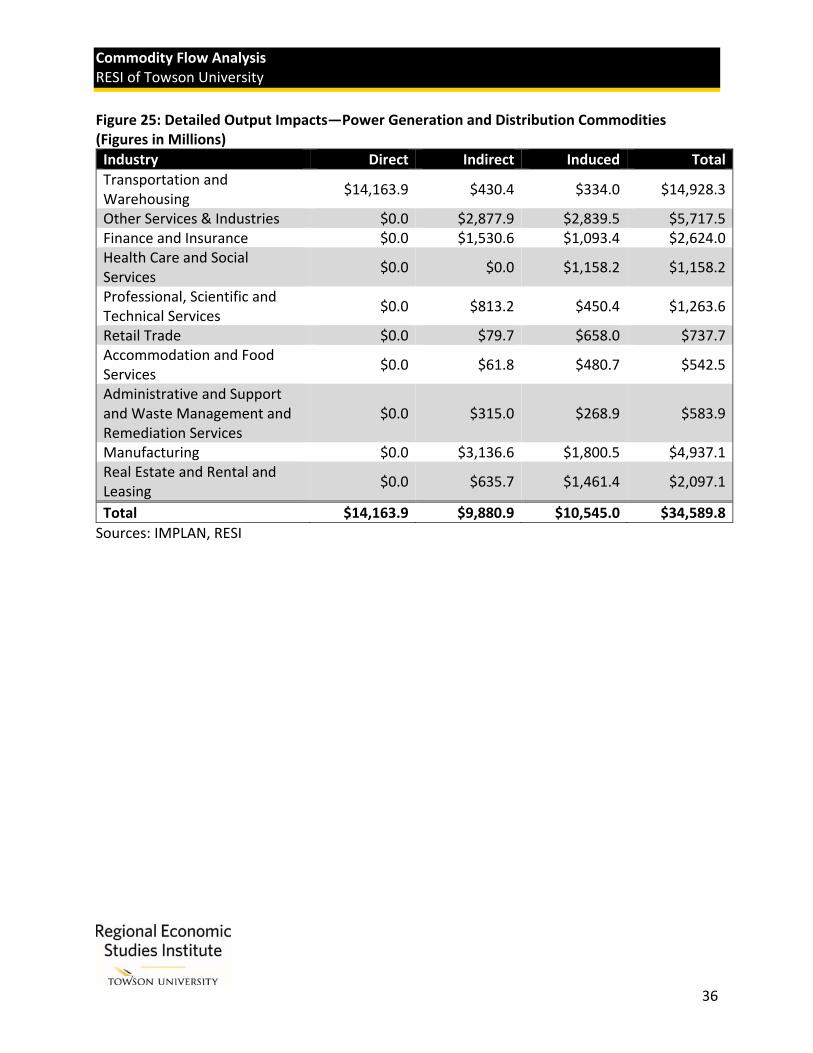
Figure 25: Detailed Output Impacts—Power Generation and Distribution Commodities (Figures in Millions)
Industry Direct Indirect Induced Total
Transportation and Warehousing
$14,163.9 $430.4 $334.0 $14,928.3
Other Services & Industries $0.0 $2,877.9 $2,839.5 $5,717.5Finance and Insurance $0.0 $1,530.6 $1,093.4 $2,624.0Health Care and Social Services
$0.0 $0.0 $1,158.2 $1,158.2
Professional, Scientific and Technical Services
$0.0 $813.2 $450.4 $1,263.6
Retail Trade $0.0 $79.7 $658.0 $737.7Accommodation and Food Services
$0.0 $61.8 $480.7 $542.5
Administrative and Support and Waste Management and Remediation Services
$0.0 $315.0 $268.9 $583.9
Manufacturing $0.0 $3,136.6 $1,800.5 $4,937.1Real Estate and Rental and Leasing
$0.0 $635.7 $1,461.4 $2,097.1
Total $14,163.9 $9,880.9 $10,545.0 $34,589.8
Sources: IMPLAN, RESI

Commodity Flow Analysis RESI of Towson University
37
Figure 26: Detailed Jobs Impacts—Drilling‐Related and Crude Oil Commodities
Industry Direct Indirect Induced Total
Transportation and Warehousing
14,815 1,116 841 16,772
Other Services & Industries 0 4,829 6,892 11,722Finance and Insurance 0 3,449 1,962 5,411Health Care and Social Services
0 0 4,925 4,925
Professional, Scientific and Technical Services
0 2,456 1,361 3,818
Retail Trade 0 394 3,407 3,801Accommodation and Food Services
0 397 3,180 3,577
Administrative and Support and Waste Management and Remediation Services
0 1,884 1,688 3,572
Manufacturing 0 1,566 1,303 2,868Real Estate and Rental and Leasing
0 1,058 1,292 2,350
Total 14,815 17,150 26,851 58,816
Sources: IMPLAN, RESI
Commodity Flow Analysis RESI of Towson University
38
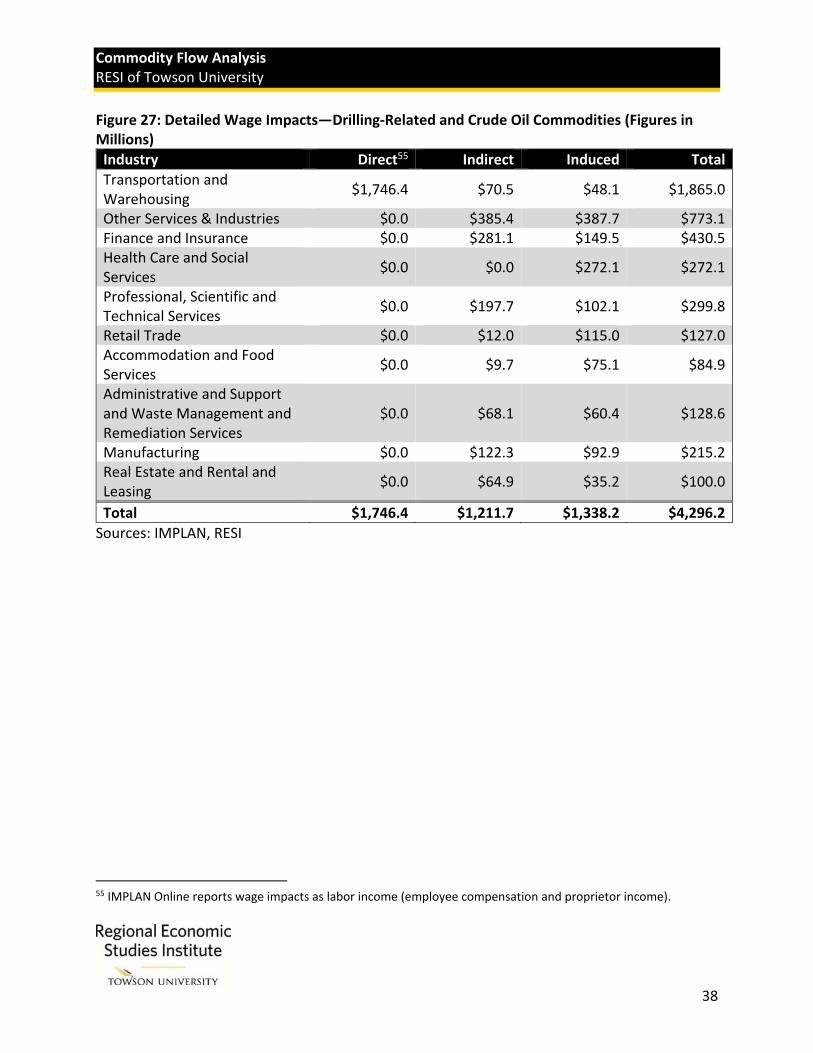
Figure 27: Detailed Wage Impacts—Drilling‐Related and Crude Oil Commodities (Figures in Millions)
Industry Direct55 Indirect Induced Total
Transportation and Warehousing
$1,746.4 $70.5 $48.1 $1,865.0
Other Services & Industries $0.0 $385.4 $387.7 $773.1Finance and Insurance $0.0 $281.1 $149.5 $430.5Health Care and Social Services
$0.0 $0.0 $272.1 $272.1
Professional, Scientific and Technical Services
$0.0 $197.7 $102.1 $299.8
Retail Trade $0.0 $12.0 $115.0 $127.0Accommodation and Food Services
$0.0 $9.7 $75.1 $84.9
Administrative and Support and Waste Management and Remediation Services
$0.0 $68.1 $60.4 $128.6
Manufacturing $0.0 $122.3 $92.9 $215.2Real Estate and Rental and Leasing
$0.0 $64.9 $35.2 $100.0
Total $1,746.4 $1,211.7 $1,338.2 $4,296.2
Sources: IMPLAN, RESI
55 IMPLAN Online reports wage impacts as labor income (employee compensation and proprietor income).

Commodity Flow Analysis RESI of Towson University
39
Figure 28: Detailed Output Impacts—Drilling‐Related and Crude Oil Commodities (Figures in Millions)
Industry Direct Indirect Induced Total
Transportation and Warehousing
$5,790.6 $176.0 $136.6 $6,103.1
Other Services & Industries $0.0 $1,176.6 $1,160.9 $2,337.4Finance and Insurance $0.0 $625.7 $447.0 $1,072.7Health Care and Social Services
$0.0 $0.0 $473.5 $473.5
Professional, Scientific and Technical Services
$0.0 $332.4 $184.1 $516.6
Retail Trade $0.0 $32.6 $269.0 $301.6Accommodation and Food Services
$0.0 $25.2 $196.5 $221.8
Administrative and Support and Waste Management and Remediation Services
$0.0 $128.8 $109.9 $238.7
Manufacturing $0.0 $1,282.3 $736.1 $2,018.4Real Estate and Rental and Leasing
$0.0 $259.9 $597.4 $857.3
Total $5,790.6 $4,039.6 $4,311.1 $14,141.3
Sources: IMPLAN, RESI
Commodity Flow Analysis RESI of Towson University
40
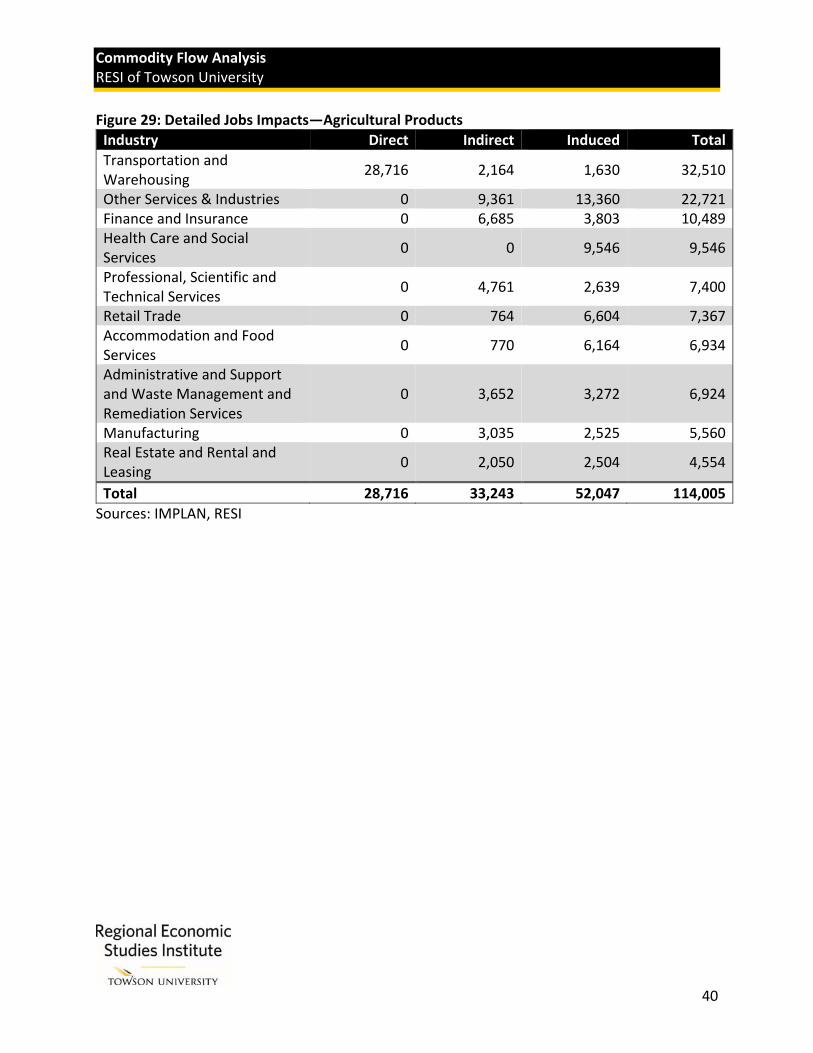
Figure 29: Detailed Jobs Impacts—Agricultural Products
Industry Direct Indirect Induced Total
Transportation and Warehousing
28,716 2,164 1,630 32,510
Other Services & Industries 0 9,361 13,360 22,721Finance and Insurance 0 6,685 3,803 10,489Health Care and Social Services
0 0 9,546 9,546
Professional, Scientific and Technical Services
0 4,761 2,639 7,400
Retail Trade 0 764 6,604 7,367Accommodation and Food Services
0 770 6,164 6,934
Administrative and Support and Waste Management and Remediation Services
0 3,652 3,272 6,924
Manufacturing 0 3,035 2,525 5,560Real Estate and Rental and Leasing
0 2,050 2,504 4,554
Total 28,716 33,243 52,047 114,005
Sources: IMPLAN, RESI

Commodity Flow Analysis RESI of Towson University
41
Figure 30: Detailed Wage Impacts—Agricultural Products (Figures in Millions)
Industry Direct56 Indirect Induced Total
Transportation and Warehousing
$3,385.1 $136.6 $93.2 $3,614.9
Other Services & Industries $0.0 $747.1 $751.4 $1,498.5Finance and Insurance $0.0 $544.8 $289.8 $834.5Health Care and Social Services
$0.0 $0.0 $527.5 $527.5
Professional, Scientific and Technical Services
$0.0 $383.2 $197.9 $581.1
Retail Trade $0.0 $23.2 $223.0 $246.2Accommodation and Food Services
$0.0 $18.9 $145.7 $164.5
Administrative and Support and Waste Management and Remediation Services
$0.0 $132.0 $117.2 $249.2
Manufacturing $0.0 $237.1 $180.1 $417.2Real Estate and Rental and Leasing
$0.0 $125.7 $68.1 $193.8
Total $3,385.1 $2,348.6 $2,593.8 $8,327.5
Sources: IMPLAN, RESI
56 IMPLAN Online reports wage impacts as labor income (employee compensation and proprietor income).

Commodity Flow Analysis RESI of Towson University
42
Figure 31: Detailed Output Impacts—Agricultural Products (Figures in Millions)
Industry Direct Indirect Induced Total
Transportation and Warehousing
$11,224.1 $341.1 $264.7 $11,829.8
Other Services & Industries $0.0 $2,280.6 $2,250.1 $4,530.8Finance and Insurance $0.0 $1,212.9 $866.4 $2,079.3Health Care and Social Services
$0.0 $0.0 $917.8 $917.8
Professional, Scientific and Technical Services
$0.0 $644.4 $356.9 $1,001.3
Retail Trade $0.0 $63.2 $521.4 $584.6Accommodation and Food Services
$0.0 $48.9 $380.9 $429.9
Administrative and Support and Waste Management and Remediation Services
$0.0 $249.6 $213.1 $462.7
Manufacturing $0.0 $2,485.6 $1,426.8 $3,912.4Real Estate and Rental and Leasing
$0.0 $503.8 $1,158.0 $1,661.8
Total $11,224.1 $7,830.0 $8,356.3 $27,410.4
Sources: IMPLAN, RESI

Commodity Flow Analysis RESI of Towson University
43
Figure 32: Detailed Jobs Impacts—Building Construction Commodities
Industry Direct Indirect Induced Total
Transportation and Warehousing
25,804 1,944 1,465 29,213
Other Services & Industries 0 8,412 12,005 20,417Finance and Insurance 0 6,008 3,418 9,425Health Care and Social Services
0 0 8,578 8,578
Professional, Scientific and Technical Services
0 4,279 2,371 6,650
Retail Trade 0 686 5,934 6,620Accommodation and Food Services
0 692 5,539 6,231
Administrative and Support and Waste Management and Remediation Services
0 3,282 2,940 6,222
Manufacturing 0 2,727 2,269 4,996Real Estate and Rental and Leasing
0 1,842 2,250 4,093
Total 25,804 29,872 46,769 102,446
Sources: IMPLAN, RESI

Commodity Flow Analysis RESI of Towson University
44
Figure 33: Detailed Wage Impacts—Building Construction Commodities (Figures in Millions)
Industry Direct57 Indirect Induced Total
Transportation and Warehousing
$3,041.9 $122.7 $83.8 $3,248.4
Other Services & Industries $0.0 $671.3 $675.2 $1,346.5Finance and Insurance $0.0 $489.5 $260.4 $749.9Health Care and Social Services
$0.0 $0.0 $474.0 $474.0
Professional, Scientific and Technical Services
$0.0 $344.4 $177.8 $522.2
Retail Trade $0.0 $20.9 $200.3 $221.2Accommodation and Food Services
$0.0 $16.9 $130.9 $147.8
Administrative and Support and Waste Management and Remediation Services
$0.0 $118.7 $105.3 $223.9
Manufacturing $0.0 $213.1 $161.8 $374.9Real Estate and Rental and Leasing
$0.0 $113.0 $61.2 $174.2
Total $3,041.9 $2,110.5 $2,330.8 $7,483.1
Sources: IMPLAN, RESI
57 IMPLAN Online reports wage impacts as labor income (employee compensation and proprietor income).

Commodity Flow Analysis RESI of Towson University
45
Figure 34: Detailed Output Impacts—Building Construction Commodities (Figures in Millions)
Industry Direct Indirect Induced Total
Transportation and Warehousing
$10,086.0 $306.5 $237.8 $10,630.3
Other Services & Industries $0.0 $2,049.4 $2,022.0 $4,071.3Finance and Insurance $0.0 $1,089.9 $778.6 $1,868.5Health Care and Social Services
$0.0 $0.0 $824.7 $824.8
Professional, Scientific and Technical Services
$0.0 $579.0 $320.7 $899.8
Retail Trade $0.0 $56.8 $468.6 $525.3Accommodation and Food Services
$0.0 $44.0 $342.3 $386.3
Administrative and Support and Waste Management and Remediation Services
$0.0 $224.3 $191.5 $415.8
Manufacturing $0.0 $2,233.6 $1,282.1 $3,515.7Real Estate and Rental and Leasing
$0.0 $452.7 $1,040.6 $1,493.3
Total $10,086.0 $7,036.1 $7,509.0 $24,631.1
Sources: IMPLAN, RESI
END OF DOCUMENT