Committee for the Common Organisation of the Agricultural Markets 11 December 2014.
18
Committee for the Common Organisation of the Agricultural Markets 11 December 2014
-
Upload
zain-foxen -
Category
Documents
-
view
215 -
download
0
Transcript of Committee for the Common Organisation of the Agricultural Markets 11 December 2014.

Committee for the Common Organisation of the Agricultural Markets
11 December 2014
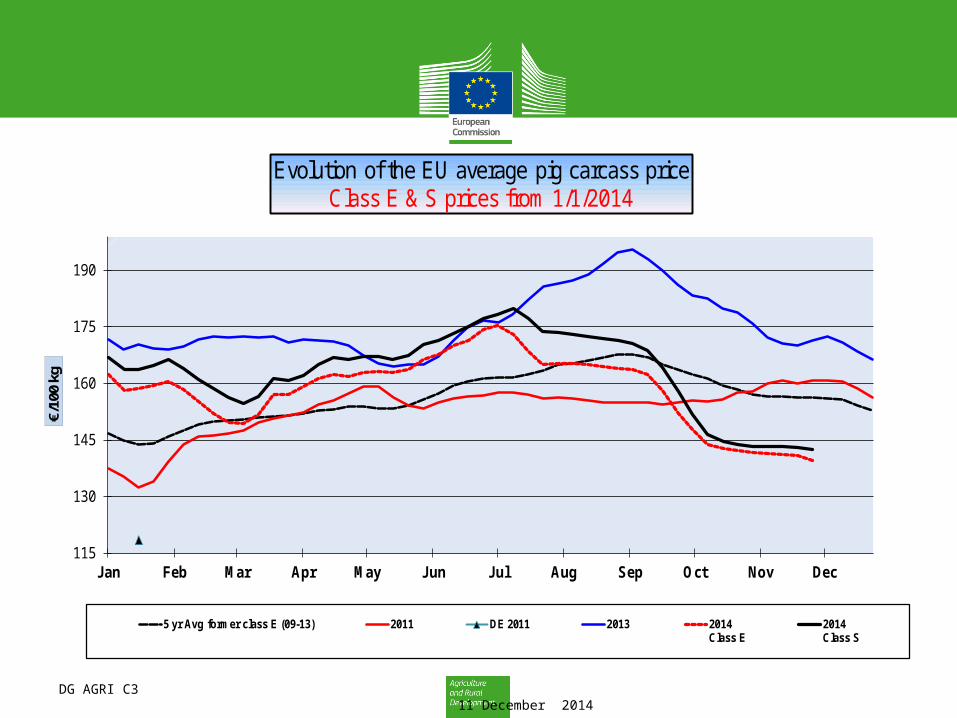
DG AGRI C3 11 December 2014
115
130
145
160
175
190
Jan Feb Mar Apr May Jun Jul Aug Sep Oct Nov Dec
€/1
00 k
g
Evolution of the EU average pig carcass priceClass E & S prices from 1/1/2014
5 yr Avg former class E (09-13) 2011 DE 2011 2013 2014Class E
2014Class S

DG AGRI C3 11 December 2014
30
35
40
45
50
55
Jan Feb Mar Apr May Jun Jul Aug Sep Oct Nov Dec
€/p
iece
Evolution of the EU average piglet prices
5 yr avg (09 - 13) 2013 2014

DG AGRI C3 11 December 2014
115
125
135
145
155
165
175
185
1 6 11 16 21 26 31 36 41 46 51
€/ 1
00
kg
2014 Week nr: 45
Weekly pig price (average class S and E) in FI, EE, LV, LT, HU and PL compared to the EU average
EE LV LT PL HU FI EU 5 yr Avg former class E (09-13)

115
125
135
145
155
165
175
185
1 6 11 16 21 26 31 36 41 46 51
€/ 1
00
kg
2014 Week nr: 45
Weekly pig price (average class S and E) in BE, DE, IE, DK, FR and NL compared to the EU average
BE DE EI DK FR NL EU 5 yr Avg former class E (09-13)
DG AGRI C3 11 December 2014

DG AGRI C3 11 December 2014
2011 2012 2013 2014 2015Q1 2,2% -0,5% -1,6% 0,9% -0,1%
Q2 2,3% -1,6% 0,4% -1,0% 0,0%
Q3 3,1% -5,5% 0,8% 2,7%
Q4 -0,1% -2,8% 1,0% -0,2%
Ann 1,8% -2,6% 0,1% 0,6%
-6,0%
-4,0%
-2,0%
0,0%
2,0%
4,0%
6,0%
perc
en
tual
ch
an
ge
(based
on
nu
mb
er
of
head
s)
Forecast Quarterly Slaughter: Based on realised slaughter included MSs' & Experts' forecast
Last update : 8.12.2014 26 MSs communicated GIP forecast in June

- 40.0%
- 30.0%
- 20.0%
- 10.0%
+ 10%
+ 20%
+ 30%
+ 40%
+ 50%
+ 60%
IT PL EE IE HU SI BG LV PT RO LU LT DE NL ES BE CZ FR DK UK SE CY AT MT FI GR HR SK EU EU(noIT)
Evolution of pig slaughter by MS (in t)
Jan-Sep.13/Jan-Sep.14
Sep.13/Sep.14
EU - Jan-Sep: + 0.9%Sep. 13/14: + 9.9%(data without IT)
DG AGRI C3 11 December 2014

DG AGRI C3 11 December 2014
70
90
110
130
150
170
190
92 93 94 95 96 97 98 99 00 01 02 03 04 05 06 07 08 09 10 11 12 13 14 15
EU average pigcarcase priceEuro/ 100kg
EU avg pig price period of Aid for Private Storage déstockage

DG AGRI C3 11 December 2014
0
50
100
150
200
250
300
0
50
100
150
200
250
300
| 2011 | 2012 | 2013 | 2014 | 2015
€uro
/ T (Cere
al & S
oja
mix
/ Com
pound feed)
Euro
/ 10
0kg ( p
ig carc
ase
)
Development of producer margins (pig price over feed costs)
Margin/ Comp. Feed (4.4 > 3.9)
Carcase price
average Margin 2009 - 2013 (49,92 €/100kg)
Cereals and Soja mix
Compound feed
NB:Comp. Feed 2014 = Forecast as from September.Cereal mix and Pig carcase price: 2014. = expectations as from December 2014.
DG AGRI C3 11 December 2014
55,0
75,0
95,0
115,0
135,0
155,0
175,0
195,0
| 2010 | 2011 | 2012 | 2013 | 2014 | 2015
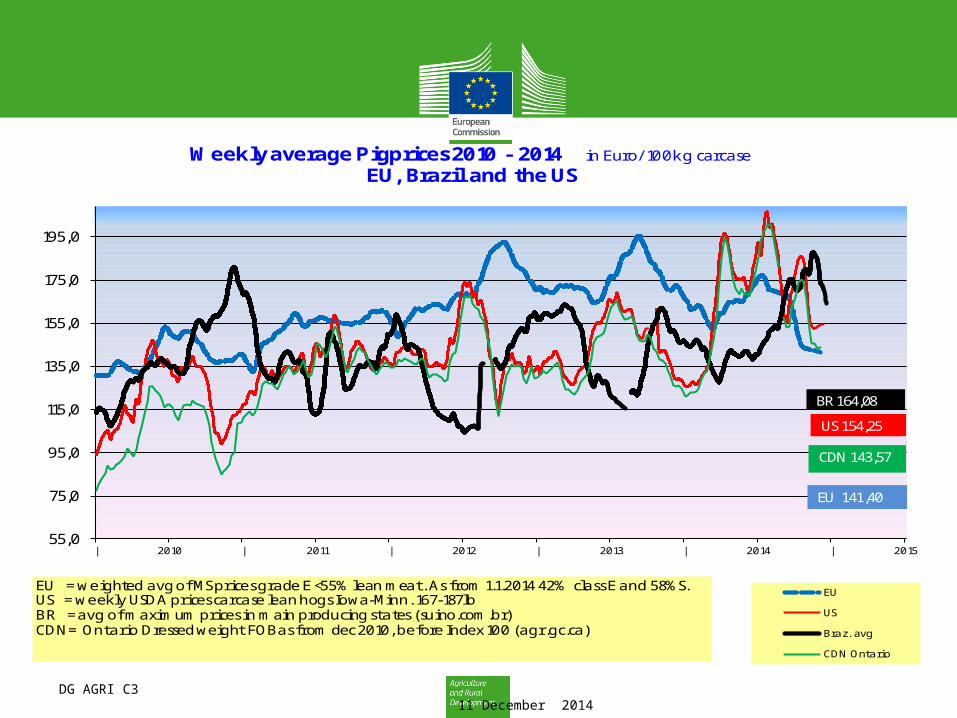
Weekly average Pigprices 2010 - 2014 in Euro/ 100kg carcase
EU, Brazil and the US
EU
US
Braz. avg
CDN Ontario
EU = weighted avg of MS prices grade E <55% lean meat. As from 1.1.2014 42% class E and 58%S.US = weekly USDA prices carcase lean hogs Iowa-Minn. 167-187lbBR = avg of maximum prices in main producing states (suino.com.br)CDN= Ontario Dressed weight FOBas from dec 2010, before Index 100 (agr.gc.ca)
EU 141,40
BR 164,08
US 154,25
CDN 143,57

DG AGRI C3 11 December 2014
50,0
75,0
100,0
125,0
150,0
I 2009 I 2010 I 2011 I 2012 I 2013 I 2014 I 2015 |
Index of monthly exchange rates of the main trading partners compared to the €uro
notification on the 1st of the monthJanuary 2009 = 100
Real US$ Ruble AUS$ CDN$

DG AGRI C3 11 December 2014
EU trade of PIG products4
6.1
35
59
.72
0
71
.93
7
51
.64
1
63
.80
0
55
.91
8
56
.07
7
54
.49
9
72
.27
6
22
.61
2
21
.73
0
32
.36
8
43
.17
9
59
.83
8
51
.78
9
44
.19
1
36
.08
7
37
.11
8
33
.84
5
26
.03
3
88
1.0
11
94
3.4
05
1.0
83
.23
0
1.2
38
.13
8
1.5
56
.96
1
1.5
45
.90
7
1.3
31
.80
8
1.5
26
.56
3
1.5
09
.30
2
1.7
80
.56
8
1.9
38
.45
5
2.0
89
.36
3
1.9
10
.90
8
2.5
69
.08
7
2.3
86
.24
5
2.6
27
.62
1 3.1
33
.57
0
3.0
72
.45
7
3.1
00
.88
4
2.1
20
.51
0
0
250.000
500.000
750.000
1.000.000
1.250.000
1.500.000
1.750.000
2.000.000
2.250.000
2.500.000
2.750.000
3.000.000
3.250.000
3.500.000
3.750.000
4.000.000
1995 1996 1997 1998 1999 2000 2001 2002 2003 2004 2005 2006 2007 2008 2009 2010 2011 2012 2013Jan-Sep 14
To
nn
es
pro
du
ct
we
igh
t
.
IMPORTS EXPORTS
DG AGRI C3 11 December 2014
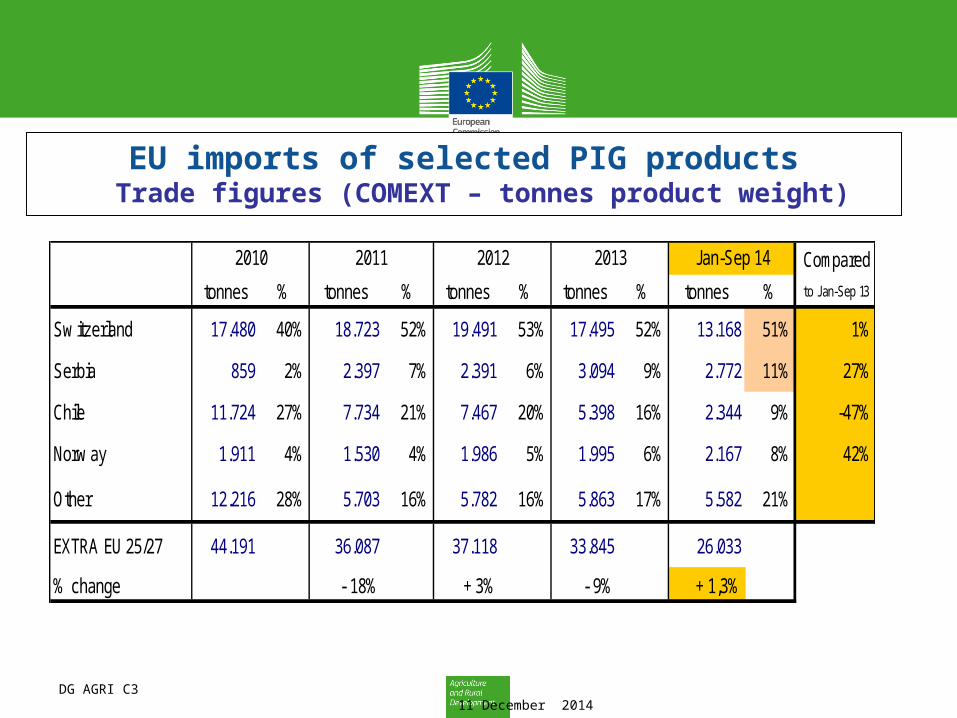
EU imports of selected PIG productsTrade figures (COMEXT – tonnes product weight)
Compared
tonnes % tonnes % tonnes % tonnes % tonnes % to J an-Sep 13
Sw itzerland 17.480 40% 18.723 52% 19.491 53% 17.495 52% 13.168 51% 1%
Serbia 859 2% 2.397 7% 2.391 6% 3.094 9% 2.772 11% 27%
Chile 11.724 27% 7.734 21% 7.467 20% 5.398 16% 2.344 9% -47%
Norw ay 1.911 4% 1.530 4% 1.986 5% 1.995 6% 2.167 8% 42%
Other 12.216 28% 5.703 16% 5.782 16% 5.863 17% 5.582 21%
EXTRA EU 25/27 44.191 36.087 37.118 33.845 26.033
% change - 18% + 3% - 9% + 1,3%
2010 2011 2012 Jan-Sep 142013

DG AGRI C3 11 December 2014
EU imports of selected PIG productsTrade figures (COMEXT – tonnes product weight)
14.962 13.066 13.168
1.8142.189 2.772
4.605
3.998 4.330
28.308
25.707 26.033
0
5.000
10.000
15.000
20.000
25.000
30.000
Jan-Sep 12 Jan-Sep 13 Jan-Sep 14
IMPORTS of PIG Meat into EU-28(Tonnes prod. weight)
Switzerland Serbia Chile Norway Thailand Other origins
13.442 11.232 10.613
1.1921.478 1.693
12.896 11.282 13.249
50.102 48.253 50.088
0
10.000
20.000
30.000
40.000
50.000
60.000
Jan-Sep 12 Jan-Sep 13 Jan-Sep 14
IMPORTS of PIG Meat into EU-28 (1000 EUR)
Switzerland Serbia Chile Norway Thailand Other origins

DG AGRI C3 11 December 2014
0
1.500
3.000
4.500
6.000
|Jan07
2007 |Jan08
2008 |Jan09
2009 |Jan10
2010 |Jan11
2011 |Jan12
2012 |Jan13
2013 |Jan14
2014
in Tonnes (product weight)
Imports of selected PIG products
FRESH FROZEN FAT OTHERS
DG AGRI C3 11 December 2014
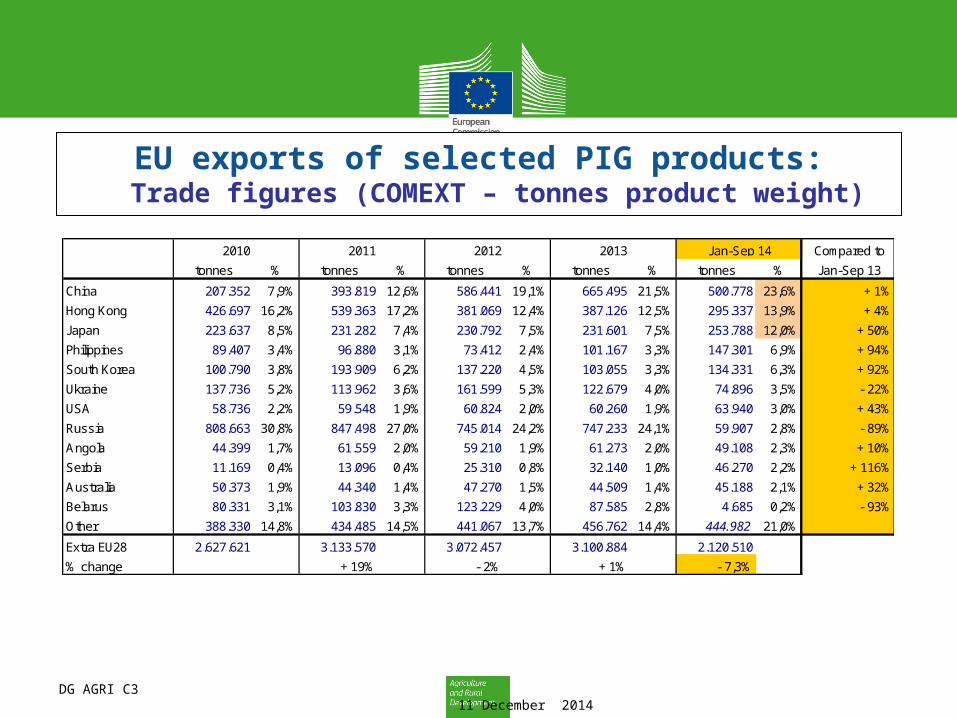
EU exports of selected PIG products:Trade figures (COMEXT – tonnes product weight)
Compared to
tonnes % tonnes % tonnes % tonnes % tonnes % Jan-Sep 13
China 207.352 7,9% 393.819 12,6% 586.441 19,1% 665.495 21,5% 500.778 23,6% + 1%
Hong Kong 426.697 16,2% 539.363 17,2% 381.069 12,4% 387.126 12,5% 295.337 13,9% + 4%
Japan 223.637 8,5% 231.282 7,4% 230.792 7,5% 231.601 7,5% 253.788 12,0% + 50%
Philippines 89.407 3,4% 96.880 3,1% 73.412 2,4% 101.167 3,3% 147.301 6,9% + 94%
South Korea 100.790 3,8% 193.909 6,2% 137.220 4,5% 103.055 3,3% 134.331 6,3% + 92%
Ukraine 137.736 5,2% 113.962 3,6% 161.599 5,3% 122.679 4,0% 74.896 3,5% - 22%
USA 58.736 2,2% 59.548 1,9% 60.824 2,0% 60.260 1,9% 63.940 3,0% + 43%
Russia 808.663 30,8% 847.498 27,0% 745.014 24,2% 747.233 24,1% 59.907 2,8% - 89%
Angola 44.399 1,7% 61.559 2,0% 59.210 1,9% 61.273 2,0% 49.108 2,3% + 10%
Serbia 11.169 0,4% 13.096 0,4% 25.310 0,8% 32.140 1,0% 46.270 2,2% + 116%
Australia 50.373 1,9% 44.340 1,4% 47.270 1,5% 44.509 1,4% 45.188 2,1% + 32%
Belarus 80.331 3,1% 103.830 3,3% 123.229 4,0% 87.585 2,8% 4.685 0,2% - 93%
Other 388.330 14,8% 434.485 14,5% 441.067 13,7% 456.762 14,4% 444.982 21,0%
Extra EU28 2.627.621 3.133.570 3.072.457 3.100.884 2.120.510
% change + 19% - 2% + 1% - 7,3%
2010 2011 2012 Jan-Sep 142013

DG AGRI C3 11 December 2014
EU exports of selected PIG productsTrade figures (COMEXT – tonnes product weight)
413.553 496.148 500.778
280.679 283.665 295.337171.990 169.608 253.78855.305
75.764147.301
1.254.979 1.191.216 788.977
2.283.962 2.286.4222.120.510
0
500.000
1.000.000
1.500.000
2.000.000
2.500.000
Jan-Sep 12 Jan-Sep 13 Jan-Sep 14
Tons (pw) .
EU-28 EXPORTS of PIG Meat (Tonnes prod. weight)
China Hong Kong Japan Philippines South Korea Other destinations
535.950 633.760 600.790
384.185 408.135
69.044 91.577153.565
2.570.103 2.537.315 1.678.333
4.490.309 4.454.147
4.051.368
0
500.000
1.000.000
1.500.000
2.000.000
2.500.000
3.000.000
3.500.000
4.000.000
4.500.000
5.000.000
Jan-Sep 12 Jan-Sep 13 Jan-Sep 14
in 1,000 EUR .
EU-28 EXPORTS of PIG Meat (1000 EUR)
China Hong Kong Japan Philippines South Korea Other destinations

DG AGRI C3 11 December 2014
0
50.000
100.000
150.000
200.000
250.000
300.000
350.000
|Jan 07
2007 |Jan 08
2008 |Jan 09
2009 |Jan 10
2010 |Jan 11
2011 |Jan 12
2012 |Jan 13
2013 |Jan 14
2014
in Tonnes (product weight)Exports of selected PIG products
FRESH FROZEN FAT LIVE ANIMALS OTHERS