COMMITMENT - California State Auditor · California State ditor’s Oce 2 March 17 2015 Regarding...
11
Joint Oversight Hearing Joint Legislative Audit Committee Senate and Assembly Health Committees California Department of Health Care Services Weaknesses in Its Medi‑Cal Dental Program Limit Children’s Access to Dental Care (Report 2013‑125, December 2014) Tuesday, March 17, 2015 Room 4202, State Capitol Sacramento, California COMMITMENT INTEGRITY LEADERSHIP
Transcript of COMMITMENT - California State Auditor · California State ditor’s Oce 2 March 17 2015 Regarding...

Joint Oversight HearingJoint Legislative Audit Committee Senate and Assembly Health Committees
California Department of Health Care Services
Weaknesses in Its Medi‑Cal Dental Program Limit Children’s Access to Dental Care
(Report 2013‑125, December 2014)
Tuesday, March 17, 2015Room 4202, State Capitol
Sacramento, California
COMMITMENTINTEGRITY
LEADERSHIP

1California State Auditor’s Office
March 17, 2015
Medi‑Cal Dental Testimony
In December 2014 my office issued an audit report concerning weaknesses in California’s Medi‑Cal dental program limiting access to dental care. For that audit, my office was tasked with understanding how the Medi‑Cal dental program operated by Health Care Services was fulfilling its mandate to ensure that children enrolled in Medi‑Cal received the dental care for which they are eligible.
To address our charge, we examined three components that collectively affect access to dental care:
• Beneficiary utilization
• Provider participation
• Reimbursement rates paid to providers of Medi‑Cal dental services
Regarding beneficiary utilization, we concluded that children’s use of Medi‑Cal dental services was low (pp. 18–22 of audit report).
Utilization is the annual rate at which Medi‑Cal beneficiaries aged 0 through 20 received at least one dental service.
Absent utilization standards from Health Care Services against which to measure California’s rates, we used federal data to compare California’s utilization rates with national averages and the utilization rates for other states using federal data for FFY 2012–13.
California’s rate was 44 percent National average rate: 48 percent California’s rate was the 12th worst for the states included in the data Other states: ranged from a low of 24 percent in Ohio to a high of 63 percent in Texas
Relying on Health Care Services’ data, we calculated California’s utilization rate for dental services by child beneficiaries in 2013 to be about 41 percent.
We also calculated the utilization rates for each of California’s 58 counties. For 2013, the rates ranged from a low of 6.4 percent in Alpine County to a high of 53 percent in Monterey County. (See Figure 2, p. 20; and Table A.1, pp. 61–62 in the audit report.)
To understand the factors that contributed to low utilization rates generally, we reviewed numerous published studies. The studies cited several reasons for low utilization rates, including the relatively small number of dentists participating in Medicaid and the uneven distribution of dentists geographically.

2California State Auditor’s Office
March 17, 2015
Regarding provider participation, we concluded that many California counties may lack a sufficient number of dental providers (pp. 22–30)
We defined provider participation in two ways:
• The number of providers who actually rendered Medi‑Cal dental services in the past year, which we called “active providers.”
• The number of providers who were willing to provide dental services to new Medi‑Cal patients, which we called “willing providers.”
Because Health Care Services had not formally established criteria to measure provider participation, we used a ratio of one dental service provider for every 2,000 child beneficiaries as a benchmark for provider participation. We used this ratio because:
• Health Care Services used this ratio to monitor provider participation during the transition of the Healthy Families Program into Medi‑Cal during 2013.
• State regulations require this ratio for health care service plans.
Using this ratio, we estimated that California as a whole had a sufficient number of active Medi‑Cal dental providers for the five years we examined (2009 through 2013): the ratio never exceeded 1:807, well below the 1:2,000 ratio. (See Table 4, p. 24 in the audit report.)
Because beneficiaries and providers are not uniformly distributed throughout the state, we calculated ratios for California’s 58 counties.
Regarding counties, Health Care Services’ data showed that five counties may not have any “active” Medi‑Cal dental providers for child beneficiaries in 2013: Alpine, Amador, Inyo, Sierra, and Trinity. These five counties had about 2,000 Medi‑Cal child beneficiaries who received dental services in 2013. (See Figure 3, attached to this presentation, and Table A.5, pp. 65–66 in the audit report for the details.)
We say “may” because we found some weaknesses in the department’s provider data that may cause an undercount of providers.
Concerning “willing” providers, the department’s data showed that 27 of the State’s 58 counties either did not have any dental providers or may not have had enough dental providers willing to accept new Medi‑Cal patients. The department’s data showed that these 27 counties had about 468,000 Medi‑Cal child beneficiaries who did not receive dental services in 2013. (See Figure 4, attached to this presentation, and Table A.6, p. 67 in the audit report for the details.)
• No willing providers (11 counties): Alpine, Amador, Calaveras, Del Norte, Inyo, Mariposa, Mono, Nevada, Sierra, Tehama, and Yuba.
• Not enough willing providers (16 counties) (ratio exceeded 1:2,000): Butte, Colusa, El Dorado, Glenn, Humboldt, Kings, Lake, Mendocino, Merced, Sacramento, San Luis Obispo, Shasta, Sonoma, Stanislaus, Tuolumne, and Yolo.
Looking again to published studies, they identified several reasons for providers not participating in Medicaid. One reason we examined was low reimbursement rates.

3California State Auditor’s Office
March 17, 2015
Regarding reimbursement rates, we concluded that California’s rates for Medi‑Cal dental are low (pp. 30–34)
We compared California’s reimbursement rates for its fee‑for‑service dental to national and regional averages, and to the rates for other states. When looking at the top 10 dental procedures most frequently authorized for payment, the averages we calculated were: (See Table 5, attached to this presentation)
California: $22
National (from the American Dental Association): $62
Regional (Pacific Region: AK, CA, HI, OR, and WA): $70
Connecticut: $53
Texas: $35
Washington (children through age 5): $45
Washington (overall): $28
We chose CT, TX, and WA because their utilization rates were among the top five mentioned in a June 2013 study we examined.
Officials from these three states believed their reimbursement rates were one of the factors leading to their states’ higher utilization rates.
• Further, Connecticut told us that its reimbursement rates had last been updated in 2008 in accordance with a 2008 class action settlement.
• Texas stated that it increased its reimbursement rates for selected commonly used dental procedures in 2008 as a result of a lawsuit. A corrective action order from a federal court directed Texas to increase its reimbursement rates for dental providers in the 2008–09 biennium to 50 percent above the state fiscal year 2006–07 reimbursement rate levels.
California’s reimbursement rates for dental services were last increased in fiscal year 2000–01. Further, California reduced reimbursement payments for dental services by 10 percent for most providers effective September 2013, essentially the same thing as a 10 percent cut in reimbursement rates.
• Because of difficult economic times, California’s governor and Legislature passed Assembly Bill 97 (2011) to require Health Care Services to reduce by 10 percent its payments for many Med‑Cal fee‑for‑service benefits, including dental services.
• In October 2011, the U.S. Department of Health and Human Services approved California’s proposed state plan amendment to reduce certain reimbursements, including dental services, by 10 percent.
• Several parties challenged the reimbursement reductions in court, claiming that Health Care Services’ reductions did not comply with federal law
– Although the plaintiffs won in a district court, the U.S. Ninth Circuit overturned the decision in May 2013.
4California State Auditor’s Office
March 17, 2015
– The court did NOT decide whether California’s specific reimbursement rates were reasonable; rather, it concluded that the U.S. Department of Health and Human Services’ review and approval of Health Care Services’ state plan amendment implementing the reimbursement reduction was reasonable.
– The U.S. Supreme Court declined to hear the appeal.
• Health Care Services implemented the 10 percent reduction in September 2013.
We also examined Health Care Services’ compliance with a state law to annually assess reimbursement rate adequacy and found it was not doing so (pp. 40–42)
State law requires Health Care Services to conduct annual reimbursement rate reviews for dental services under Medi‑Cal and to periodically revise the rates. The purpose of the review is to ensure that Medi‑Cal beneficiaries have reasonable access to dental services.
Health Care Services performed this annual review only twice since fiscal year 2000–01. In its December 2011 review, it pointed out that California paid an average of 31.5 percent of the statewide average commercial usual, customary, and reasonable rates; that beneficiary utilization was increasing slightly; and that provider participation was decreasing slightly. However, it did not comment on the adequacy of the reimbursement levels nor connect the facts it mentioned to its reimbursement rates.
In its February 2013 review, it pointed out that California paid an average of 31.3 percent of the statewide average commercial usual, customary, and reasonable rates; and that the reimbursement rates were adequate based on increased utilization rates, and increases in the number of children receiving services.
The acting division chief stated that:
• The department did not perform the reviews before 2011 because of the State’s fiscal climate and its own workload.
• Until 2011, he was unaware of this provision of law.
• Health Care Services performed the 2011 and 2013 reviews only at the request of the department’s legal counsel.
• Health Care Services has not finalized a plan to perform these reviews in the future.
Health Care Services has not complied with its plan for monitoring Medi‑Cal child beneficiaries’ access to dental services (pp. 42–44)
As part of its state plan amendment—which it submitted to CMS for approval—to reduce payments by 10 percent, Health Care Services also submitted a monitoring plan in which it told CMS it would monitor predetermined metrics on a quarterly or annual basis to ensure that beneficiary access is comparable to services available to the general population in the same geographic area.
5California State Auditor’s Office
March 17, 2015
The monitoring plan included three measures related to dental services:
1. The difference in the number of child beneficiaries from one quarter to the next.
2. The number of child beneficiaries divided by the number of active dental providers.
3. The number of child beneficiaries who had at least one dental visit in the past 12 months divided by the total number of child beneficiaries.
As of October 2014, Health Care Services still had not issued its first monitoring report.
Health Care Services did not have a specific release date for its report.
Health Care Services Authorized Reimbursements for Providers Who Purportedly Rendered Services to Deceased Beneficiaries
Health Care Services inappropriately authorized reimbursements to providers for services rendered to child beneficiaries using Social Security numbers belonging to deceased individuals.
• We determined that Health Care Services and its fiscal intermediaries authorized reimbursements to providers for services rendered to 153 beneficiaries who, according to U.S. Social Security Administration (Social Security) records, were deceased at the time the services purportedly occurred.
• Our analysis of Health Care Services’ data indicates that these reimbursements totaled more than $70,000 for dental procedures that were purportedly provided to deceased beneficiaries between 2009 and 2013.
We identified a similar concern in an earlier report related to the Drug Medi‑Cal Treatment Program issued in August 2014. (California Department of Health Care Services: Its Failure to Properly Administer the Drug Medi‑Cal Treatment Program Created Opportunities for Fraud, Report 2013‑119)
• We reported that Health Care Services and another department authorized payments totaling more than $10,300 for 323 services purportedly provided to 19 deceased beneficiaries under the Drug Medi‑Cal Treatment Program.
• The fact that we found this problem in a second Medi‑Cal program supports a conclusion that this issue “could have even greater implications related to Health Care Services’ other Medi‑Cal programs that also rely on this system’s data.”
Health Care Services indicated that it relies on information it receives from California Vital Statistics and Social Security to update its beneficiary eligibility system with available death records and that it uses this system to verify the eligibility of beneficiaries before reimbursing providers for services they rendered to those beneficiaries.
• However, we found instances indicating that Health Care Services had not updated the beneficiary eligibility system with death information.
• For example, our analysis found that Health Care Services and its fiscal intermediaries authorized reimbursements for a total of $3,569 for services purportedly rendered to a beneficiary between February 2009 and April 2011. However, Health Care Services’ data were not updated to reflect that this beneficiary had died in March 2004.
6California State Auditor’s Office
March 17, 2015
• After researching 15 of these 153 beneficiaries’ Social Security numbers, Health Care Services indicated that these Social Security numbers had been entered incorrectly into its beneficiary eligibility system.
• However, the fact remains that although Health Care Services believes it is obtaining sufficient death information from sources other than Social Security’s Death Master File, these other sources are not sufficient.
• Until we brought this issue to its attention, Health Care Services was not aware that it had authorized payments for services purportedly rendered to deceased beneficiaries.
• Until it develops robust procedures for using available death information to update promptly all records in its beneficiary eligibility system, Health Care Services and others that use the system risk reimbursing providers for services they did not render.
Status of Recommendations
In total, we made 24 recommendations to Health Care Services for these and other issues described in the report.
• Half of our recommendations related to acquiring or correcting data, identifying and implementing performance measures and benchmarks, and then taking action based on the results of those measures (Recommendations #1–4, 6, 7, 9, 10, 19–22).
• Eight other recommendations related Health Care Services and its contract with its fiscal intermediary Delta Dental (Recommendations #11–18).
Also, our practice is to ask auditees to respond to us at various points after we issue our audit reports on the status of their implementation of our recommendations. Health Care Services provided its 60‑day response to us in mid‑February 2015. Of the 24 recommendations in our report, Health Care Services indicated:
• It was still implementing 22 recommendations:
– 15 should be implemented by July 2015, seven months after our report
– 2 should be implemented by July 2016 (Recommendations #19 and #23)
– 5 show no implementation date and are listed as either “pending” or “ongoing”
• It had fully implemented one recommendation (#18).
• It was not going to implement one recommendation (#20).
Regarding the recommendation that Health Care Services stated it will not implement:
We recommended that it should establish the provider‑to‑beneficiary ratio statewide and by county as performance measures designed to evaluate access and availability of dental services and include this measure in its October 2015 report. Health Care Services stated that the measure is not part of the reporting required by Section 14132.915 of the California Welfare and Institutions Code. Although this section does not specifically mention the ratio as a measure to report, the section does require Health Care Services to establish a list of measures and that this list include but not be limited to certain performance measures.
7California State Auditor’s Office
March 17, 2015
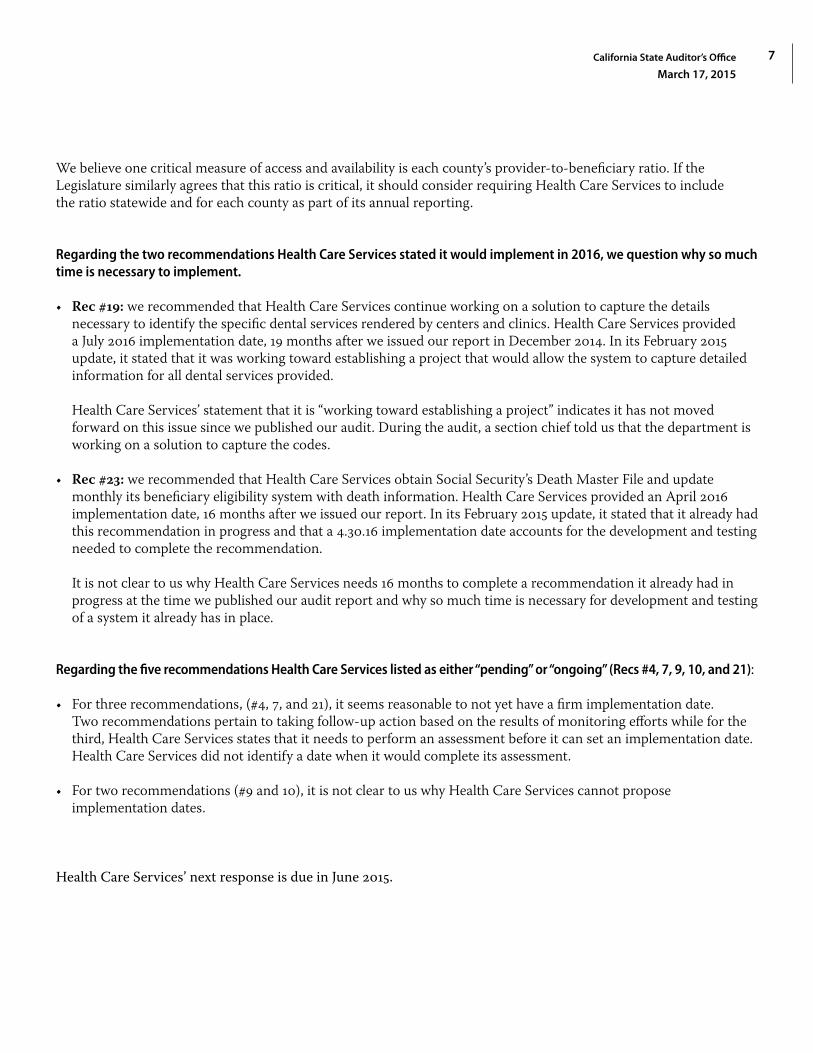
We believe one critical measure of access and availability is each county’s provider‑to‑beneficiary ratio. If the Legislature similarly agrees that this ratio is critical, it should consider requiring Health Care Services to include the ratio statewide and for each county as part of its annual reporting.
Regarding the two recommendations Health Care Services stated it would implement in 2016, we question why so much time is necessary to implement.
• Rec #19: we recommended that Health Care Services continue working on a solution to capture the details necessary to identify the specific dental services rendered by centers and clinics. Health Care Services provided a July 2016 implementation date, 19 months after we issued our report in December 2014. In its February 2015 update, it stated that it was working toward establishing a project that would allow the system to capture detailed information for all dental services provided.
Health Care Services’ statement that it is “working toward establishing a project” indicates it has not moved forward on this issue since we published our audit. During the audit, a section chief told us that the department is working on a solution to capture the codes.
• Rec #23: we recommended that Health Care Services obtain Social Security’s Death Master File and update monthly its beneficiary eligibility system with death information. Health Care Services provided an April 2016 implementation date, 16 months after we issued our report. In its February 2015 update, it stated that it already had this recommendation in progress and that a 4.30.16 implementation date accounts for the development and testing needed to complete the recommendation.
It is not clear to us why Health Care Services needs 16 months to complete a recommendation it already had in progress at the time we published our audit report and why so much time is necessary for development and testing of a system it already has in place.
Regarding the five recommendations Health Care Services listed as either “pending” or “ongoing” (Recs #4, 7, 9, 10, and 21):
• For three recommendations, (#4, 7, and 21), it seems reasonable to not yet have a firm implementation date. Two recommendations pertain to taking follow‑up action based on the results of monitoring efforts while for the third, Health Care Services states that it needs to perform an assessment before it can set an implementation date. Health Care Services did not identify a date when it would complete its assessment.
• For two recommendations (#9 and 10), it is not clear to us why Health Care Services cannot propose implementation dates.
Health Care Services’ next response is due in June 2015.

8California State Auditor’s Office
March 17, 2015
Figure 3California Counties That Lacked Dental Providers for Child Beneficiaries in the Medi‑Cal Dental Program in 2013
Counties with no active Medi-Cal dental providers in 2013
Sacramento
Counties with active Medi-Cal dental providers in 2013
*
Sources: California State Auditor’s analyses of data from systems administered by the California Department of Health Care Services, including the California Dental Medicaid Management Information System, the California Medicaid Management Information System, and the Fiscal Intermediary Access to Medi‑Cal Eligibility system.
Note: Child beneficiaries are Medi‑Cal enrollees under age 21. To be counted as an active dental provider, the provider must have rendered at least one dental procedure to a child beneficiary in the Medi‑Cal Dental Program in 2013. As discussed in the Scope and Methodology, because of a data limitation, we may be undercounting the number of providers who rendered dental services.
* The Dental Board of California’s Web site shows no licensed dentists located in Alpine County.

9California State Auditor’s Office
March 17, 2015
Figure 4California Counties That Lacked Providers or Lacked Sufficient Providers Willing to Accept New Medi‑Cal Dental Child Beneficiaries in 2013
Counties with no dental providers willingto accept new Medi-Cal child beneficiaries
Counties with willing providers but with aprovider-to-beneficiary ratio above 1:2,000*
Sacramento
†
Sources: California State Auditor’s analyses of data from systems administered by the California Department of Health Care Services, including the California Dental Medicaid Management Information System, the California Medicaid Management Information System, and the Fiscal Intermediary Access to Medi‑Cal Eligibility system.
* Because all child beneficiaries not having dental procedures in 2013 are not likely to seek services in the future, we applied a 65 percent utilization rate to estimate the number of child beneficiaries who could seek services from providers willing to accept new patients. The 65 percent utilization rate is based on data reported to the U.S. Department of Health and Human Services by 49 states and the District of Columbia for federal fiscal year 2013.
† The Dental Board of California’s Web site shows no licensed dentists located in Alpine County.

10California State Auditor’s Office
March 17, 2015Ta
ble
5Co
mpa
riso
n of
Rei
mbu
rsem
ent R
ates
in th
e Fe
e‑fo
r‑Se
rvic
e D
eliv
ery
Syst
ems
of th
e M
edi‑C
al D
enta
l Pro
gram
and
Oth
er S
tate
s’ M
edic
aid
Prog
ram
s
GEN
ERA
L PR
ACT
ITIO
NER
S’
REI
MB
UR
SEM
ENTS
(201
1)ST
ATE
MED
ICA
ID P
RO
GR
AM
S’ R
EIM
BU
RSE
MEN
TS
DEN
TAL
PRO
CED
UR
E CO
DE*
NA
ME
OF
DEN
TAL
PRO
CED
UR
E*N
ATIO
NA
L AV
ERA
GE†
PACI
FIC
DIV
ISIO
N
OF
THE
U.S
. CEN
SUS
BU
REA
U A
VER
AG
E†
CALI
FOR
NIA
’S
MA
XIM
UM
A
LLO
WA
NCE
(IN
EFF
ECT
UN
TIL
SEPT
EMB
ER 5
, 201
3)‡
CALI
FOR
NIA
’S M
AXI
MU
M
ALL
OW
AN
CE, I
NCL
UD
ING
PR
OV
IDER
PAY
MEN
T R
EDU
CTIO
NS
(EFF
ECTI
VE
SEPT
EMB
ER 5
, 201
3)
TEXA
S
(IN
EFF
ECT
UN
TIL
FEB
RUA
RY 2
9, 2
012)
§
CON
NEC
TICU
T
(EFF
ECTI
VE
APR
IL 1
, 200
8)
WA
SHIN
GTO
N‑
THR
OU
GH
AG
E 5
(IN
EFF
ECT
SIN
CE 2
007)
II
WA
SHIN
GTO
N
(IN
EFF
ECT
SIN
CE 2
007)
D01
20Pe
riodi
c or
al e
valu
atio
n–es
tabl
ishe
d pa
tient
$44
.10
$52
.03
$15
.00
$13
.50
$28
.85
$35
.00
$29
.46
$21
.73
D01
50Pe
riodi
c or
al e
valu
atio
n–ne
w o
r est
ablis
hed
patie
nt 7
0.39
7
9.16
2
5.00
2
2.50
3
5.32
6
5.00
4
0.38
3
3.64
D02
30In
trao
ral–
peria
pica
l eac
h ad
ditio
nal fi
lm 1
9.84
2
0.42
3
.00
2.7
0 1
1.51
1
7.00
N
A 2
.37
D02
72Bi
tew
ings
–tw
o fil
ms
39.
33
47.
23
10.
00
9.0
0 2
3.38
3
2.00
N
A 1
0.29
D03
50O
ral/f
acia
l pho
togr
aphi
c im
ages
42.
20
42.
80
6.0
0 5
.40
18.
38
non
e N
A 4
5.00
D11
20Pr
ophy
laxi
s–ch
ild 6
1.14
7
5.53
3
0.00
2
7.00
3
6.75
4
6.00
N
A 2
2.98
D12
03/D
1208
#To
pica
l app
licat
ion
of fl
uorid
e**
31.
70
36.
07
**
**
14.
70
29.
00
23.
41
13.
25
D13
51Se
alan
t per
toot
h 4
6.67
5
5.80
2
2.00
1
9.80
2
8.24
4
0.00
N
A 2
1.98
D21
40Am
alga
m–o
ne su
rfac
e, p
rimar
y or
per
man
ent
117
.65
132
.30
39.
00
35.
10
64.
41
95.
00
63.
61
49.
97
D21
50Am
alga
m–t
wo
surf
aces
, prim
ary
or p
erm
anen
t 1
46.6
1 1
61.8
2 4
8.00
4
3.20
8
5.71
1
14.0
0 6
9.97
6
1.97
Aver
age
reim
burs
emen
t rat
e fo
r ser
vice
s ren
dere
d to
all
child
ben
efici
arie
s thr
ough
age
20†
$
61.9
6 $
70.3
2 N
A
NA
$
34.7
3
$52
.56
NA
$
28.3
2
Aver
age
reim
burs
emen
t rat
e fo
r ser
vice
s ren
dere
d to
chi
ld b
enefi
ciar
ies f
rom
birt
h to
age
5 N
A
NA
$
21.6
0 $
19.4
4 N
A
NA
$
45.3
7 N
A
Aver
age
reim
burs
emen
t rat
e fo
r ser
vice
s re
nder
ed to
chi
ld b
enefi
ciar
ies a
ge 6
thro
ugh
20
NA
N
A
$20
.60
$18
.54
NA
N
A
NA
N
A
Sour
ces:
Cal
iforn
ia S
tate
Aud
itor’s
ana
lyse
s of d
ata
from
syst
ems a
dmin
iste
red
by th
e Ca
lifor
nia
Dep
artm
ent o
f Hea
lth C
are
Serv
ices
(Hea
lth C
are
Serv
ices
), in
clud
ing
the
Calif
orni
a D
enta
l Med
icai
d M
anag
emen
t In
form
atio
n Sy
stem
, the
Cal
iforn
ia M
edic
aid
Man
agem
ent I
nfor
mat
ion
Syst
em, a
nd th
e Fi
scal
Inte
rmed
iary
Acc
ess t
o M
edi‑C
al E
ligib
ility
syst
em; H
ealth
Car
e Se
rvic
es’ M
edi‑C
al D
enta
l Pro
gram
Pro
vide
r Han
dboo
k,
date
d M
arch
201
4; th
e St
ate
of Te
xas M
edic
aid
Den
tal F
ee S
ched
ule,
dat
ed S
epte
mbe
r 4, 2
011;
the
Stat
e of
Con
nect
icut
Den
tal F
ee S
ched
ule,
dat
ed Ja
nuar
y 1,
201
4; th
e St
ate
of W
ashi
ngto
n H
ealth
Car
e Au
thor
ity
Den
tal P
rogr
am F
ee S
ched
ule,
dat
ed Ja
nuar
y 1,
201
4; a
nd th
e Am
eric
an D
enta
l Ass
ocia
tion’
s (AD
A) 2
011
Surv
ey o
f Den
tal F
ees.
NA
= N
ot a
pplic
able
.
* Th
is ta
ble
show
s the
10
dent
al p
roce
dure
s mos
t fre
quen
tly a
utho
rized
for p
aym
ent i
n 20
12 u
nder
the
Med
i‑Cal
Den
tal P
rogr
am (p
rogr
am).
Thes
e 10
pro
cedu
res c
onst
itute
d 77
per
cent
of a
ll se
rvic
es re
nder
ed
unde
r the
pro
gram
. The
den
tal p
roce
dure
cod
es a
re p
ublis
hed
by th
e AD
A.†
The
aver
age
dent
al p
roce
dure
fees
for t
he N
atio
nal a
nd P
acifi
c D
ivis
ion
of th
e U.
S. C
ensu
s Bur
eau
are
from
the
ADA’
s 201
1 Su
rvey
of D
enta
l Fee
s. Th
e da
ta u
sed
here
wer
e re
port
ed b
y ge
nera
l pra
ctiti
oner
s and
re
pres
ent t
he a
ctua
l fee
am
ount
mos
t oft
en c
harg
ed to
pat
ient
s. Th
e Pa
cific
Div
isio
n in
clud
es A
lask
a, C
alifo
rnia
, Haw
aii,
Ore
gon,
and
Was
hing
ton.
‡ Eff
ectiv
e Se
ptem
ber 5
, 201
3, H
ealth
Car
e Se
rvic
es im
plem
ente
d th
e 10
per
cent
pro
vide
r pay
men
t red
uctio
n fo
r den
tal s
ervi
ces i
n ac
cord
ance
with
Cha
pter
3, S
tatu
tes o
f 201
1 (A
ssem
bly
Bill
97).
Thes
e re
duct
ions
ap
plie
d to
mos
t den
tal s
ervi
ce p
rovi
ders
.§
Effec
tive
Mar
ch 1
, 201
2, th
e St
ate
of Te
xas c
hang
ed it
s den
tal s
ervi
ce d
eliv
ery
mod
el fo
r Med
icai
d‑el
igib
le c
hild
ren
unde
r the
age
of 2
1 fr
om a
fee‑
for‑
serv
ice
mod
el to
a m
anag
ed c
are
mod
el.
II Th
e Ac
cess
to B
aby
and
Child
Den
tistr
y (A
BCD
) pro
gram
incr
ease
s acc
ess t
o de
ntal
serv
ices
for M
edic
aid‑
elig
ible
clie
nts a
ges 5
and
you
nger
. For
exa
mpl
e, d
entis
ts w
ho a
re c
ertifi
ed th
roug
h th
e co
ntin
uing
edu
catio
n pr
ogra
m a
t the
Uni
vers
ity o
f Was
hing
ton
Scho
ol o
f Ped
iatr
ic D
entis
try
or w
ho g
radu
ate
afte
r 200
6 fro
m th
e U
nive
rsity
of W
ashi
ngto
n Sc
hool
of D
entis
try
are
elig
ible
for A
BCD
pro
gram
‑enh
ance
d re
imbu
rsem
ent r
ates
.#
Effec
tive
Janu
ary
1, 2
013,
the
ADA
repl
aced
cod
es D
1203
and
D12
04, t
opic
al a
pplic
atio
n of
fluo
ride
for c
hild
ren
and
adul
ts, r
espe
ctiv
ely,
with
cod
e D
1208
bec
ause
the
proc
edur
es a
re e
ssen
tially
the
sam
e.**
Cal
iforn
ia h
as tw
o re
imbu
rsem
ent r
ates
for t
he to
pica
l app
licat
ion
of fl
uorid
e. T
he ra
te is
$18
for c
hild
ren
from
birt
h to
age
5 a
nd $
8 fo
r chi
ldre
n ag
es 6
thro
ugh
20. W
e pr
esen
t sep
arat
e av
erag
e ra
tes f
or th
e 10
pro
cedu
res b
ased
on
thes
e ag
e ca
tego
ries.